



Abstract
Crop insurance provides farmers with financial support and coverage in the event of extreme natural disasters. Despite more than two decades of disseminating the knowledge in India, crop insurance adoption rates remain low with evidence of dis-adoption. This article assesses farm households’ willingness to insure their crops as well as ability to pay for an insurance product designed to help rural Indian farmers manage flood- and drought-associated risks. The objective of this study is to assess the determinants of farmers’ participation in market-based agricultural insurance living in coastal and rainfed areas prone to risky weather. It is hypothesized that crop insurance would lead to less risk-averse behaviour and more efficient use of farm resources. Using probit model, the study highlights several determinants of willingness to insure and empirically verify the role of risk aversion in insurance purchase decisions. The lottery-choice experiment has been applied by the author for evaluating risk attitudes of sample household. Empirical results suggest that as regards farmers’ risk preferences, risk aversion actually plays an important role even though not directly but in interactive terms with expected losses which, in turn, significantly influencing farmers’ willingness to purchase the insurance product. The study underlines significant influence of insurance history on future crop insurance choice decision. Farmers’ insurance purchase history can help insurance companies, in order to devise effective crop insurance programmes in the future. Similarly, the study also foregrounds the significant role of insured amount in insurance contracts, influencing farmers’ crop insurance purchase decision in both rainfed and irrigated regions. It can therefore help insurance companies to revise the contract items or reform the existing subsidies. Finally, the study goes on to recommend the importance of the knowledge of informal risk management strategies followed by farmers before offering them the formal insurance product and the necessity of the insurance companies in understanding the farmers’ behaviour while designing the insurance product.
Introduction and Background of the Study
It goes without saying that climate change has already affected the water resources, and in this process, it has posed a severe threat to agricultural productivity worldwide. It affects crop production in many ways like extending crop maturing period, irregular and erratic rainfall, etc. Agricultural production is highly susceptible to the distributional vagaries of weather like climate change and inherent biological uncertainties in managing crops. Schultz (1953) while emphasizing the role of nature in crop production states that, ‘…in this large area the hand of nature lifts and depresses yields despite all the efforts of farmers to counteract its influence’. Problems such as erratic rainfall pattern, rising temperature, recurring climate-induced natural disasters such as flood and drought, high variability of onset dates of monsoon, prolonged dry spells and unseasonal rains are a major source of yield risk and yield uncertainty for millions of farm households in the countryside (Bliss & Stern, 1982; Deshpande, 1985; Rosenzweig & Binswanger, 1993; Vaidyanathan, 1980; Walker & Ryan 1990; World Bank, 2005). On the other hand, significant disease outbreak, severe pest damage, loss of crops during storage, poor soil fertility, lack of knowledge on use of fertilizers, pesticides, etc., often cause losses of great value.
The vulnerability of farmers on account of uninsured downside production risks is due to the following reasons: the traditional risk management strategies, that is, the set of informal risk management mechanisms such as ‘income smoothing’ and ‘consumption smoothing’ mechanisms (Morduch, 1995). Evolved over generations are costly in terms of the higher income opportunities foregone by farmers who are mostly assumed to be ‘risk averse’ (Anderson & Dillon, 1992; Anderson et al., 1977; Binswanger & Sillers, 1984; Antle, 1987; ICRISAT, 1979; Jodha 1981a, 1981b; Newbery & Stiglitz, 1981; Rao, 2008; Rosenzweig & Stark 1989). But these mechanisms might be effective against idiosyncratic shocks and low-magnitude losses and might well be ineffective against covariate shocks such as droughts, prolonged dry spells and disastrous extreme events (Alderman & Paxson 1992; Fafchamps 1992, 1993, 2003; Jacoby & Skoufias, 1998). The farmers who are rational but poor will be averse to risk and will under-invest in modern techniques that are thought to be riskier than the traditional techniques (Roumasset, 1976). To further complicate the risk management issues of rural households, formal insurance markets in rural areas are either inexistent or imperfect (Dercon, 1996; Eswaran & Kotwal, 1990). Though risk cannot be totally eliminated, some risks can be reduced (Miller et al., 2004). There are so many tools and strategies that are employed in agriculture to manage risks, such as enterprise diversification, vertical integration, contract marketing, future hedging, maintaining financial reserves, leveraging liquidity, off-farm employment, seeking other types of off-farm income, etc. (Harwood et al., 1999; Lyu & Barre, 2017; OECD, 2009; Wang et al., 2011). Mayala et al. (2017) highlighted several sociocultural factors influencing investment decisions among smallholder farmers in Tanzania and found that wealth is the most influencing factor. Households in India in general, and Odisha in particular, face several climatic shocks every year such as extreme floods, cyclones and droughts, and these extreme shocks have a significant negative impact on resource-poor farmers’ welfare (Patnaik et al., 2016). In the absence of effective risk management mechanisms to insure the considerable production risks on their portfolio, agricultural households in general, and farmers in particular, are vulnerable to the disastrous consequences of climate change and various man-made disasters. So, in order to reduce both covariate and idiosyncratic risks affecting total loss of farm income, the insurance of crops by farmers is crucial. In theory, besides a farmers’ attitude towards risk, risks themselves have a major impact on the choice of risk management strategies and tools (Harwood et al., 1999).
Besides this, crop insurance has been advocated as a direct way of assisting small-scale farmers confronting production risks (Hazell et al., 1986). Usually, it is hypothesized that crop insurance would lead to less risk-averse behaviour and more efficient use of farm resources (Lyu & Barre, 2017). Literature also shows that farmers with agricultural insurance coverage have incentives to increase loans and invest more in profitable, albeit riskier, crops (Atwood et al., 1996; Cole et al., 2011). Since many agricultural risks are systematic or covariate in nature, a single event can lead to multiple, highly correlated crop losses (Diaz et al., 2006; Kalavakonda & Mahul, 2003). Traditional risk-coping mechanisms cannot deal effectively with the covariability problem because a drought, for instance, could affect an entire region. When this happens, support from relatives is absent, and borrowing for consumption is costly when risk affects most of the area residents, and during such crisis, liquidity assets fetch low prices because many farmers are trying to sell at the same time (Kwadzo et al., 2013). Literature also shows that self-insurance or traditional risk-coping measures are not only a barrier to poverty alleviation but reinforce poverty. Thus, the reliance on traditional risk-coping strategies has the potential to trap poor smallholder farmers in perpetual poverty (Diaz et al., 2006). As a general rule, the larger the potential loss of assets and incomes to a household posed by a given risk and the fewer alternatives there are to recover from such losses, the higher the probability of taking insurance (Brown & Churchill, 1999). Hess (2003) pointed out that crop insurance can play a vital role as an alternative ex ante risk-coping instrument to enable poor farmers in developing economies cope with weather-related production risk. Insurance, therefore, by offering the possibility of shifting risks, enables individuals to engage in risky activities, which they would not undertake otherwise (Ahsan et al., 1982). A very famous statement told by Arrow, ‘I may well hesitate to erect a building out of my own resources if I have to stand the risk of its burning down; but I would build if the building can be insured against fire’ (Arrow, 1971) explains the importance of insurance for the resource-poor farmers engaged in crop production.
Gaps in the Existing Literature, Research Questions and Objectives of the Study
There are studies (Sherrick et al., 2004; Simon & Fiorentino, 2014; Jin et al., 2016; Lyu & Barre, 2017) that highlighted the factors that might influence farmers’ decisions on purchasing agricultural insurance. The standard theoretical model of behaviour under risk assumes that farmers’ risk preferences play an important role in their decisions under uncertainty (Jin et al., 2016; Just et al., 1983; Liu & Huang, 2013; Lusk & Coble, 2005; Lyu & Barre, 2017; Qui et al., 2014). Gaurav (2015) explains the importance of insurance, using primary panel data from five rainfed villages in a high-risk region of India, and finds evidence of considerable exposure as well as vulnerability to idiosyncratic and covariate risks. However, studies that explore the potential impact of farmers’ risk preferences on the decision to purchase crop insurance in India have been few. Because of different climatic, economic, political and institutional conditions, the decision of farmers’ participation on agricultural insurance and their determinants may be different in different countries and regions (Hisali et al., 2011). Therefore, more location- or country-specific empirical studies are needed (Uy et al., 2011). Moreover, the area-based multi-peril yield insurance in India is primarily involuntary in nature. There are several issues with the crop insurance design and implementation that influence perceptions of insurance among farmers. Since February 2016, Pradhan Mantri Fasal Bima Yojana (PMFBY) has been made compulsory for all; however, its implementation has been moving at a snail’s pace. One simple reason here is that multiple agencies are involved, and both state government and central government, and finally insurance companies, have their own responsibilities, in order to address the problem of delayed compensation. Another issue regarding delayed claim settlement is the delay on the part of state governments to release their share of premium subsidy. So, it is imperative to know and understand the real problems faced by farmers in rural areas, regarding multiple issues such as coverage, compensation and claim settlement.
It is in this light that this article has proposed to analyse determinants of farmers’ participation, their willingness to pay and overall awareness about this product, and it also seeks answers to the following research questions:
Are there any incentives for uninsured farmers in the study area to participate in the market-based crop insurance programme? Are they willing to purchase the insurance product? Are they lacking awareness about the insurance product and its possible benefits?
To answer the aforementioned questions, the objective of this study is to assess the determinants of farmers’ participation in market-based agricultural insurance in the study area. It is hypothesized that crop insurance would lead to less risk-averse behaviour and more efficient use of farm resources.
This article is organized in this manner: the first and the second sections include introduction and research gaps, and the statement of the objectives. The third section develops a simple theoretical model. The fourth section deals with study region, data collection and variable construction. The fifth and sixth sections deal with experiment and incentive design. Empirical results and subsequent discussions take place in the seventh section. Finally, the eighth and ninth sections summarize and conclude with some policy implications, limitations and scope for further research.
Theoretical Framework of the Study
It is important to highlight the decision-making process before establishing the theoretical models. A rational farmer in India could make the crop insurance purchase decision with respect to four aspects: disaster frequency estimation; the frequency and severity of floods and droughts linking with past experience are important, in order to predict future disaster occurrence possibility estimation. Second, crop losses estimation, linking disaster history to loss history. Third, income impact evaluation, highlighting the importance of other income smoothing techniques and linking crop losses due to disaster to income variations. Finally, the insurance purchase analysis, highlighting both benefit and cost of insurance purchase. The author has applied the following theoretical framework to understand these four aspects.
The crop insurance participation decision under uncertainty can be formalized using expected utility theory. Following Rothschild and Stiglitz (1976) and Lyu and Barre (2017), this framework may be simplified by considering only two states of nature: a good harvest (yh) and a bad harvest (yl). Assuming that farmers face negative shocks with probability p, the expected utility if the farmer is not insured is:

where U() is the farmer utility function, A refers to the area of land used for production, yl and yh are the yields in case of a shock or in normal years, respectively, w is the market price of an input, x refers to the input and z represents the household characteristics that determine the farmers’ preferences.
If the farmer decides to insure his plot, his expected utility becomes:

where c is the insurance premium he has to pay per land unit, m is the indemnity payment per land unit in case he experiences a negative shock.
Assuming that land (A) is fixed input, the farmer can determine the optimal input use in either case (purchasing insurance or otherwise):

Given these optimal input choices, the farmer can compare his expected utility with and without insurance and decide to purchase or otherwise. The farmer purchases insurance coverage if:

Crop insurance purchasing behaviour can also be studied by deriving his willingness to pay (WTP) for the insurance product. WTP is the maximum amount of money the farmer can pay to purchase the insurance product. It can also be defined as the price c* such that his expected utility is the same irrespective of the decision to purchase:

Given the optimal input demand functions x*|insurance = 0 and x*|insurance = 1 defined above, the expression for the farmers’ WTP is:

Hence, farmers’ WTP for the insurance product depends on the probability of a negative yield shock p, land size A, input prices w, household preferences z and the indemnity payment offered by the insurance company in case of an adverse event m.
The farmer decides to purchase the crop insurance product only if his WTP c* is higher than the actual premium asked by the insurance company. So, the probability that a farmer purchases the insurance product is equal to the probability that his WTP is higher than the price of the insurance product:

Since coefficient of relative risk aversion (CRRA) function assumes a power risk utility function, assume that c* = c* (p, A, w, m; z) can be approximated in the exponential form

where X is the vector of determinants of WTP (p, A, w, z, m), β are unknown parameters and ε is an independently and identically distributed error, following a normal distribution N (0, σ). Then:

where Φ() is the cumulative density function of the normal distribution. The estimation of such a ‘non-zero threshold probit model’ (here, the threshold is the district-specific insurance premium ln(c)) is estimated within a standard probit model in which the parameter attached to the premium is constrained to −1. However, this latent variable presentation of the probit model has one drawback, that is, it can only estimate β up to scale. It sets the variance of the error term to 1 (ε ~ N (0, 1)), so that only β/σ can be estimated, where σ is the true standard deviation of ε.
Sample Design, Data and Methodology
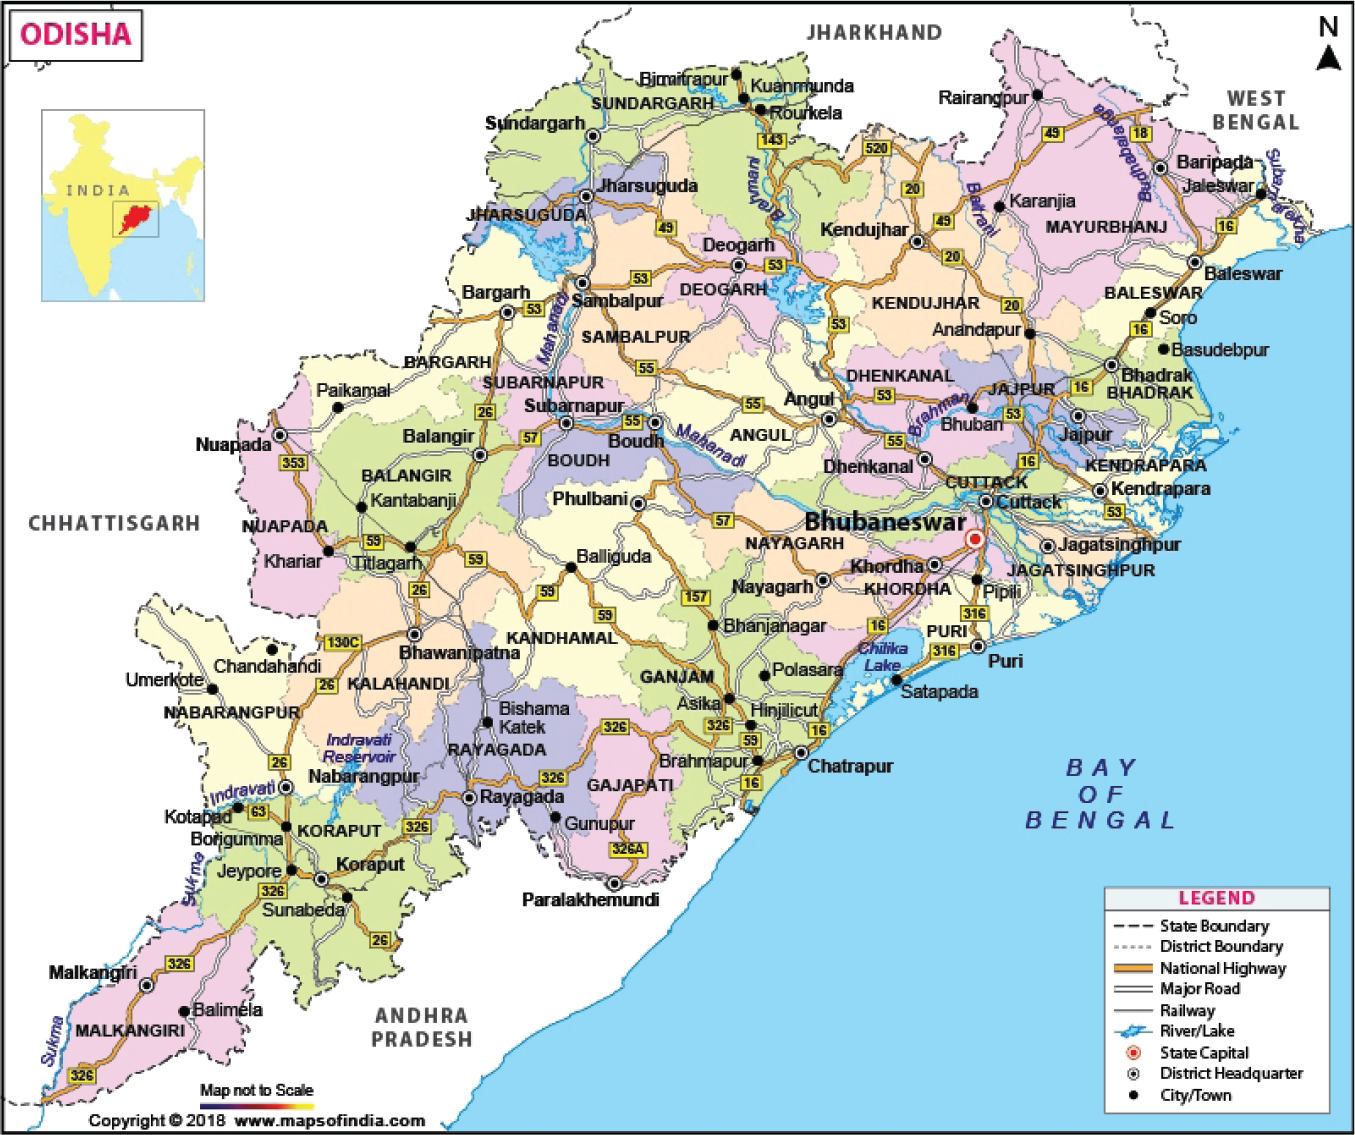
The necessity of conducting a primary survey arises from the very fact that macro-level studies can only explain the current state of affairs in the agricultural sector of Odisha at the aggregate level and its relative position compared to agricultural sector elsewhere in the world. But, in order to have an idea about the specific factors/constraints involved in the agricultural sector of the region like production decisions of farmers in different climatic conditions under the situation of risk and uncertainty, we need to analyse things at a much micro level taking into account individual farmers/households as units of observation. For that, we need to select the respective districts and then study villages. The selection of districts as well as study villages is done on the basis of the objective of the study to have a comparative analysis of production decision in both irrigated and rainfed region of the state. Production loss due to various natural hazards, such as floods, drought and cyclone, and farmers vulnerability to extreme climate change in both the regions, is another rationale behind choosing the two particular districts. For our study, the author has selected two districts—Cuttack and Bolangir. The Cuttack district is an irrigated district, while Bolangir is a rainfed district on the basis of the argument that if one region is having more than 60 per cent of its total cultivable land irrigated by canal or any other sources except rainfall, then it is called as the irrigated region; otherwise, it is called a rainfed region (Chand et al., 2011). In case of Cuttack district, more than 90 per cent of cropped area is irrigated, while, in the case of Bolangir district, it is about 41 per cent.
1
Thus, by this definition, the author has selected two districts belonging to two different ecosystems, and it enables us to study the differential aspects of the aforementioned issues related to agricultural sector of both regions. However, a long process was involved while selecting the study villages, and several underlying principles were prioritized. The step-by-step process involved in the selection of study villages starts with selection of districts, then the block or subdivision, location and finally the villages. The study villages, keeping the objectives strictly in mind, are selected on the basis of following reasons:
In the irrigated region, the study villages are connected with canal irrigation with a two-times cultivation facility. The assured canal irrigation enables the farmers to go for both kharif and rabi cultivation. However, in the rainfed region, they only cultivate after receiving south-west monsoon and cultivate once in a year during the kharif season. The climatic risks that farmers face in both types of agriculture are not the same in their character and magnitude. In the irrigated region of study villages, floods/submergence are a major threat; in the rainfed region, a drought type of situation occurs at any stage of crop growth.
Two districts selected are Cuttack and Bolangir. In both regions, there are three subdivisions. Out of three subdivisions of the Cuttack district, that is, Cuttack, Banki and Athgarh, we have selected one representative subdivision as Cuttack. From that subdivision, three blocks—Cuttack Sadar, Kantapada and Niali—were selected in the next step. Finally, two villages from each block were selected as study villages. Similarly, out of three subdivisions of the Bolangir district, that is, Bolangir, Titilagarh and Patnagarh, we have selected one representative subdivision as Bolangir, and from that subdivision, three blocks—Luisinga, Puintala and Bolangir Sadar—have been chosen, and in the final step, two villages from each block have been selected for primary survey. All the study villages in the irrigated region of Cuttack district are Kalapada, Routrapur, Manikunda, Uradha, Pasanga and Olansa. Kalapada and Routrapur belong to Cuttack Sadar block, where Kalapada is the Gram Panchayat of these two villages. Similarly, Manikunda and Uradha belong to Kantapada block, where Uradha is the Gram Panchayat of these two villages. Finally, Pasanga and Olansa belongs to Niali block, where Alana is the Gram Panchayat of these two villages. All these villages share common environment for crop growth like soil quality and irrigation facilities. On the other hand, all the study villages in the rainfed region of Bolangir district are Magurbeda, Bramhanidungri, Kharjura, Jharbalangir, Hardatal and Khuntpali. Magurbeda and Bramhanidungri belong to Luisinga block, where G. S. Dungripalli is the gram panchayat of these two villages. Similarly, Kharjura and Jharbalangir belong to Puintala block, where Bubel is the gram panchayat of these two villages. Finally, Hardatal and Khuntpali belong to Bolangir block, where Khuntpali is the gram panchayat of these two villages. All these villages of Bolangir district also share the common environment like land quality and other facilities.
Data from 400 households are collected, out of which 200 are from the irrigated region of Cuttack and 200 from rainfed region of Bolangir district. Distance of each village from the main city Bolangir is 15–20 km in case of rainfed region and a maximum of 30 km in case of villages of irrigated region from Cuttack—the major city. The author has collected data for kharif season only since in the rainfed region, the farmers completely depend on monsoon and cultivate only during the kharif season. So, for maintaining uniformity, the author has collected data for one common season.
The experiments were conducted in two districts, viz. Bolangir and Cuttack districts of Odisha from May to August 2016. To select farmers, the author used a multistage sampling, where the sampling units at the final stage were selected at random, based on the sampling lists. In the first step, the author purposively selected the aforementioned two districts. In the second step, the author randomly selected villages. In the third step, he randomly chose farmers at village level. The farmers were then requested to participate in a household survey and an experiment. Participants were mostly either the household head or their spouse because they were the most likely to be faced with risky choices and important economic decisions. Experiments were conducted in two districts of Odisha from May to August 2016. The author has applied the lottery-choice experiment suggested by Holt and Laury (2002) and Modified Holt and Laury method as in Ihli et al. (2013) for evaluating risk attitudes of sample households. Rice production plays a very significant role for these sample regions than those in other regions in Odisha. Therefore, it is imperative to analyse the role of risk aversion in sample farmers’ crop insurance purchase decisions since they are more sensitive to covariate risks like droughts and floods than others.
Based on the above-mentioned theoretical set-up, the probit model helps us to know farmers’ decision to purchase the crop insurance programme as well as to predict the farmers’ WTP for the product and to study the effect of various determinants of WTP on the decision to insure. The theoretical model proposed by Rothschild and Stiglitz (1976) and Lyu and Barre (2017) emphasizes the use of different classes of variables.
First, the crop insurance purchase decision is dependent on the probability p of a negative shock. This unobserved probability is captured by variables such as previous year shock experience and insurance purchases. This consists of dummy variables on the occurrence of a disaster in the past 2 years and thus reflects the farmers’ loss history.
Second important variable included is the amount insured by the insurance company. Given the serial correlation issue in insurance purchase behaviour, that is, a farmer who bought insurance at time t is very likely to purchase insurance at time t + 1, a dummy variable for those farmers who bought insurance the year before the field survey is also introduced.
The third set of variables comprises input prices (wages, seeds and fertilizers).
The fourth set of variables include information related to size of cultivated land dedicated to rice production.
Finally, the last set of variables includes farm household preferences with respect to risk. To test the risk preferences of farmers, a card game experiment was implemented, following Holt and Laury (2002) method. Experimental game results have been used as a proxy of risk preferences as (Figure 1).
Experimental Design and Analysis
Although most of the farmers in the study area rely heavily on agriculture as their source of livelihood, there is very little information on farmers’ willingness to insure their crop, willingness to pay premium amount and the awareness of farmers towards crop insurance.
All selected farmers in two different regions of Odisha participated in the experiment. The farmers were divided into several groups for our experimental sessions. The author has conducted 150 experimental sessions in two different regions for 3 months. Every day, the author has conducted two sessions—one in morning and one session in the afternoon. A group of randomly selected farmers is involved in each session. The session was completed within 1.5 h for each group of farmer. The author has conducted these sessions in village community halls, temples and classrooms, and in local schools in several villages. All the sessions were conducted in Odia, the main language of Odisha. To further facilitate the comprehension, the author has used playing cards with different pay-offs. The experiment was conducted by placing the appropriate cards in two different boxes, and an explanation was provided to the respondents on the various monetary values associated with each card. The respondents then can make their decision by pointing towards the preferred box and drawing a card from that box. During this process, the author recorded their preferred choice .The choice task was simple for the participants to understand because, in Odisha, all are familiar in playing cards. During the presentation, the author also encouraged the respondents to ask any questions regarding the choice task. In order to motivate participants, the author arranged small refreshment facilities after the end of the survey so that they took the tasks more seriously. The author applied Modified Holt and Laury Lottery method for measuring risk attitudes.
Study Participants’ Incentives in Resource-constrained Settings
In order to motivate the farmers, it is essential to ensure some incentives in the form of real earnings so as to induce them for taking the task seriously (Ihli et al., 2013). The author adopted random lottery incentive system by Humphrey and Verschoor (2004) based on which information was provided to the respondents initially before the experiment that once they completed all tasks, one task would be selected at random and their prize money would be decided accordingly. However, it is subject to limitations since only a few respondents are getting paid and not all the respondent because a number was assigned to all the group members. One member would be again selected at random from the group. Therefore, the real prize money was decided on the basis of their preferences across various mutually exclusive cases. The probability remains the same for the entire decision task. The prospective earning varies between ₹1 (US$0.014) and ₹55 (US$0.746) for the Holt and Laury (HL) lottery. The payment in the experiment was conducted as follows: farmers were informed from the very beginning that one of the groups out of the total number of groups would be randomly selected so that they could receive the prize money between ₹1 (US$0.014) and ₹55 (US$0.746) depending on their choice task. One member would win the prize money by drawing cards again from the assigned group numbers. If the respondent selected box A, he/she would have to draw a card out of the box and hence has the probability of winning either ₹25 (US$0.34) or ₹30 (US$0.407) with its individual probability. Similarly, If the respondent selected box B, he/she would have to draw a card out of the box and hence has the probability of winning either ₹1 (US$0.014) or ₹55 (US$0.746) with its individual probability.
Results and Discussion
Holt and Laury (2002) and Ihli et al. (2013) followed the lottery method with safe and risky option and provided ten choices to the decision-maker. In this study, the author adapted both the methods with slight modifications. In the experiment, option A had the probability of winning either ₹30 (US$0.407) or ₹25 (US$0.34) with respective probability, whereas option B had the probability of winning either ₹1 (US$0.014) or ₹55 (US$0.746) with a certain probability.
Pay-off matrix of the Holt and Laury Lottery Method
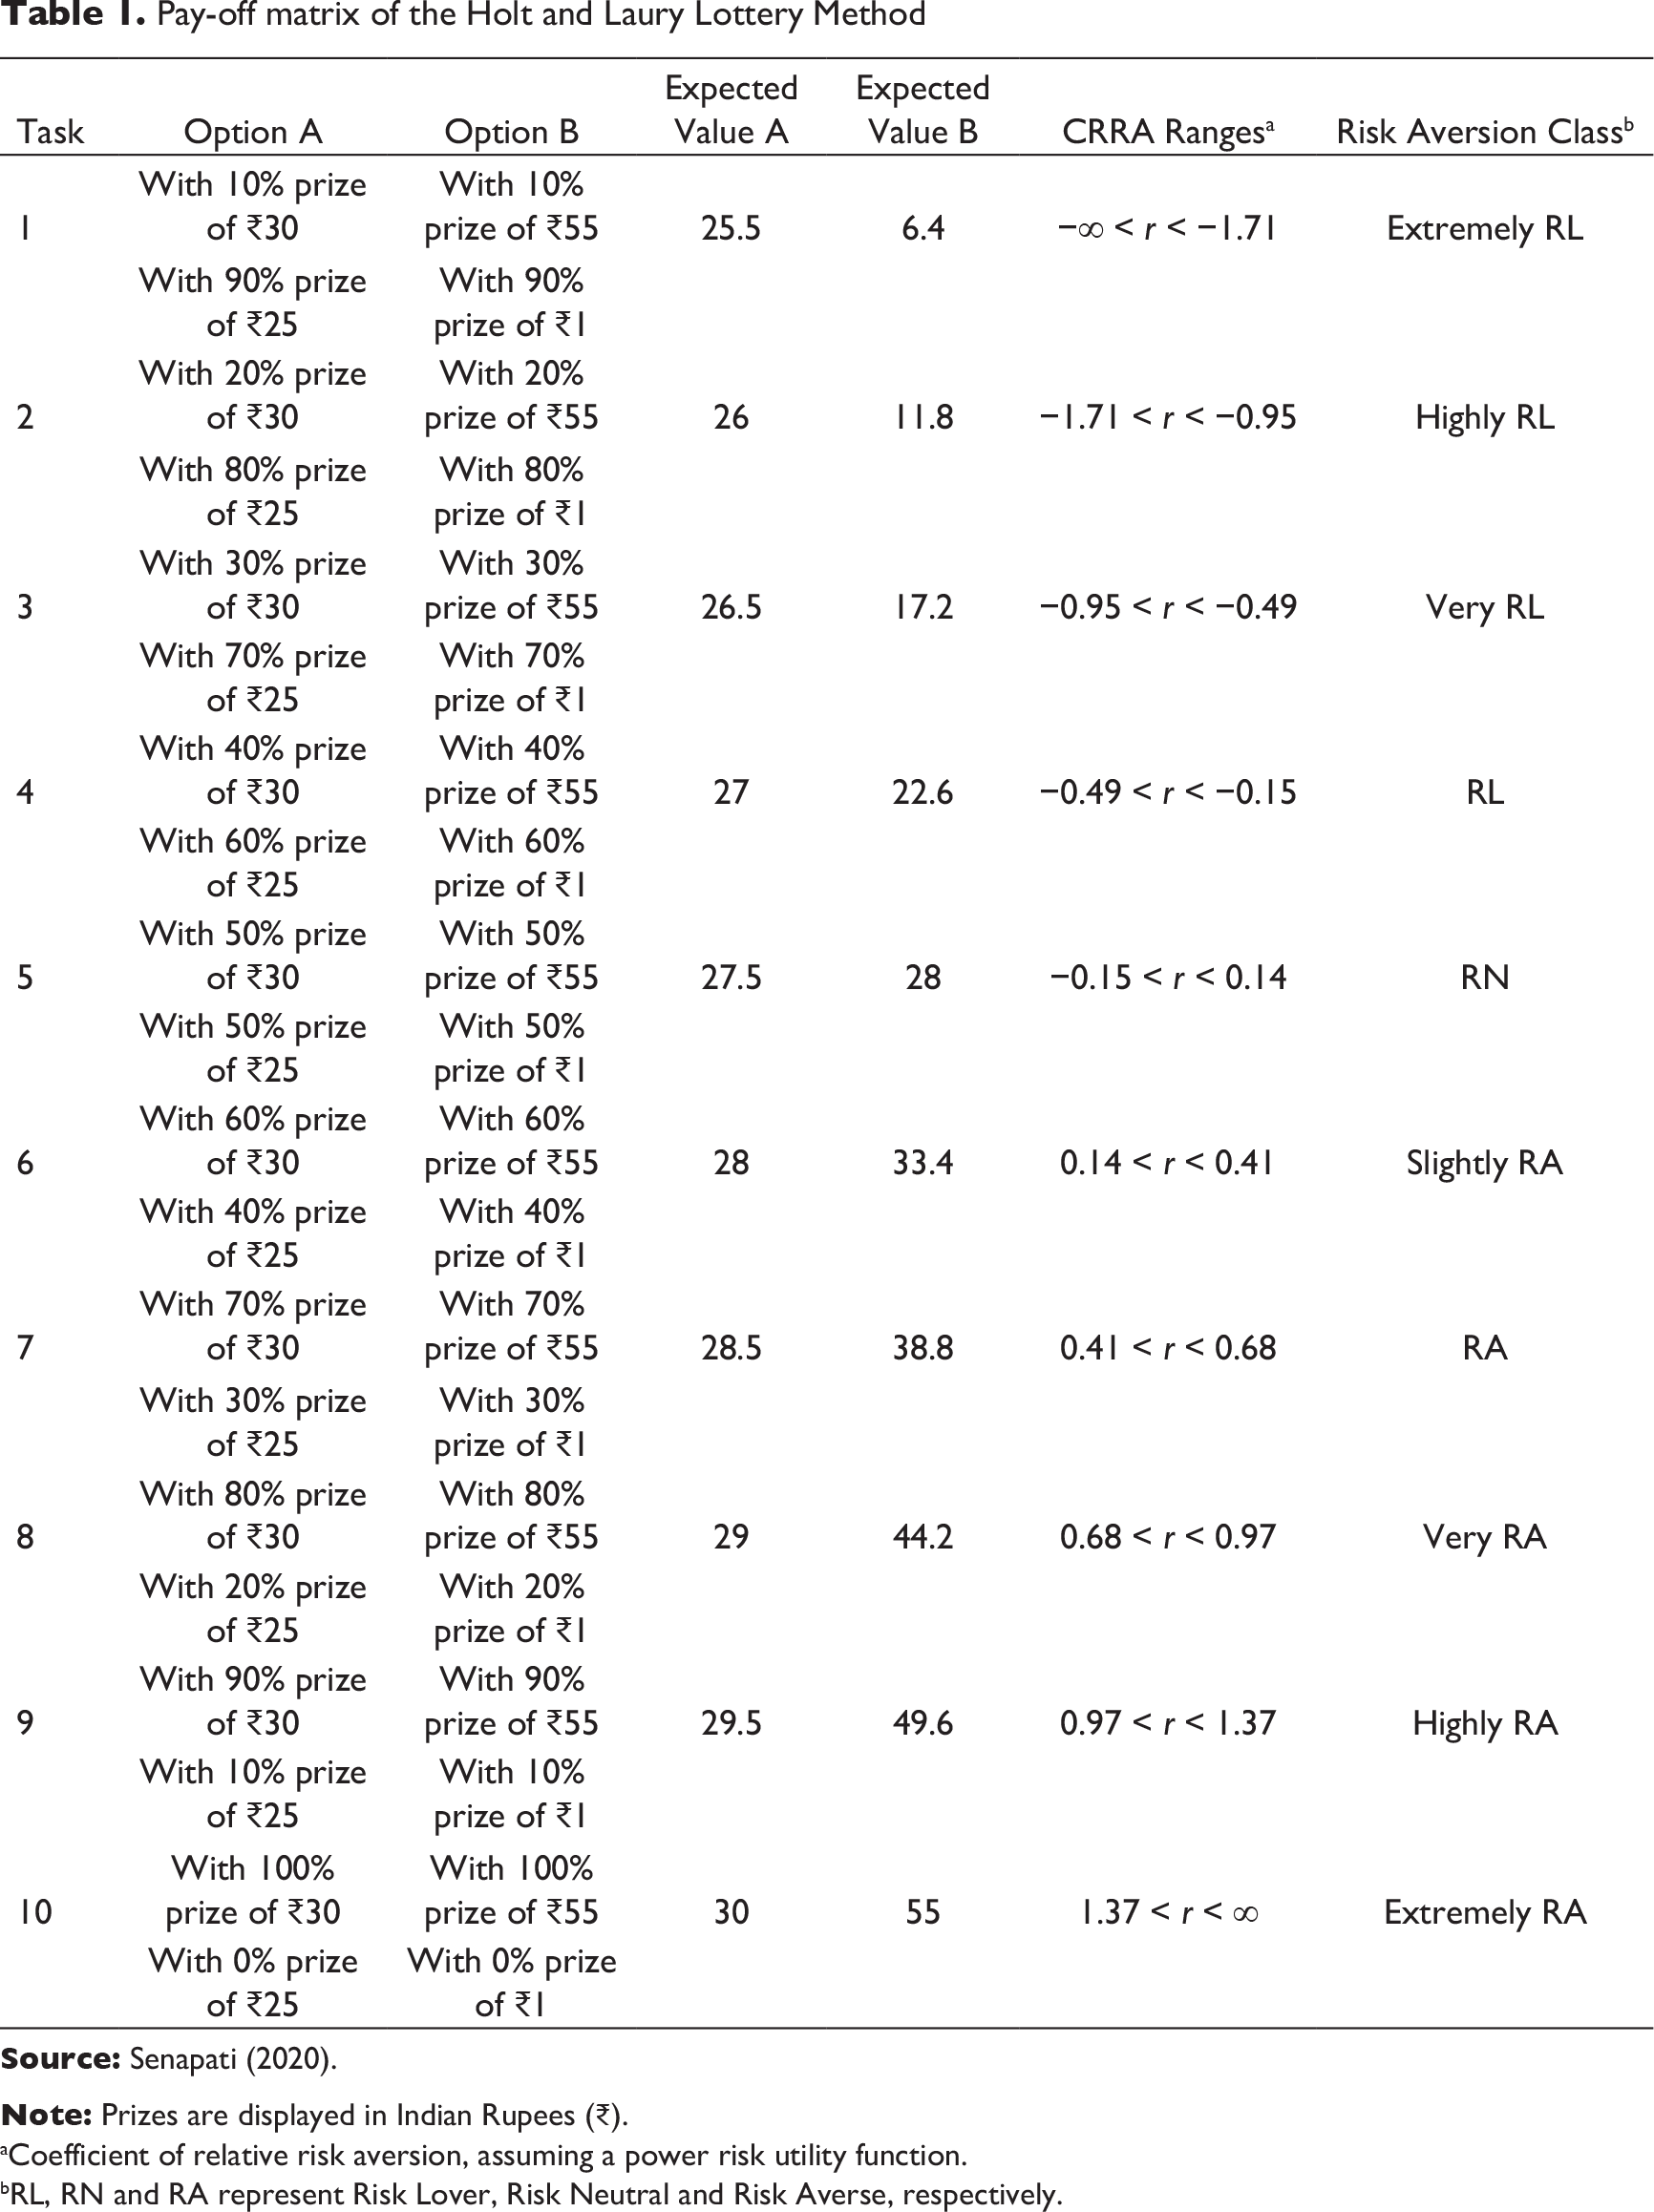
aCoefficient of relative risk aversion, assuming a power risk utility function.
bRL, RN and RA represent Risk Lover, Risk Neutral and Risk Averse, respectively.
Descriptive Information About Variables in Bolangir District
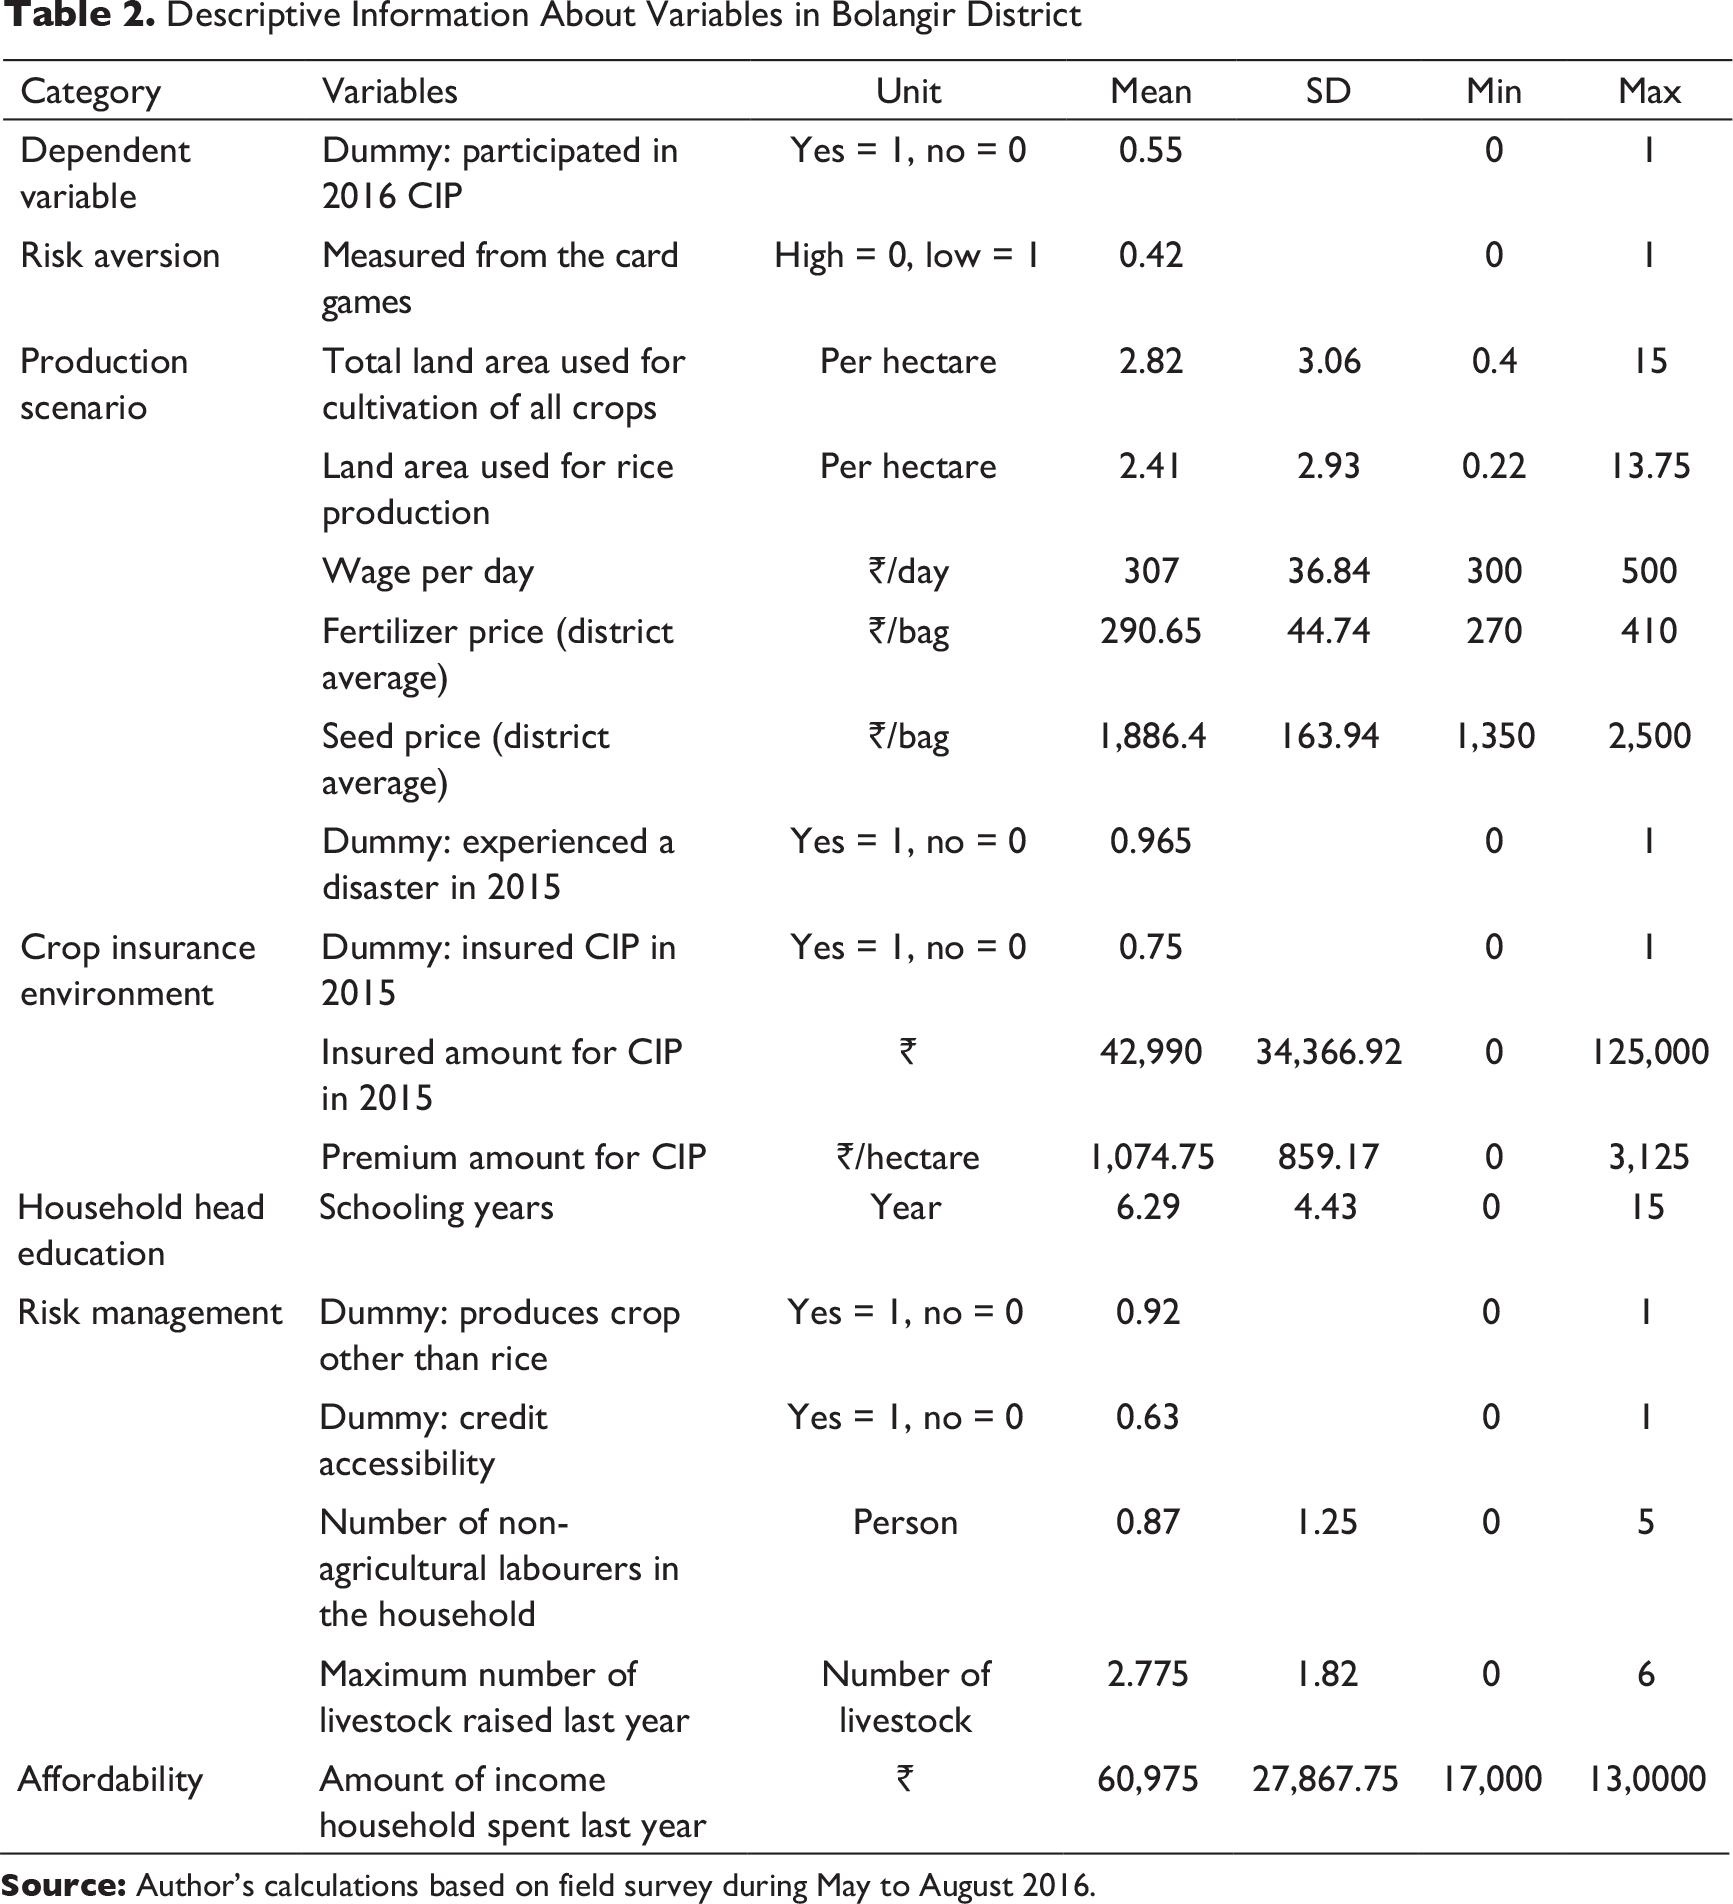
From the above descriptive data shown in table 2 about the sample district, one can observe that the average land used for cultivation is 2.82 ha. Out of this 2.41 ha of land is generally used for rice production, since rice is the most important crop in Bolangir district. Sample households used to get an average wage of ₹307 (US$4.17) per day is calculated as the district average wage rate of labour, which includes both agricultural and non-agricultural activities. The maximum amount is ₹500 (US$6.785) and minimum amount is ₹300 (US$4.071) per day. The average fertilizer price in the sample district is ₹290.65 (US$3.944) per bag. The maximum price is ₹410 (US$5.564) and minimum is ₹270 (US$3.664) per bag. The average seed price in the sample village areas is ₹1,886.4 (US$25.6) per bag. The maximum price is ₹2,500 (US$33.93), and the minimum price is ₹1,350 (US$18.32) per bag. Around 193 farmers out of the total sample experienced a disaster in 2015, and 150 farm households out of 200 samples insured their crop in 2015. But interestingly, only 110 households, 40 less than last year participated in 2016 crop insurance programme. The average insured amount for crop insurance participation in the year 2015 was ₹42,990 (US$583.42). The maximum amount was ₹125,000 (US$1,696.38) and the minimum was zero (for non-insured families). The average premium amount paid for crop insurance participation was ₹1,074.75 (US$14.58)/ ha. The maximum amount was ₹3,125 (US$42.41) and the minimum was zero. Around 84 farmers from the card game experiment were found to be highly risk averse. The household head had obtained more than 6 years of education. Around 182 farm households out of a total of 200 produced crop other than rice. A total of 126 sample respondents had access to credit in their areas. The number of non-agricultural labourers in the households was around one in sample families. The maximum people found in a sample village was five and minimum was zero. The maximum number of livestock rose last year and was found to be around two on average in sample families. The maximum was six and minimum was zero. The average amount of money households spent in 2015 was ₹60,975 (US$827.49). The maximum expenditure incurred was ₹130,000 (US$1,764.24) and minimum expenditure incurred was ₹17,000 (US$230.7).
Crop Insurance Purchase Decisions in Sample Villages of Bolangir District (probit model)

Crop Insurance Purchase Decisions in Sample Villages of Bolangir District (probit model)
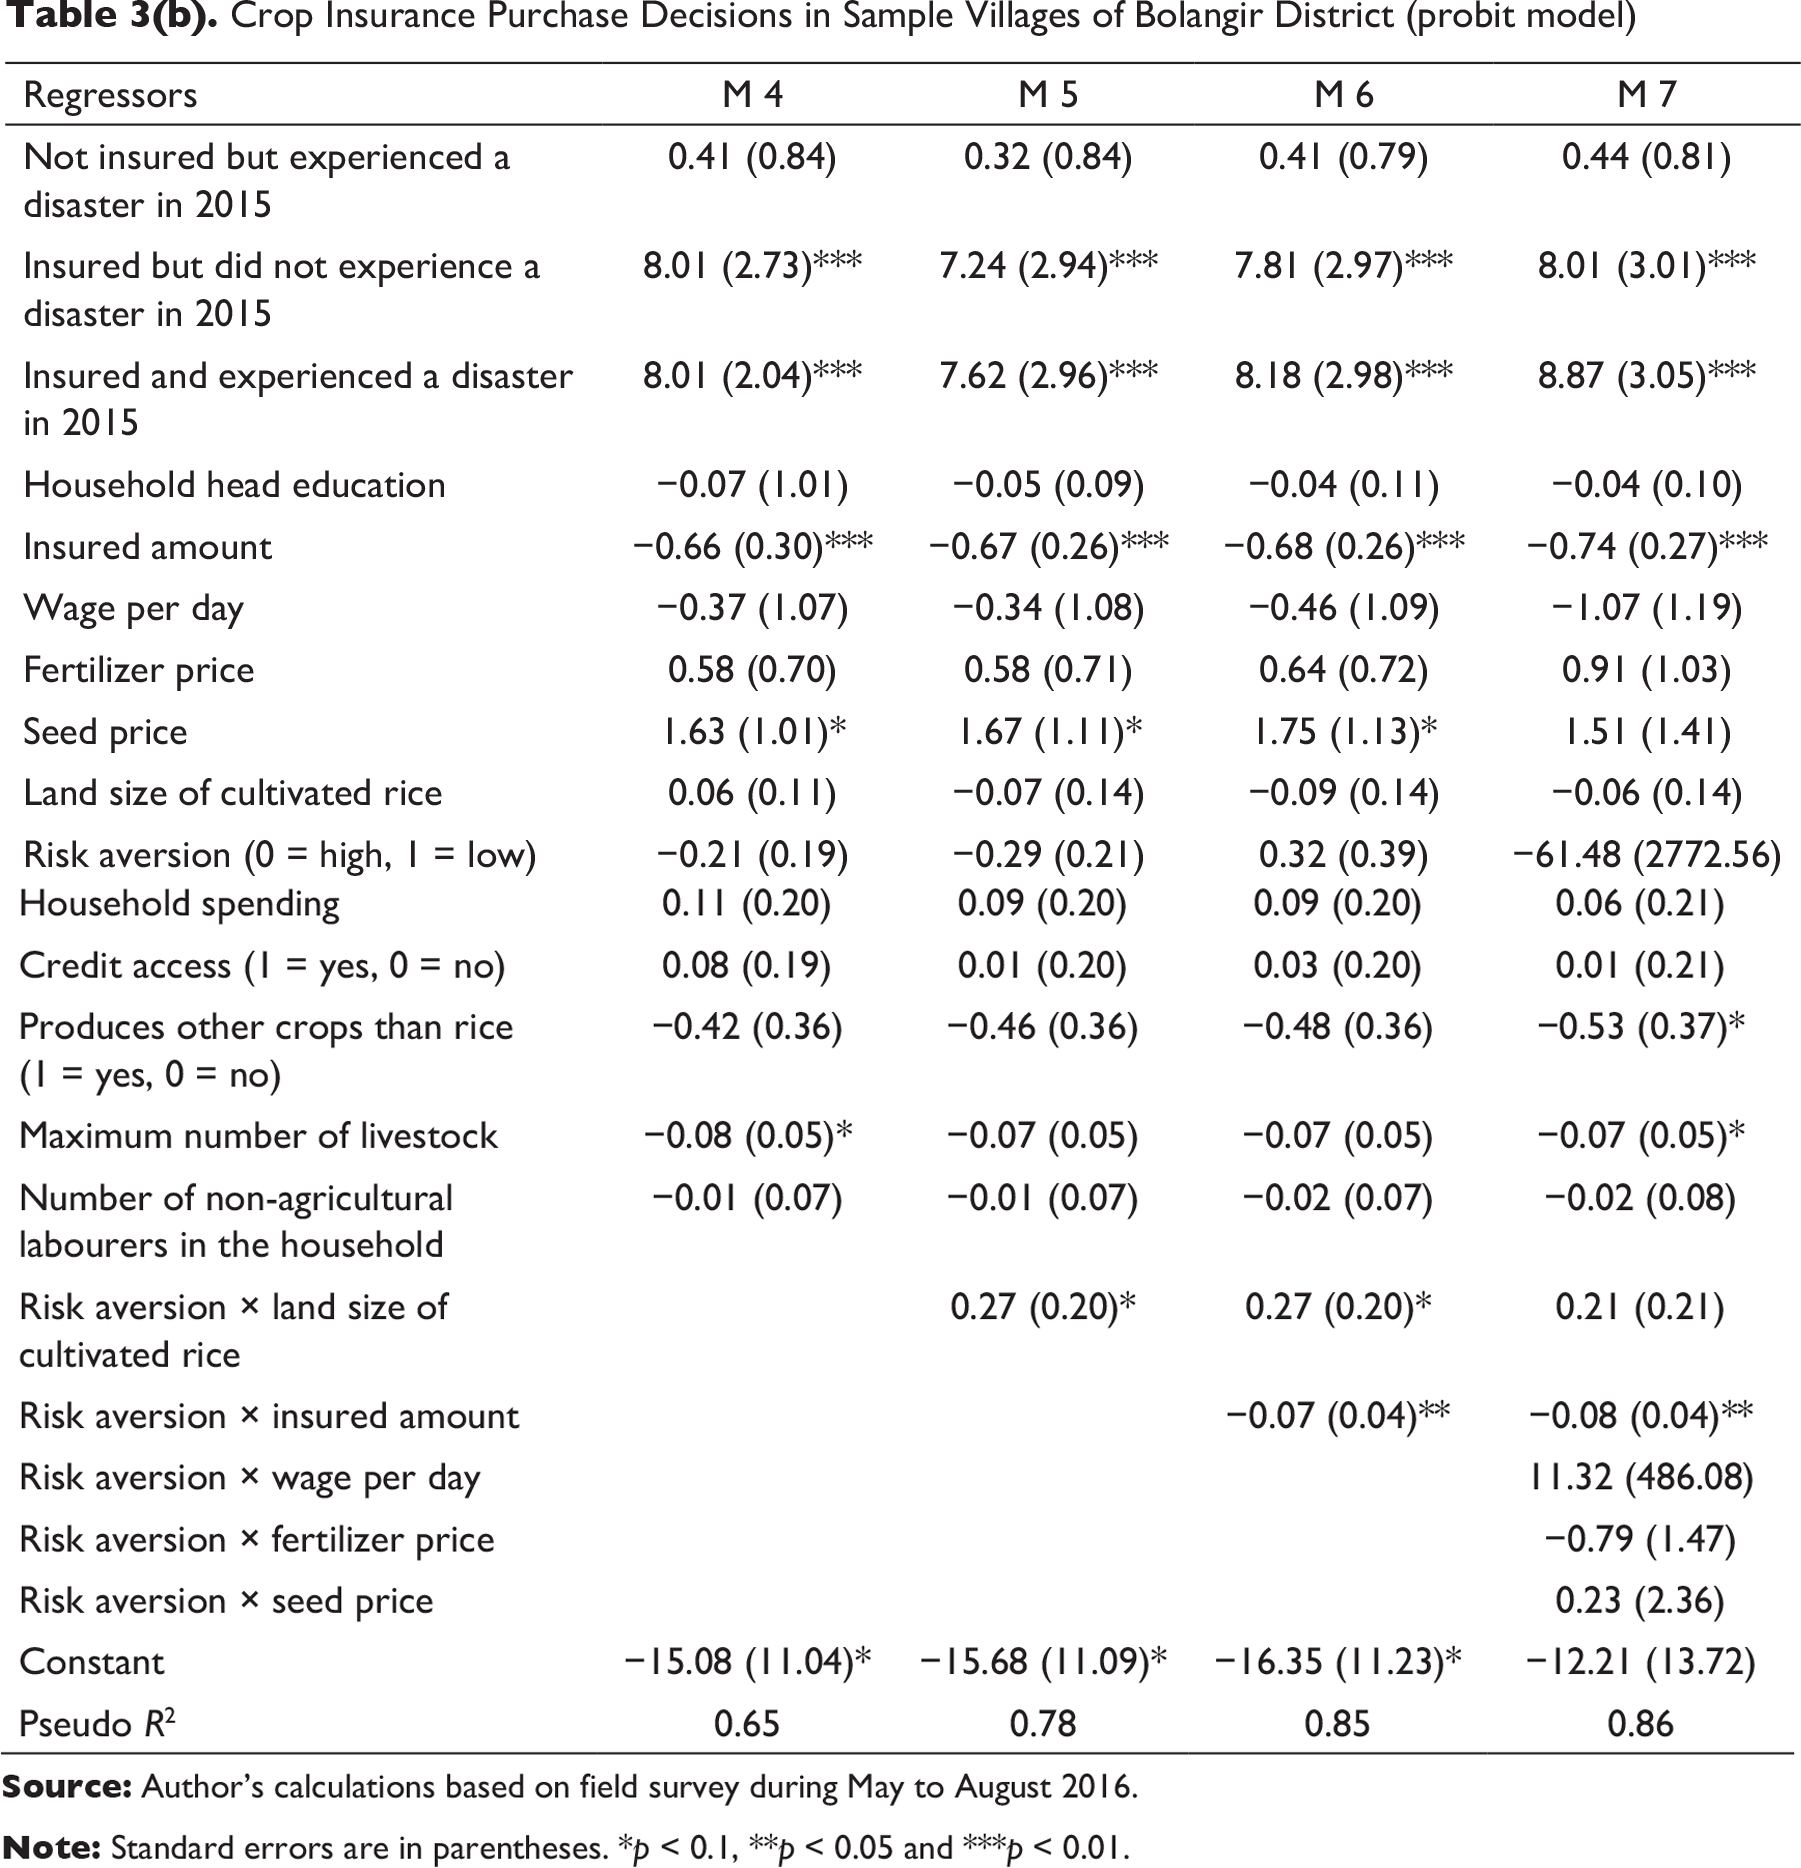
The estimation results of the probit model presented in Tables 3(a) and 3(b) highlight the crop insurance purchase decisions in sample villages of Bolangir district. Model 1 provides results for an econometric model very much similar to our theoretical model. Model 1 comprises dummy variables for past disaster history, production scenario that includes land area used for rice production, input prices, risk tolerance levels obtained from experiment game, crop insurance environment that includes amounts covered by the insurance and household spending. First of all, the recent disaster events tend to increase farmers’ WTP for the insurance product, as farmers are most sensitive to the most recent event. Variable insured in 2015 is omitted due to multicollinearity problem. Similarly, premium amount is also omitted in model 2 because of collinearity problem. It was found that disasters in 2015 significantly influenced farmers in the study area to purchase the insurance product. Second, the amount offered in the insurance contract and cultivated land size also positively influenced farmers’ desire to purchase insurance. It was found that the amount offered in the insurance contract significantly determined participation rates in the study area. Since high premium amount negatively influenced the farmers’ participation level and their WTP for the insurance contract, a significant influence of premium amount was found in the study area, determining farmers’ purchase decision since most of the farmers’ were small and marginal. The effect of input prices was more mixed in our specification. It was found that increasing seed prices have a positive and significant effect on the probability to insure. Despite its theoretical relevance, risk aversion does not significantly influence the crop insurance purchase decision in the study area. There are three dummy variables that distinguish farmers who experienced a shock in 2015 but were not insured at the same time from farmers who were insured in 2015 but did not experience a disaster and farmers who experienced a disaster in 2015 and also were insured against it. The reference group is farmers who did not experience a disaster in 2015 and also were not insured against it. Since farmers who bought insurance once are more likely to buy it again in the future, to avoid serial correlation, Model 2 introduces an additional dummy variable capturing participation in the insurance programme in the previous year. Results show that experience in crop insurance purchase is a significant determinant of WTP. It was found that 20 per cent of farmers who purchased insurance in 2015 did not renew their contracts in 2016 due to low coverage and delays in payment of compensation; whatever compensation was paid did not cover losses (we shall discuss it in the last section). Model 3 refines the relationship between past disaster experience and insurance purchase decision. It was found that farmers who bought the insurance product in 2015 mostly renewed their contract in 2016 irrespective of whether they experienced a disaster in 2015. Although the results presented in Table 3(a) are interesting, they somewhat contradict the theoretical relevance of risk-aversion effect in the study region. Therefore, it is imperative to highlight some informal risk management strategies in our model. Since a farmer can diversify his/her production activities to compensate the risk associated with a particular crop, the insurance product might appear as a costly alternative, thereby significantly reducing their WTP for formal insurance. Model 4, in Table 3(b), introduces such possibilities like credit access and production diversification, which include raising livestock and crop diversification and, finally, non-farm labour. Only raising livestock appears to have significant influence on farmers’ WTP in the study region. These results allow us to understand that a farmer with high risk aversion and large land size is always willing to participate in the crop insurance programme compared to a farmer with relatively low risk aversion and small land area would always refuse to participate. However, the question is what will happen to their decision behaviour in case of high risk aversion coupled with small land area and low risk aversion with large land area. Model 5 explores this interaction effect of land area and risk aversion. For the large farmers, the degree of risk aversion has no impact on their crop insurance purchase decision, whereas it has a positive and significant effect for small landholders. Similarly, if a farmer is highly risk averse, then land size has no effect on the insurance purchase decision. The results found a positive and significant effect of the interaction term, which shows that the effects of land size and risk aversion are very closely related with each other. In order to refine the analysis further, the author has also incorporated the effect of risk aversion with insured amount in Model 6. There was a significant influence of the interaction term with farmers’ crop insurance purchase decision. The farmers who were highly risk averse did not bother about the high insurance amount in the contract, whereas farmers having less risk-averse attitude always considered the insurance amount in the contract before making any decision. Therefore, the results found a very close link between risk aversion and insured amount. Similarly, the interaction effect between risk aversion and input prices on crop insurance purchase decision has been introduced in Model 7. But, there was no significant influence of this interaction effect on crop insurance purchase decision.
Descriptive Information About Variables in the Cuttack District

As we can see from the descriptive data shown in table 4 about Cuttack district, the average land used for cultivation is 2.96 ha. Out of this, 2.55 ha of land is generally used for rice production since rice is the most important crop in the Cuttack district. Sample households used to get an average wage of ₹332.5 (US$4.51) per day are calculated as the district average wage rate of labour, which includes both agricultural and non-agricultural activities. The maximum amount is ₹1,000 (US$13.57) and minimum amount is ₹300 (US$4.07) per day. The average fertilizer price in the sample district is ₹325.13 (US$4.41) per bag. The maximum price was ₹999 (US$13.56) and minimum was ₹240 (US$3.26) per bag. The average seed price in the sample village areas was ₹1,907.75 (US$25.89) per bag. The maximum price was ₹2,500 (US$33.93), and the minimum price was ₹1,450 (US$19.67) per bag. Around 192 farmers out of the total sample experienced a disaster in 2015, and 148 farm households out of the 200 samples insured their crop in 2015. But interestingly, all the farmers who had insured last year also participated in 2016 crop insurance programme. The average insured amount for crop insurance participation in the year 2015 was ₹44,475 (US$603.57). The maximum amount was ₹160,000 (US$2,171.37) and the minimum was 0 (for non-insured families). The average premium amount paid for crop insurance participation was ₹1,111.87 (US$15.08)/ha. The maximum amount was ₹4,000 (US$54.28) and the minimum is ₹0. Around 56 farmers from the card game experiment were found to be highly risk averse. The household head had obtained more than 5 years of education. Around 170 farm households out of a total of 200 produced crops other than rice. A total of 170 sample respondents had access to credit in their areas. The number of non-agricultural labourers in households was around two in the sample families. The maximum people found in the sample village was seven and minimum was zero. The maximum number of livestock rose the previous year and was found to be around three, on average, in the sample families. The maximum was eight and minimum was zero. The average amount of money households spent in 2015 was ₹59,385 (US$805.92). The maximum expenditure incurred was ₹130,000 (US$1,764.24), and minimum expenditure incurred was ₹17,000 (US$230.71).
Crop Insurance Purchase Decisions in Sample Villages of Cuttack District (probit model)
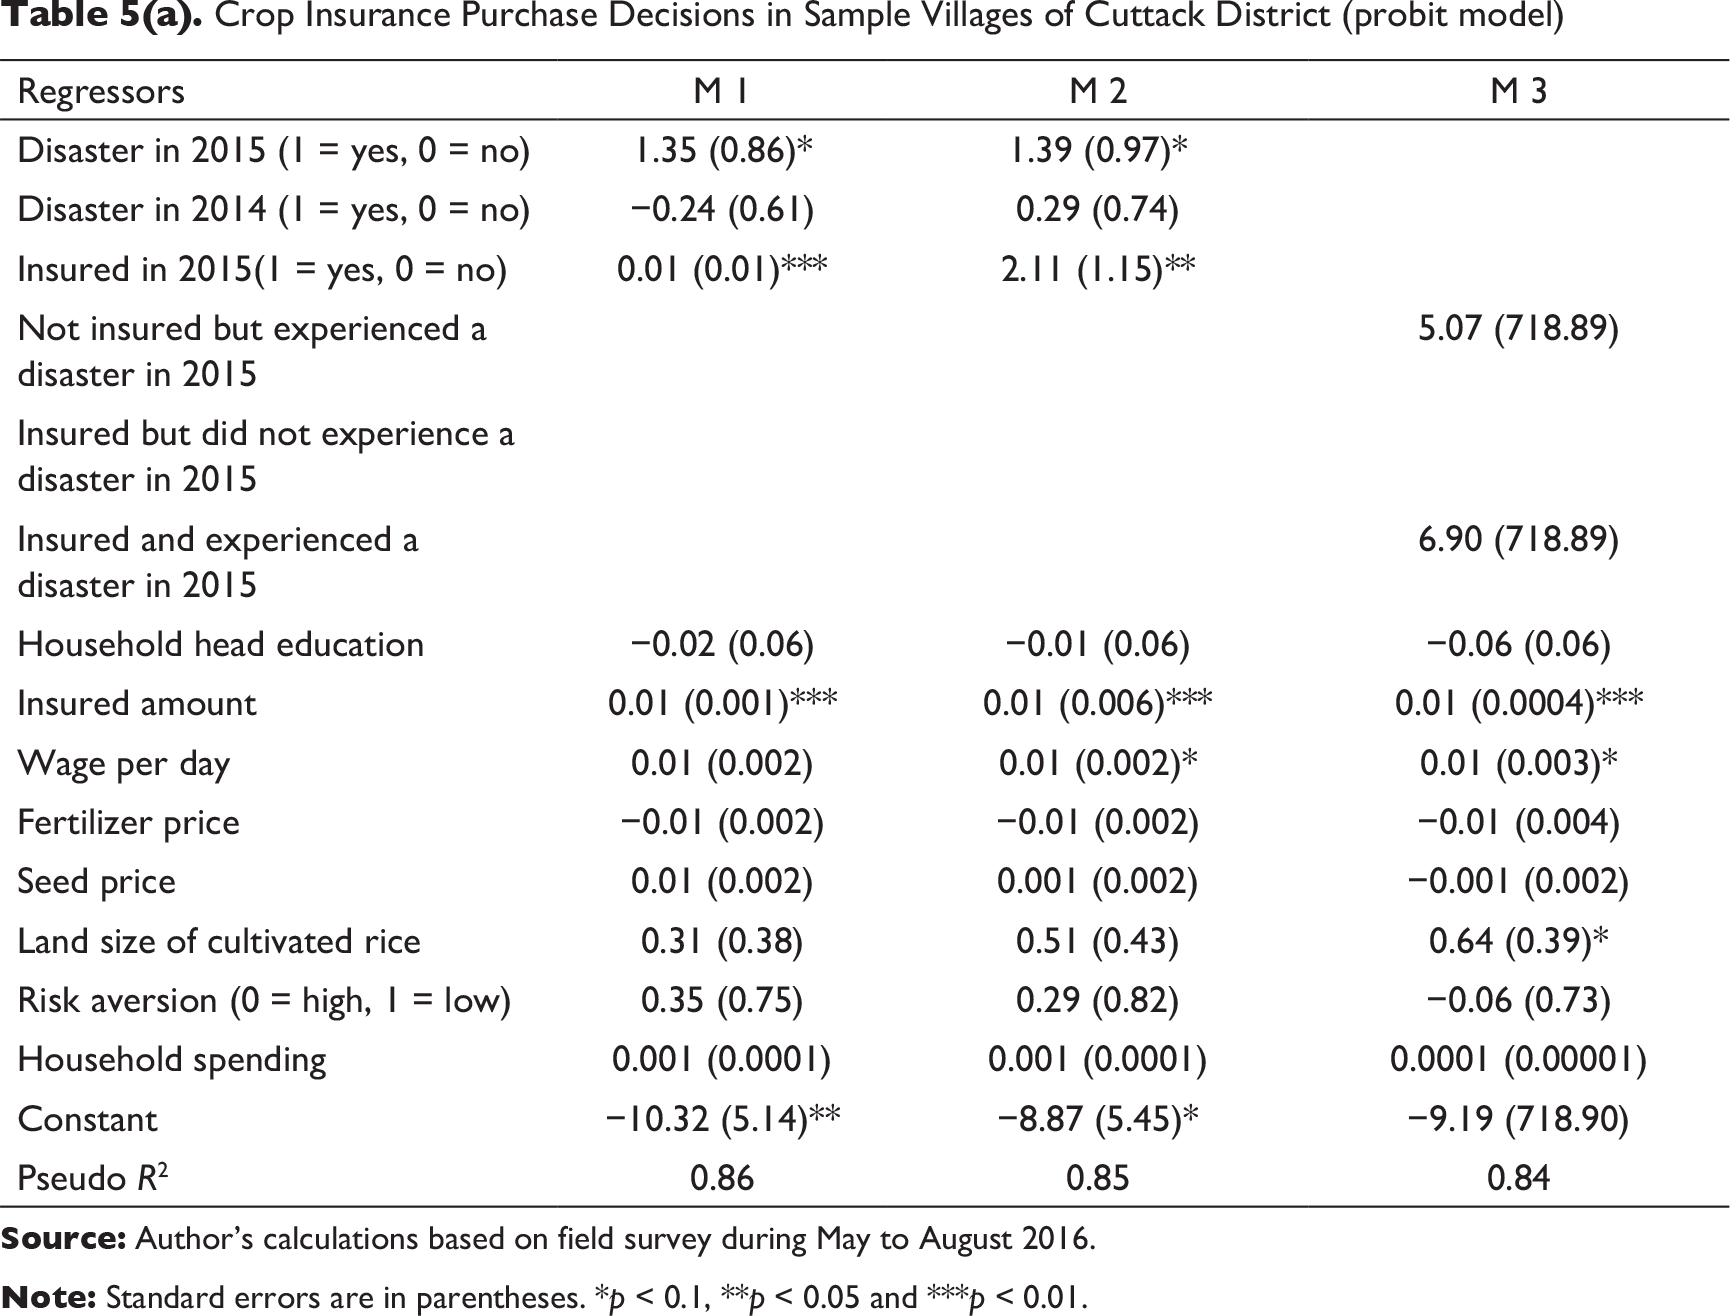
Crop Insurance Purchase Decisions in sample villages of Cuttack District (probit model)

The estimation results of the probit model presented in Tables 5(a) and 5(b) highlight the crop insurance purchase decisions in sample villages of the Cuttack district. Model 1 provides results for an econometric model very much similar to our theoretical model. Model 1 comprises dummy variables for past disaster history, production scenario that includes land area used for rice production, input prices, risk tolerance levels obtained from experiment game, crop insurance environment that includes amounts covered by the insurance and household spending. First of all, the recent disaster events tend to increase farmers’ WTP for the insurance product, as farmers are most sensitive to the most recent event. Premium amount is omitted in Model 1 because of collinearity problem. It was found that disasters in 2015 significantly influenced farmers’ in the study area to purchase insurance product. Second, the amount offered in the insurance contract and cultivated land size also positively influenced farmers’ desire to purchase insurance. The amount offered in the insurance contract significantly determined participation rates in the study area. The effect of input prices was more mixed in our specification. It was found that increasing seed prices have a positive effect on the probability to insure, and high fertilizer prices have negative effect on the probability to insure. Despite its theoretical relevance, risk aversion did not significantly influence the crop insurance purchase decision in the study area. There were three dummy variables that distinguished farmers who experienced a shock in 2015 but were not insured at the same time from farmers who were insured in 2015 but did not experience a disaster and farmers who experienced a disaster in 2015 and also were insured against it. The reference group was farmers who did not experience a disaster in 2015 and also were not insured against it. Since farmers who bought insurance once were more likely to buy it again in the future, to avoid serial correlation, Model 2 introduced an additional dummy variable, capturing participation in the insurance programme in the previous year. Results show that experience in crop insurance purchase in 2015 was a significant determinant of WTP. All the farmers who purchased insurance in 2015 also renewed their contracts in 2016, showing their consistency with respect to their insurance purchase decision in the study area. Model 3 refines the relationship between past disaster experience and insurance purchase decision. Farmers who bought the insurance product in 2015 were found to mostly renew their contract in 2016 due to their experience in the previous year disaster scenario. Although the results presented in Table 5(a) are interesting, they somewhat contradict the theoretical relevance of risk-aversion effect in the study region. Therefore, it is imperative to highlight some informal risk management strategies in our model. Since a farmer can diversify his/her production activities to compensate the risk associated with a particular crop, the insurance product might appear as a costly alternative, thereby significantly reducing their WTP for formal insurance. Model 4 in Table 5(b) introduces such possibilities like credit access and production diversification that include raising livestock and crop diversification and, finally, non-farm labour. Both crop diversification and raising livestock appear to have negative and significant influence on farmers’ WTP, whereas non-farm labour has positive and significant influence on farmers’ WTP for the crop insurance product in the study region. These results allow us to understand that a farmer with high risk aversion and large land size is always willing to participate in the crop insurance programme compared to a farmer with relatively low risk aversion and small land area who would always refuse to participate. However, the question is what will happen to their decision behaviour in case of high risk aversion coupled with small land area and low risk aversion with large land area. Model 5 explores this interaction effect of land area and risk aversion. For the large farmers, the degree of risk aversion has no impact on their crop insurance purchase decision, whereas it has a positive and significant effect for small landholders. Similarly, if a farmer is highly risk averse, then land size has no effect on the insurance purchase decision. There was a positive and significant effect of the interaction term in the results, which shows that the effects of land size and risk aversion are very closely related with each other. In order to refine the analysis further, the study also incorporated the effect of risk aversion with insured amount in Model 6. There was a significant influence of the interaction term with farmers’ crop insurance purchase decision. The farmers who were highly risk averse did not bother about the high insurance amount in the contract, whereas farmers having less risk-averse attitude always considered the insurance amount in the contract before making any decision. Therefore, the results found a very close link between risk aversion and insured amount. Similarly, the study also introduced the interaction effect between risk aversion and input prices on crop insurance purchase decision in Model 7. But, there was no significant influence of this interaction effect on crop insurance purchase decision. Sample respondents shared several reasons for their non-participation in crop insurance programmes. First, they said they are too poor living with immense hardship; therefore, they do not have enough money/resources to afford insurance schemes. Second, they also perceived that insurance schemes are not reliable because it is very complicated to get indemnity when there is a disaster due to huge crop losses. Third, since crop production was a highly risky venture, they were planning in the near future to move into other types of activities and may also migrate to cities for better job opportunities. Fourth, some respondents also perceived that since their crop field/area was too small, there was no point buying the insurance because income from paddy production was too small to manage their day-to-day family needs.
Conclusion
The present study underlines the significance of risk management approaches for climate sensitive sectors like agriculture so as to effectively handle climate-induced hazards and disasters using household-level data in Bolangir (rainfed) and Cuttack (Coastal) region of Odisha, India. After exploring various determinants of crop insurance purchase decision of rice-growing farmers in two districts where rice dominates crop production, the study found that in the rainfed region, farmers’ experience in crop insurance purchase was a significant determinant of WTP, but 20 per cent of farmers who purchased insurance in 2015 did not renew their contracts in 2016 due to low coverage, delays in payment of compensation and, specifically, the compensation amount that was paid to them did not cover the losses. In the irrigated region, farmers’ experience in crop insurance purchase in 2015 was also a significant determinant of WTP, and hence all the farmers who purchased insurance in 2015 also renewed their contracts in 2016, showing their consistency with respect to their insurance purchase decision in the study area. With regard to farmers’ risk preferences, risk aversion actually played an important role even though not directly but as an interactive term with expected losses, which, in turn, significantly influenced farmers’ in both the regions to purchase the insurance product. There was a significant influence of insurance history on future crop insurance choice decision in the study region. Farmers’ insurance purchase history can help insurance companies, in order to devise effective crop insurance programmes in the future. Similarly, there was also a significant role of the insured amount in insurance contracts, influencing farmers’ crop insurance purchase decision in both rainfed and irrigated regions. It can therefore help insurance companies to revise the contract items or reform the existing subsidies. In this study, we found the importance of knowing informal risk management strategies followed by farmers before offering them the formal insurance product. Crop diversification and raising livestock appear to have negative and significant influence on farmers’ WTP, whereas non-farm labour had positive and significant influence on farmers’ WTP for the crop insurance product in the study region. Therefore, it was essential for the insurance companies to understand the farmers’ behaviour while designing the insurance product.
Implication, Limitations and Future Research
This study contributes on both policy and managerial implication. The present study has several implications and further highlights the useful lessons about promoting crop insurance adoption. First, it demonstrates how large-scale field survey performed in two geographically different regions can be used to test theories of consumer demand with respect to insurance adoption. Second, it presents how different socio-economic factors influence financial decision-making, which may form the basis for developing a theory. Finally, this study provides decision-makers with evidence-based tools as a guide so as to effectively promote and develop demand-oriented insurance product that meets farmers’ needs. This is a call for various insurance agencies and government organizations to consider the role of risk aversion in insurance purchase decisions. Nevertheless, the results of this study do need to be interpreted with some caution. This present study suffers from many limitations, which need to be noted. First, the sample size is not enough to represent the total population. The author has interviewed 400 sample farmers—200 sample farmers from the 6 villages of the irrigated region of Cuttack and 200 farmers from 6 villages of the rainfed region of Bolangir district. However, taking a sample of 400 farmers in total is not enough to study the production decision and insurance purchase decision of farmers of an agrarian economy of a particular state. Second, the author has used WTP framework and insurance purchase decision of farmers based on expected utility theory, which has its own limitations. Yet, the findings which emerge from this study have their relevance in guiding policies and interventions specific to the intensity of damage caused by extreme covariate shocks like droughts and floods that are increasingly anticipated with the changing behaviour of climate across the districts of Odisha.
Footnotes
Acknowledgements
The author is grateful to the editor and anonymous referees of the journal for their extremely useful suggestions to improve the quality of the article. The author would like to express his sincere gratitude to Prof Phanindra Goyari, School of Economics, University of Hyderabad for his constant motivation. The author is also grateful to Dr Sarthak Gaurav and Dr Manoj Mishra for their necessary suggestions to improve the accuracy of the article. A special thank goes to a number of people who helped in collecting primary data during the field survey. The author is also thankful to the farmers who participated in the survey. However, the usual disclaimer applies.
Declaration of Conflicting Interests
The author declared no potential conflicts of interest with respect to the research, authorship and/or publication of this article.
Funding
The author received no financial support for the research, authorship and/or publication of this article.