



Abstract
This article aims to establish a methodology to estimate the parameters of the Bass model of diffusion of innovations at the take-off stage of the innovation in emerging markets and thus draw timely diffusion forecasts. This article analyses four cases of diffusion of innovations in emerging markets. Besides gradient-based methods for model estimation such as ordinary least squares (OLS) and non-linear least squares (NLS), this article uses global optimization techniques such as genetic algorithms (GA) and simulated annealing (SA) with diffusion data till the take-off stage. This study attempts to respond to the problems of scant data by interpolation until the take-off stage. After that, a comprehensive comparison of different methods is made using the standard error diagnostic measures. The results indicate that a combination of NLS, GA and SA with interpolated data reduces error margins to a commonly acceptable level even with scant and noisy data, thus providing managers a methodology to make timely forecasts of diffusion of innovations in emerging markets.
Keywords
Introduction
Optimistic forecasts for the diffusion of innovations in markets often do not translate into reality. One example in this regard is alternate-fuelled vehicles (AFVs). In the year 2012, Nissan, a major automobile maker, sold 9,819 units of Leaf, an Electric Vehicle (EV) against a projection of 20,000 (Mishra, 2013). Deloitte (2019) foresaw a large gap to the tune of 14 million units between the industry capacity and projected forecasts for EVs in 2030 worldwide. Similarly, diffusion of improved cookstoves promoted by various governments among the rural and urban underprivileged throughout the world over the past several decades has generally failed to meet forecast expectations (Shrimali et al., 2011). Since significant capital investments are linked to sales forecasts, accurate and timely diffusion forecasts are essential for designing marketing strategies for the introduction of new products or services.
This article is an endeavour to develop a methodology to make timely forecasts for the diffusion of innovations (DoI) as per the DoI theory (Rogers, 1983) using the Bass model in emerging markets. The DoI theory has been extensively used to model diffusion and adoption of technology products and services, such as mobile banking in India (Chawla & Joshi, 2018), ATM cum debit cards in India (Kaur & Kaur, 2019) and mobile telephony technology generations (Chatterjee et al., 2019). The Bass model is a parsimonious mathematical model used to forecast the diffusion of a single-purchase innovation with the fundamental assumption about the market to be homogeneous (Bass, 1969; Chatterjee & Eliashberg, 1990). The model contains three parameters—the coefficient of innovation ‘p’ defined as the probability of adoption at a certain point in time as a result of external influences such as promotional strategies; the coefficient of imitation ‘q’, defined as the probability of adoption at a certain point in time as a result of internal influences like various social influences, including word-of-mouth, and the market potential ‘m’ (Muller et al., 2009, p. 15).
Though augmented versions of the Bass model have been developed (Muller et al., 2009), empirical evidence indicates that simpler models outperform the relatively complex versions in case of a short series of data (Meade & Islam, 2001). Reasonable estimates of Bass parameters are possible only with data till the peak of the bell-shaped diffusion curve (Mahajan et al., 1990). The challenge of drawing timely forecasts lies in using diffusion data available until the take-off stage or left inflexion point or LIP (Venkatesan & Kumar, 2002) to estimate Bass parameters.
Extant literature indicates that we typically require 8 or 10 data points for reliable estimation of Bass parameters (Heeler & Hustad, 1980; Srinivasan & Mason, 1986). However, for the DoI in emerging markets, these requirements are not met in many cases until the take-off stage (Ratcliff & Doshi, 2016). It can be proved that if the ratio q/p exceeds 3.59, the time to peak sales and the take-off time decreases (Mitra, 2019). Generally, q and p are of the orders of 10−1 and 10−2, respectively (Sultan et al., 1990). Similarly, it has been demonstrated that the ratio q/p is positively related to the Gini coefficient (Van den Bulte & Stremersch, 2004). Gini coefficients of income for emerging economies are much higher than the OECD average (Balestra et al., 2018). Thus, it can be reasonably expected that the ratio q/p is more in emerging markets than in developed markets. Hence, emerging markets will generally have short data series for estimation and forecasting of product diffusion.
Currently, the non-linear least squares (NLS) is the default estimation method. A potential limitation of NLS lies in its failure to estimate statistically significant parameters using a short data series (Srinivasan & Mason, 1986; Venkatesan & Kumar, 2002). Given this limitation of NLS, it is imperative to design a robust estimation framework capable of handling short data series. In this study, we propose a methodology to estimate the parameters of the Bass model for short data series, using interpolated data until the take-off stage. This methodology uses a combination of NLS and random parameter estimation techniques such as genetic algorithms (GA) and simulated annealing (SA) along with interpolated data until the take-off stage to estimate Bass parameters. We use diffusion data of four innovations in emerging markets to validate the proposed methodology. These four innovations are mobile telephony in rural India; Grameenphone services of mobile telephony in rural Bangladesh; Patrimonio Hoy, a low-cost innovative residential building solution in Mexico; and mobile telephony in India.
The rest of this article is structured as follows: in the second section, a review of the extant literature follows this introduction. The third section states the objectives of this study followed by the fourth section that introduces the theoretical framework and rationale for this study. The fifth section delineates the proposed methodology, followed by analysis and presentation of results in the sixth section. Key results are discussed in the seventh section, followed by a discussion on theoretical and managerial implications in the eighth section. The ninth section concludes the article. The tenth section identifies research limitations and future research directions.
Review of Literature
The landmark Iowa corn studies (Ryan & Gross, 1950) kick-started research on the DoI, which led to the development of the theory of DoI by Rogers (1962). A relevant mathematical model was developed by Bass (1969) that is parsimonious and in consonance with the DoI theory. The marketing literature often uses the Bass model as opposed to competing models of Gompertz and the logistic. Empirical evidence indicates that the Bass model performs better than the competing ones. For paucity of space, we elaborate the reasons in Appendix 1 as supplemental material. The Bass model has evolved, with the generalized Bass model—GBM (Bass et al., 1994), incorporating marketing-mix variables in the model. However, the model as formulated by Bass (1969) is often used in the literature as opposed to the GBM for two reasons: first, data on marketing-mix variables like price and promotion that are necessary in GBM are not available in most cases for innovative products, especially in emerging markets, and, second, the GBM provides marginal benefits at substantial costs (Bass et al., 1994).
The Bass model is parsimonious, and it uses three parameters: p (the coefficient of innovation), q (the coefficient of imitation) and m (the market potential) to forecast the diffusion trajectory of a single-purchase innovation. This model classifies adopters of an innovation in two mutually exclusive groups (Mahajan et al., 1990): the first group is influenced in their adoption decision by mass media promotional activities (‘innovators’), whereas the second group is influenced by word of mouth (‘imitators’). Mathematically, the probability that a prospective adopter would adopt an innovation at time t, given that he has not yet adopted till now, is given by

where
f(t) is the density function in time to adoption,
F(t) is the cumulative fraction of adopters in time t,
p is the coefficient of innovation,
q is the coefficient of imitation and
m is the market potential
The coefficient of innovation is defined as the probability of adoption at a certain point in time as a result of external influences like promotional strategies, and the coefficient of imitation is defined as the probability of adoption at a certain point in time as a result of internal influences like various social influences, including word of mouth (Bass, 1969; Mahajan et al., 1990). Equation (1) yields the following differential equation (Mahajan et al., 1990):

The cumulative sales N(t) at time t is given by (Mahajan et al., 1990):

Estimation of Bass parameters p, q and m are necessary to forecast diffusion. To draw timely forecasts, the challenge to forecasters arises in the form of estimation of Bass parameters with limited data until the take-off stage, technically called the left-inflexion point or LIP. The LIP is the point where the non-cumulative diffusion curve exhibits the maximum slope and is given by
Parameter Estimation
A comprehensive literature on the estimation of Bass parameters exists. A detailed review is available in Mitra (2019). Bass (1969) used the ordinary least squares (OLS) procedure. He took the regression (or discrete) analogue of the differential equation formulation of the Bass model (Equation [2]) that yielded:

where

OLS can then be used to estimate a, b and c in Equation (4), which, in turn, estimates p, q and m. However, the OLS is riddled with three limitations (Schmittlein & Mahajan, 1982): (a) multicollinearity between N(t) and N2(t), (b) unavailability of standard errors for estimated p, q and m, thus giving no idea of their statistical significances and (c) a time-interval bias that is a consequence of the fact that a discrete time-series data are used for estimating a continuous model.
To redress these limitations, Schmittlein and Mahajan (1982) developed a maximum likelihood estimation (MLE) process to estimate the parameters from the solution to the Bass differential equation. This method has limitations: it considers sampling errors and ignores other errors, like the effects of marketing variables on the diffusion process, and underestimation of the standard errors of the estimated parameters, which results in erroneous inferences of the statistical significance of such parameters (Srinivasan & Mason, 1986).
Srinivasan and Mason (1986), hence, proposed the NLS method to estimate Bass parameters. In addition to eliminating the time-interval bias in the OLS method, in NLS, the error term represents the effect of sampling errors, excluded marketing variables and the misspecification of the density function. Thus, the standard errors for the parameters are expected to be more realistic. Empirically, we observe limitations in NLS when data cover three stages of the diffusion curve, namely pre-peak, peak and post-peak sales (Venkatesan et al., 2004). More specifically, NLS has failed to achieve convergence in cases with pre-peak sales data, which is the primary concern in this research (Lenk & Rao, 1990; Srinivasan & Mason, 1986; Venkatesan & Kumar, 2002; Venkatesan et al., 2004). The reason is that in the process of using gradient search algorithms like the one used by NLS to find parameters that minimize the objective function, namely the sum of squared errors, NLS can get trapped in local minima. The argument that this limitation can be overcome by starting with triplets of various initial values does not hold in practice as there currently exists no algorithm to search for such initial values. In the case of the Bass model where p is of the order of 10−2, q is of the order 10−1, and m is of the order roughly of 103 (Sultan et al., 1990), there exist millions of such starting values (Venkatesan et al., 2004). This limitation with NLS is aggravated with a few data points, thus making the solution space ‘rough’, and low signal to noise ratio (Van den Bulte & Lilien, 1997) as is the case in the current research.
More recently, specific advanced techniques have been proposed that are designed to provide more accurate forecasts. A few researchers have proposed to use hierarchical Bayesian methods to model the diffusion of new products (Lenk & Rao, 1990; Talukdar et al., 2002). Information from some products that share certain similarities is used to develop prelaunch forecasts for the focal product, with the subsequent updates on such forecasts as sales data from the focal product become available, leading to more stable forecasts. However, the limitations include assumptions about the distribution of parameters, low accuracy with noisy data and lack of user-friendliness to practitioners (Venkatesan et al., 2004).
To produce more realistic estimates, individual researchers have used (adaptive) stochastic techniques that permit time-variant parameters, for instance, feedback filters and Bayesian techniques. These are used in these methodologies to update parameters over time (Bretschneider & Mahajan, 1980; Xie et al., 1997). These methodologies are, however, complicated for practitioners to use (Venkatesan et al., 2004).
Random estimation techniques like GAs and SA could be an answer to the methodological issues encountered earlier. GAs as a search and optimization procedure mimic the principles of genetics and natural selection (Deb, 1999). A GA starts its search with a random set of solutions, as against a single solution. From theoretical considerations, GA provides a higher probability of convergence to global optimum solutions with less number of data points, a large number of parameters, multi-modal parameter space and an intrinsically non-linear model (Del Moral & Miclo, 2001, as cited in Venkatesan et al., 2004). The use of GAs to estimate parameters of the Bass model has been proposed (Venkatesan & Kumar, 2002; Venkatesan et al., 2004; Wenrong et al., 2006).
However, metaheuristics like GA cannot guarantee optimal solutions (Yang, 2011), implying that it is prudent to use random estimation techniques like SA as an alternative to estimate Bass parameters in case GA fails to reach the global optima. SA (Khachaturyan et al., 1979) is a general-purpose serial algorithm used to locate the global optima as opposed to local optima of a continuous function (Du & Swamy, 2016) and also has been used to estimate Bass parameters by Mitra (2018).
Typically, forecasts in the literature with the Bass model exhibit high error margins. In time horizons of 3 years or less, mean absolute percentage error (MAPE) varies between 5 per cent and 10 per cent (Meade & Islam, 2015). However, generally speaking, MAPE values of 20 per cent or less are acceptable (Hwang et al., 2009) as explained in Appendix 2.
The Bass Model in Emerging Markets
An emerging economy (or emerging market economy) defines a nation that is undergoing rapid economic growth due to changes in markets, business culture and social practices. The BRIC countries have been considered as the four largest emerging economies (Burgess & Steenkamp, 2006) in the world. A large majority of consumers in these economies belong to low-income and low-education category (Viswanathan et al., 2012). Empirical evidence indicates that consumers in these markets are influenced less by promotional activities, which are linked to p and influenced more by social network ties or word of mouth that are linked to q (Ratcliff & Doshi, 2016; Weidner et al., 2010) as compared to their counterparts in the developed markets. As explained in ‘Introduction’ section, the unique consumer characteristics in terms of their innovativeness to adopt new products in the emerging markets make the task of estimating Bass parameters at the take-off stage even more challenging. Readers can refer to the review presented by Mitra (2019) to get a comprehensive understanding of empirical work on the Bass model in emerging markets (Akinola, 1986; Doshi, 2012; Gore & Lavaraj, 1987; Purohit & Kandpal, 2005; Ratcliff & Doshi, 2016; Roe-Dale et al., 2015).
Research Gaps
Diffusion in developing countries and emerging markets is an area that warrants further research (Muller et al., 2009, p. 77). Generally speaking, the models were estimated using the entire data set available, except one article that used a part of the data set as a hold out. The data set being large in many cases, the LIP was exceeded by a long margin, which caused the forecasts not to be very useful to marketers. No article attempted error diagnostics as part of the research. Timely estimation of the model or choice of model estimation technique generally did not constitute the research questions. The non-linear method of model estimation was primarily used, although one article reported the application of the Bayesian technique. The review also reveals that in a few cases, even the entire diffusion data set was not sufficient to provide statistically significant estimates of Bass parameters as in the cases of the Village Phone and the Indian Tobacco Company (ITC) e-Choupal (Ratcliff & Doshi, 2016).
Because of the above, it can be said that there does not exist a body of research that makes timely estimates of a diffusion model (Bass/Gompertz/Logistic), closer to the take-off stage. Keeping in view the expected shorter time to attain take-off stage in emerging markets that was explained in ‘Introduction’ section and the possibility of success of random search techniques like GA and SA that was indicated in ‘Parameter Estimation’ section , scope exists for using random search techniques to estimate the models with data till the take-off stage or thereabouts. As indicated in ‘Parameter Estimation’ section , empirical evidence demonstrates the superiority of random search techniques over the predominantly used non-linear method of Bass parameter estimation, especially with short data sets (Venkatesan & Kumar, 2002; Venkatesan et al., 2004).
Research Objectives
Given the above-mentioned estimation issues, this study aims to develop and analyse a methodology to make forecasts of diffusion for new products in emerging markets. Specifically, the study objective is to develop an appropriate methodology to forecast sales using the Bass diffusion model in cases where diffusion data are available until the take-off stage (LIP).
Theoretical Framework and Rationale of the Study
The DoI theory and the Bass model of diffusion constitute the theoretical basis for this study. Diffusion data till the take-off stage for four products or services in emerging markets are used to estimate the Bass model. This yields the three Bass model parameters: p, q and m. These are then used to forecast diffusion. Validation of the estimation technique is established through the use of error diagnostics.
The research is necessitated, as mentioned earlier, as managers would be keen to understand diffusion at the take-off stage of an innovation, when promotional budgets and manufacturing estimates are made. However, there is a dearth of attempts to forecast diffusion at the take-off stage of an innovation in the relevant literature. This study attempts to fill that gap.
Methodology
This section briefly discusses the data and methodology used in this study.
Sources of Data
The question as to what exactly constitutes an innovative product or service is a challenging one. We prefer to use the following definition (White et al., 1988) which is inclusive: development of new products, changes in the design of established products or use of new materials or components in the manufacture of established products. (italics applied). Mobile telephony services constitute a very significant improvement over the design of landline services.
Mobile telephony services were initiated in India in the year 1995. The sector has seen tremendous growth since, with 1,131.01 million subscriptions as on 31 May 2018 (Telecom Regulatory Authority of India, 2018), but initially, its diffusion was very slow. Mobile teledensity in India was only 0.1 per cent in 1998, which increased to 0.6 per cent in 2001 and 4.5 per cent in 2004. Rural teledensity was even lower, around 2 per cent in December 2005 (PricewaterhouseCoopers, 2011).
The literature on Bass model is full of examples where mobile telephony service is classified as an innovative product, even in developed economies (Michalakelis et al., 2008; Sultanov et al., 2016). Hence, mobile telephony services, especially in the early twenty-first century in India, can be classified as an innovative service.
This study uses diffusion data for four innovative products in emerging markets: two from India, and one each from Bangladesh and Mexico. More specifically, these four products are as follows: mobile telephony in India; mobile telephony in rural India; Grameen Telecom in rural Bangladesh; and Patrimonio Hoy, a low-cost innovative building solutions provider in Mexico. These data sets are used to achieve the objective of forecasting diffusion from the take-off stage with some diffusion data. These data are representative of data from emerging economies, in that it represents various sectors of the economy: low-cost housing, a tangible good; mobile telephony, a technology service; and growth in Grameen Telecom Village Phone Operator (VPO) that can be considered to be a demand for a service and not a service per se. Also, all data sets are noisy (implying that the data deviate to an extent from what is expected from the model) to a lesser or greater extent that poses a challenge to the forecaster and are available till at least the peak of the diffusion curve, so that the method of estimating the model can be evaluated. The data were available from publicly available sources such as (a) Telecom Regulatory Authority of India (TRAI) WebPages and CMIE Prowess, and concept papers of reputed consulting agencies like PricewaterhouseCoopers (PricewaterhouseCoopers, 2011) for mobile telephony in rural India; (b) WebPages of TRAI for mobile telephony in India; and (c) a respectable journal article for both Patrimonio Hoy and Grameen Telecom (Ratcliff & Doshi, 2016).
Broad Data Processing Strategy
In each of the four cases, the following general strategy is adopted.
We take diffusion data till the LIP and attempt to calibrate the Bass model using the following four methods of model estimation: OLS, NLS, GA and SA. As is evident, the OLS and NLS estimators are meant to estimate parameters based on a least squares rule. In the case of GA and SA, the objective function to be minimized is the sum of squared errors, or the sum of squared differences between the forecasts and the actual. Random search techniques such as GA (and by extension SA) are used in this study as empirical results demonstrate that under suboptimal conditions like less number of data points and an intrinsically non-linear model, as is the case in this research, random search techniques perform better than any other method of estimation of parameters (Mitra, 2018; Venkatesan & Kumar, 2002; Venkatesan et al., 2004). In case of GA, we also perform two simulations. The first one of these is aimed at understanding that parameters computed using GA follow the same probability distribution as parameters obtained using NLS and OLS and thus can be subjected to the same statistical tests. The second one is aimed at finding the reproducibility of parameters using GAs for parameter estimation. We use standard data sets for these simulations.
Wherever meaningful parameter estimates are obtained, we use these estimates to evaluate the model and estimation method. This is carried out by making forecasts and computing the error inherent in these forecasts by using various error diagnostics in the form of root mean square error (RMSE), mean absolute error (MAE) and MAPE.
As mentioned earlier in the article, about 8 to 10 data points are considered to be a requirement for estimation of Bass parameters. In case this is not satisfied, one can only estimate data values in between to help us provide reliable estimates of Bass parameters. Since the data series is short in all cases, we interpolate the data till the LIP and repeat the estimation procedure with the interpolated data. Madadi et al. (2017) used management-judgement-based diffusion forecasts at six discrete points to interpolate using a spline that formed the basis of fitting the diffusion curve using a Lagrangian-based polynomial. Christodoulos et al. (2010) converted an annual telecommunications diffusion data series to semi-annual by interpolation, which is an ‘appropriate disaggregation method for the appropriate sample size and for relatively stable data evolution’. In line with the studies mentioned, this study proposes to use splines to interpolate data till the LIP. Since spline interpolation offers several advantages, it has been used in the present work. For want of space, additional information about the interpolation process has been provided as supplemental material in Appendix 3.
The forecasting done with data points available as they are is referred to here as forecasts with original data, whereas forecasts with interpolated data till LIP are referred to as forecasts with interpolated data.
Keeping in view the fact that the data series is often noisy, to incorporate changing trends in the data series, we also perform a few-steps-ahead forecasts in three of the four cases, taking into consideration more diffusion data in each step, to calibrate the model. We compare the various methods that were used to formulate a general strategy to forecast diffusion with data till the LIP in cases with short and noisy data that are often the characteristics of data in emerging markets.
The above-mentioned data processing strategy was followed in the case of each method, namely OLS, NLS, GA and SA. For estimation of parameters using the OLS, the method as developed by Bass (1969) was used, while, for the NLS, GA and SA, a formulation as suggested by Mahajan et al. (1986) was used. The methods were implemented using the R programming language. We used the NLS R-function nlsLM that uses the Levenberg–Marquardt algorithm, available with the minpack.lm package in R (Elzhov et al., 2016) the ga() function available with the GA package (Scrucca, 2013); and the GenSA package (Xiang et al., 2013) for parameter estimation, using NLS, GA and SA, respectively.
Simulations
Since GA is a simulation-based estimation method, the finite sample properties of GA estimates have been verified using a Monte Carlo simulation. The desirable properties of NLS estimates include: first, approximate normal distribution and, second, a variance of

(Venkatesan et al., 2004). Estimates using GA are considered reliable if they possess such properties of NLS estimates (Venkatesan & Kumar, 2002). Such investigation of asymptotic properties of GA estimates is required to draw statistical inferences based on these estimates.
To establish that parameters estimated from GA follow a normal distribution, we take two data sets from two widely varying markets and products. The first data set is of the diffusion of colour TV sets in the USA in the 1960s (Bass et al., 1994). This is a market in a developed economy with high disposable incomes in an earlier era. The product is a consumer durable. The second data set is of the diffusion of ITC e-Choupal services in rural Indian markets during the period from 1999 to 2005 (Ratcliff & Doshi, 2016). e-Choupal was an initiative of establishing Internet kiosks in Indian villages aimed at providing local farmers with access to information regarding market conditions that enabled them to take more informed decisions with regard to selling their produce. This imitative of ITC is a relatively recent one; is in the subsistence marketplace; and is a service as opposed to a tangible good in the form of a consumer durable. The aforementioned two data sets—colour TV in the USA and ITC e-Choupal—are thus representative of the diverse nature of the product diffusion landscape that the Bass model can capture. In this study, we have, therefore, selected these two products for the simulations.
We took the two data sets mentioned earlier and used R-code to conduct simulations. We took 100 estimates of Bass parameters and plotted them as histograms to test for their consistency and statistical distributional properties.
The second simulation was carried out to understand the performance of GA in reproducibility of the parameters. The parameter estimates for this simulation were arrived at as follows: following Van den Bulte (2002), we computed p and q for mobile telephony in India, a product launched in 1995 in India. This yields p* = 0.0036 and q* = 0.3244. We initiate the simulations with p* = 0.0036, q* = 0.3244 and m* = 1,000. We simulate the data set, using the formulation by Mahajan (1986) as depicted in Equation (3), and a proportional normal error structure with a variance of 0.06. A variance of 0.06 was selected following Venkatesan et al. (2004). For the data set generated, we estimated the Bass model using GA based on 50 estimates. This provided us an insight into the reproducibility of the data set using GA and thus indicated the validity of the GA as an estimation method.
We now illustrate the key results from our research.
Analysis of Results
Simulations
Estimates of Bass parameters from simulations to test for their consistency and statistical distributional properties were plotted as histograms. The histograms clearly demonstrate that the parameter estimates broadly approximate the normal distribution.1
A second simulation to assess the performance of the GA as regards reproducibility of the Bass parameters was carried out. This simulation establishes GA in particular, and random search techniques that are simulation-based like SA, in general, as valid methods in estimating Bass parameters. The product used in this simulation is mobile telephony in India as per the guidelines in Van den Bulte (2002). Recovered parameters closely resembled the original ones as presented in Table 1. Figure 1 is a plot of the distribution of Bass parameters in this simulation.

Reproducibility of Model Parameters Using Simulation

The following details out the results of the forecasts drawn for the four innovations. In the context of the text that follows, original data refer to data till the LIP/take-off stage as have been obtained from secondary sources mentioned, while interpolated data refer to these data after being interpolated as explained in ‘Broad Data Processing Strategy’ section.
Mobile Telephony in Rural India
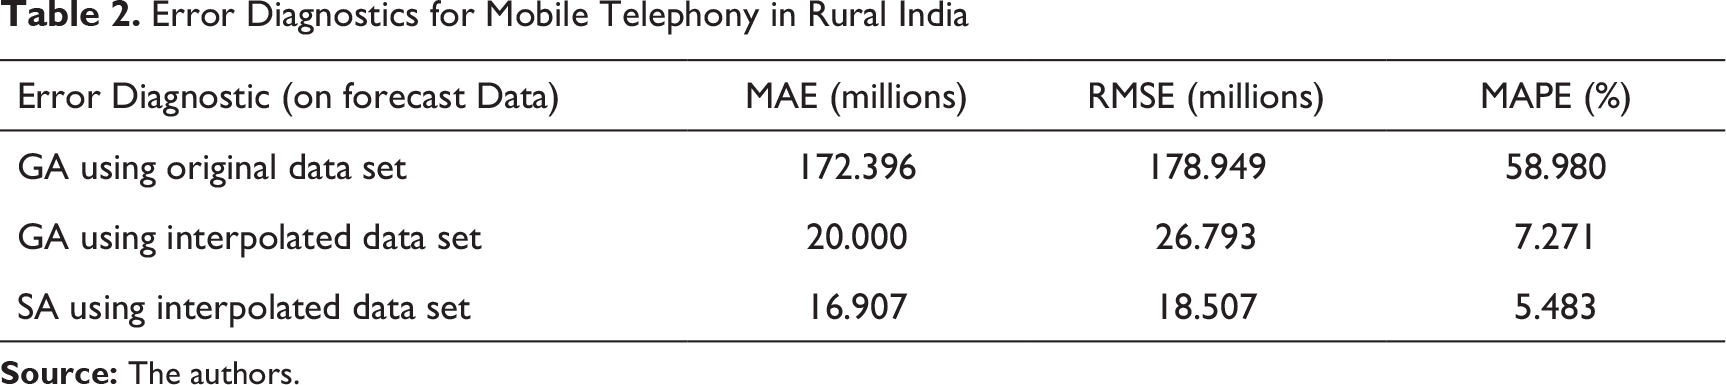
Error Diagnostics for Mobile Telephony in Rural India
Error Diagnostics for Patrimonio Hoy
Patrimonio Hoy, Mexico
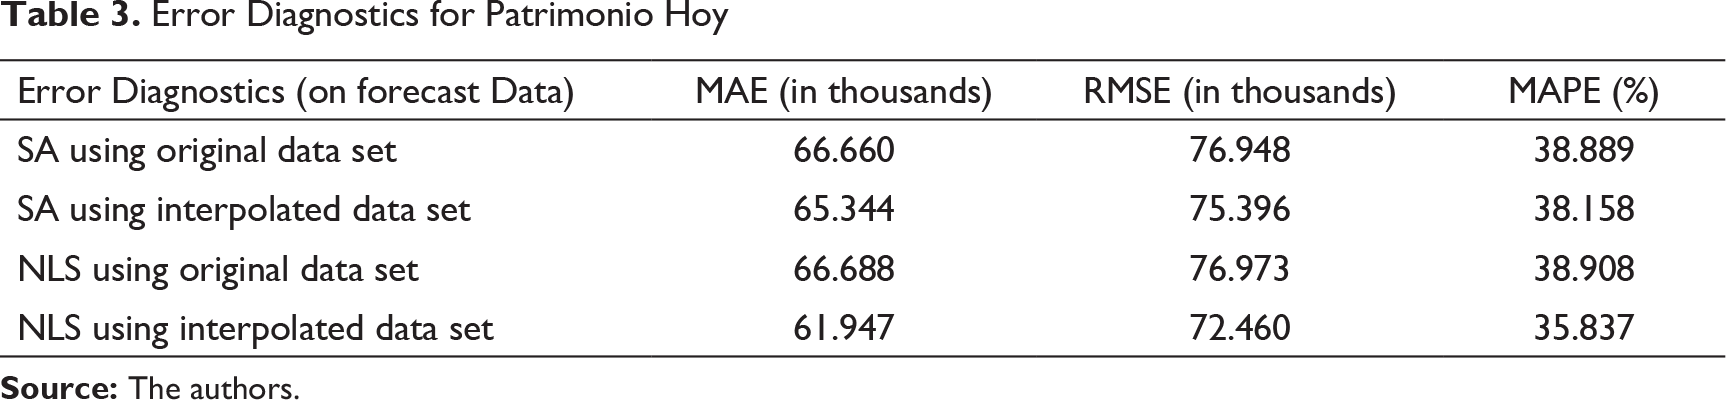
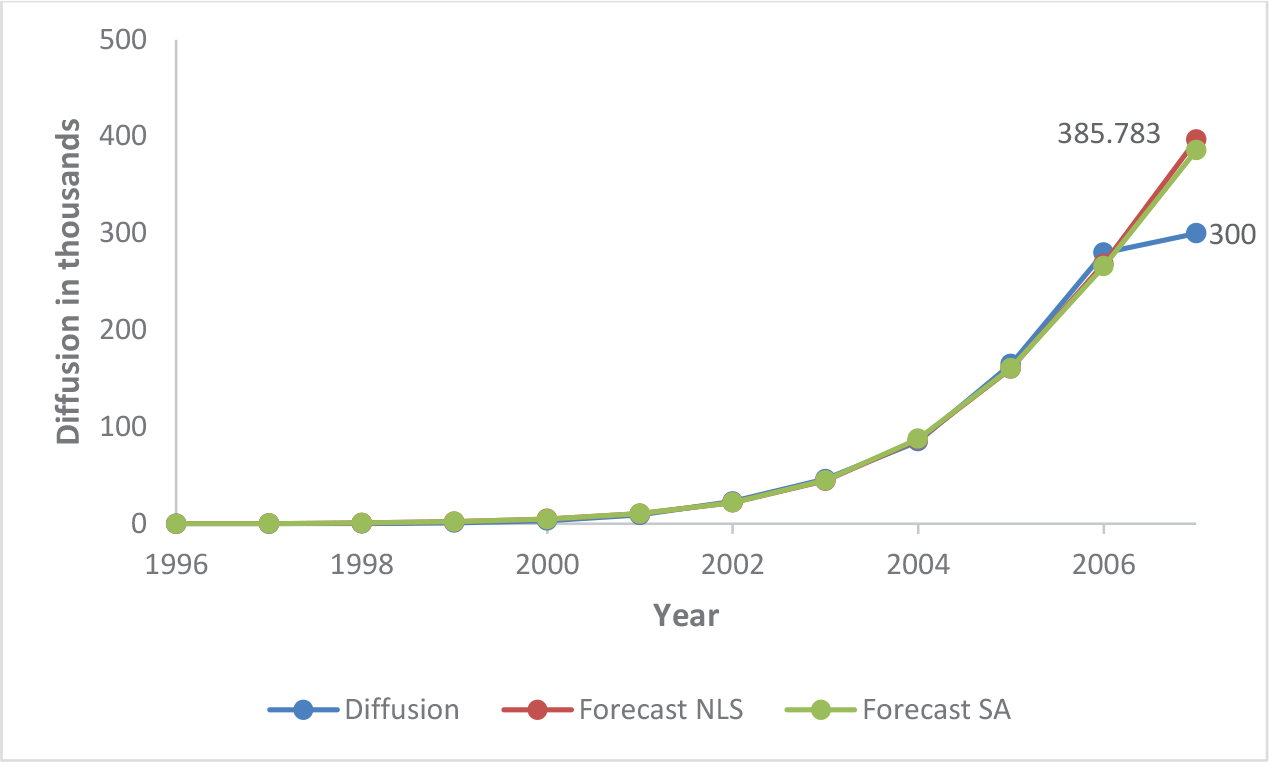
The non-cumulative diffusion curve exhibited a secondary smaller peak and is hence a difficult case to forecast with diffusion models that follow the DoI theory. The NLS and SA were capable of forecast with data till the LIP, whereas the OLS and GA were unable to provide meaningful forecasts. Both NLS and SA had similar forecast errors (MAPE in the region of 35–38%) as presented in Table 3. The one-step-ahead forecasts brought down error margins to 12 per cent as exhibited in Table 6. Figure 3 presents the actual and forecast diffusion curves, using GA and SA on interpolated data.
As is seen in Table 3, error diagnostics for Patrimonio Hoy report relatively higher error margins. As has been mentioned in the earlier paragraph, the Patrimonio Hoy case exhibits a smaller peak or a secondary peak after the first peak. This makes it deviate somewhat from the DoI theory and challenges the capability of the Bass model that follows the DoI theory. As can be seen in Figure 3, the blue curve (cumulative diffusion curve) follows a sort of straight-line trajectory as opposed to the S-shaped trajectory. This makes MAPE from this case higher as opposed to other cases.
Grameen Telecom, Bangladesh
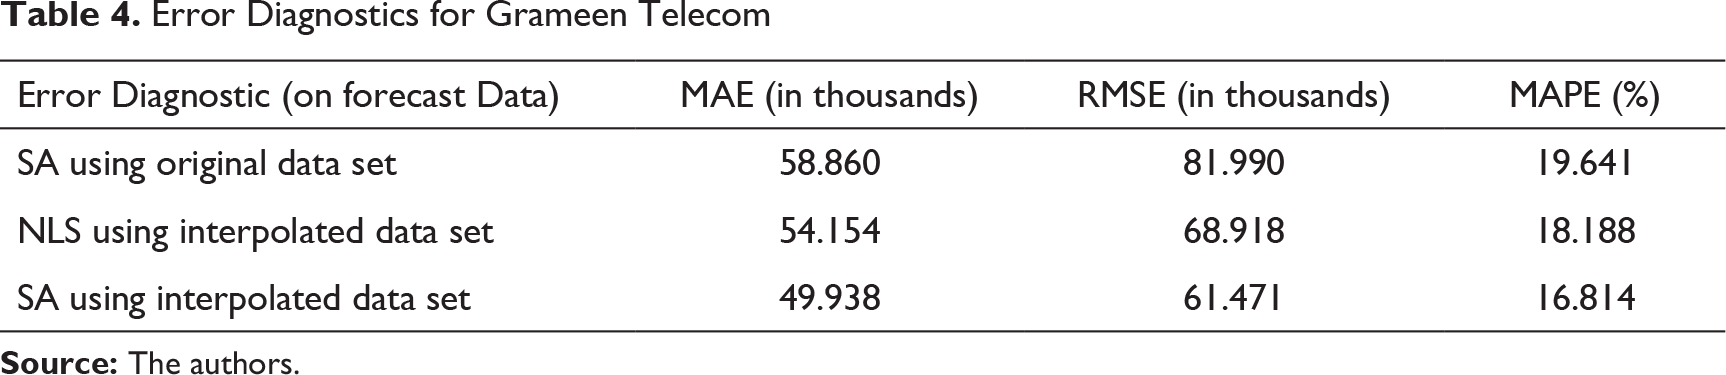
Error Diagnostics for Grameen Telecom


Mobile Telephony in India
This study considers diffusion data for this service from 2001–2016. There are kinks in the curve at around 2012 (see Figure 5). This kink could possibly be an effect of pruning of inactive subscribers by mobile operators in a bid to comply with subscriber verification norms and improve operational performance (Mehta, 2017).

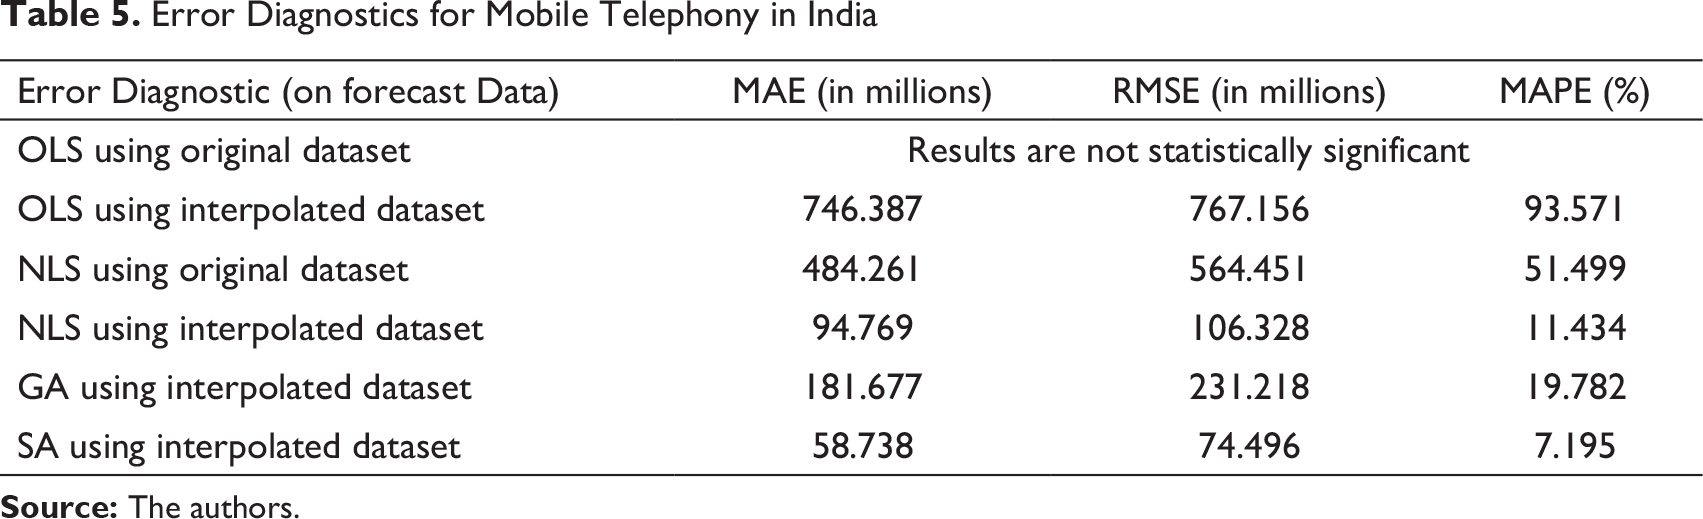
Error Diagnostics for Mobile Telephony in India
Mean Absolute Percentage Error (MAPE) in Various Cases Using Various Methods
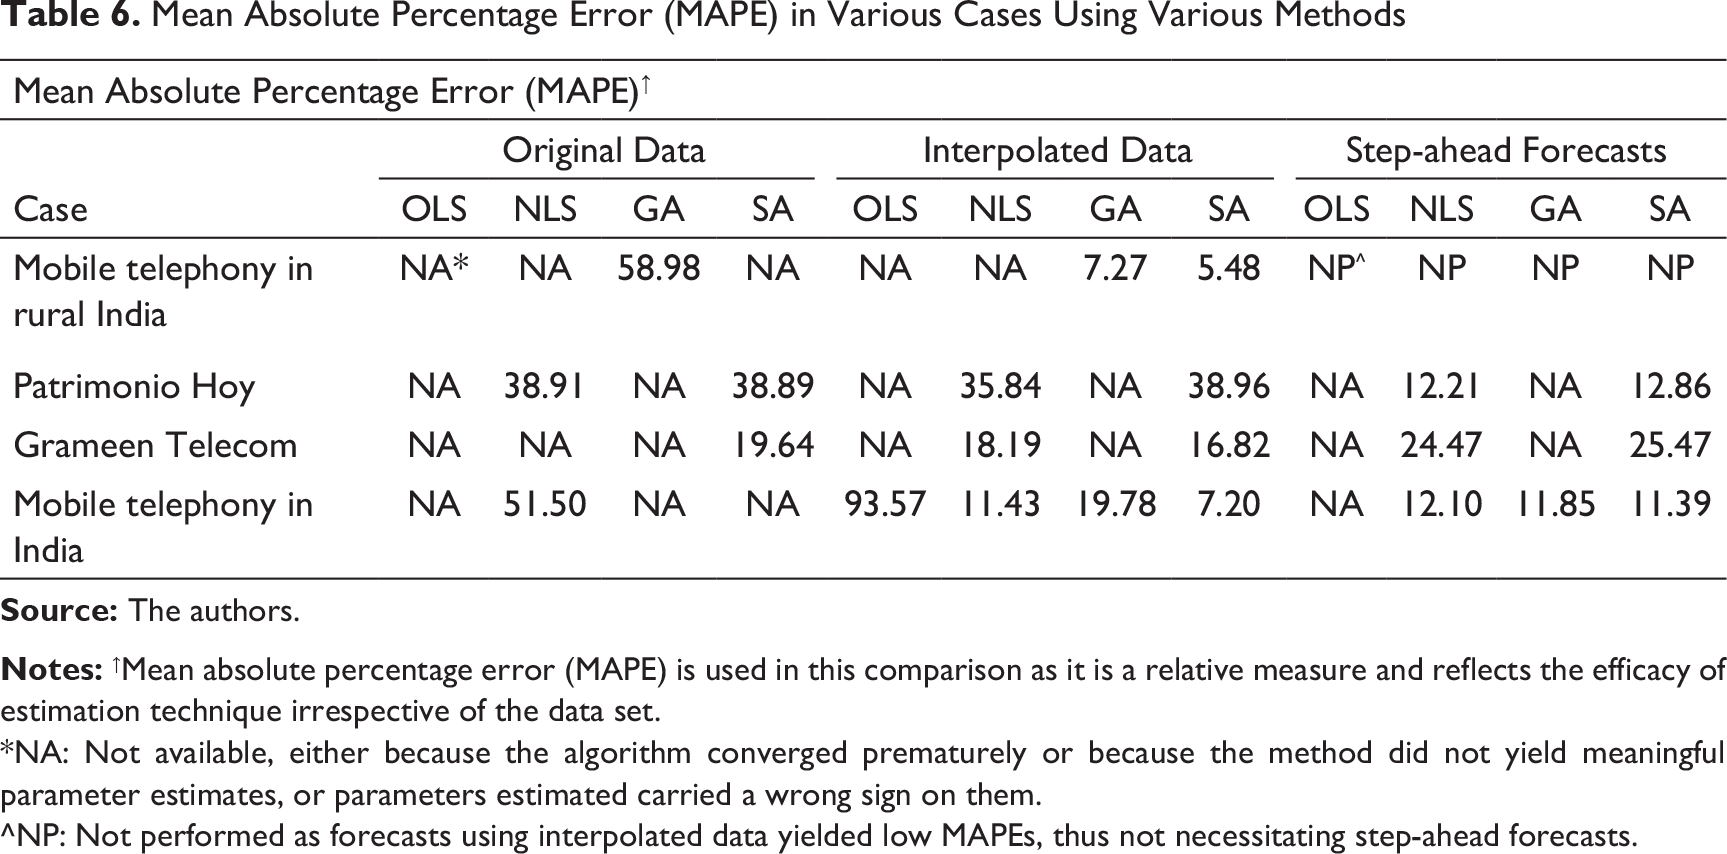
*NA: Not available, either because the algorithm converged prematurely or because the method did not yield meaningful parameter estimates, or parameters estimated carried a wrong sign on them.
^NP: Not performed as forecasts using interpolated data yielded low MAPEs, thus not necessitating step-ahead forecasts.
The NLS was able to forecast on original data till the LIP with a high MAPE of 51 per cent. With interpolated data, the OLS forecasts are way off the mark (MAPE 93%), whereas the NLS, GA and SA provide very acceptable forecasts with MAPEs in the range of 7–19 per cent. Two-step-ahead forecasts carry MAPEs in the range of 11–12 per cent as presented in Table 6. Table 5 presents error margins, while Figure 5 presents the actual and forecast diffusion curves.
Table 6 demonstrates key empirical results that follow from this work.
Discussion
We estimated the Bass model in this article using four data sets till the take-off stage from emerging markets and validated our methodology of estimation. Results indicate that this study has been successful in bringing down forecast MAPE in the range of 5–38% with interpolated data till the new product take-off stage. Considering the fact that typical MAPEs in similar forecasts vary between 27 per cent and 85 per cent even with advanced estimation techniques, this can be considered to be an improvement in methodology. It follows from Table 6 that in cases where sequential search-based methodologies NLS and OLS were unable to estimate Bass parameters with statistical significance with data till the LIP or take-off stage, random search–based techniques like GAs and/or SA were able to forecast diffusion with high accuracy. A case in point is the diffusion of mobile telephony in rural India. The use of SA in estimating Bass parameters has increased chances of obtaining meaningful results with random search–based techniques. In case either GA or SA does not converge or converges prematurely, in most instances, the other would provide meaningful estimates. This is because there is no guarantee that metaheuristics like GA or SA would converge to yield meaningful parameter estimates.
No single method can be said to be distinctly superior in forecasting, using the Bass model with data till the LIP. However, out of the eight total cases with original and interpolated data, the OLS was able to make meaningful and statistically significant parameters in only one case with very high MAPE. The OLS is clearly inadequate.
In the eight possible cases with both original and interpolated data, the GA converged with meaningful estimates in three cases, whereas the SA converged with meaningful estimates in six cases. There was only one case where both did not yield meaningful estimates. In some cases, step-ahead forecasts are necessary, as while error margins with data till the take-off stage or LIP are acceptable in these cases, they can possibly be further improved with step-ahead forecasts. However, in the current article, this is evident only in two of the eight cases where such a comparison could be drawn between step-ahead forecasts and forecasts with interpolated data. This is because of the abrupt fluctuations in the data series in the out-of-sample data in the remaining six cases. Out of the 16 possible cases, estimates with original data till the LIP yielded statistically significant and meaningful parameters in five cases; the corresponding figure was 10 in the case of estimates with interpolated data. Minimum error margins with original data till the LIP were in the range of 19 per cent, whereas that with interpolated data till LIP were in the range of 5–7 per cent. This clearly demonstrates the superiority of using interpolated data till the LIP combined with random search algorithms to estimate parameters.
The key takeaways from the above-mentioned analysis are as follows:
A ‘mix and match’ of methods is useful as opposed to a single method. When NLS fails to generate parameter estimates with data till the take-off stage, GA and/or SA generates such estimates. In this context, two metaheurisrics like GA and SA, acting in tandem, increase the chances of generating parameter estimates with data till take-off stage. Interpolated data till the take-off stage significantly increase the chances of generating appropriate parameter estimates.
Theoretical and Managerial Implications
Based on the key points arrived at the end of ‘Discussion’ section, this study has certain implications for research on estimation techniques with noisy data and relatively short length of data series till the take-off stage point that are the characteristic features of emerging markets. First, it has demonstrated that random search techniques with interpolated data till the take-off stage can bring down MAPEs between 5 per cent and 7 per cent, eminently acceptable by the forecasting industry standards, as in the case of mobile telephony in rural India. This clearly demonstrates that in case the NLS does not converge or converges prematurely, random search techniques like GA or SA can yield quite precise forecasts. Additionally, generally speaking, if the GA does not yield meaningful estimates as is the case with metaheuristics, the SA generally yields and vice versa.
Second, the use of interpolated data till the take-off stage have demonstrated a marked improvement in the quality of forecasts. In certain cases where any statistically significant or meaningful forecasts were not possible with original data till the LIP, as in the case of mobile telephony in rural India or mobile telephony in India, interpolated data till the LIP brought down error margins drastically. This is an important research finding.
With diffusion data till the take-off stage, managers have a toolbox of methods that they can apply, depending on the situation. We recommend the following process flow to practitioners: considering the poor performance of OLS in estimation, that method is ruled out. The NLS is to be used with interpolated data till the take-off stage as the first method of estimation. Interpolated data are being recommended as in all cases where at least one of them, that is, NLS with original data and NLS with interpolated data yielded estimates, NLS with interpolated data yielded better results than NLS with original data. If the NLS fails to converge, then GA and SA with interpolated data are to be attempted for estimates. If forecasts with such estimates start yielding high error margins, then step-ahead forecasts are to be made at appropriate intervals of time, typically one or two steps ahead. Figure 6 provides an algorithmic approach to aid managerial decision-making.

Conclusions
A key critique of the Bass model has been that its managerial implications are limited, as reasonable forecasts are possible only after attainment of the peak of the diffusion curve. This study has successfully addressed this critique, and hence our findings have important theoretical and managerial implications. Certain attributes of the growth phase such as price volatility, actions of competitors and entry of new brands necessitate product managers to be aware of forecast sales, time to and magnitude of peak sales (Venkatesan & Kumar, 2002). Hence, sales forecasts at the take-off stage are extremely important. This study has been successful in offering managers a toolbox to make timely forecast of DoI in markets where data till the take-off stage are scant and noisy, including in emerging markets where this is expected to be the case.
Although the cases in this thesis are from rural/subsistence markets and emerging markets, this discussion is equally applicable to marketing and production managers in firms that need to forecast diffusion at the take-off stage with scant data. The product in question may be a technology product; durables; long-term services; search goods; products with high perceived risks; products with long inter-purchase times; and high involvement and high-priced goods. The article thus presents a framework for estimating diffusion of an innovation at the take-off stage that is expected to benefit new product managers.
Limitations and Scope for Further Research
This study is important as timely estimation of diffusion trajectory based on the Bass model has its own challenges in emerging markets. In this study, the Bass model of diffusion was the only model used. There is a strong rationale behind the selection of this model when a single model is used. However, future researchers with more resources at their disposal might intend to compare the Bass model with competing models like the Gompertz and logistic. The current study used resources available with the open-source R-programming language to estimate parameters using GAs and SA. This led to certain limitations like the number of iterations that could be conducted in a reasonable amount of time. This could have been alleviated with specialized software packages that implement GAs. There also exists scope for extending the Bass model to reflect new realities like the proliferation of strong social networks (Goldenberg et al., 2009; Luu et al., 2012).
A potential area of application of the methodology developed here is in the case of new technologies that are approaching the take-off stage, like cryptocurrencies and blockchains. The rates of their diffusion depend on the geography, and it would be interesting to estimate their diffusion. The same is true for the diffusion of electric vehicles, including that in India. Both of these have policy implications.
Bitcoin, a virtual currency based on a technology called Blockchain, that uses a cryptographic protocol is in the initial stages of diffusion. According to Dalia Research, Berlin, a survey of 29,000 Internet-connected individuals in eight of the largest cryptocurrency markets (the USA, the UK, Germany, Brazil, Japan, South Korea, China and India) revealed that almost 75 per cent of the population were aware of cryptocurrencies. However, in the USA, only about 9 per cent of the population actually used bitcoins, a cryptocurrency in 2018.3 Bitcoins originated in 2009. This relatively slower diffusion is in contrast to innovations of the post-modern era such as personal computers and more so smartphone usage, social media usage and tablet computer usage (this innovation achieved 50% diffusion in the USA in about 5 years). This is probably because of the question of trust in cryptocurrency usage. There are reports of vast amounts of illegal activity funded through bitcoins (Foley et al., 2019), and hence in the absence of an appropriate monitoring agency, many potential adopters might be fearful of adopting bitcoin usage. If we account for this factor, probably, bitcoin diffusion will follow the diffusion patterns of innovations of the twentieth century. Taking the population of the USA to be about 327 million4 in 2018, taking a market potential of 80 per cent, utilizing data from (Jakubauskas, 2018) and assuming that the market is growing at around 20 per cent compounded per annum, the peak of the diffusion curve would be achieved at around 2026–2027. Hence, in theory, the take-off stage would have been achieved at around 2014. However, it appears that there is some network externality associated with bitcoins as a member of the population would be able to pay in bitcoins if another member accepts such payment. Given the issue of trust in bitcoins, the initial diffusion is thus expected to be slowly followed by a sudden spurt in growth. Hence, it seems that the take-off stage in the diffusion of bitcoins was experienced around 2018–2019, with about half of the early adopters adopting it. However, probably, this would be achieved later in emerging markets, like India and China. The Bass model could be profitably used to forecast diffusion of this innovation in such economies and also in developed ones.
Footnotes
Acknowledgement
The authors are grateful to the anonymous referees of the journal for their extremely useful suggestions to improve the quality of the article. Usual disclaimers apply.
Declaration of Conflicting Interests
The authors declared no potential conflicts of interest with respect to the research, authorship and/or publication of this article.
Funding
The authors received no financial support for the research, authorship and/or publication of this article.
