



Abstract
We analyse the time-varying risks associated with ESG equity investments in developed, emerging and BRIC equity markets in the wake of the COVID-19 pandemic which has once again underscored the vulnerability of the financial space to shocks. For this purpose, the nonlinear Markov regime switching model is used to analyse the time-varying beta and idiosyncratic volatility of the World ESG Leaders, Emerging Markets ESG Leaders and BRIC ESG Leaders equity portfolios provided by Morgan Stanley Capital International (MSCI). To further complement the evidence, we also refer to the global ACWI ESG Leaders index which represents both developed markets and emerging markets. The evidence suggests that the risk dynamics of the ESG equity portfolios representing the developed markets, emerging markets, BRIC markets and the global markets are distinct during the crisis and calm period. ESG equity investments have higher systematic risk exposure in emerging markets and BRIC markets during the crisis period as well as calm periods. On the other hand, ESG equity investments have higher systematic risk exposure during the crisis period only in case of developed markets. The results of the study provide insights on the time -varying risk dynamics of ESG investing and thus, facilitate informed investment decisions.
Introduction
There is a growing interest in sustainable equity investments with high environment, social and governance (ESG) credentials from investors as well as the academics. It allows one to invest in companies which have strong ESG characteristics and engage in sustainable investments. According to Giese et al. (2019), ESG investments serve three main objectives. First, it seeks to improve the risk-return characteristics of investments. Second, it allows investors to engage in investments based on norms and belief. Third, it acts as an instrument for initiating positive change for social and environmental priorities. It is pertinent to note that any prudent investment decision should be based on the understanding of the associated risks in the investment as envisaged in the classical portfolio theory (Markowitz, 1952). This assumes greater significance as the World battles the COVID-19 pandemic. The pandemic has disrupted societies and economies around the world at an unprecedented scale. The financial markets have been impacted greatly. The equity markets witnessed violent crash in the early days of the pandemic around March, 2020. The global equity markets have been associated with heightened volatility during the COVID-19 pandemic in studies such as Al-Awadhi et al. (2020), Ashraf (2020), Baker et al. (2020), Zaremba et al. (2020) and so forth. The pandemic has been referred to as a ‘Black Swan Event’ (Antipova, 2020; Morales & Andreosso-O’callaghan, 2020) which has once again exposed the susceptibility of financial markets to crises. In this context, we need to revisit our understanding of the risk dynamics of ESG investing in an uncertain world we currently live in.
With this objective, we employ the nonlinear Markov regime switching model (Hamilton, 1989) to analyse the time-varying systematic and idiosyncratic risks in ESG equity portfolios. We observe that the literature on time-varying behaviour of risks in ESG equity portfolios is scant. Studies which do not take into account the time-varying nature of risks are limited (Rizvi & Arshad, 2017) as they fail to capture the shifts in risks structures with changes in the market environment. The non-linear Markov regime switching model addresses the limitations of linear models like the autoregressive models (Granger & Terasvirta, 1993; Korley & Giouvris, 2021). It can be effectively used to examine the time series behaviour of the beta (the measure of the systematic risk for a portfolio) in different regimes (states of the market) as the model allows for switching between states. Further, the nuances of the idiosyncratic risk during different states can be also examined through the implied standard deviation or the volatility parameter. To this end, we refer to the MSCI (Morgan Stanley Capital International) indices popularly tracked by industry practitioners for global ESG equity investment decisions to gain insights on the risk profiles of ESG equity investments in developed markets, emerging markets and the BRIC (Brazil, Russia, India and China) markets. The study of the BRIC markets assumes significance as the BRIC countries have high stakes in global trade and investments. The risk dynamics is studied within the framework of the classical Capital Asset Pricing Model (CAPM) proposed by Lintner (1965) and Sharpe (1964). The choice of the model for the study is guided by Lin and Falk (2021) and Rivzi and Arshad (2017). The motivation for this study is to understand if the systematic and idiosyncratic risk in ESG equity portfolios change (time-varying character) in different regimes of the market corresponding to prevailing state of the market conditions during the COVID-19 pandemic. Further, we also seek to understand if ESG equity portfolios have low/high systematic risk with reference to their counterpart mainstream or conventional benchmark equity portfolios. The results of the study provide insights to investors on the risk profiles of ESG investing especially during a crisis period and thus, facilitate informed investment decisions.
The rest of the article is organised as follows: we proceed to discuss the related literature in the second section followed by the third section where we present the objective and rationale of the study. In the fourth section, we provide the description of the data, sample and empirical model used in the study. We, then, discuss the empirical results of the study in the fifth section and in the sixth section, we provide our concluding remarks along with the managerial implications and limitations of the study.
Review of Related Literature
In this section, we provide the review of literature relating to the risks dynamics of ESG and sustainable investments. Early studies such as Bénabou and Tirole (2010) and more recently Albuquerque et al. (2019) documented that firms with better ESG credentials have lower systematic risk. Managi et al. (2012) using data from the US, UK and the Japanese market observed that sustainable indexes carry similar risk and returns as mainstream stock indexes. Ortas et al. (2012) using data from Brazil suggests that sustainable investments carry increased risks or lower returns during a financial crisis. Ur Rehman et al. (2016) document higher market volatility in sustainable indexes as compared to mainstream indexes. Nofsinger and Varma (2014) observe that socially responsible mutual funds carry lower downside risks during a crisis period and underperform mainstream mutual funds during non-crisis periods. Lesser et al. (2016) examined more than 200 global sustainable investing funds and observed that green and socially responsible funds underperform in non-crisis periods. Sherwood and Pollard (2017) observed that investors could fetch higher returns and face lower downside risk in the ESG equity portfolios than non-ESG equity portfolios in emerging markets. Hoepner et al. (2019) provides evidence that aligning with ESG factors reduces downside risk. Cunha et al. (2020) observed that the performance of the sustainable investment portfolios differs in different geographic regions. Kanuri (2020) examined the return and risks characteristics of ESG Equity exchange traded funds (ETFs) and compares the performance with the US (Russell 3000 ETF-IWV) and global (SPDR Global Dow ETF-DGT) from February 2005 to July 2019. The author observed that the ESG ETF outperformed IWV and DGT portfolios in some periods and underperformed in others. Broadstock et al. (2021) investigated the role of ESG performance during the COVID-19 induced financial market crisis for a sample of stocks lists on the Chinese CSI300. The authors observed that ESG performance reduces financial risks during financial crisis and high-ESG equity portfolios outperform low-ESG equity portfolios. Mohanty et al. (2021) observed that ESG equity portfolios display low systematic and idiosyncratic tail risks. Ilhan et al. (2021) observed that companies with poor ESG credentials reflected in terms of higher carbon emissions, are exposed to higher tail risk. Jin (2022) observed that the daily returns of ESG-screened indexes have a beta coefficient lower than 1 which signifies the systematic risk of ESG equity investments. Pavlova et al. (2022) observed that low rated ESG ETFs outperformed high rated ETFs and the market during the COVID-19 crash. Further, high rated ETFs are not protected from losses during the crash.
Objective of the Study
The article attempts to examine the time-varying risk dynamics of ESG investments within the framework of the classical capital asset pricing model. More specifically, the article attempts to examine the time-varying risk dynamics in developed markets, emerging markets, BRIC markets as well as the global markets during the COVID-19 crisis.
Rationale of the Study
Based on the review of the related literature, we observe that the evidence on the risk dynamics in ESG and sustainable equity investments is far from conclusive. In the related literature spanning over a decade, we find literature on the time-varying behaviour of risks in ESG equity portfolios is scant. In this context, our contribution to the existing literature on the subject is in two ways. First, we contribute to the scant literature on the time-varying risks in ESG investments. Second, we provide a perspective on the time varying risks of ESG investments in developed markets, emerging markets, BRIC markets as well as the global markets. The evidence in our study is based on global indices provided by MSCI for developed markets namely the World ESG Leaders Index representing 23 developed markets. The emerging markets perspective was gained through the Emerging Markets (EM) ESG Leaders index representing 25 emerging markets and BRIC ESG Leaders index representing Brazil, Russia, India and China. The study also provides a global perspective by examining the global ACWI ESG Leaders Index which represents the equity portfolio based on the ESG criteria for 23 developed markets and 25 emerging markets. Besides, our work also adds to the limited literature on the impact of COVID-19 on ESG investments.
Methodology: Data, Sample and Empirical Model
Data and Sample
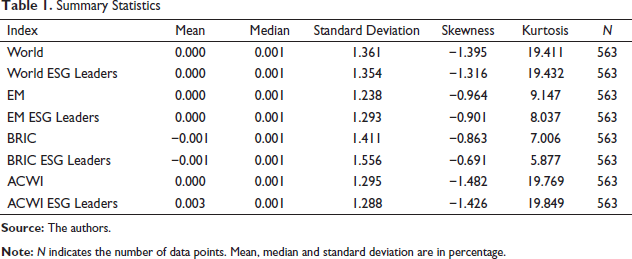
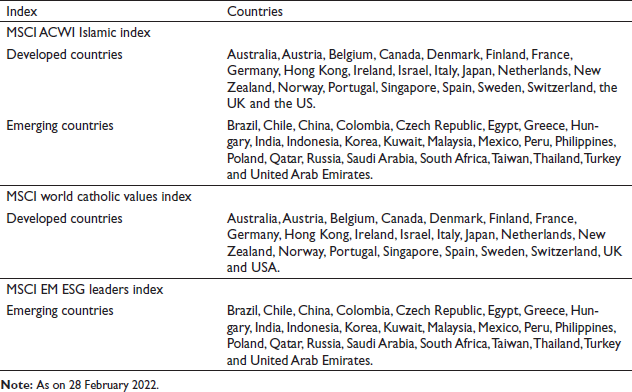
We calculate the daily returns (in US dollars terms) of the World ESG Leaders index, Emerging Markets (EM) ESG Leaders index, BRIC ESG Leaders index and the ACWI ESG Leaders index provided by the MSCI to examine the dynamics of risks associated with the ESG equity investments. The list of countries which are part of the indexes included in the study is provided in Appendix A for reference. The daily data used in the analysis ranges from 1 January 2020 to 28 February 2022 which is accessible from the MSCI website.1 The study period includes the COVID-19 crisis which started in the beginning of 2020 till the most recent data. The daily returns are calculated as logarithmic changes in daily closing index prices of the relevant indices. The MSCI ESG Leaders indexes include stocks which have high ESG rating in each sector of the relevant parent index. To obtain evidence in the developed markets, we refer to the World ESG Leaders index. The EM ESG Leaders index gives us a perspective on the emerging markets. The BRIC ESG Leaders index represents the BRIC (Brazil, Russia, India and China) markets which is a group of major emerging markets in the world carrying high global investments stakes. The ACWI ESG Leaders index gives us a global perspective on the subject as it includes both developed and emerging markets. The World index, EM Index, BRIC index and the ACWI index serves as the mainstream global equity portfolio. Further, all indices in the study consists of large and mid-capitalisation stocks. Therefore, the ESG Leaders indexes are similar to the benchmark mainstream counterparts in respect to the composition of the size of stocks included in the index. This is pertinent for unbiased results (Ahern, 2009). The summary statistics for the relevant indexes is provided in Table 1.
Summary Statistics
Stationary Variables
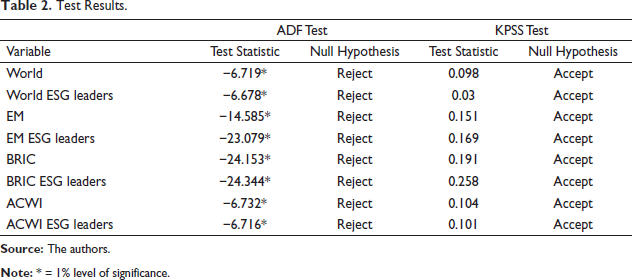
Before estimation of the model, we must ensure that the data series is stationary (Shakeel & Srivastava, 2019). The ADF test (Dickey & Fuller, 1979) and the KPSS test (Kwiatkowski et al., 1992) is employed on the return data of the indices for the purpose. The null hypothesis to be tested in case of the ADF test is that there is unit root in the data while in case of the KPSS test, the null hypothesis is that the data is stationary. In Table 2, the test statistic for the ADF test and the KPSS test is presented along with the test results. The data is stationary for the variables under consideration and therefore, we can proceed with further analysis of the data using the Markov regime switching model.
Test Results.
Empirical Model
We use the two state Markov regime switching model (Lin & Falk, 2021; Liu et al., 2012) to examine the time-varying risk dynamics of the equity returns for the indexes included in the study. The model effectively captures the shifts in times series behaviour of underlying data and does not require prior determination of time periods with regard to the events which might cause the shift (Pericoli & Sbracia, 2003). An unobservable regime prevails for a random period of time after which it switches to another regime (Saji, 2019). From the model, we can estimate the probabilities of switches from one regime to another along with the length of time it takes to switch between regimes. The analysis is based within the framework of the classical capital asset pricing model. We are guided by Stapleton and Subrahmanyam (1983) and Lin and Falk (2021) in the choice of the model used in this paper and the model is given below:

In Equation (1), s is the unobservable state (regime) taking the value 1 when the process is in state 1 and 2 when the process is in state 2 respectively. The model follows a first-order Markov process and the parameters are regime dependent. Further, εt ~ i.i.d.N (O,σ2). The Broyden, Fletcher, Goldfarb and Shanno (BFGS) method is used for model estimation guided by Czech and Wielechowski (2021). Returnt,i is the index return at time t given by the World ESG Leaders index, Emerging Markets (EM) ESG Leaders index, BRIC ESG Leaders index and the ACWI ESG Leaders index respectively. Markett,m is the market return at time t given by the World Index, EM Index, BRIC Index and the ACWI Index respectively. The selection of the benchmark model is guided by Ahern (2009). The beta (β) captures the systematic risks of the ESG portfolio and the volatility parameter (σ) captures the idiosyncratic risk of the ESG portfolio in different regimes. Beta equal to 1 implies that returns of ESG equity portfolios fluctuate to the same degree as the market returns. Beta less (more) than 1 implies that the return of the ESG equity portfolio fluctuate less (more) than the market return. In line with the objective of the study, we are primarily interested in the measure of beta and the volatility of the ESG equity investments and therefore, the intercept term in the CAPM model is not relevant (Lin & Falk, 2021; Liu et al., 2012). The transition probability that regime i will be followed by regime j is given by the following matrix:

Where i, j =1 and 2.
The regimes can be classified based on the values of the volatility parameter σ1 and σ2.
Where s = 1and 2 and i, j = (1, 2).
We also present the smoothed transition probabilities between crisis regime and calm regime during the period of the study. As an additional robustness check, we also test the performance of the Markov regime switching model used in the analysis against ordinary least squares (OLS) and the asymmetric exponential GARCH based estimates guided by Liu et al. (2012). Guided by Engle and Ng (1993), the mean and the variance equation of the EGARCH (1, 1) is specified as:

In Equation (4), yt is the index return at time t, mt is the market return at time t and the error term is εt and in Equation (5), the conditional variance is given by ht, ω is the constant, α is the ARCH term, δ is the GARCH term and γ is the asymmetric term.
The OLS estimate is specified as:

In Equation (6), yt is the index return at time t, mt is the market return at time t and the error term is εt.
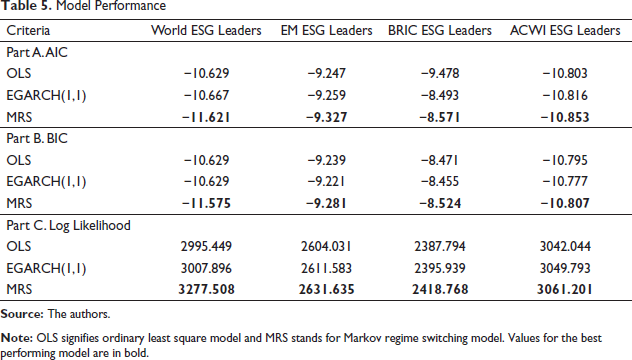
The widely used minimum Akaike information criterion (AIC), Baynesian information criterion (BIC) and the greater log-likelihood criterion is used for the purpose of performance evaluation of the competing models (Liu et al., 2012; Psaradakis & Spagholo, 2003).
Analysis
Testing the Presence of Two Regimes
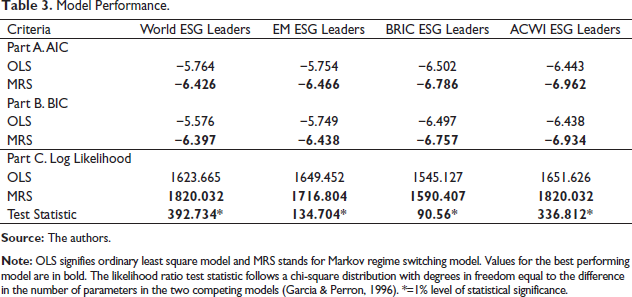
We start our analysis by examining if there is evidence for two distinct regimes in the returns of the World ESG Leaders index, Emerging Markets (EM) ESG Leaders index, BRIC ESG Leaders index and the ACWI ESG Leaders index included in the study. We first fit the return data series for each of the indices to a simple linear model with constant mean and volatility and compare its performance with the two state Markov Regime Switching model with no regressor. Our approach is guided by Liu et al. (2012). We present the AIC, BIC and the log-likelihood values for the two models in Table 3. We can observe that the Markov regime switching model is favoured by minimum AIC and BIC criterion for all the indices included in the study supporting the presence of two distinct regimes for all the indices. Further, the greater log-likelihood criterion also favours the Markov regime switching model for all the indices included in the study supporting the presence of two distinct regimes for all the indices. We also employ the Likelihood Ratio (LR) test (Garcia & Perron, 1996; Hansen, 1992; Liu et al., 2012) to compare the models for each of the indices included in the study. The test compares the log likelihoods values of two models and tests whether this difference is statistically significant. The LR test statistic is calculated in the following way:
LR test statistic= 2{loglik (Model 2) – loglik (Model 1)}
Where, loglik is the log likelihood value. Model 1 is the simpler model with lesser parameters than the model 2.The values for the test are presented in part D of Table 3. The computed values are in excess of the critical values of the 5% and 1% critical values of 13.52 and 17.67 respectively (Garcia & Perron, 1996). This underscores the appropriateness of the Markov regime switching model in the analysis as we confirm the presence of two distinct regimes in the returns of the indices included in the study.
Model Performance.
Further, we also examine if the two state model would suffice by running the same analysis with three states for each return series. However, we observe that none of the return series for the indices included in the study have statistically significant parameters for the three state model. Therefore, we may proceed with the two state model. For the sake of brevity, we do not report the results of the analysis in the article.
Results from Markov Regime Switching Model
In this section, we present the estimated results of the Markov regime switching model in Table 4. For the World ESG Leaders index, regime 1 is classified as the crisis period and regime 2 is taken as the calm period based on the estimate of the volatility parameter (σ1 > σ2). Thus, we observe that the idiosyncratic risk for the ESG equity portfolio representing the developed markets increases during the crisis period. Further, the ESG equity portfolio representing the developed markets have higher systematic risks with reference to the mainstream portfolio during the pandemic in the crisis period (β1 > 1) while it had lower systematic risks with reference to the mainstream portfolio during the pandemic in the calm period (β2 < 1). The coefficient estimate of the systematic risks is statistically different in the two regimes as indicated by the Wald test. This signifies that there is a statistically significant change in the systematic risks of the ESG equity portfolio representing the developed markets during the crisis and the calm periods. The probability of staying in the crisis regime is lower compared to the calm regime (
Estimated Coefficients of Markov Regime Switching Model
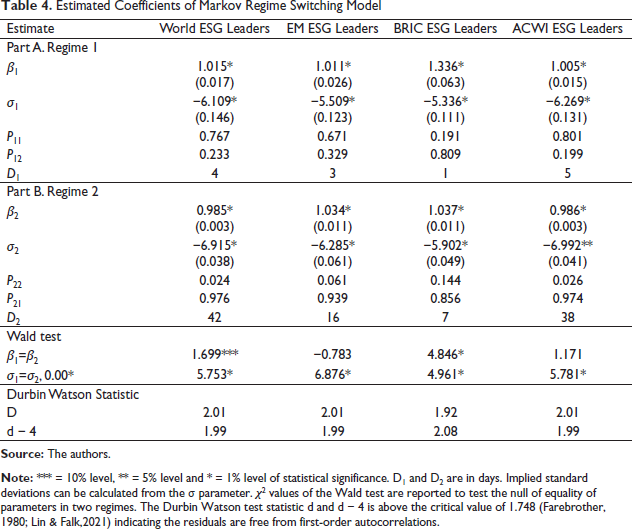
For the EM ESG Leaders index, regime 1 is classified as the crisis period and regime 2 is taken as the calm period based on the estimate of the volatility parameter (σ1 > σ2). Thus, we observe that the idiosyncratic risk for the ESG equity portfolio representing the emerging markets slightly decreases during the crisis period. Further, the ESG equity portfolio representing the emerging markets have higher systematic risks with reference to the mainstream portfolio during the pandemic in the crisis period as well as the calm period (β1, β2 > 1). The coefficient estimate of the systematic risks is not statistically different in the two regimes as indicated by the Wald test. This signifies that there is no statistically significant change in the systematic risks of the ESG equity portfolio representing the emerging markets during the crisis and the calm periods. The probability of staying in the crisis regime is lower compared to the calm regime (
For the BRIC ESG Leaders index, regime 1 is classified as the crisis period and regime 2 is taken as the calm period based on the estimate of the volatility parameter (σ1 > σ2). Thus, we observe that the idiosyncratic risk for the ESG equity portfolio representing the BRIC markets increases during the crisis period. Further, the ESG equity portfolio representing the BRIC markets have higher systematic risks with reference to the mainstream portfolio during the pandemic in the crisis period as well as the calm period (β1, β2 > 1). The coefficient estimate of the systematic risks is statistically different in the two regimes as indicated by the Wald test. This signifies that there is a statistically significant change in the systematic risks of the ESG equity portfolio representing the BRIC markets during the crisis and the calm periods. The probability of staying in the crisis regime is lower compared to the calm regime
(P11
As a robustness check for the evidence from the study, we once again do the analysis for the ACWI ESG Leaders index which includes both developed and emerging markets. The results for the ACWI ESG Leaders index would reflect the nuances of time-varying systematic and idiosyncratic risks of ESG equity investments at the global level and complement the evidence for the developed and emerging markets in the study. For the ACWI ESG Leaders index, regime 1 is classified as the crisis period and regime 2 is taken as the calm period based on the estimate of the volatility parameter (σ1 > σ2). Thus, we observe that the idiosyncratic risk for the ESG equity portfolio representing the global markets increases during the crisis period. Further, the ESG equity portfolio representing the global markets have higher systematic risks with reference to the mainstream portfolio during the pandemic in the crisis period
(β1 > 1) while it had lower systematic risks with reference to the mainstream portfolio during the pandemic in the calm period (β2 < 1). The coefficient estimate of the systematic risks is not statistically different in the two regimes as indicated by the Wald test. This signifies that there is no statistically significant change in the systematic risks of the ESG equity portfolio representing the global markets during the crisis and the calm periods. The probability of staying in the crisis regime is lower compared to the calm regime (
Smoothed Transition Probabilities of Regimes
In Figure 1, we present the smoothed transition probabilities between crisis regime and calm regime during the period of the study to visualise the model effectiveness in capturing the regime shifts associated with known events. We can observe that the Markov regime switching model effectively captures the transition in regimes (from calm regime to crisis regime) at the beginning of the pandemic with probability of crisis regime close to 1 for each of the indices included in the study. The subsequent regime shifts during the period of the COVID-19 crisis reflects the uncertainty as the pandemic continues to evolve. Thus, we can conclude that the model is effective in reflecting the dynamics of the indices under study.

Additional Checks for Model Performance
We present the estimated AIC, BIC and the log likelihood values for the OLS, EGARCH (1,1) and the Markov regime switching model for the World ESG Leaders index, EM ESG Leaders index, BRIC ESG Leaders index and the ACWI ESG Leaders index in Table 5. We observe that the Markov regime switching model used in the study performs better than the OLS and EGARCH (1,1) model for estimation of the parameters based on the minimum AIC and BIC criteria as well as the greater log likelihood criterion for all the indices. It may be added that the character of the evidence based on the OLS and EGARCH (1, 1) model conforms to the evidence based on the Markov regime switching model. However, the estimated parameters from the OLS and EGARCH (1,1) models are not reported for brevity.
Model Performance
Conclusion
In this article, we examine the time-varying systematic and idiosyncratic risks associated with ESG equity investments using Markov Regime Switching model. For this purpose, we refer to the relevant MSCI global indices based on ESG principles for developed markets, emerging markets and BRIC markets. The evidence in the study highlights the time-varying behaviour of beta and volatility in ESG indices. We observe that the ESG equity portfolio have higher systematic risk with reference to the mainstream equity portfolio for the developed markets, emerging markets and BRIC markets in the crisis periods of the market during the pandemic. Our results for the global ESG equity portfolio are also consistent with the findings for developed and emerging markets which signify the robustness of the evidence. Further, we observe that the ESG equity portfolio have lower systematic risk representing the developed markets and global equity markets in the calm periods of the market during the pandemic with reference to the mainstream equity portfolio while the emerging markets and BRIC ESG equity portfolios have higher systematic risk with reference to the mainstream equity portfolio in the calm periods of the market during the pandemic. Further, the systematic risk is statistically higher in the crisis period compared to the calm period for developed markets and BRIC markets while we observe no statistically significant difference in the systematic risk in the crisis and calm period for the emerging markets and global ESG equity portfolios. Besides, we also establish the superior performance of the Markov regime switching model compared to competing OLS and GARCH based estimates which underscore the robustness of the results from a methodological perspective.
Managerial Implications
From our study, investors, portfolio managers and corporate entities gain insights on the risk profiles of ESG investments for developed markets, emerging markets, BRIC markets as well as globally and the evidence facilitate informed investment decisions during the COVID-19 crisis. Investors are exposed to higher risks in ESG equity portfolios during crisis periods which contradicts the findings of studies such as Albuquerque et al. (2019), Bénabou and Tirole (2010), Hoepner et al. (2019), Managi et al. (2012), Nofsinger and Varma (2014), Ortas et al. (2012), and more recently Jin (2022). The evidence is consistent with the findings of the Palova et al. (2022). Further, the risk dynamics of the ESG investment portfolios differs in different geographic regions which must be interpreted in the context of the finding of Cunha et al. (2020). The higher systematic risks for ESG investments in emerging markets may be explained in terms of the country weights and sectoral weights. For instance, it may be mentioned that EM ESG Leaders Index and the BRIC ESG Leaders index have high exposure to stocks from China and India which have been the worst affected countries from the COVID-19 pandemic. Further, the ESG portfolio for emerging markets have large exposure to sectors like financials and consumer discretionary which have been affected by the COVID-19 pandemic. Our work does not imply that ESG investments have pessimistic outlook as the long term economic consequences of ESG initiatives by businesses are positive as observed by Managi et al. (2012).
Limitations
Our work primarily provides evidence on the time-varying risks dynamics of ESG investments for developed and emerging markets during the ongoing COVID-19 crisis. The pandemic is yet to run its full course. As a follow up study, future work could explore the time-varying risks ESG equity portfolios with an extended time frame. Besides, future research could also explore the time-varying risks in country specific ESG equity portfolios
Appendix A: List of Countries
Footnotes
Acknowledgement
The authors are grateful to the anonymous referees of the journal for their extremely useful suggestions to improve the quality of the article. Usual disclaimers apply.
Declaration of Conflicting Interests
The authors declared no potential conflicts of interest with respect to the research, authorship and/or publication of this article.
Funding
The authors received no financial support for the research, authorship and/or publication of this article.
