




Abstract
Digital marketing communication has affected consumer behaviour across product categories like books, music, fashion accessories, clothing, banking, online gaming, and so on. However, the automobile industry, despite being one of the largest digital spenders in India for past many years, has faced a dearth of academic studies. The objective of the research is to investigate the Indian car buyers’ decision to use digital marketing communication while buying a car using Decomposed Theory of Planned Behaviour model (DTPB). Data was collected from 801 actual and potential car buyers from Delhi. Structural equation modelling was used to assess the overall fit and explanatory power of the model. The DTPB model successfully explained 63 per cent of the variation in usage intentions. Attitude, subjective norms and perceived behavioural control were found to be the significant determinants affecting usage intentions and actual usage of digital marketing communication.
Keywords
Introduction
The most common reason for which customers switch over to the competitors is the insufficient communication they receive from a previous provider (Merisavo et al., 2007). Modern digital technology has emerged as a contemporary and relevant communication channel that not only establishes an affordable interaction with the customer but also hands over the control to the latter (Klososky, 2012). Consumers are exercising their choice in selecting which digital information they are exposed to (Prahalad & Ramaswamy, 2004). Consumers have now become ‘prosumers’, whereby consumers are not only at the receiving end but are also getting actively involved in co-creating, customizing and passionately promoting the marketing content in a socially connected era (Gerhardt, 2008). Consumers’ possession of digital devices is on the rise, which is resulting in smarter, informed, connected, updated and empowered customers. Consumers are comfortably using digital information for various purposes ranging from search, navigation, comparing, networking, buying and selling to expressing themselves (Lovett, 2013).
Digital medium has been acknowledged as the frontrunner of marketing communication owing to its specific characteristics, benefitting consumers and marketers by including interactivity (Deighton, 1996), measurability (Hemann & Burbary, 2013), customization (Hawks, 2015), informative (Wind & Mahajan, 2002), relevant (Corniani, 2006), individual (Bird, 2007), quick (McDonald & Wilson, 1999), entertaining (Koiso-Kanttila, 2004), convenient (Becherer & Halstead, 2004) and cost-effective (Klososky, 2012). Digital media provides a broad platform to acquire new customers and engage with them meaningfully, which in turn helps spreading awareness about brands, building brand image and positioning the brand in target customers’ mind (Holliman & Rowley, 2014).
Indian automobile sector has been one of the largest producers of online conversations and one of the top digital spenders since the year 2009 (Google, 2012; Infosys View Point, 2013). Spend on digital media by marketers is registering an increase with each passing year. In the year 2010, 10 per cent of total advertising budget was spent on digital platforms by Indian passenger car market payers, which rose to 14 per cent by the year 2013 (IAMAI & IMRB, 2013). Indian automotive industry was ranked number one for social media spending for a period ranging from year 2009 to 2013 with 114 per cent growth rate. The social media advertising spend was further expected to increase by 41 per cent during 2014–2018 (Anvesh, 2016). The automobile sector contributed the most towards digital ad spending in India in the year 2015 just after FMCG. The automobile sector is also expected to be the top digital spender for the year 2016–2017, with about 13 per cent of its advertising budget spent over digital platforms (Ramnath, 2016).
Indian car buyers are making use of digital channels of communication in their car buying journey ranging from need recognition to search for information, evaluation of alternatives, selection and purchase to post-purchase behaviour (Capgemini, 2009; Nielsen, 2014; Power, 2015). Indian car buyers are using digital channels of communication as important information sources, evaluating the various brands online, paying attention to reviews, opinions and comments of other customers, peers, friends and experts; joining the online communities, discussion forums, social networking pages of car brands, subscribing to newsletters and promotional e-mails, and finally, expressing their experience and opinion over digital platforms (Bagchi, 2013; Kusuma, 2015; Nataraj & Nagaraja, 2012).
The effect of digital marketing communication along with usage intentions on product categories like books, music, fashion accessories, clothing, banking and services, online gaming, internet and social networking sites usage, green marketing, online trading, personal health, mobile commerce, road safety, and so on, has been well researched by the researchers. But the automobile industry, despite being one of the largest digital spenders, has faced a dearth of academic studies especially in India. Indian researchers have hovered around the features and factors affecting car purchase decisions especially in offline environment (Banerjee, Walker, Deakin & Kanafani, 2010; Chidambaram & Alfred, 2007; John & Pragadeeswaran, 2013; Sudhahar & Venkatapathy, 2005). The gap in the existing body of knowledge was identified and this study was envisaged to fill the gap. An empirical academic study which focuses on analyzing the usage intentions of digital marketing communication while buying a car would offer meaningful insights for the marketers.
Understanding Technology’s Usage Intentions of Consumers: A Review of Decomposed TPB
Technology usage was found significantly affected by attitude, recommendations from friends, relatives and family, skills, capability and resources (Ajzen, 1991; Chiu, Hsu, Sun, Lin & Sun, 2005; Fishbein & Ajzen, 1975). Impact of digital marketing communication, which is a technology driven process, can be analyzed by using DTPB model. DTPB has been successfully used by researchers like Shih and Fang (2004), Hsu and Chiu (2004), Hsieh, Rai and Keil (2008), Smarkola (2008), Hung, Ku and Chien (2012), Dos Santos and Okazaki (2013), Sahli and Legohérel (2015) and Gangwal and Bansal (2016) in various product categories like internet banking, digital inequality, evidence-based medicine, online tourism, e-learning and mobile commerce.
Decomposed Theory of Planned Behaviour (DTPB) works well, avoiding the drawbacks of other prevalent models like Theory of Reasoned Action (TRA), Technology Acceptance Model (TAM) and Theory of Planned Behaviour (TPB). DTPB handles the situation better than TRA when behaviour of the person is under some constraints. DTPB excels over TAM in situations where behavioural intentions are deeply influenced by social context and consumer’s co-creation of value (Baron, Patterson & Harris, 2006). DTPB explains the behaviour of consumers better than TPB (Chau & Hu, 2001).
Taylor and Todd (1995a) further deconstructed TPB’s three individual constructs to name it as ‘Decomposed TPB’. Attitude was decomposed into three factors, namely perceived usefulness (relative advantage), perceived ease of use (effortless usage) and compatibility (fit with needs of consumers). Subjective norms were decomposed into friends, family and relatives. Perceived behavioural control was deconstructed into self-efficacy, resource facilitating conditions and technology facilitating conditions. Self-efficacy was defined as judgement of the individual about his/her capabilities to perform the desired behaviour. Resource facilitating conditions dealt with availability of the resources like time, money, internet and devices in order to use the technology. Technology facilitating conditions involved beliefs about the authenticity and trustworthiness of the technology (Taylor & Todd, 1995a).
Taylor and Todd (1995b) also conducted a study to compare TAM, TPB and DTPB keeping the common constructs and concluded that DTPB had better explanatory power than TAM and TPB. Hung and Chang (2005), Lin (2007), Huh, Kim and Law (2009) and Hou (2014) in their respective studies concerning predicting usage intentions also reported similar results. Legris, Ingham and Collerette (2003) asserted that explanatory powers of TAM can be significantly improved if social beliefs and capability beliefs can be added to TAM. Rouibah and Ould-Ali (2007), while testing the six competitive models in predicting the intentions to use SMS banking, revealed that DTPB had the best explanation for usage intentions. Brown, Venkatesh and Hoehle (2015) held a similar view in their study which compared seven contemporary models. Smarkola (2011) and Ahmed and Ward (2016) in their student centric studies compared TAM and DTPB and posited that DTPB explained users’ intentions better than TAM. Keeping in mind the earlier researches and explanatory power of the competing models, the DTPB model (Figure 1) was used in the study.
Hypothesis Formulation
Literature suggests that DTPB has been successful in explaining usage intentions in a technology-mediated environment. DTPB’s three constructs, namely attitude, subjective norms and perceived behavioural control, affect the usage intentions, which in turn affect the actual usage. So, following hypotheses were postulated for the current study:
Research Methodology
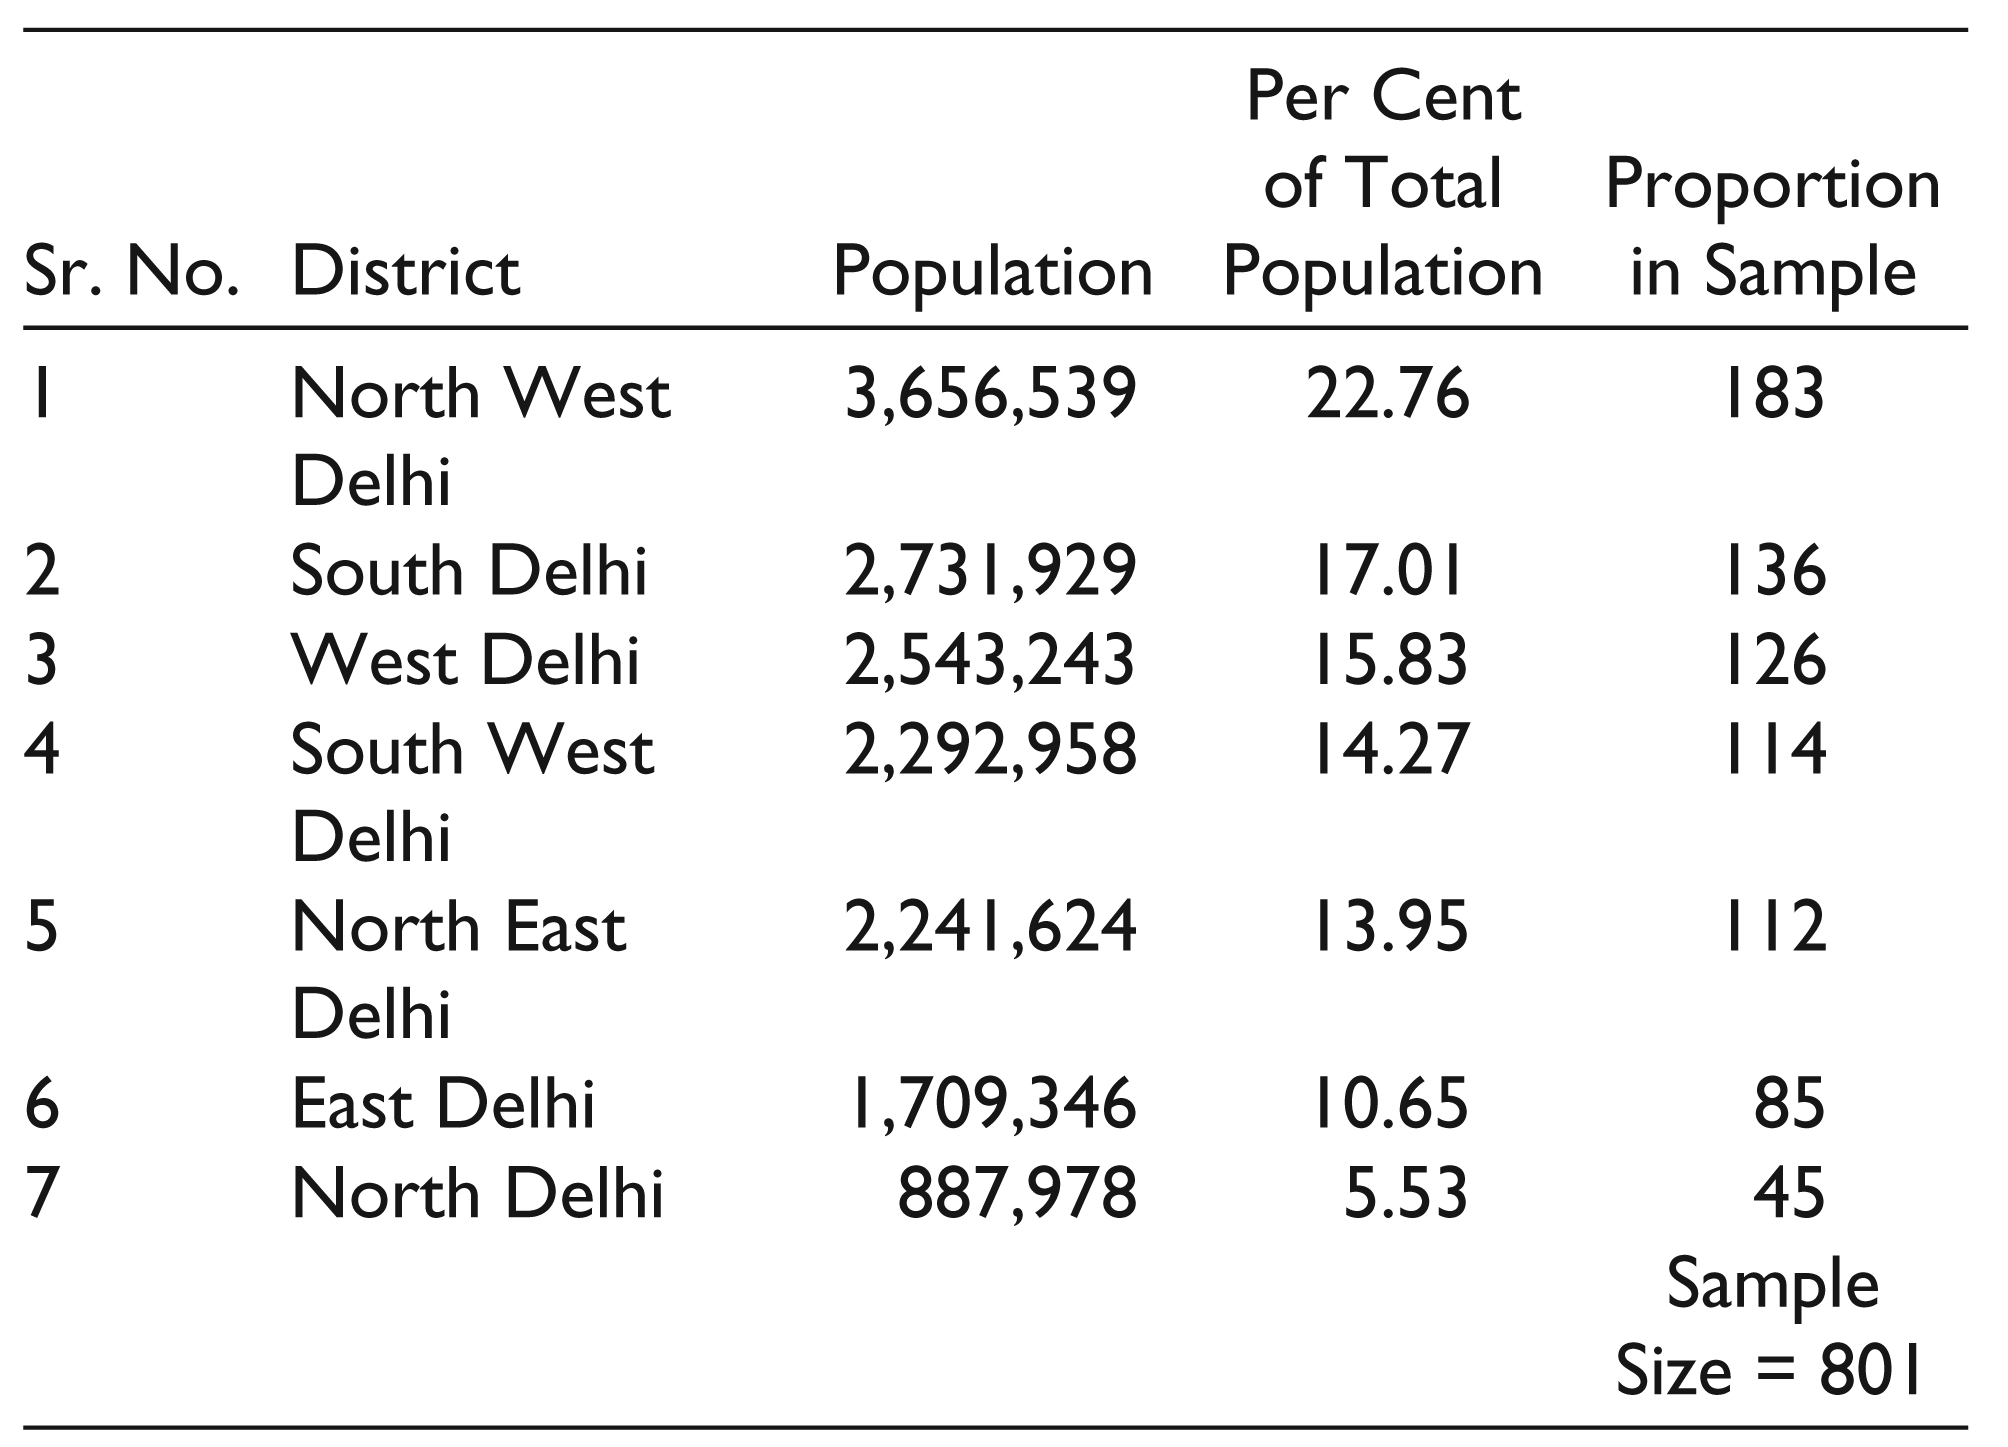
A cross-sectional descriptive study was conducted banking heavily upon primary data. The study made use of structured questionnaire prepared using the 5-point Likert scale. Population proportion approach was used to determine the sample size with z value taken as 95 per cent, margin of error as 3.5 per cent and p value of 0.5 indicating maximum variability (Ary, Jacobs & Razavieh, 1996; Chawla & Sondhi, 2011). A sample size of 801 was obtained using the proportion approach. Area-wise proportionate cluster sampling (Malhotra & Dash, 2012) was used to collect the data from the respondents. Census 2011 was considered as sampling frame for the study. A total of 801 responses were collected from the study’s sampling area Delhi. The proportion of respondents in the sample was kept same as it was in the population in each district. Table 1 gives the sampling details of the study.

Sampling Details of the Study
A respondent in the study was any person in the family who had a car (car owner) or planned to buy a car in near future, that is, a potential customer. Structural equation modelling was used to assess the overall fit and explanatory power of the model and testing the hypotheses using Amos version 20.0.
Decomposed Theory of Planned Behaviour: Construction of the Scale
Literature review elicited commonly held beliefs pertaining to constructs of DTPB. Table 2 illustrates the references used for identifying the commonly held belief related to the constructs/items of DTPB.
The most common beliefs were transformed into a set of statements keeping the product of the study in question, that is, a car. Each behavioural belief statement was followed by another statement expressing a positive or negative evaluation, motivation to comply, or facilitating or inhibiting a condition of the belief statement. For each belief, the belief score on the scale was multiplied by the relevant evaluation score. Constructs like perceived usefulness, perceived ease of use, compatibility, subjective norms (except S1), self-efficacy, resource facilitating conditions and technology facilitating conditions were measured and scored in the similar manner. Constructs like attitude, subjective norm (S1 only), perceived behavioural control, usage intentions and actual usage were measured directly by taking the average score of the statements forming the construct (Francis et al., 2004). Scale used for DTPB has been attached in the annexure.
Decomposed TPB Constructs and Reference Studies

The Sample Statistics
Thirty-six per cent of the sample was represented by the respondents falling into the age group of 18 to 25 years. 46 per cent of the respondents held a graduate degree and 35 per cent of the respondents held a postgraduate degree. 42 per cent of respondents belonged to income group of above four lakhs and below eight lakhs. Student respondents represented 29 per cent of the sample, whereas 40 per cent of the respondents were in service. Male respondents constituted 64 per cent of the sample, whereas female respondents formed 34 per cent of the sample. Urban area constituted 45 per cent of the sample, and semi-urban area formed 28 per cent of the sample. Rural area represented 27 per cent of the sample. The study included all the communication channels used by Indian passenger car marketers, namely website, social networking sites, phone, YouTube, digital TV, digital outdoors, online communities, and so on. 75 per cent of the respondents used at least one channel of communication while buying a car. 25 per cent of the respondents only believed in traditional channels of communication while buying a car.
Understanding the Usage Intentions: The Analysis
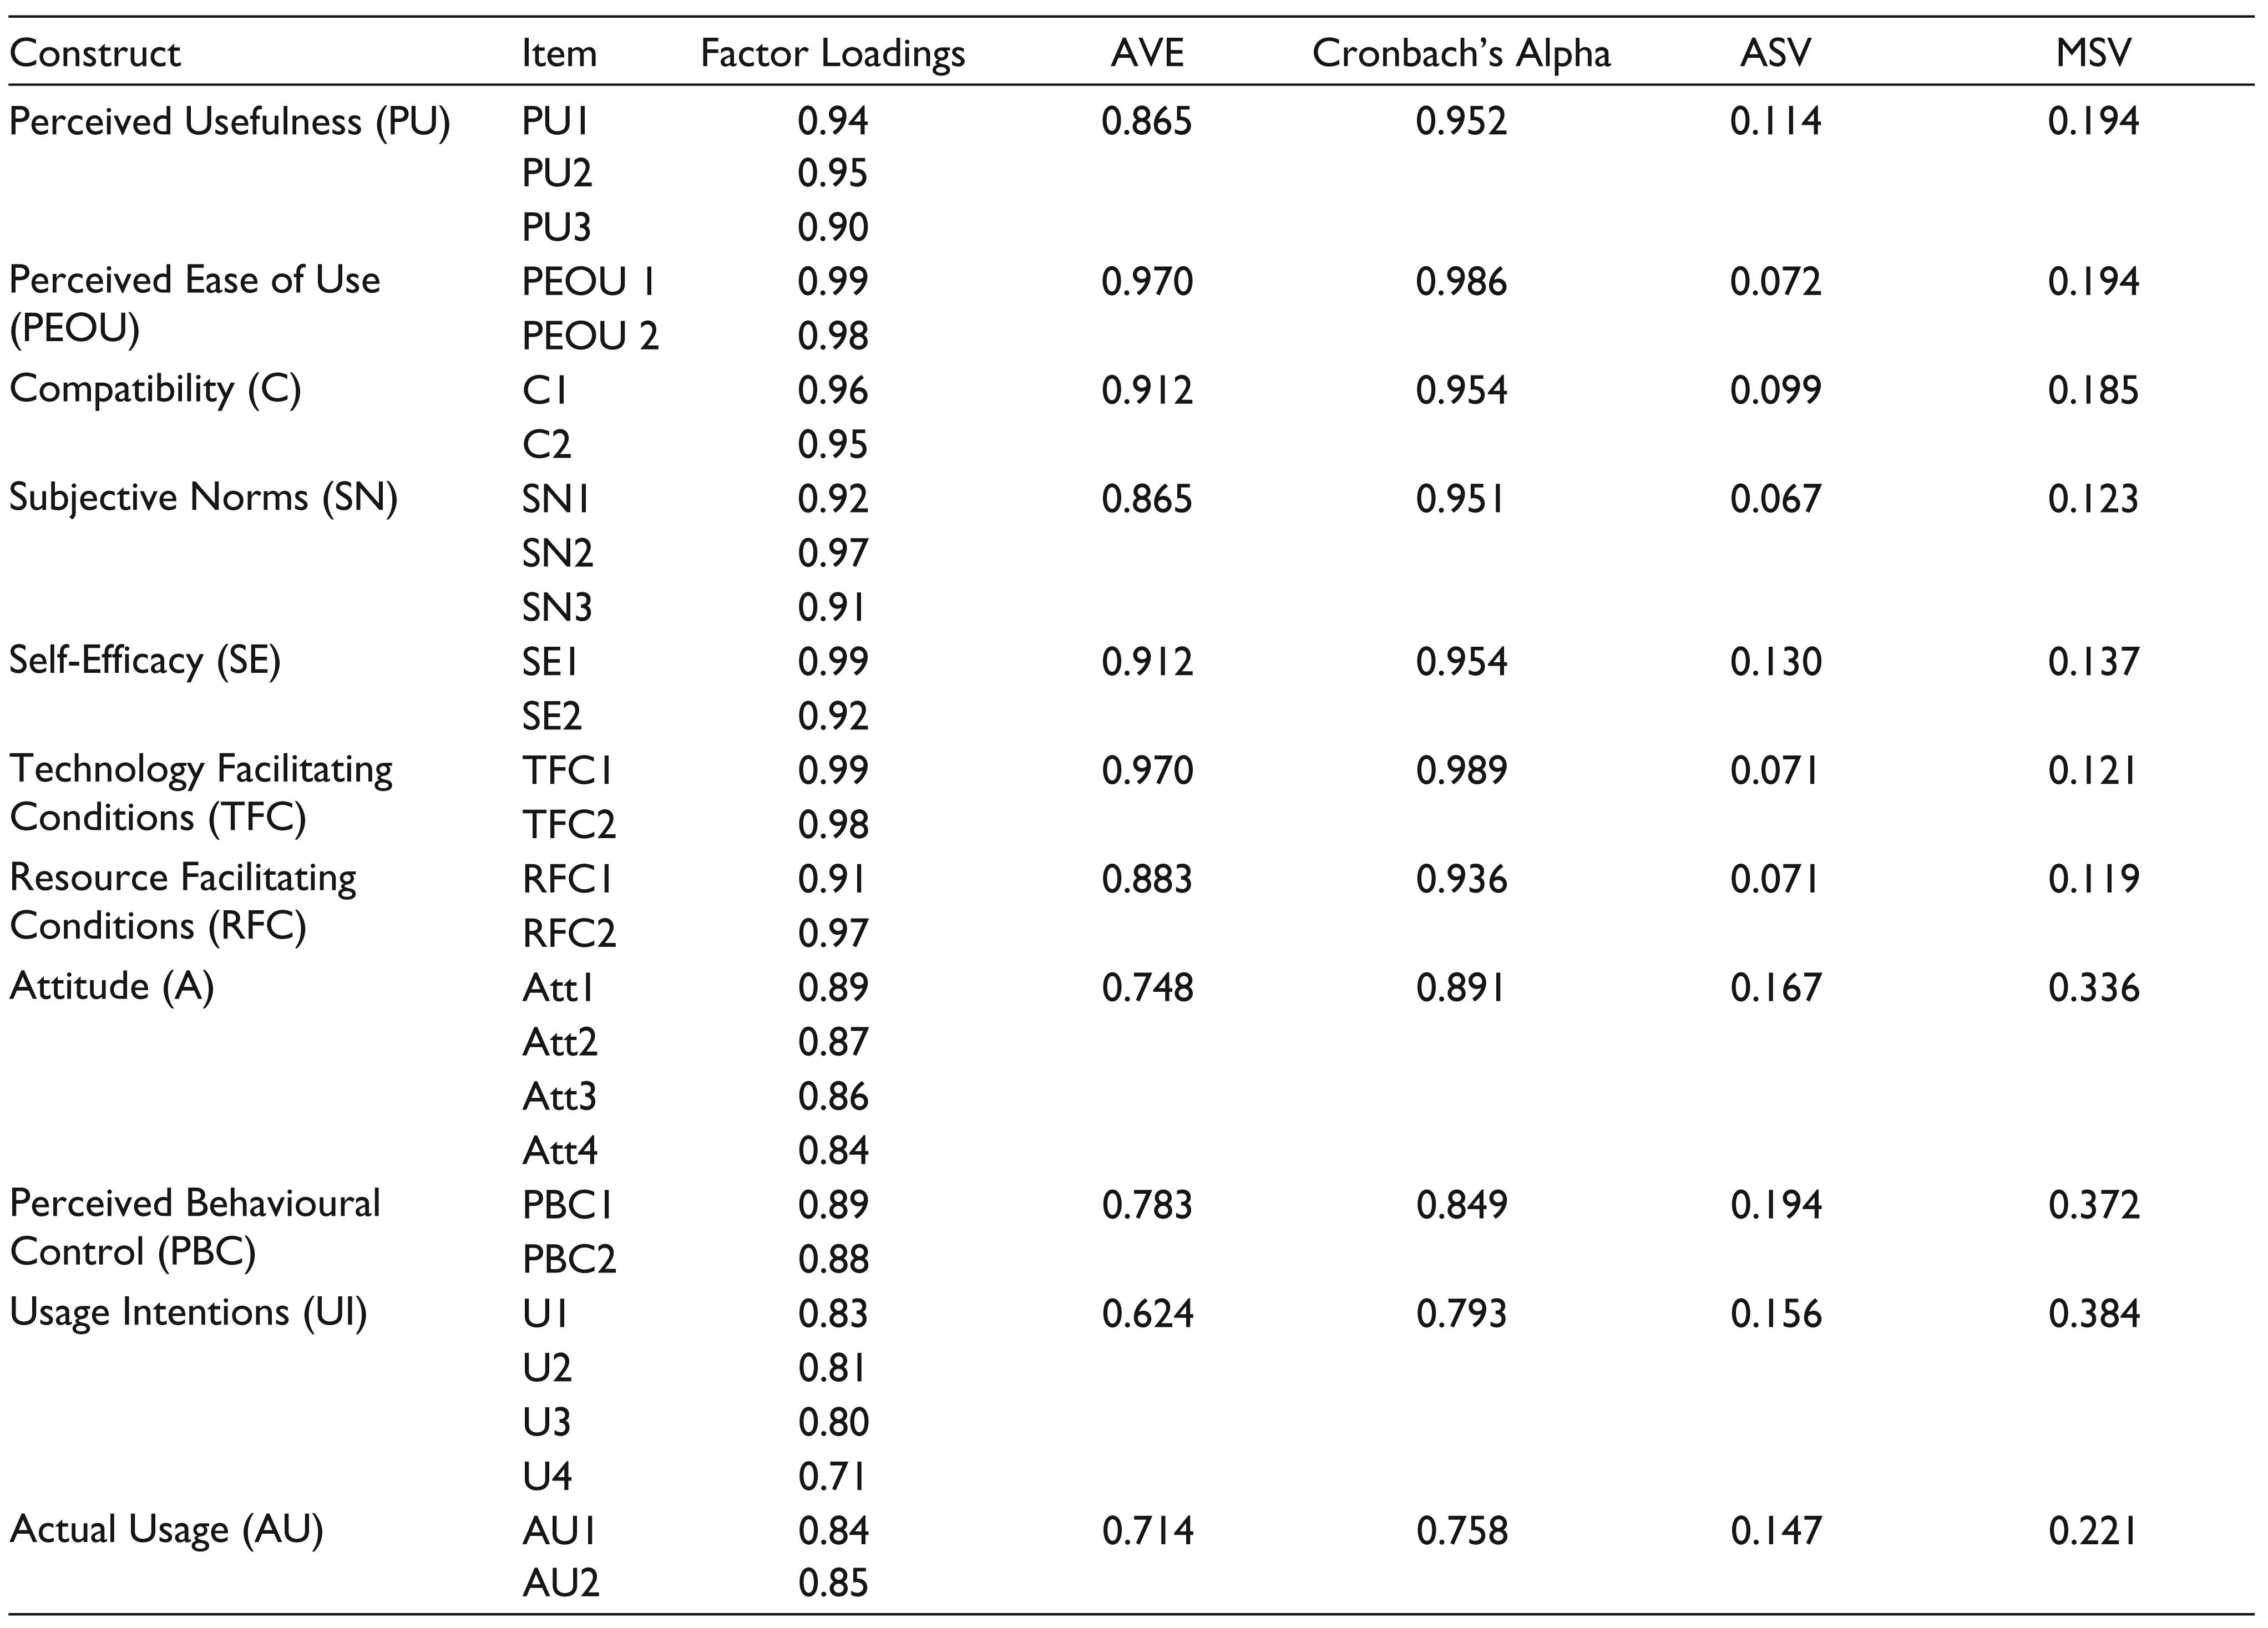
Measurement model was applied using confirmatory factor analysis which also established reliability and validity of the scale. Kaiser-Meyen-Olkin (KMO) measure representing sample adequacy (value = 0.832, sig at 0.05 level) and Bartlett’s test of sphericity (sig at 0.05 level) were conducted to ensure the suitability of confirmatory factor analysis (Hair, Black, Babin, Anderson & Tatham, 2006). Content validity was established by phrasing scale items in tandem with the well- accepted model of Taylor and Todd (1995) and pre-testing the questionnaire. Convergent validity was checked with the help of factor loading and variance extracted. Factor loadings for all the items exceeded the cut off value of 0.6 (Bagozzi & Yi, 1988). Average Variance Extracted (AVE) was found to be more than the recommended level of 0.5 (Farrell, 2010). Discriminant validity was assessed by using Maximum Shared Variance (MSV) and Average Shared Variance (ASV). MSV was found to be less than AVE and more than ASV. All these measures established discriminant validity. Reliability of each construct was checked with the help of Cronbach’s alpha whose value above 0.7 indicated internal consistency in the scale (Nunnally & Bernstein, 1994). Table 3 presents the validity and reliability details of the scale.
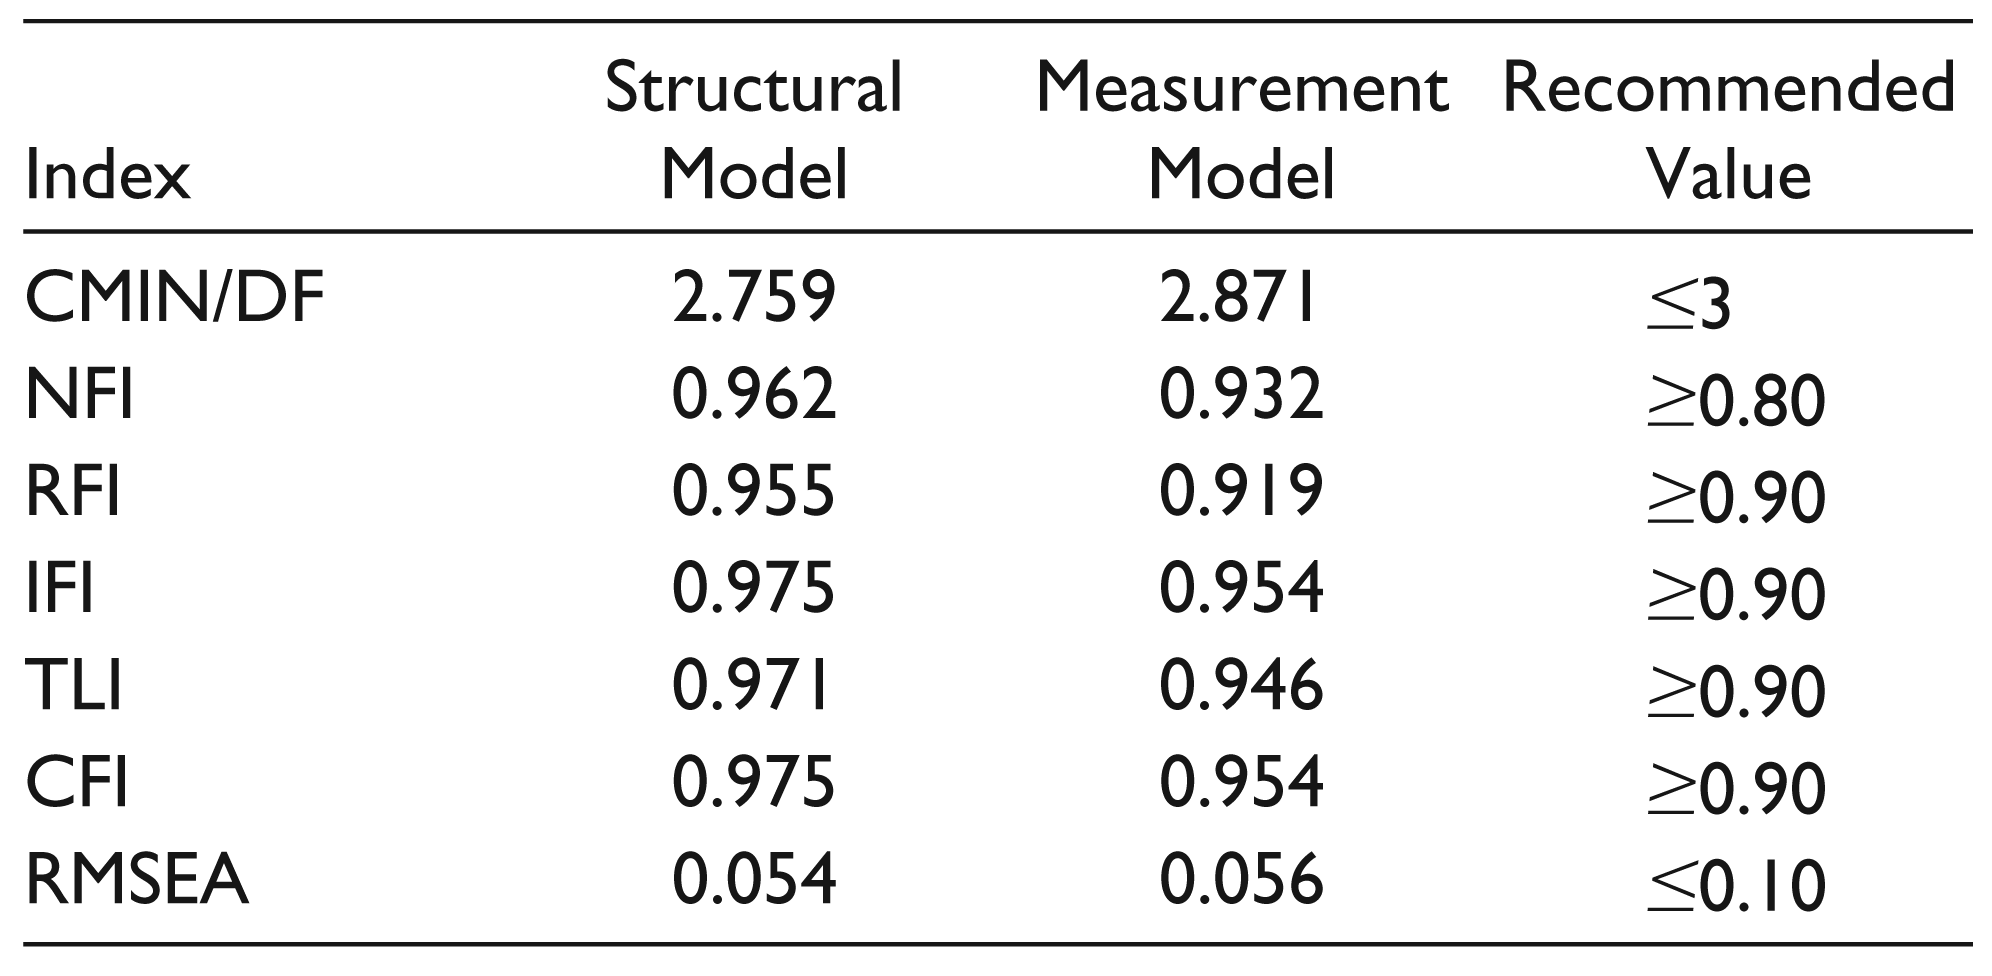
Measurement and structural indices were analyzed to indicate the model fit. Value of Chi-square (χ2) known as ‘CMIN’ was found to be less than the recommended value of 3 (Bagozzi & Yi, 1988). ‘Root Mean Square Error of Approximation’ (RMSEA) value was found to be less than the recommended value of 0.08 (Browne & Cudeck, 1993). Other goodness of fit indices like NFI (Normed Fit Index), RFI (Relative Fit Index), IFI (Incremental Fit Index), TLI (Tucker Lewis index) and CFI (Comparative Fit Index) were found to be exceeding the value of 0.9 indicating a good fit of model. Table 4 represents the model fit indices of DTPB.
Model fit indices indicated that DTPB was successful in predicting the usage intentions of digital marketing communication while buying a car. Figure 2 represents the structural model which indicates the explanatory power of the variables. It can be seen from the figure that perceived usefulness, perceived ease of use and compatibility were significant predictors of attitude. Compatibility explained the maximum variation of 28 per cent, followed by perceived usefulness which explained 26 per cent of the variation. Perceived ease of use explained 10 per cent of the variation in Attitude. All three together explained 20 per cent of the variation in the attitude of the customers towards use of digital marketing communication while buying a car. The structural model suggested the covariance among the perceived usefulness, perceived ease of use and compatibility. Compatibility and perceived usefulness were 53 per cent co-varying with one another, which can be understood with the fact that customers find such technology useful. This doesn’t demand significant change in behaviour and fits the way customers search for information. The function for attitude could be written as in Equation (1):

Family, friends and online friends were significant predictors of subjective norms and explained 31 per cent of the variation in the latter. Family explained the maximum 97 per cent of the variation in the subjective norms, followed by 92 per cent of the variation explained by friends. The regression function for subjective norms could be written as in Equation (2):

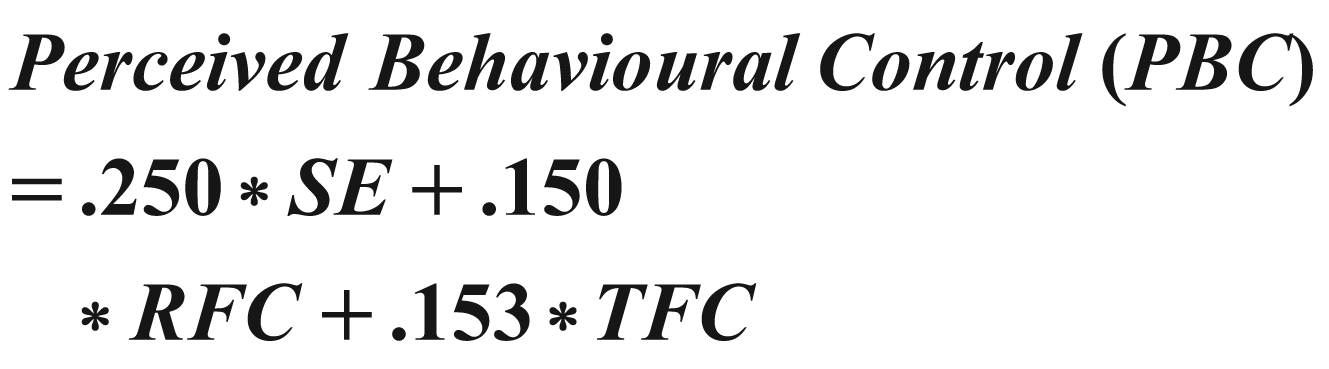
Self-efficacy, resource facilitating conditions and techno-logy facilitating conditions also significantly affected perceived behavioural control and explained 13 per cent of the variation. Self-efficacy explained the maximum 25 per cent of the variation in perceived behavioural control. The model also suggested the covariance among self-efficacy, resource facilitating conditions and technology facilitating conditions. The association among the three constructs of perceived behavioural control can be understood as availability of resources like money and time would motivate customers to try and use new technology. Trustworthy and compatible information with multiple digital devices would further instil confidence in the customers that they may be able to use the technology with somebody’s help. The function for perceived behavioural control could be written as in Equation (3):
Validity and Reliability of the Scale (Decomposed TPB)
Model Fit Indices of DTPB
Attitude, subjective norms and perceived behavioural control taken together significantly affected the usage intentions and explained 63 per cent of the variation. Perceived behavioural control explained a maximum of 57 per cent of the variation in the usage intentions of the customers, followed by attitude which explained 50 per cent of the variation in usage intentions. Subjective norms explained 15 per cent of the variation in usage intentions. The function for digital marketing communication’s usage intentions could be written as in Equation (4):

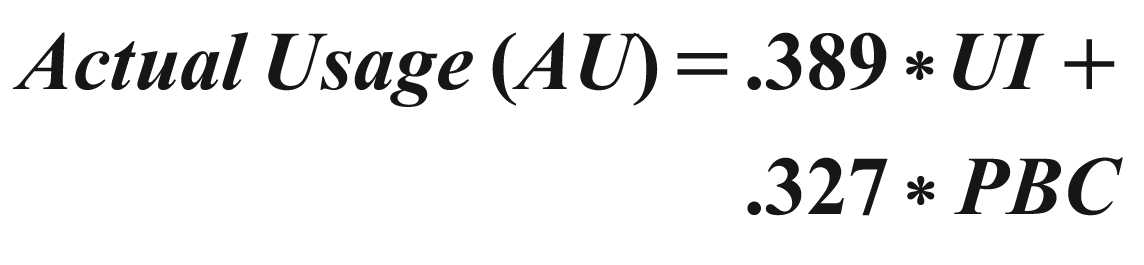
Usage intentions, which were considered proxy to actual usage, were found significantly affecting actual usage and explained 39 per cent of the variation. Perceived behavioural control also significantly affected actual usage and explained 33 per cent of the variation. Perceived behavioural control and usage intentions together explained 41 per cent variation in actual usage of digital marketing communication while buying a car. So, it can be concluded that perceived behavioural control had the maximum potential to affect the digital marketing’s usage intentions while buying a car. This variable, if leveraged by the marketers, can help the marketers to market the given product more effectively. The function for digital marketing communication’s actual usage could be written as in Equation (5):
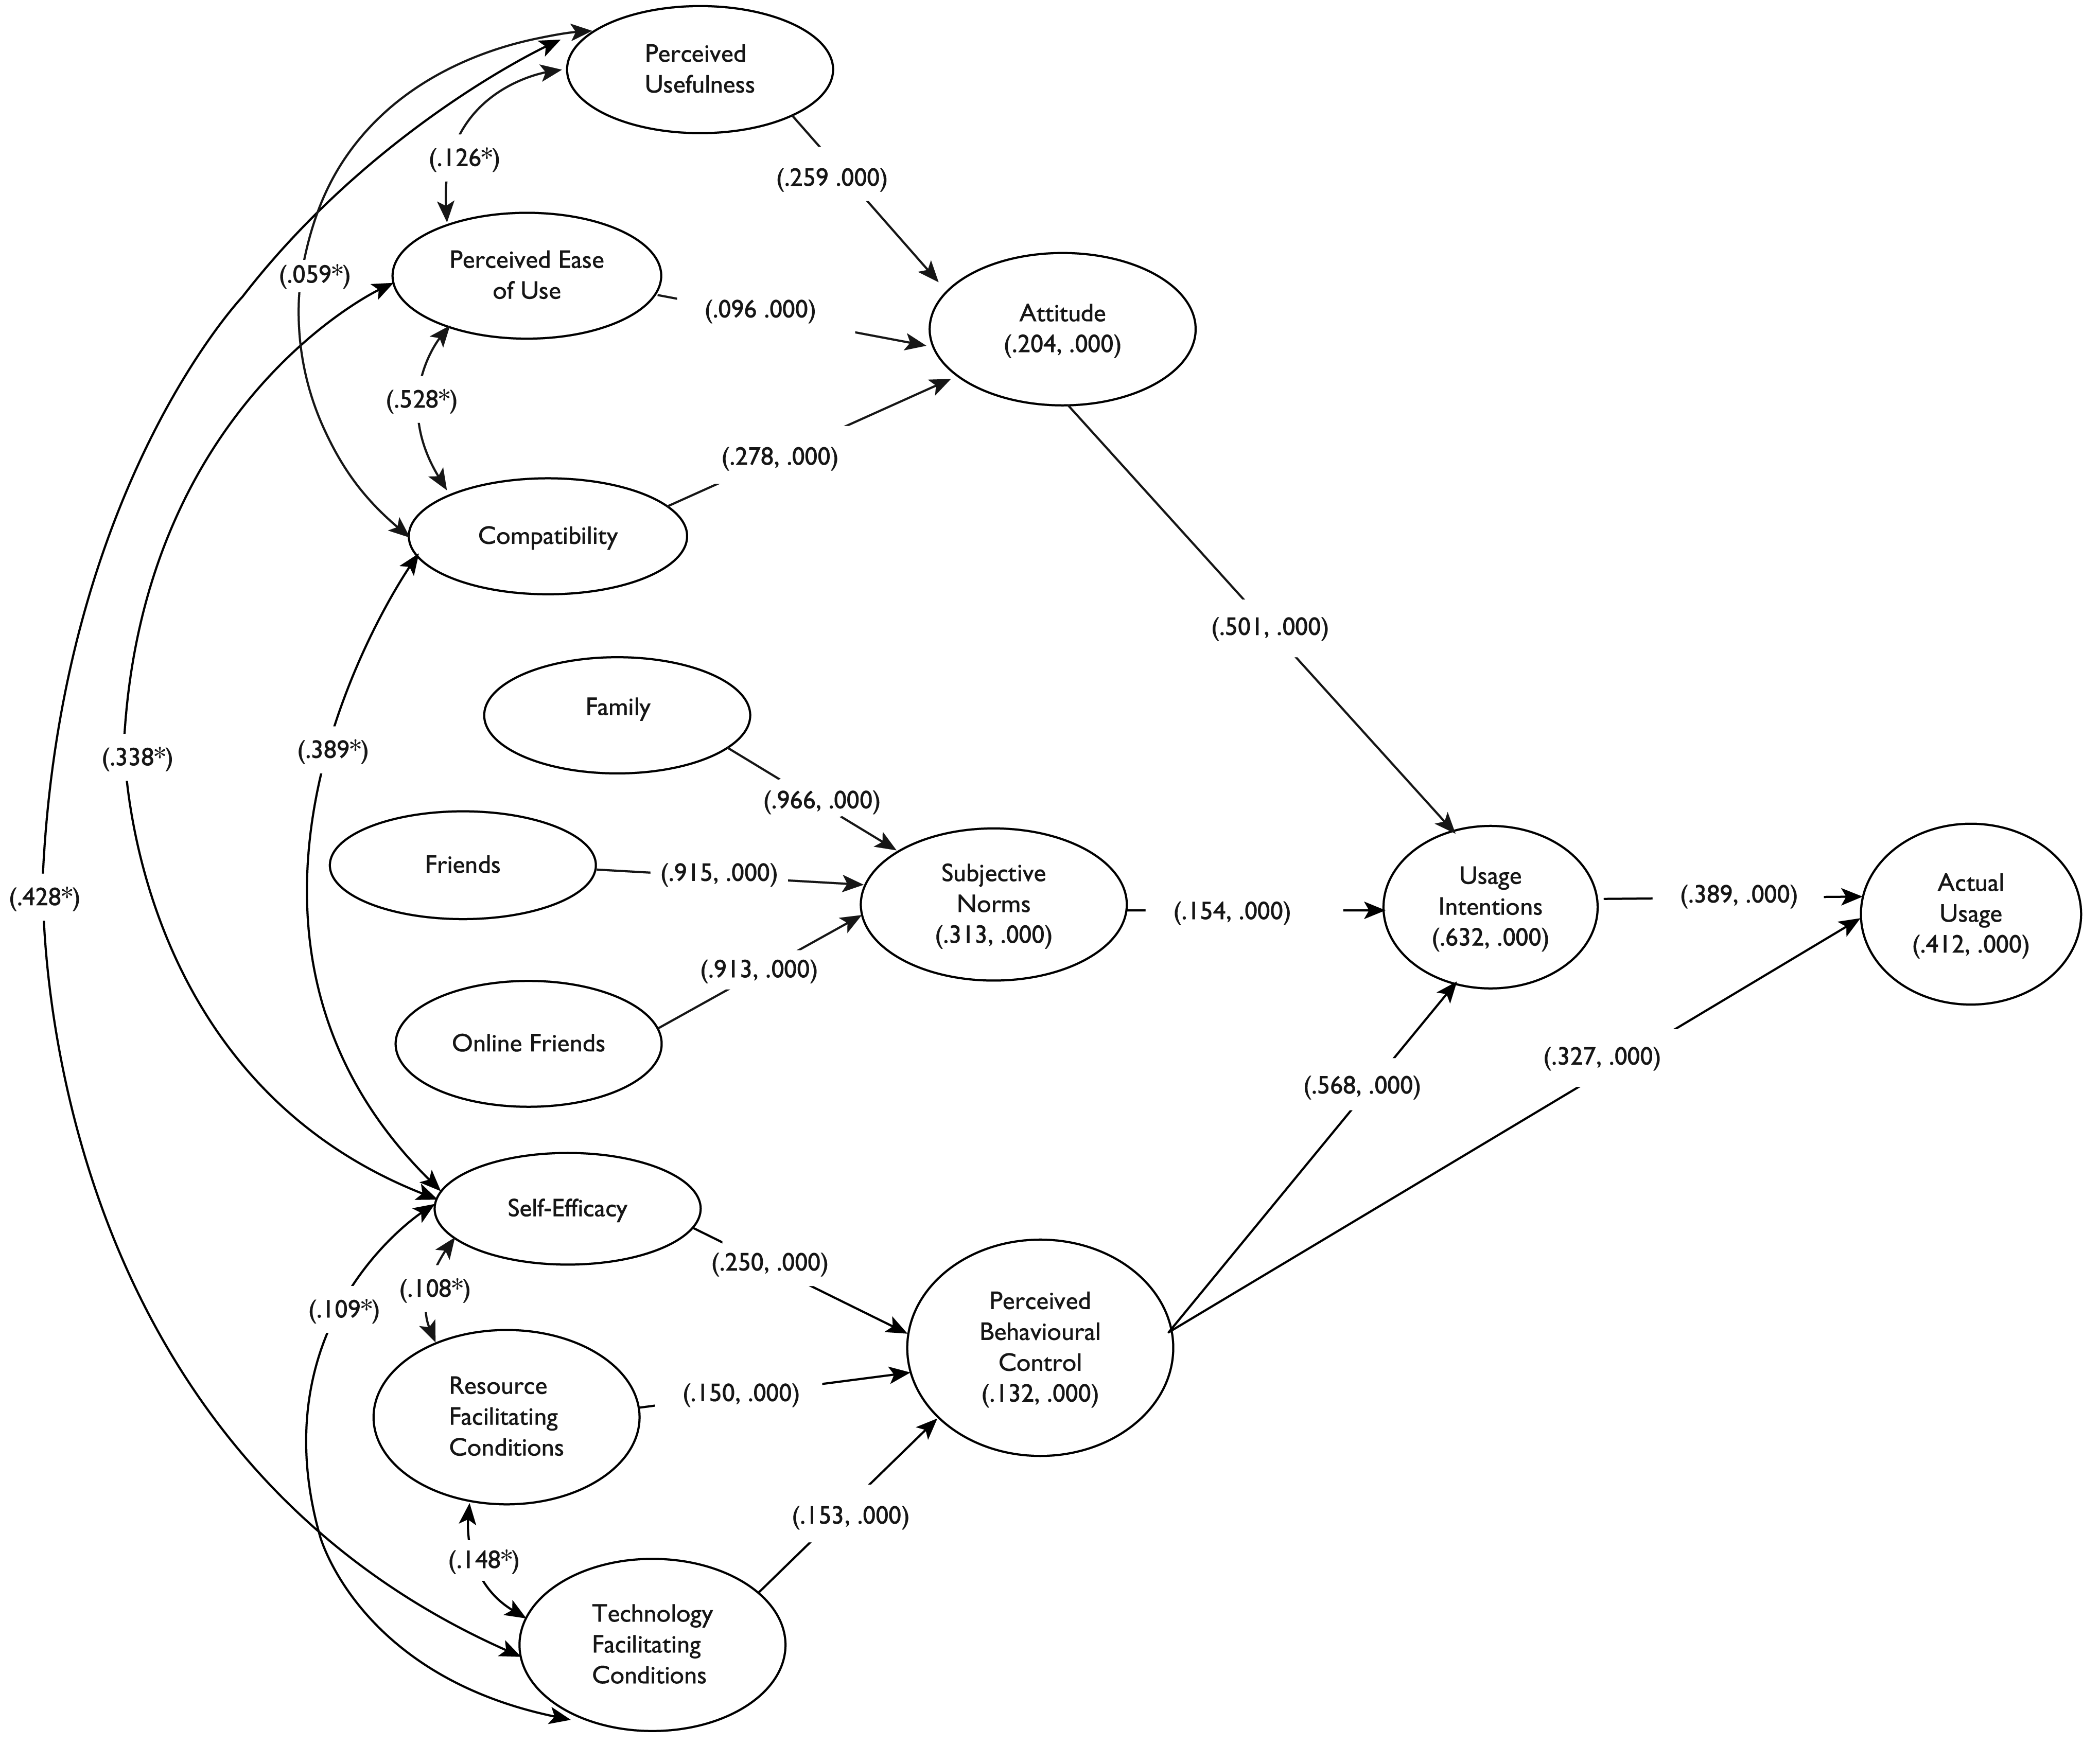
Both the hypotheses for the study were found supported from the data at 5 per cent (0.05) level of significance. However, the model also suggested some very important inter-constructs associations. Technology facilitating conditions were found co-varying (43 per cent) with perceived usefulness which suggested that when customers find technology as ‘trustworthy’ and ‘compatible’, they also find it as a superior alternative to other traditional mode of communication. Self-efficacy was also found co-varying with perceived ease of use (34 per cent) and compatibility (39 per cent). The relationship suggested that when customers found themselves capable of comfortably using digital technology without somebody’s help, they also considered technology compatible with their current behavioural patterns and easy to use.
Discussion and Conclusion
DTPB model was found fit for the study and explained 63 per cent variation in usage intentions and 41 per cent variation in actual usage. All three constructs used in the model, namely attitude, subjective norms and perceived behavioural control, were found significantly affecting the usage intentions. Perceived behavioural control was found as the variable explaining maximum variation (57 per cent) in usage intentions.
Self-efficacy was the factor that explained maximum variation (25 per cent) in perceived behavioural control. So marketers were suggested to put customers at ease by making them comfortable while using the technology; that is, the use of digital channels of communication, in particular. This can be done by putting customers at ease by helping them with a user manual and a responsive support system. Marketers should also take care of cost of accessibility of digital media, whereby only relevant content should be shared with the customers. Quick loading time and early response to the customers should also be ensured by the marketer.
Attitude was found affecting the intentions to use digital communication after perceived behaviour control while buying a car. So marketers should pay attention to the features of digital marketing communication, which are considered important by the customers and also provide an edge to the marketer over alternative communication channels. Marketers should ensure the ease of using digital channels of communication as well as compatibility of digital communication with other digital devices. Subjective norms also affected the intentions of car buyers to use digital channels of communication. So identifying and influencing the important people in a customer’s reference group would benefit the car marketers.
Implications of the Study
The study contributes significantly to the existing research literature. The study tests a model that has been quite successful across a number of product categories in a technology-mediated environment in a comparatively less ex-plored product category involving significant investment and consumers’ interest. The results of the study validate the applicability of the model in the Indian car market. The study identified that perceived behavioural control, attitude and subjective norms respectively affect the intentions to use digital communication while buying a car. Marketers can greatly benefit from the findings of the study whereby they can leverage the desired construct to get the estimated impact on usage intentions and later on actual purchase behaviour. Consumers can also get influenced by the findings of the study and can take a more informed decision.
Limitations and Future Scope of the Study
The car buyers in the study consisted of both actual and potential buyers and the study didn’t differentiate between the two. A study with a clear distinction between the actual and potential buyers might give different and more understandable results. Usage intentions covering the entire decision-making process (right from need recognition stage to post-purchase) can give a more concrete idea of usage intentions in consumer decision-making. The study was conducted in Delhi, and the results of the study should be applied with great caution in non-metro cities. Moreover, a larger sample size might yield different results for the researcher. The study collectively used the term digital channels of communication for diverse digital technology platforms and devices. So the results obtained can’t be specifically and precisely applied for a particular channel of communication. Moreover, the association of usage intentions with various demographic factors like age, income, education, occupation and gender was not seen which might demonstrate specific consumer segments for marketers to cater.