
Abstract
The main purpose of the study was to examine the role of mobile technology in shopping of grocery items among consumers. The objectives of the study were accomplished by using the technology acceptance model (TAM) which was used as the base of the study to test how Indian consumers perceive the use of technology in shopping of grocery using mobile applications (mobile apps). The research design is descriptive in nature. The respondents were selected through purposive and snowball sampling. Primary data were collected through self-administered questionnaire, and 346 usable responses were recorded. The data were analysed using the partial least square structural equation modeling (PLS-SEM) approach. All the hypotheses of TAM were supported. Additionally, perceived usefulness and attitude were found to partially mediate the relationships. The study concluded that consumers are well adapted to use of mobile apps for general shopping but influence of mobile app as a tool was found limited in grocery sector in consistence to previous studies. This shows that there may be other reasons that reduce the use of mobile apps for grocery shopping other than technology. The study theoretically extends the knowledge of consumer behaviour in emerging field of m-commerce, and practically, it will help the m-commerce practitioners to understand need of the consumer.
Introduction
India still practices the culture where the merchants deliver groceries and household staples to consumers’ residence (AC Nielsen, 2015 April). The similar concept of home delivery shopping is re-emerging across the world but with a twist of use of mobile phones. Mobile applications (mobile apps) are found to be the most significant way for Indians to access e-commerce (Livemint, 2016). Mobile has become an important channel for shoppers as they research and purchase products (eMarketer, 2016 January). According to AC Nielsen Report (2015 April), the number of Indians opting for shopping on mobile apps is on rise. The number of smartphone owners using mobile apps of electronic commerce companies has gone up from 1680 in May 2014 to 4320 in May 2015 (AC Nielsen, 2015 April). Internet and Mobile Association of India (IAMAI), 2015, reported that the number of users using internet on mobile is almost 58.5 per cent of the entire Internet accessed in India during March 2015, which is expected to cross 80 per cent by June 2016. This increase in purchase and use of smartphone can be credited to the reducing average selling price (ASP) of smartphones (Neeraj, 2016). In 2015, the consumers’ share of using Internet using has increased from 54 per cent to 64 per cent as compared to previous year.
India is soon to overtake the USA and become the world’s second-largest market for smartphones excee ding 200 million smartphone users (eMarketer, 2016). The various sectors have received an overwhelming response in fashion industry, consumer durable, electronic items, etc., but m-shopping is not so popular and is in nascent stage in the grocery sector. Electronic grocery (e-grocery) allows consumers to purchase grocery online through various mediums such as cash on delivery and online payments without any time and location constraints. The e-grocery vendors provide home delivery of various products including staples, edible oil, beverages, milk and dairy products, baby and child care, cereals and breakfast, snacks, etc., which are considered as essentials and are bought in high quantities (E-Grocery Market in India, 2015). One-quarter of global respondents are already ordering grocery products online for home delivery, and more than half (55%) are willing to use it in the future (AC Nielsen, 2015 April). The continued growth in smartphone subscriptions is expected to lead to an accelerated growth in data usage while monthly mobile data consumption is expected to increase 18-fold by 2020 over current levels (Livemint, 2016).
Review of Literature
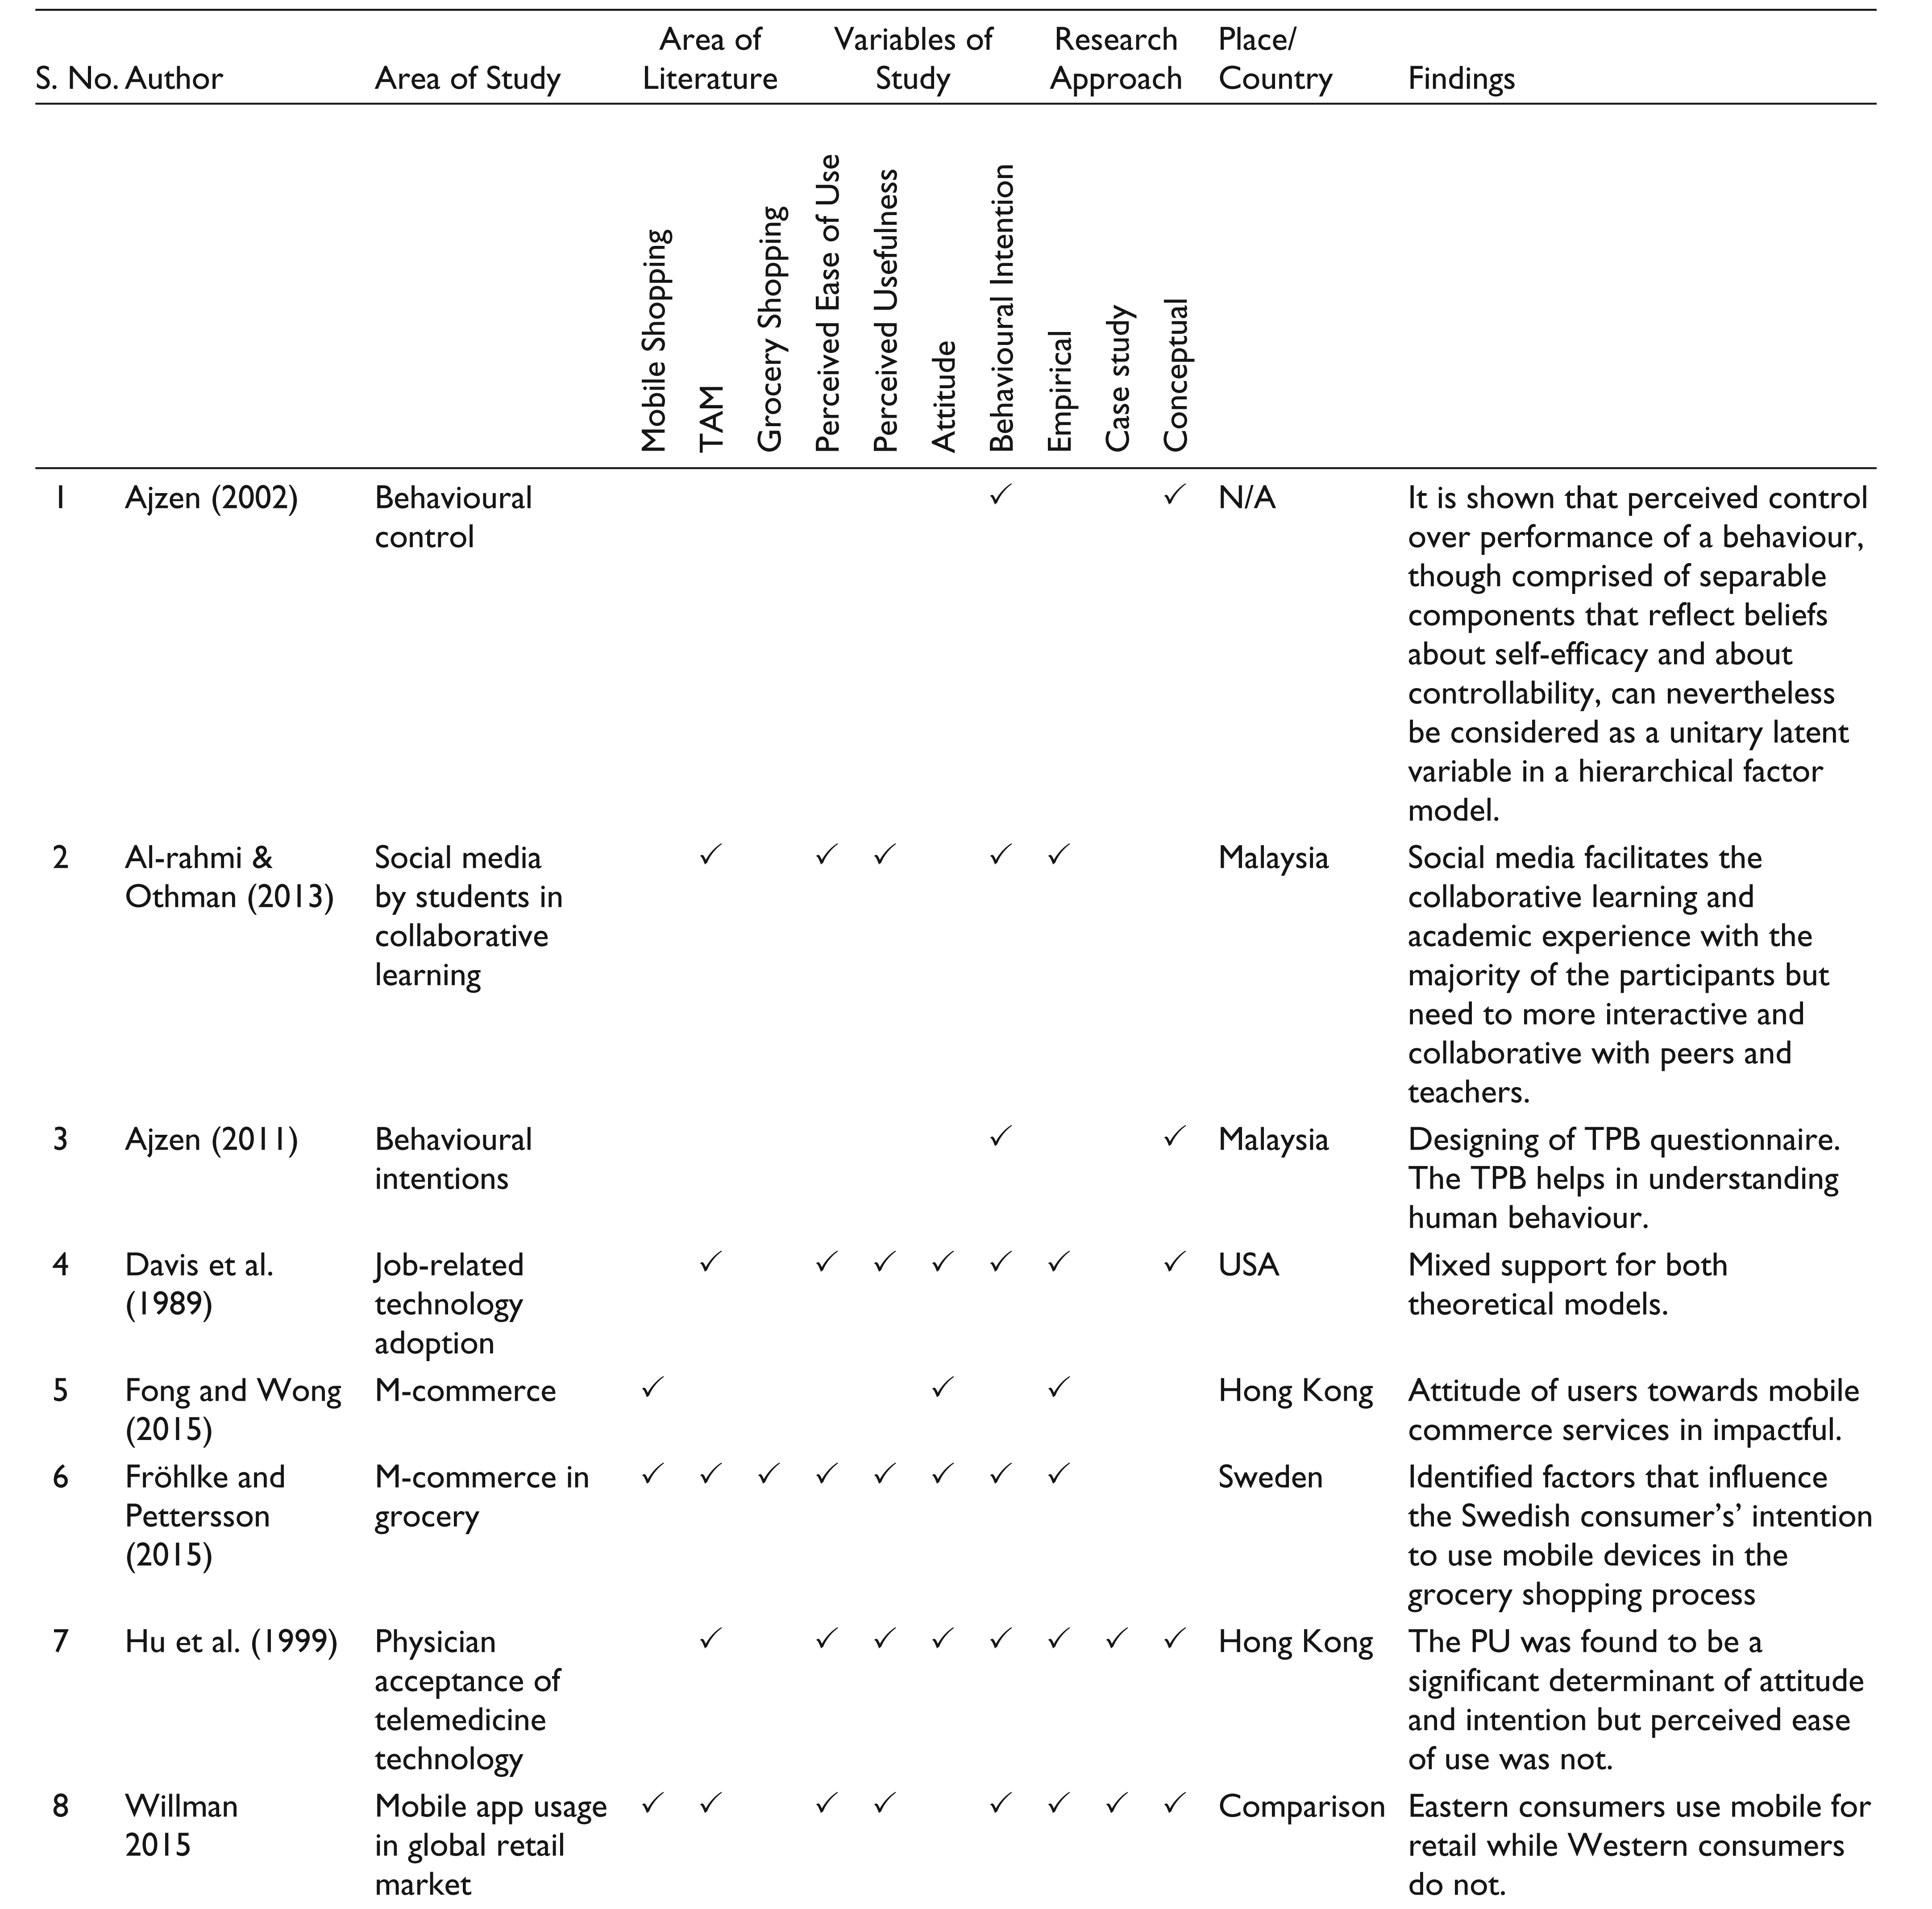
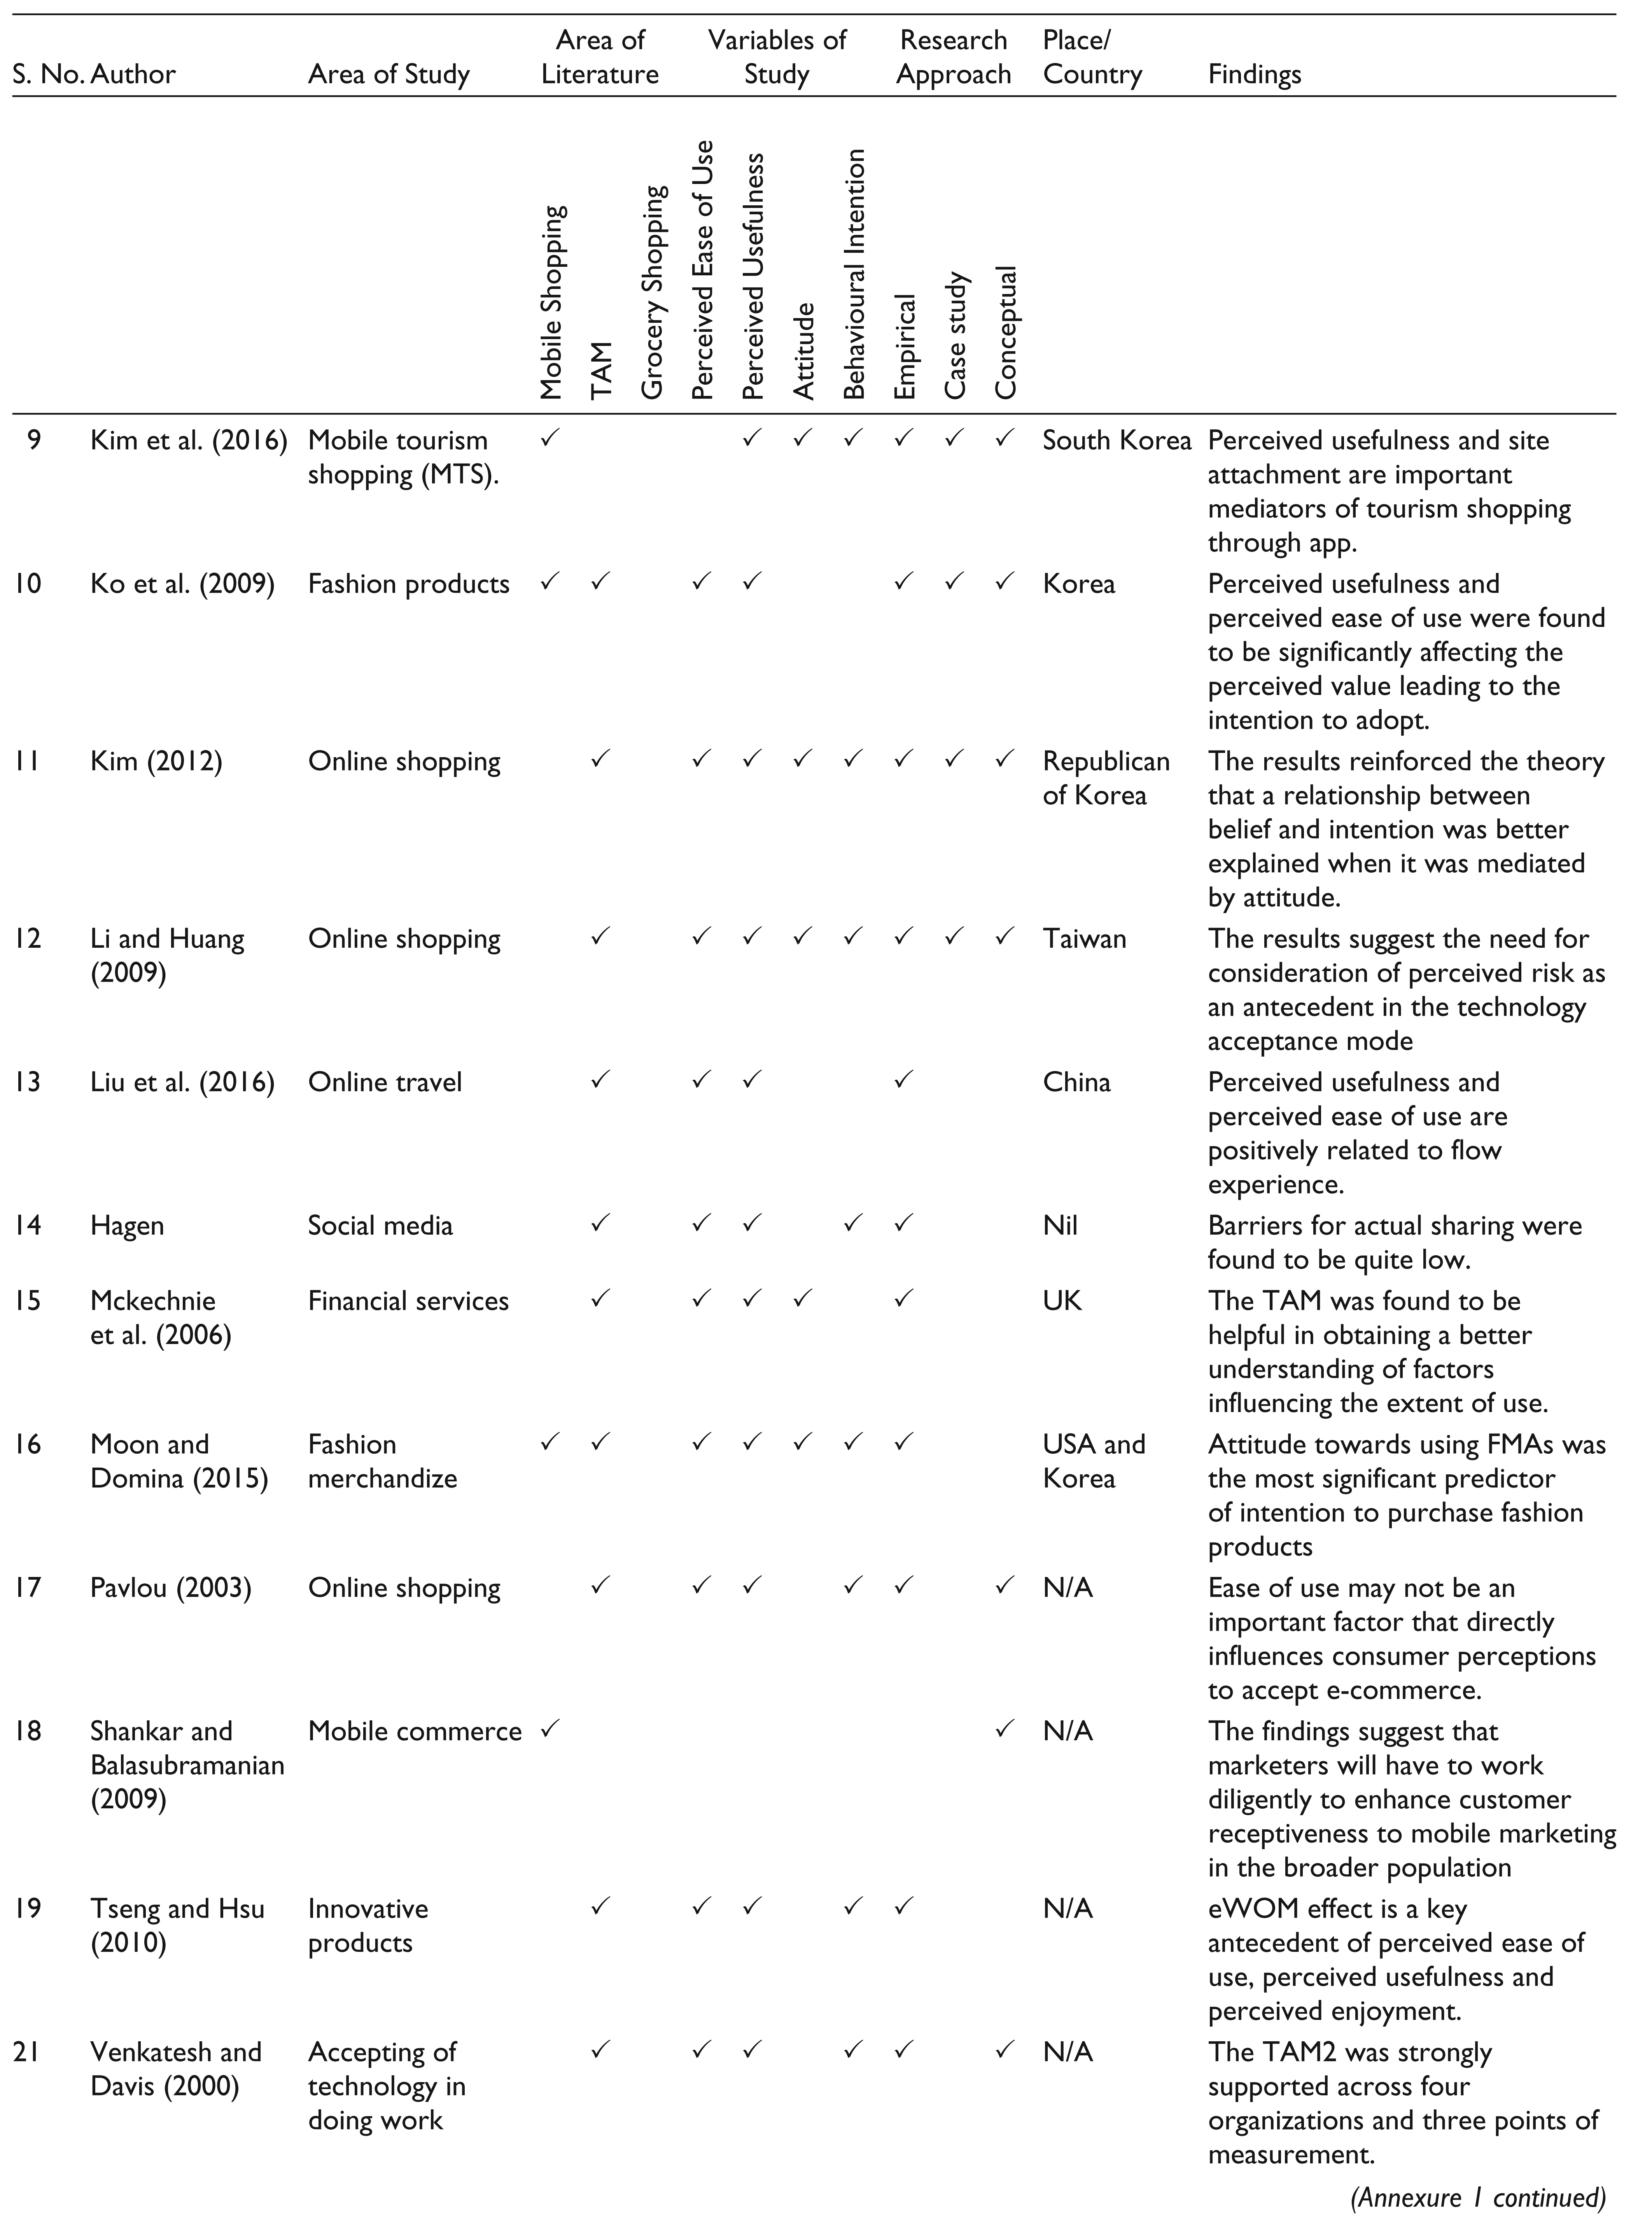
Shopping through mobile apps is gaining high importance in the field of marketing and retailing (Wang, Malthouse & Krishnamurthi, 2015). This is a comparative new area of study (Annexure 1), but still it poses an immense growth in future and literature is found limited in this field (Groß, 2015; Holmes, Byrne & Rowley, 2013). It was found during literature review that most studies were conducted in USA, Taiwan, China, etc., and are found very less in other parts of the world (Groß, 2015). This in-depth review of literature has identified that the studies related to the adoption mobile phone towards grocery shopping have not been conducted for Indian consumers.
Mobile commerce (MC), most popularly known as m- commerce, is the use of mobile phone for making purchases. Wong and Sheng (2012) defined m-commerce as ‘any monetary transactions related to purchases of goods or services through internet-enabled mobile phones or over the wireless telecommunication network’. Mobile device seems to assist the consumer for doing his shopping (Yang, 2010). There are two major theory considered for the study—theory of reasoned action (TRA) and technology acceptance model (TAM). The TAM was designed on the basis of TRA (Fishbein & Ajzen, 1975) to predict the likelihood that a new technology will be adopted with in a group of individuals or organizations (Davis, Bagozzi & Warshaw, 1989). The aim of TAM was to provide a model to the researchers that can help them analyse the cause of rejection or acceptance of technology. The TAM was meant to explain the behaviour of computer usage and was found to be well suited for modelling computer acceptance (Davis, 1989).
With the advancement of Internet on mobile, the consumers are shifting towards MC or the use of mobile phones for shopping. Customers use mobile devices because the technology provides convenient access, which leads them to incorporate m-shopping into their habitual routines (Wang et al., 2015). Shopping through mobile is examined in various field. Intention to buy tourism products using mobile studied was on Korean consumers, and results show that perceived usefulness and site attachment were important mediators of tourism shopping through apps (Kim, Chung, Lee & Preis, 2016). Similar study was conducted on Hong Kong consumers to test the use of MC which showed that attitude of users towards MC services was found to be impactful (Fong & Wong, 2015).
The TAM has been found to successfully explain adoption of numerous technologies that range from software package to different online services. Moon and Domina (2015) conducted an exploratory study focused on USA and South Korean consumers’ intention to use fashion mobile applications (FMAs) to purchase fashion products and how that intention is affected by cultural differences. Attitude towards using FMAs was the most significant predictor of intention to purchase fashion products through FMAs for both South Korean and American participants. Hu, Chau, Sheng and Tam (1999) used TAM to explain physicians’ decisions to accept telemedicine technology in the healthcare context. Mckechnie, Winklhofer and Ennew (2006) studied TAM to understand consumers behaviour towards use of Internet in area of financial services. Ko, Kim and Lee (2009) examined the potential of a consumer technology adoption model in fashion products. Park (2009) tested adoption of e-learning by students based on the TAM. Willman (2015) used TAM 3 (extension of TAM) to compare the Western and Eastern culture towards using of retail shopping mobile apps and how consumers were motivated to use them. It was concluded that Western consumers do not use retail app or use it very less while on the counterpart, Eastern consumers use it more frequently. Amaro and Duarte (2015) proposed a model to find out the reasons that affect the intentions of consumer to purchase travel online using constructs from TAM, innovation diffusion theory (IDT) and theory of planned behaviour (TPB) constructs.

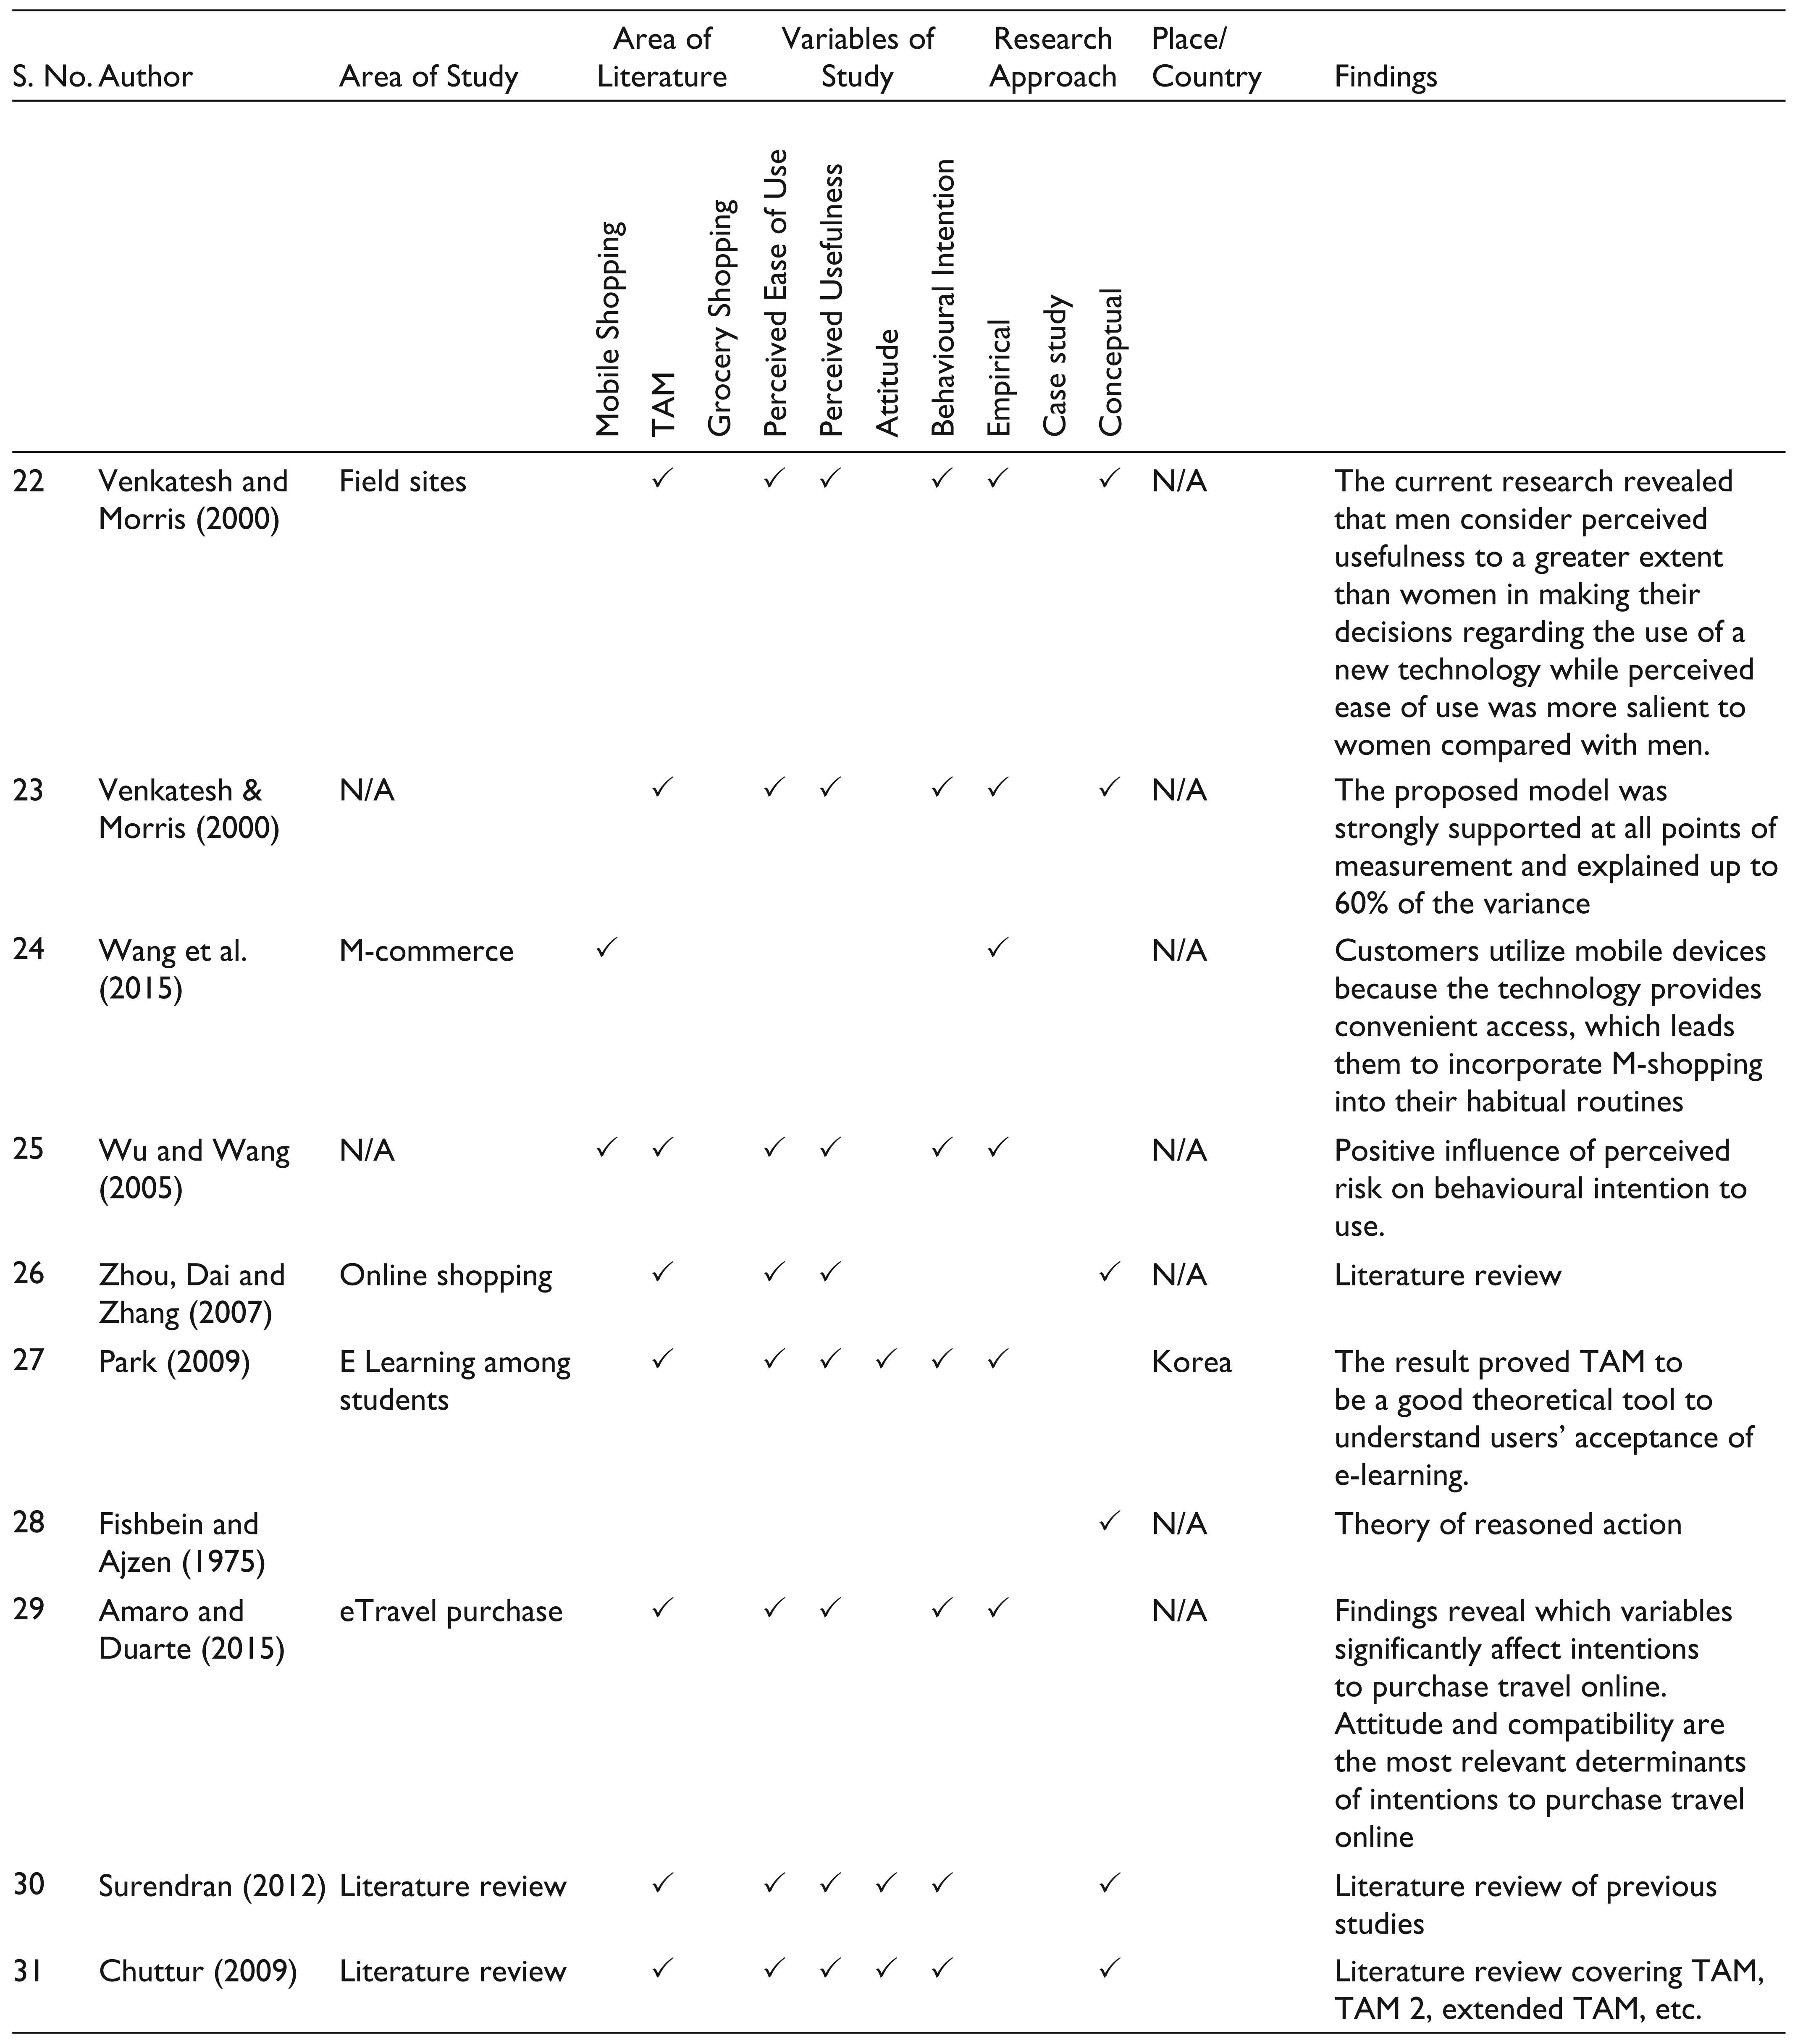
Venkatesh and Morris (2000) extended TAM and tested in three different organizations among 246 employees using three measurements taken over a 3-month period. The proposed model was strongly supported at all points of measurement, and explained up to 60 per cent of the variance was explained. Venkatesh and Davis (2000) developed and tested a theoretical extension of the TAM that explains perceived usefulness and usage intentions in terms of social influence and cognitive instrumental processes. The study was conducted on accepting of technology in doing work by floor supervisor, people in financial services, accounting services and investment banking. The study incorporated additional theoretical constructs spanning social influence processes (subjective norm, voluntariness and image) and cognitive instrumental processes (job relevance, output quality, result demonstrability and perceived ease of use). Li and Huang (2009) extended TAM model by adding perceived risk in existing TAM model. The results suggest the need for consi-deration of perceived risk as an antecedent in the technology acceptance. Tseng and Hsu (2010) applied electronic word of mouth (eWOM) communications and TAM towards consumers intention towards EeePC (innovative technology). Ajzen (2011) clarified behavioural intentions using vari ables perceived behavioural control, perceived self-efficacy, perceived controllability, subjective norm, normative belief, attitude and intention. Wong & Sheng (2012) analysed the various reasons that motivated consumers to adopt m-shopping. Al-rahmi & Othman (2013) used TAM to analyse the student’s perception towards use of social media for collaborative learning by testing TAM Model for students in Malaysia.
Definition of Constructs

Wu and Wang (2005) presented an extended TAM that integrates IDT, perceived risk and cost into the TAM to investigate what determines user MC acceptance. Extensive literature reviews were conducted by Surendran (2012) and Chuttur (2009). An extensive survey of extant related studies was synthesized into online shopping acceptance model (OSAM) to explain consumer acceptance of online shopping by Zhou, Dai and Zhang (2007). Shankar and Balasubramanian (2009) found in their literature review that marketers would have to work diligently to enhance customer receptiveness to mobile marketing in the broader population and, in the short run, need to focus on customers who are receptive to these initiatives.
The conceptual model is based on TAM as shown in Figure 2, and the constructs are explained in Table 1.
Perceived Ease of Use and Perceived Usefulness
The TAM suggests that perceived ease of use have strong linkage with perceived usefulness (Davis et al., 1989; Venkatesh & Davis, 2000; Venkatesh & Morris, 2000). Thus, it is hypothesized that
H1: Perceived ease of use is positively related to perceived usefulness.
Perceived Ease of Use and Attitude
Perceived usefulness has been found to impact attitude towards all technologies while previous research works have shown that impact of ease of use on attitude towards using technology depends on the specific technology or situation (Davis, 1989; Wu & Wang, 2005). Since mobile shopping is a fairly new technology, ease of use might contribute towards the attitude towards using mobile app. Thus, it is hypothesized that,
H2: Perceived ease of use is positively related to attitude towards mobile app for grocery shopping.
Perceived Usefulness and Attitude
In previous research works, it has been found that perceived usefulness has a strong relationship towards user acceptance, attitude and behaviour (Kim, Chan & Gupta, 2007; Ko et al., 2009). Also, it was found that perceived usefulness was positively related to attitude towards using new technology, such as the mobile Internet (Kim et al., 2007). Thus, it is hypothesized that
H3: Perceived usefulness is positively related to attitude towards mobile app for grocery shopping.
Attitude and Behavioural Intention
Davis (1989) found attitude has minor impact on behavioural intention while Fong and Wong (2015) found attitude to be the most important factor in determining behaviour of consumer towards use of mobile apps. Also, attitude toward using fashion merchandize was found to be the most significant predictor of intention to purchase fashion products for both South Korean and American participants (Moon & Domina, 2015). Thus, it is hypothesized that,
H4: Attitude towards mobile app for grocery shopping is positively related to intention to use Mobile App for grocery shopping.
Perceived Usefulness and Intention to Use Mobile App for Grocery Shopping
Prior studies on consumer behaviour found that a consumer’s perceived ease of use and perceived usefulness of a system affect behaviour intention of the consumer towards the system (Gao & Bai, 2014). Thus, it is hypothesized that,
H5: Perceived Usefulness positively affects Intention to use mobile app for grocery shopping.
Attitude Mediates the Relationship between Perceived Usefulness and Behavioural Intention
Kim (2012) established an integrated model of initial trust and TAM to model the purchase mechanism in online shopping. The results reinforced the theory that a relationship between belief and intention was better explained when it was mediated by attitude. It was found that role of attitude in explaining behavioural intention is very limited, so it can be dropped from TAM as presented in TAM2 (Venkatesh & Davis, 1996, 2000; Venkatesh, Morris, Davis & Davis, 2003). Therefore, it is hypothesized that,
H6: Attitude mediates the relationship between Perceived Usefulness and Behavioural Intention
Perceived Usefulness Mediates the Relationship between Perceived Ease of Use and Behavioural Intention
Perceived usefulness and perceived ease of use can significantly lead to behavioural intention (Ko et al., 2009). Perceived usefulness was found to mediate the relationship of tourism shopping through mobile app and site attachment (Kim et al., 2016). Therefore, it is hypothesized that,
H7: Perceived Usefulness mediates the relationship between Perceived Ease of Use and Behavioural Intention
Research Methodology
Sampling and Data Collection
For the purpose of current study, descriptive research design with survey technique was undertaken. The sample frame covers consumers who are users of Internet on smartphone and are above 18 years of age. Purposive sampling was used to make sure that the respondents know about mobile shopping and should be able to evaluate the same. The data collection period ranged from 6 May 2016 to 7 July 2016. To collect the data, self-administered questionnaire was distributed online using social networking websites. The respondents were selected from Facebook pages of m-commerce websites and link was emailed to them. Further the link was emailed to colleagues, personal contacts and students. This method is considered quite appropriate as it is fast and cheap method for data collection from infinite population (Malhotra, 2007). A total of 396 responses were recorded. The responses with missing values and the respondents who do not possess smartphone were removed leading to 390 usable questionnaires. The sample size was greater than 250, and therefore, missing values were treated using complete case deletion approach (Hair, Black, Babin, Anderson & Tatham, 2013). The responses with missing values were deleted leading to 346 usable responses.
The sample size that can be used for testing a model in PLS is obtained by either finding out the highest number of formative constructs or by identifying highest numbers of antecedents leading to that construct (Barclay, Higgins & Thompson, 1995). The one with greater value is multiplied by 10 to calculate minimum sample size. There were no formative constructs in the model. The highest number of arrows directed towards behavioural intention which is 2. Thus, minimum sample size necessary was 20. Therefore, 346 responses are sufficient for analysing data in PLS (Hair, Black, Babin, Anderson & Tatham, 2013).
Measurement Instrument
The questionnaire was divided into two sections. The first section of the questionnaire contained personal questions regarding respondent, namely age, occupation, location, gender and marital status. This section also asked respondents to inform whether they possess a smartphone, use Internet on their mobile, use mobile apps for shopping and use mobile apps for grocery shopping. One item was used to measure usage of mobile for shopping on a dichotomous scale of yes or no. Similarly, one item was used to directly measure usage of mobile for grocery shopping in yes or no. The second section contained items adapted from standard scales to measure the constructs of the study (Table 2). The respondents of the questionnaire were required to mark their responses on five-point Likert scale ranging from strongly disagree (1) to strongly agree (5).
Data Analysis
The PLS-SEM was used for testing of hypothesis as it has few assumptions about data distribution (Hair, Hult, Ringle & Sarstedt, 2013; Hair, Ringle & Sarstedt, 2011; Hair, Sarstedt, Pieper & Ringle, 2012). The PLS does not hold assumptions of normality for data as it uses method of bootstrapping for estimating parameters (Gefen, Rigdon & Straub, 2011; Henseler, Ringle & Sarstedt, 2012). Normality was therefore not checked. It is also considered better for testing constructs with fewer variables. Since the constructs have been measured by using three items or four items, this characteristic seems to be relevant. The PLS is more advanced technique as it means testing regression equation multiple times. The constructs were reflective in nature, and the items were predefined. The PLS-SEM is considered to be a soft modelling approach as it has delivered good results with less assumptions. The PLS is used for data analysis over covariance based structural modeling (CB-SEM) as the aim of the study was to identify key driver constructs not theory testing or comparison (Hair et al., 2011). Also, the software PLS-SEM website clarifies use of PLS-SEM over CB-SEM using the TAM model (
Constructs and Its Measures
Results
Socio-demographic Characteristics
The demographic profile of respondents is subcategorized as respondent’s gender, age, marital status, occupation and location. A brief description of respondent’s demographic characteristics is presented in Table 3. There are 52.1 per cent females as compared to 47.9 per cent male respondents. In terms of age, most significant respondents lie in the age group of 18–29 constituting about 70.2 per cent of the respondents. The data were skewed as 56.4 per cent of respondents were married. The respondents belong to various occupations showing diversity, but the respondents majorly were salaried. In terms of state of residence, the large share of responses was from national capital region (NCR) constituting about 30.9 per cent of responses.
Descriptive Statistics of Respondents’ Characteristics

Model Assessment
As the model was based on developed theory, therefore, PLS-SEM was used for evaluation. The SEM is considered to be ‘the dominant multivariate technique’ (Hair, Black, Babin, Anderson & Tatham, 2013). In PLS-SEM, the model is evaluated in two steps. The first step consists of assessment of measurement which includes evaluating reliability and validity. The second step includes assessment of structure which conducts the evaluation of hypothesis.
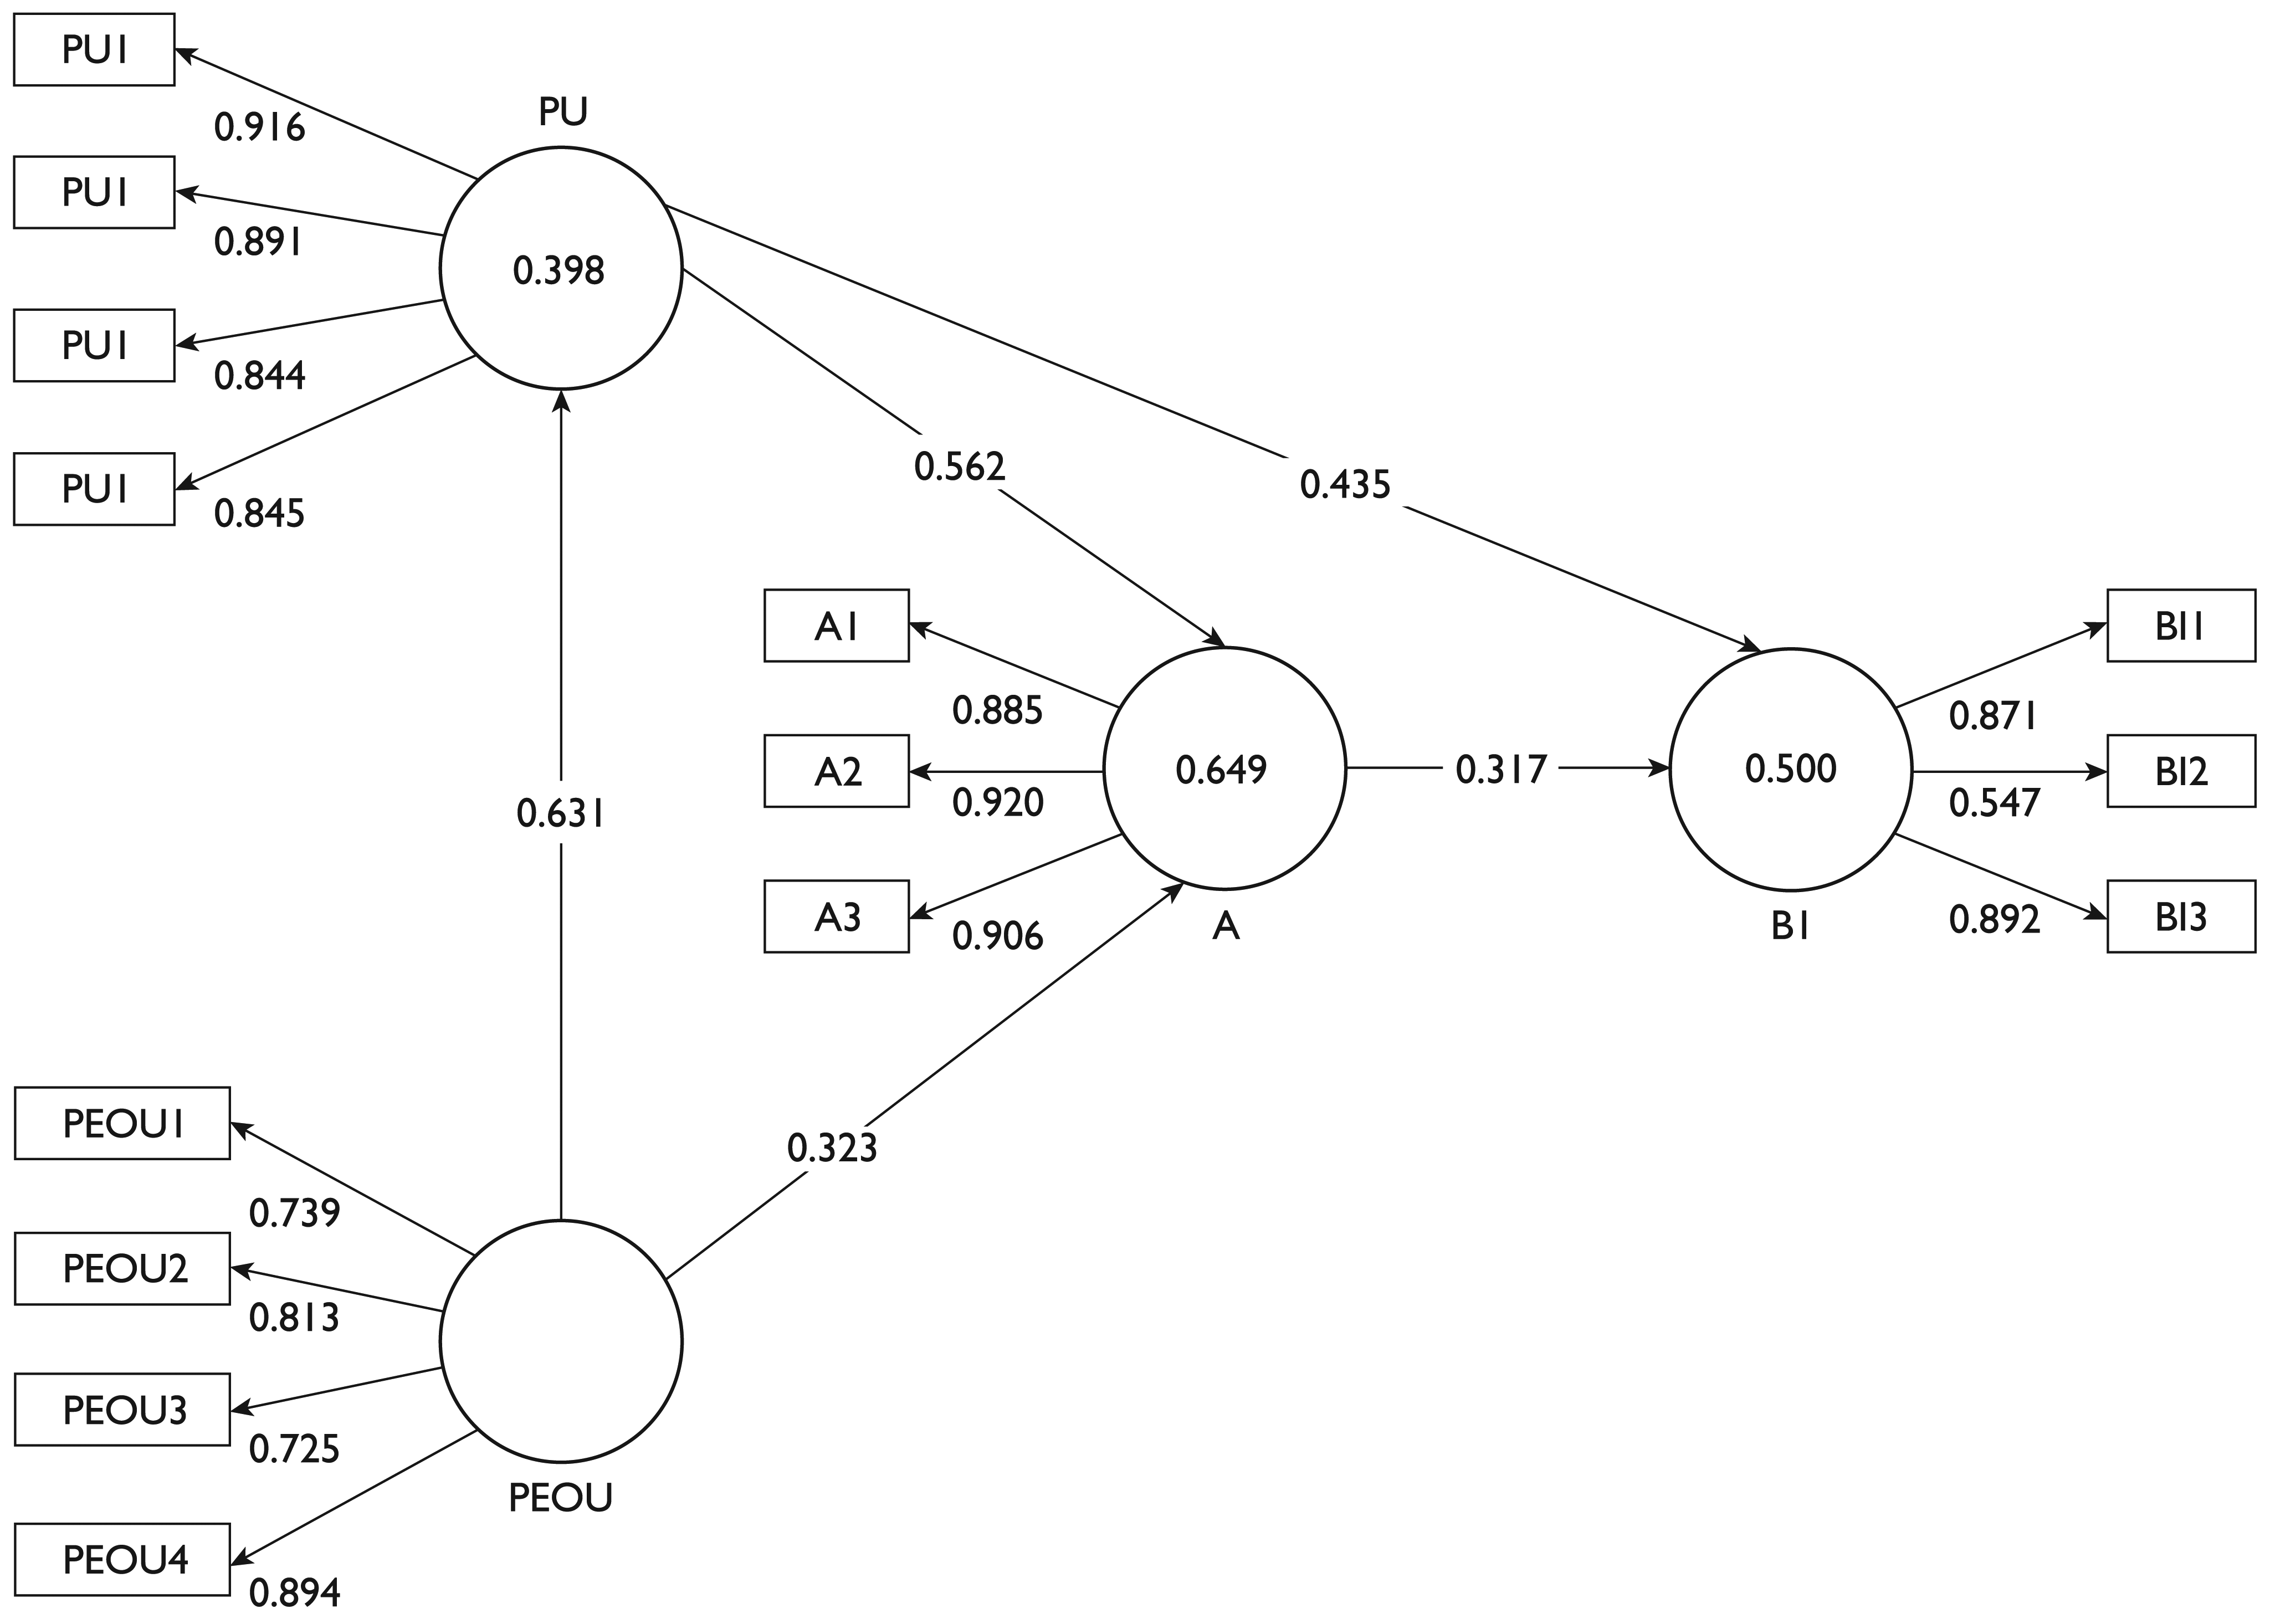
The path diagram was constructed using the PLS tools and were connected as hypothesized in the theory as shown in Figure 1. At the first step, PLS algorithm was calculated. All the factors showed significant loadings. Further bootstrapping was done to check that the test on sample is the true representation of population. Bootstrapping is the process to estimate t-values of item loadings for outer model and path coefficients for inner model. Bootstrapping was run on 500 subsamples (Hair et al., 2014) at two tail-test. The values of t were found to be >1.96 at 0.5 level of significance.
Measurement Model
Assessment of Measurement (Outer model)
The first step involves identification of constructs as formative or reflective constructs. All the four variables of study are identified as reflective constructs. The reflective constructs are measured by determining indicator reliability, convergent validity, internal consistency and discrimi nant validity (Hair et al., 2011; Henseler, Ringle & Sinkovics, 2009). The reliability of items was measured by Cronbach’s Alpha (Table 4). The value of Cronbach’s alpha seems to be robust as these values are higher than 0.7. Many researchers (Hair et al., 2011; Henseler et al., 2009) consider composite reliabilities as more suitable for PLS- SEM than Cronbach’s Alpha. The composite reliability of constructs ranges from 0.92 to 0.82 (Table 4). The values between 0.70 and 0.95 are considered ‘satisfactory to good’ (Hair et al., 2014). To evaluate convergent validity, average variance extracted (AVE) of each variable was calculated, as suggested by Fornell and Larcker (1981). The AVE for all items shows convergent validity as the value exceeds 0.50 (Table 4). The factor loadings were greater than 0.5 and, hence, found significant. These values were also found significant during bootstrapping. Discriminant validity was used to assess if a construct is more strongly related to its own measure than with any other constructs by examining the overlap in variance by comparing the AVE of each construct with the squared correlations among construct (Fornell & Larcker, 1981). The diagonal elements represent AVE of construct, and other values represent the correlation between constructs (Table 5). The square root of each construct’s AVE was found to be higher than its correlations with any other construct. Therefore, it can be concluded that the constructs share high variances among themselves as compared to other constructs, thus, supporting the adequate discriminant validity of the scales (Henseler et al., 2009). The results show that the constructs fit well to the model and the reliability and validity is firm.
Measurement Statistics of Constructs

Test of Collinearity
Collinearity is the group of points present on a single line. It is a phenomenon in which two or more predictor variables in a multiple regression model are highly correlated, meaning that one can be linearly predicted from the others with a substantial degree of accuracy. The collinearity is measured by VIF values. The values >5 are indicator of collinearity among the indicators. In the given model, all the VIF values were less than 5 which shown absence of collinearity (Table 6).
Discriminant Validity of the Constructs: Correlations between Constructs (Fornell–Larcker Criteria, 1981)

Test of Collinearity
Results of PLS-SEM
Assessment of Structure
The outer model provided acceptable results for reliability and validity. The inner model was examined to assess the relationship between variables by testing hypothesis. The analysis of internal structure supported all five hypotheses as shown in Table 7 and Figure 3 as the t-values are found to be significant (t > 1.96).
The strongest relationship was found between perceived ease of use and perceived usefulness ( β = 0.631, p = 0.000). This means that if the consumer finds the use of mobile phone easy for purchasing grocery, he is more likely to find it useful as well. The second strongest relationship was found between perceived usefulness and attitude ( β = 0.562, p = 0.000). It indicates that if the consumer finds the mobile technology to be useful for his grocery shopping, he will develop a favourable attitude towards it. The hypothesis regarding perceived usefulness and behavioural intention was also supported ( β = 0.435, p = 0.000). This means that if a user of mobile app perceives mobile app as useful, he will have positive intention towards the purchase of grocery using it. The relationship of perceived ease of use and attitude was found significant ( β = 0.323, p =0.000). This indicates that if the consumer finds the technology to be easy for usage, he develops a positive attitude towards it. The next hypothesis examined the relationship between attitude and behavioural intention which was also supported ( β = 0.317, p = 0.000). This indicates that if a consumer develops a positive attitude for cause of a technology, he may intend to use it in near future. Mediation effects were analysed by measuring direct and indirect effect (Table 8). According to Hair, Ringle & Sarstedt (2013), value adjustment factor (VAF) is measured by division of indirect effect by total effect. If VAF < 20 per cent, no mediation, if VAF > 20 per cent but <80 per cent, partial mediation and if VAF > 80 per cent, full mediation. The results show that perceived usefulness partially mediates the relationship between perceived ease of use and behavioural intention, thus supporting the sixth hypothesis. The seventh hypothesis was also supported showing that attitude mediates the relationship between usefulness and intention to use mobile for grocery shopping.
Further, cross tabulation was conducted to draw inferences about impact of demographical factors on consumers usage of mobile phones. The results of demographical analysis were as under:
Females preferred to use mobile apps over males for doing mobile shopping but in case of grocery shopping, males prefer to use mobile apps. The younger generation (age 18–29) prefers shopping through mobile for both general and grocery items in comparison to other age groups. The respondents engaged in private job constituted the largest segment of people shopping using mobile, followed by students. However, in case of grocery shopping, the largest portion was constituted by students followed by housewife. The consumers were indifferent of marital status for shopping through mobile apps, but in case of m-shopping for grocery items, married people agreed to use it more as compared to unmarried people. The descending order of preference of shopping through mobile is summarized as unmarrried female → married male → married female → unmarried male. The descending order of preference of grocery shopping through mobile is summarized as married female → unmarried male → married male → unmarried male.
Model Prediction
The predictive power of TAM in current scenario for adoption of mobile apps in grocery shopping was done by examining the explained variance (R2) and adjusted (R2) of the endogenous constructs. R2 shows that the amount of variance in the construct explained by the model. As shown in Table 9, R2 and adjusted R2 values range from 0.39 to 0.67, which indicates that the model has high predictive value and is capable of explaining endogenous constructs.
Conclusions and Implications
Results of the study demonstrate the application of TAM in accessing acceptance of mobile shopping for grocery items in India. The results are in agreement with the previous studies such as use of TAM in online grocery shopping (Kurnia & Chien, 2003), understanding of students’ intention to use e-learning (Park, 2009). All of the constructs proposed in TAM and their relationships were found to be relevant in this study. This study will enrich the literature in the field of electronic commerce-enabled adoption of technology using TAM which is currently still limited (Gefen & Straub, 2000; Kurnia & Chien, 2003). The TAM model was successful in explaining adoption of technology in the various field, yet this model was not tested in grocery sector (Park, 2009). The contribution of research can be summarized as a validation of the TAM given by Davis in 1989, in a completely new empirical context in terms of country (India), population (sample is a mix of student, salaried and home makers), area (grocery shopping) and technology used (mobile).
Mediation Results

R-square Values

It was found that tier II city consumers prefer to shop using mobile app in comparison to tier I consumers. This result is in with agreement to AC Nielsen Report (2015 July) that time spent by users in non-metros (116 min/month) was found higher than in metros (109 min/month).
The study was able to test the adoption of mobile apps (technology) for purchasing grocery items in the context of Indian grocery retailing Industry as all the relationships pertaining to TAM were found significant. It was found that 90.8 per cent (314) respondents agreed to do online shopping using mobile apps, but only 36.7 per cent (127) respondents said to use mobile apps for grocery shopping.
These results show that the mobile shopping from grocery is not very well adopted by the people although the technology is not a problem. The e-retailers need to analyse the hidden reasons that stops consumers from buying grocery using apps. The results are consistent with the market trends that such grocery shopping apps are not in profits, even PepperTap (one newly launched mobile grocery shopping apps) was shut down.
Limitations and Future Implications
The study has few limitations which are stated as under. The sample was selected based on purposive and snowball sampling, and therefore precautions should be taken before generalizing the results. The study was conducted in Indian context and cross-cultural issues were not addressed. The study can be further tested in other countries as well. According to Hofstede’s cultural dimension theory, the culture can affect individual behaviour. The aim of study was to assess the usage of mobile apps in grocery shopping, so few variables of TAM were not included. This study can be further extended by testing actual behaviour and subjective norm.
Footnotes
Appendix
Summary of Research Papers
| S. No. |
Author |
Area of Study |
Area of Literature |
Variables of Study |
Research Approach |
Place/Country |
Findings |
|||||||
| Mobile Shopping | TAM | Grocery Shopping | Perceived Ease of Use | Perceived Usefulness | Attitude | Behavioural Intention | Empirical | Case study | Conceptual | |||||
| 1 | Ajzen (2002) | Behavioural control | ✓ | ✓ | N/A | It is shown that perceived control over performance of a behaviour, though comprised of separable components that reflect beliefs about self-efficacy and about controllability, can nevertheless be considered as a unitary latent variable in a hierarchical factor model. | ||||||||
| 2 | Al-rahmi & Othman (2013) | Social media by students in collaborative learning | ✓ | ✓ | ✓ | ✓ | ✓ | Malaysia | Social media facilitates the collaborative learning and academic experience with the majority of the participants but need to more interactive and collaborative with peers and teachers. | |||||
| 3 | Ajzen (2011) | Behavioural intentions | ✓ | ✓ | Malaysia | Designing of TPB questionnaire. The TPB helps in understanding human behaviour. | ||||||||
| 4 | Davis et al. (1989) | Job-related technology adoption | ✓ | ✓ | ✓ | ✓ | ✓ | ✓ | ✓ | USA | Mixed support for both theoretical models. | |||
| 5 | Fong and Wong (2015) | M-commerce | ✓ | ✓ | ✓ | Hong Kong | Attitude of users towards mobile commerce services in impactful. | |||||||
| 6 | Fröhlke and Pettersson (2015) | M-commerce in grocery | ✓ | ✓ | ✓ | ✓ | ✓ | ✓ | ✓ | ✓ | Sweden | Identified factors that influence the Swedish consumer’s’ intention to use mobile devices in the grocery shopping process | ||
| 7 | Hu et al. (1999) | Physician acceptance of telemedicine technology | ✓ | ✓ | ✓ | ✓ | ✓ | ✓ | ✓ | ✓ | Hong Kong | The PU was found to be a significant determinant of attitude and intention but perceived ease of use was not. | ||
| 8 | Willman 2015 | Mobile app usage in global retail market | ✓ | ✓ | ✓ | ✓ | ✓ | ✓ | ✓ | ✓ | Comparison | Eastern consumers use mobile for retail while Western consumers do not. | ||
| 9 | Kim et al. (2016) | Mobile tourism shopping (MTS). | ✓ | ✓ | ✓ | ✓ | ✓ | ✓ | ✓ | South Korea | Perceived usefulness and site attachment are important mediators of tourism shopping through app. | |||
| 10 | Ko et al. (2009) | Fashion products | ✓ | ✓ | ✓ | ✓ | ✓ | ✓ | ✓ | Korea | Perceived usefulness and perceived ease of use were found to be significantly affecting the perceived value leading to the intention to adopt. | |||
| 11 | Kim (2012) | Online shopping | ✓ | ✓ | ✓ | ✓ | ✓ | ✓ | ✓ | ✓ | Republican of Korea | The results reinforced the theory that a relationship between belief and intention was better explained when it was mediated by attitude. | ||
| 12 | Li and Huang (2009) | Online shopping | ✓ | ✓ | ✓ | ✓ | ✓ | ✓ | ✓ | ✓ | Taiwan | The results suggest the need for consideration of perceived risk as an antecedent in the technology acceptance mode | ||
| 13 | Liu et al. (2016) | Online travel | ✓ | ✓ | ✓ | ✓ | China | Perceived usefulness and perceived ease of use are positively related to flow experience. | ||||||
| 14 | Hagen | Social media | ✓ | ✓ | ✓ | ✓ | ✓ | Nil | Barriers for actual sharing were found to be quite low. | |||||
| 15 | Mckechnie et al. (2006) | Financial services | ✓ | ✓ | ✓ | ✓ | ✓ | UK | The TAM was found to be helpful in obtaining a better understanding of factors influencing the extent of use. | |||||
| 16 | Moon and Domina (2015) | Fashion merchandize | ✓ | ✓ | ✓ | ✓ | ✓ | ✓ | ✓ | USA and Korea | Attitude towards using FMAs was the most significant predictor of intention to purchase fashion products | |||
| 17 | Pavlou (2003) | Online shopping | ✓ | ✓ | ✓ | ✓ | ✓ | ✓ | N/A | Ease of use may not be an important factor that directly influences consumer perceptions to accept e-commerce. | ||||
| 18 | Shankar and Balasubramanian (2009) | Mobile commerce | ✓ | ✓ | N/A | The findings suggest that marketers will have to work diligently to enhance customer receptiveness to mobile marketing in the broader population | ||||||||
| 19 | Tseng and Hsu (2010) | Innovative products | ✓ | ✓ | ✓ | ✓ | ✓ | N/A | eWOM effect is a key antecedent of perceived ease of use, perceived usefulness and perceived enjoyment. | |||||
| 21 | Venkatesh and Davis (2000) | Accepting of technology in doing work | ✓ | ✓ | ✓ | ✓ | ✓ | ✓ | N/A | The TAM2 was strongly supported across four organizations and three points of measurement. | ||||
| 22 | Venkatesh and Morris (2000) | Field sites | ✓ | ✓ | ✓ | ✓ | ✓ | ✓ | N/A | The current research revealed that men consider perceived usefulness to a greater extent than women in making their decisions regarding the use of a new technology while perceived ease of use was more salient to women compared with men. | ||||
| 23 | Venkatesh & Morris (2000) | N/A | ✓ | ✓ | ✓ | ✓ | ✓ | ✓ | N/A | The proposed model was strongly supported at all points of measurement and explained up to 60% of the variance | ||||
| 24 | Wang et al. (2015) | M-commerce | ✓ | ✓ | N/A | Customers utilize mobile devices because the technology provides convenient access, which leads them to incorporate M-shopping into their habitual routines | ||||||||
| 25 | Wu and Wang (2005) | N/A | ✓ | ✓ | ✓ | ✓ | ✓ | ✓ | N/A | Positive influence of perceived risk on behavioural intention to use. | ||||
| 26 | Zhou, Dai and Zhang (2007) | Online shopping | ✓ | ✓ | ✓ | ✓ | N/A | Literature review | ||||||
| 27 | Park (2009) | E Learning among students | ✓ | ✓ | ✓ | ✓ | ✓ | ✓ | Korea | The result proved TAM to be a good theoretical tool to understand users’ acceptance of e-learning. | ||||
| 28 | Fishbein and Ajzen (1975) | ✓ | N/A | Theory of reasoned action | ||||||||||
| 29 | Amaro and Duarte (2015) | eTravel purchase | ✓ | ✓ | ✓ | ✓ | ✓ | N/A | Findings reveal which variables significantly affect intentions to purchase travel online. Attitude and compatibility are the most relevant determinants of intentions to purchase travel online | |||||
| 30 | Surendran (2012) | Literature review | ✓ | ✓ | ✓ | ✓ | ✓ | ✓ | Literature review of previous studies | |||||
| 31 | Chuttur (2009) | Literature review | ✓ | ✓ | ✓ | ✓ | ✓ | ✓ | Literature review covering TAM, TAM 2, extended TAM, etc. | |||||