



Abstract
This research investigated the determinant factors of store choice. The study is an effort to understand the current positions of the organized exclusive brand outlets (EBOs) among shoppers in select cities of Madhya Pradesh (MP), India. In this view, the researcher approached shoppers of select EBOs and then identified the positions and effect of identified attributes on store choice. A total of 480 participants were approached, among which 328 respondents completely filled the questionnaire. This exploratory study used exploratory factor analysis (EFA) and confirmatory factor analysis (CFA) before the psychometric test (i.e., reliability and validity) of the instrument. Further, the multidimensional perceptual maps show the pictorial positions of the eight ready-to-wear EBOs operating in MP, the central Indian market. Further, it also revealed those attributes which shoppers perceived as important with respect to store selection. It found that organized retail stores must lay emphasis on customer service, promotion, physical aspects, return policies, assortment of merchandise, physical comforts, convenience facilities, perceived risk and purchase volume. The contribution of this study is that the outcomes are extremely useful to store managers and strategy makers in understanding the Indian retail market and tailoring their marketing tactics.
Background of the Study
At present, retail industry competition is rising due to transformation from unorganized retailing to organized retailing. New store formats of retailing comprise malls, multi brand outlets (MBOs), exclusive brand outlets (EBOs), factory outlets and so on. Out of these organized formats in retail, EBO format retailers who keep one-house products, either single or a complete range items of one company, have been taken into consideration in order to investigate influencing determinates and their positions in the market.
Choosing a particular retail store depends on several affecting factors. Besides this, store choice decision is highly sensitive and creates dilemma among shoppers with regard to store choice. Hence retailers are gradually making an effort to create a constructive image with respect to retail mix including in-store environments, products and other relevant attributes in this intense competitive market (Baker, Parasuraman, Grewal, & Voss, 2002).
At present, the retailers have three options to cope up with the increased competition such as to maintain their loyal patrons, attract new clientele and attract switching shoppers. For enhancement on these issues, retailers try to identify store choice influencing factors to develop appropriate strategies. EBOs undertaken in this research are Provogue, Levi’s, Westside, Wills Lifestyle, John Players, Spykar, United Colors of Benetton (UCB), and Duke, which carry formal dresses, casual dresses and so on.
Literature Review
Store choice is all about knowing how the store is preferred by shoppers with respect to certain attributes. Store choice among shoppers can increase by favourable store location, ambience and the focus on merchandise (Boles, Babin, Brashear, & Brooks, 2001; Das, Guin, & Datta, 2013). Hence, there is a need to not only consider factors like location but also other relevant aspects among shoppers (Sinha & Banerjee, 2004). Besides this, low price and wide selection are also accounted for store choice (Finn & Louviere, 1996). Further, Teas (1994) and Welker (2004) revealed similar results and added a few more factors such as effective transaction and response of employees. Store attributes appear to be dependent on the store format (Amine & Cadenat, 2003). Shopper’s choice also matters whenever he makes a choice to shop. Laaksonen (1993) conducted a study on retail format choice decision and found that the demographic characteristics are also the key variables of store choice with regard to a particular format. Customers’ familiarities with the store enable them to purchase more with less perceived risk (Basu, 2015). Shoppers’ personalities, values, lifestyle and their demographic characteristics are the crucial determinants while choosing a particular store (Dodge & Summer, 1969). Prior information related to a store decides shopper frequencies and their involvement levels (Sinha & Banerjee, 2004). Quantity of purchase also matters while choosing a store format (Bell & Lattin, 1998). Dash, Schiffman, and Berenson (1976) also found that more information about a product leads to more shopping. Fox, Montgomery, and Lodish (2004) and Gomez, McLaughlin, and Wittink (2004) revealed that store attributes, as well as product attributes, are the crucial determinants of the store choice. Other dimensions explained that outlet choice is based on sales personal efforts, store atmospherics and product price (Bhatnagar & Ratchford, 2004).
Research Gap
Considering geographical aspects with regard to the factors affecting the choice of exclusive brand ready-to-wear outlets, it revealed that most of the studies have looked at international stores, while very less is recognized about how Indian shoppers take action while choosing a particular store. Furthermore, earlier researchers have recognized numerous factors which influence store choice. Morschett, Swoboda, and Foscht (2005) recognized various influencing factors such as store service, as well as product service, which lead to store choice, but have not explained the reasons of their significance; this could be considered as an important gap for researchers (Sinha & Banerjee, 2004). Further, the retail service quality scale (RSQS) employed in European and Western countries is not applicable in Asian countries in its original form. Thus, there is a need for the application of the apparel store service and product quality scale (ASSPQS) on those exclusive apparel retailers which operate in the Indian context. Therefore, this research used ASSPQS in ready-to-wear EBOs of India to contribute to the, somewhat, limited studies in this area.
Further, existing literature indicates that shoppers’ perceptions of a retail store’s choice with reference to specific attributes have not been portrayed graphically through multidimensional attribute-based perceptual maps. Hence, this research endeavours to pile up that gap and investigates the present positions of select stores with the help of multi-dimensional attribute-based perceptual mapping.
Conceptual Framework
In this study, the researcher has looked at three factors, these are store attributes, product attributes and other attributes. The store attribute factor is represented by customer service, promotion, physical aspects of the store, return policies and assortment of merchandise. The product attribute factor is represented through variety and appearance of apparels, physical comforts of apparels, quality of merchandise and price of merchandise. Under other attributes, considerable items are convenience facilities, perceived risk and purchase volume.
Objectives
This research aims (a) to determine the various influencing factors affecting exclusive retail store choice. Subsequently, the researcher has made (b) an attempt to understand the positions of selected EBOs based on determined attributes as perceived by shoppers. The purpose is also (c) investigating the importance of identified attributes among shoppers, when choosing ready-to-wear EBOs and finally (d) suggesting measures that shall facilitate effective marketing policies to organized exclusive brand retailers.
Rationale of the Study
In sum, the organized retail sector is rising at a faster pace under which the ready-to-wear retail market consists of 33 per cent which is the largest in the organized retail pie. Furthermore, Indians are crazy about movies and the Bollywood business influences the ready-made apparel market. Hence, the understanding and identification of significant factors of apparel store choice and the current position of select stores has become essential for EBO retailers. Perceptual Map makes easy in identification of current position of retail stores. Select districts of Madhya Pradesh (MP) in India were chosen due to the availability of all major stores, and it was also unexplored by earlier researchers.
Methodology
From the perspective of application, this research is an ‘applied research’ as it involves resolving factual problems in order to provide solutions to organized EBOs. From the perspective of objectives, this research is an ‘exploratory research’ which is undertaken to understand behavioural and representative constructs in order to understand factors affecting store choice in the Indian context. The deficiency of earlier research and new insights validate an exploratory study (Malhotra & Birks, 2000). Besides this, an exploratory study conducted at the very beginning provides wide opportunities to investigate the possibilities (Saunders, Lewis, & Thornhill, 2007).
From the viewpoint of the enquiry mode employed, the researcher applied a ‘quantitative approach’. The researcher enumerated the information which was collected from the participants.
This study is a cross-sectional ‘one shot’ as the researcher gathered all the responses at a single point in time. The researcher recorded the information that is present in the population, without any manipulation in population.
Eight single-brand organized department apparel retail stores in MP, India, namely, Provogue, Levi’s, Westside, Wills Lifestyle, John Players, Spykar, UCB and Duke, situated in malls and main markets were selected. Shoppers who visited and bought apparel from these stores were the final sample unit. Participants were approached during their usual shopping time. The youth generally shop in the afternoon and evening, housewives visit malls mostly in the morning and for families, as well as for employed persons, the shopping takes place in the evening; every bit of effort was made to gather information from various demographic groups. Subjects suspected of the ‘not interested in response’ were expelled. Considering the intricacy, an intercept survey was finally adopted. The interviewer intercepts the shoppers in shopping malls who have completed their shopping or are walking in the surrounding area of the select stores.
The researcher followed three steps under sampling. In the first step, the whole population is divided into groups (geographically grouped into relatively homogenous groups) that is all 51 districts of MP, India; in the second step, six districts (clusters) of MP were selected through randomization, namely, Indore, Bhopal, Rewa, Jabalpur, Ujjain and Gwalior; and in the third step, the units, namely, the shoppers of the selected EBOs, were selected from these six clusters.
The sample size was determined in consideration with permissible error, desired precision, degree of confidence level and the number of interested sub-groups within the sample. On the basis of these factors, the whole sample size was worked out as six districts of MP * 8 EBOs * 10 shoppers = 480. The information was thereafter collected, and 328 responses were completed and found fit for analysis.
Pretesting Results
Once the instrument was created, the researcher approached 25 raters (10 faculty members and 15 scholars) to review the questionnaire for the items’ credibility as a way of pretesting. The inappropriate items stood apart and were improved through the scale content validity index (S-CVI) and the item content validity index (I-CVI). The modified pretested layout of the questionnaire was administered on the respondents for the pilot study. Table 1 shows content validity index.
Content/Rater Validity Index (CVI)
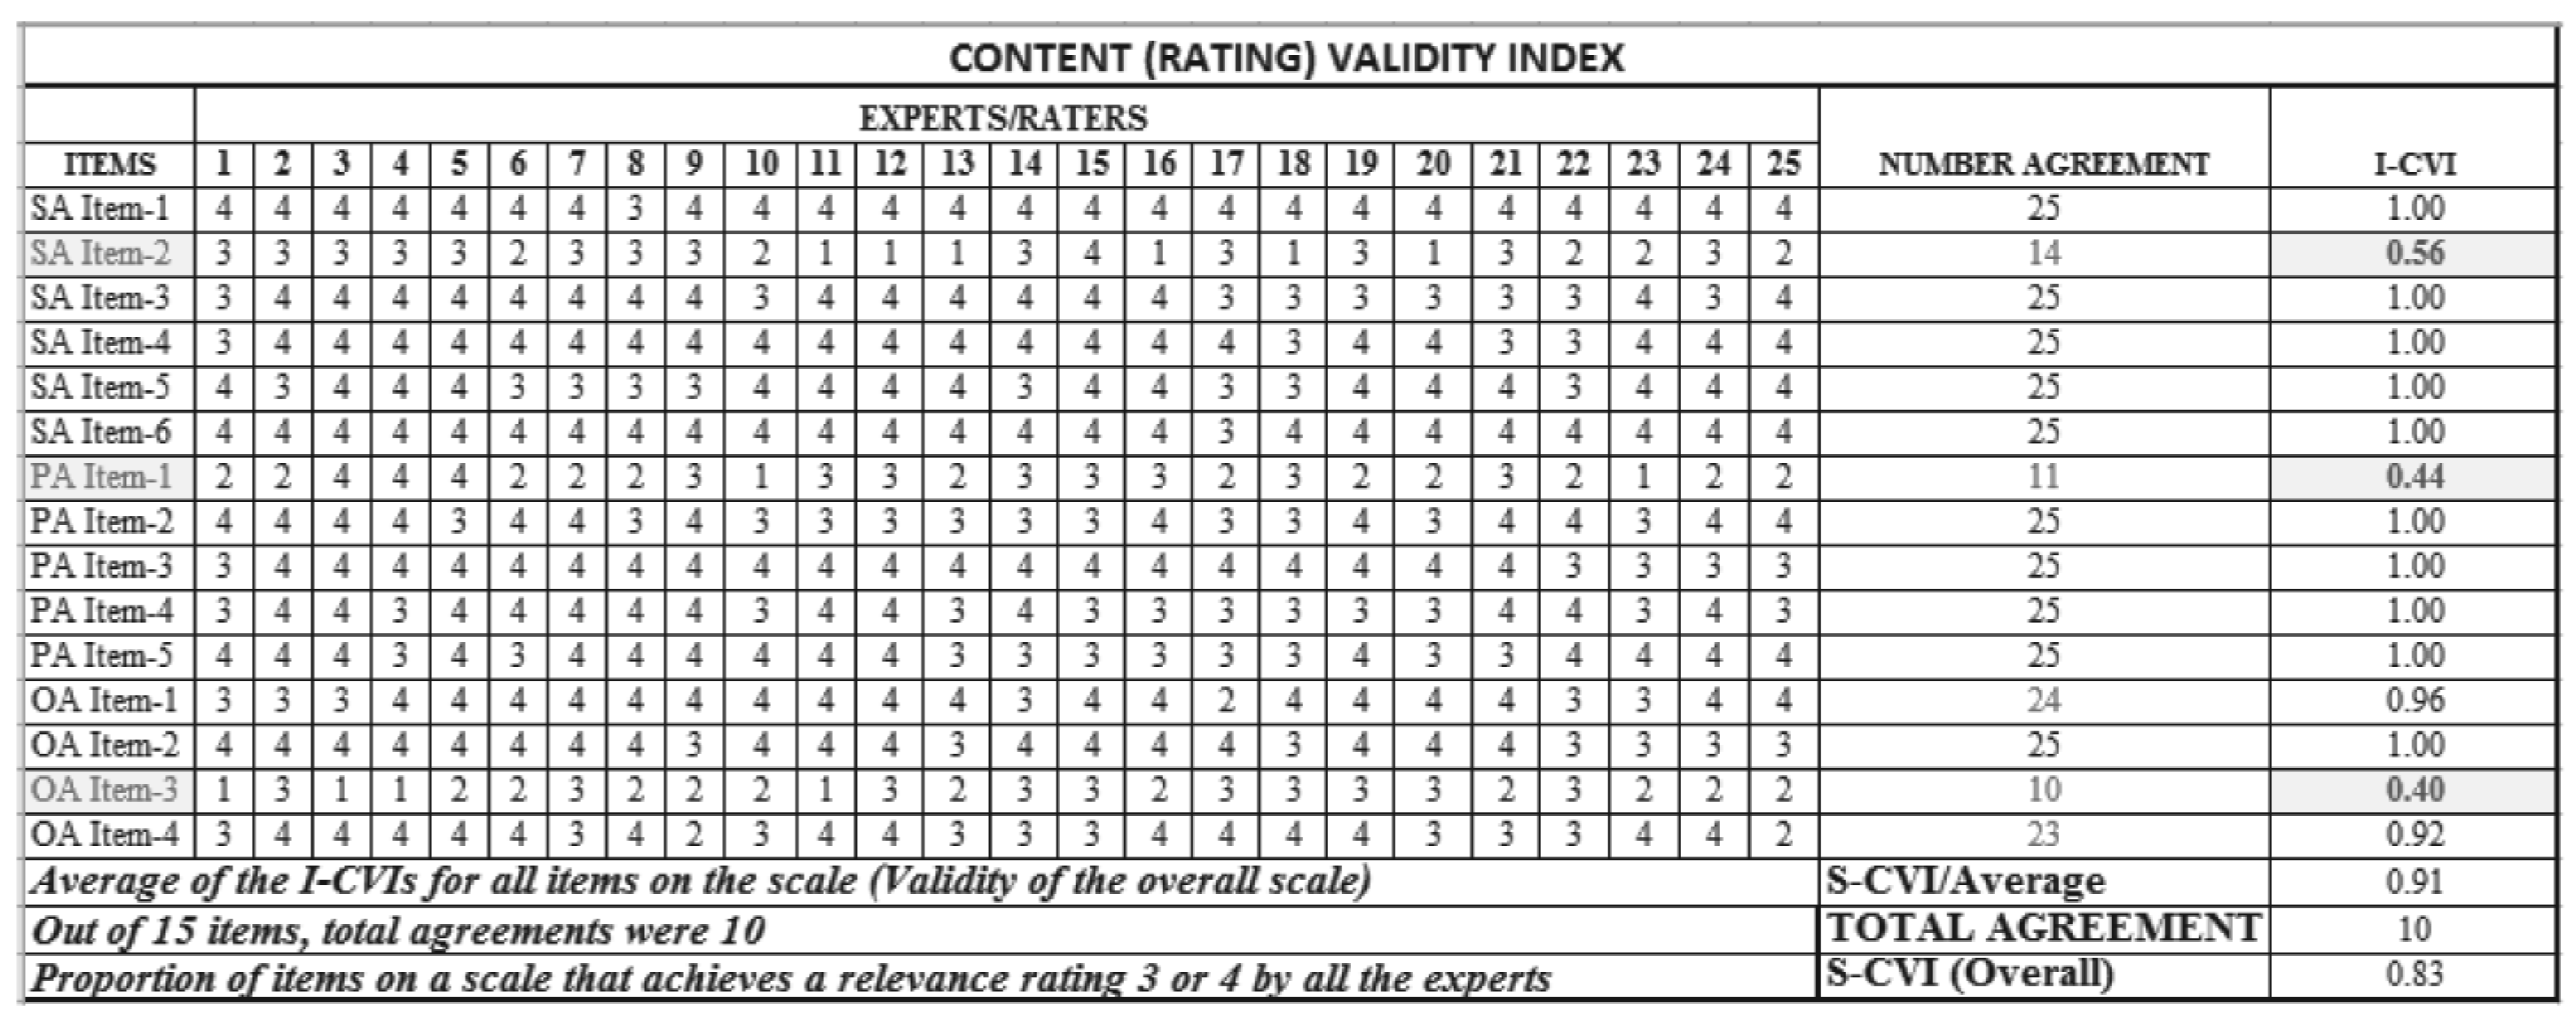
Key: I-CVI = item content validity index (content validity of individual item); S-CVI = scale content validity index; SA = store attributes; PA = product attributes; and OA = other attributes.
Number three or four in CVI shows that the content is valid and consistent with the objectives of the research (Lynn, 1986). The 14 content raters for SA item 2; 11 content raters for PA item 1; and 10 content raters for OA item 3 rate items’ relevancy. Thus I-CVI (i.e., efficacy of individual items) is 14/25 = 0.56; 11/25 = 0.44; and 10/25 = 0.40, respectively, which does not meet the required level that is 0.83, so this item is dropped (Devon et al., 2007). Furthermore, enduring items were valid as the scores of all I-CVIs values are in between 0.84 and 1.00; S-CVI (i.e., efficacy of scale) also is valid with the score 0.91 (S-CVI’s acceptable value is 0.90). The acceptable value of S-CVI (overall) is < 0.60; here, it is 0.83 and thus acceptable. At last, three items (i.e., SA item 2; PA item 1; and OA item 3) were removed due to the invalid yielded value.
Exploratory Factor Analysis (EFA)
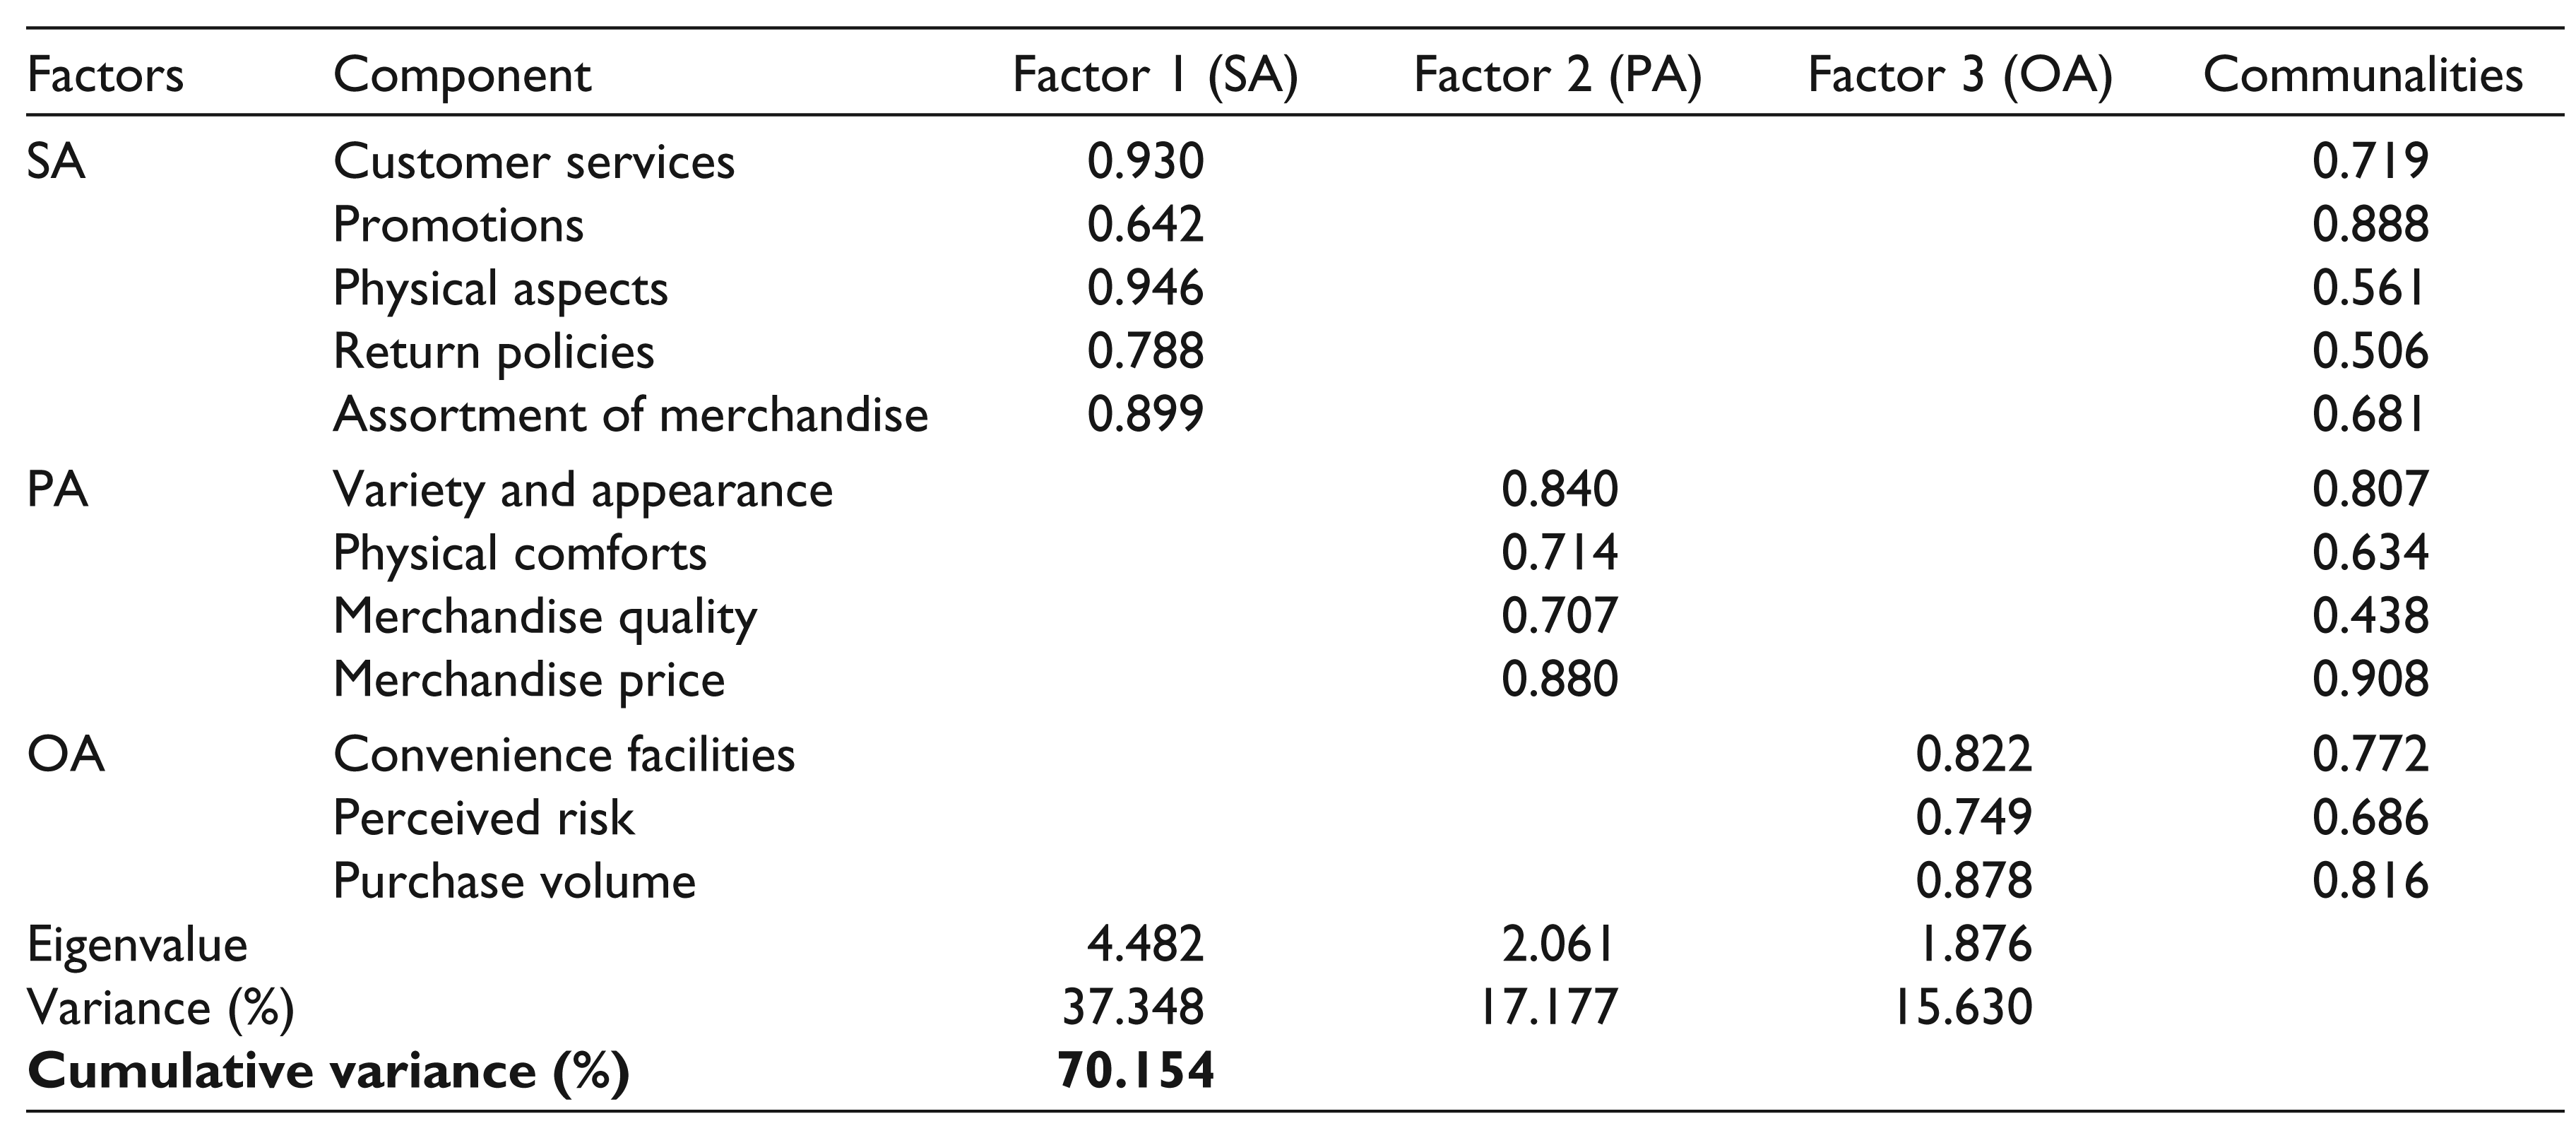
Principle component method using the varimax rotation method was applied; factors having more than one eigenvalue were retained. Eigenvalues of three factors are in an acceptable range, and these three factors account for 70.154 per cent of the total variance. The first factor that is SA representative items includes customer service (0.930), promotion (0.642), physical aspects of store (0.946), return policies (0.788) and assortment of merchandise (0.899). The second factor is associated with variety and appearance of apparels (0.840), physical comforts of apparels (0.714), quality of merchandise (0.707) and price of merchandise (0.880); it is defined as PA. The third factor is associated with conveniences (0.822), perceived risk (0.749) and purchase volume (0.878); this factor is named OA (refer to Table 2).
Condensed Table of Factor Analysis
Confirmatory Factor Analysis (CFA)
CFA was also run after EFA as both the methods are complementary to each other. CFA was used on all independent factors such as SA, PA or OA for cross validation of the identified latent factors. Standardized regression weight values having less than 0.5 were not considered in CFA.
Confirmatory Factor Analysis of Store Attributes
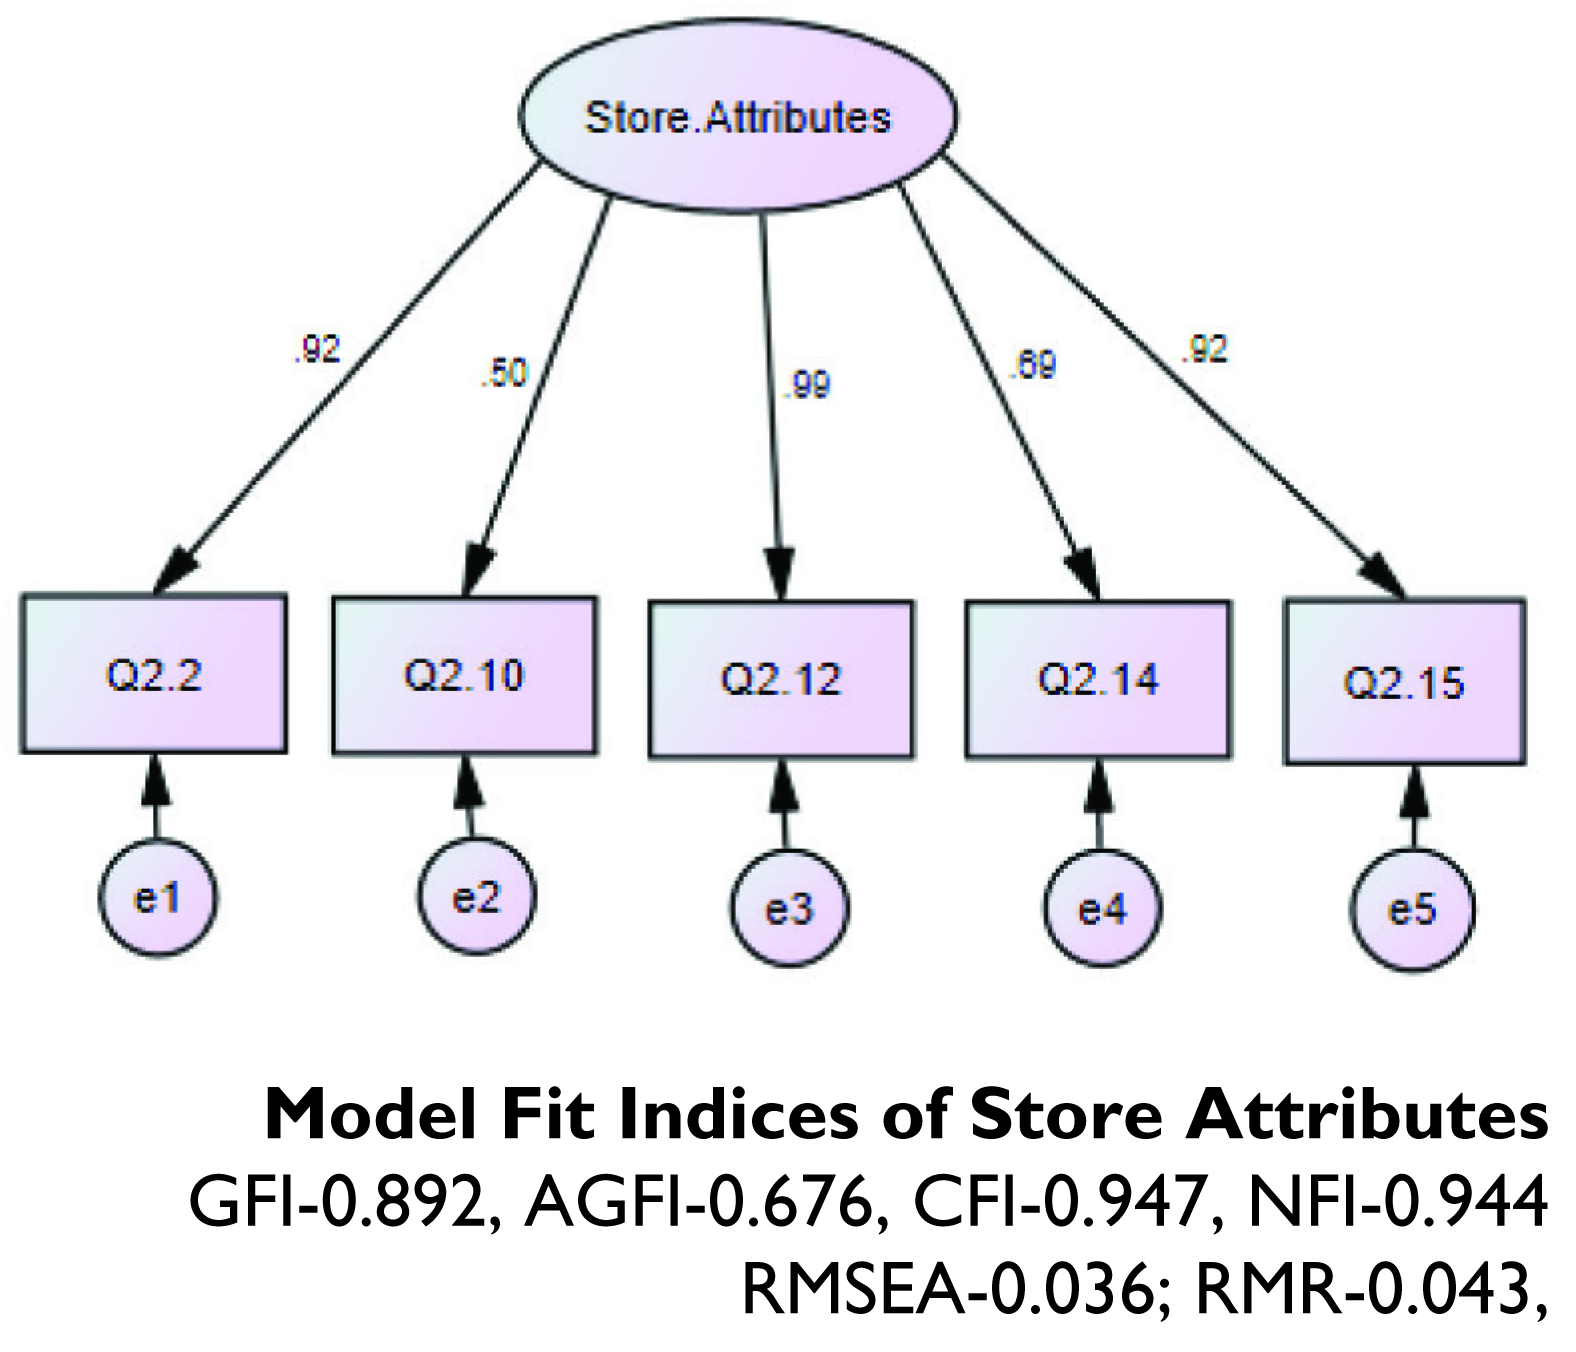
The factor of SA extracted through EFA was further analysed through CFA. It revealed that all the five observed items are highly represented SAs. The CFA results revealed a good model fit, and all items of SAs are also significant after modification (refer to Figure 1).
Confirmatory Factor Analysis of Product Attributes
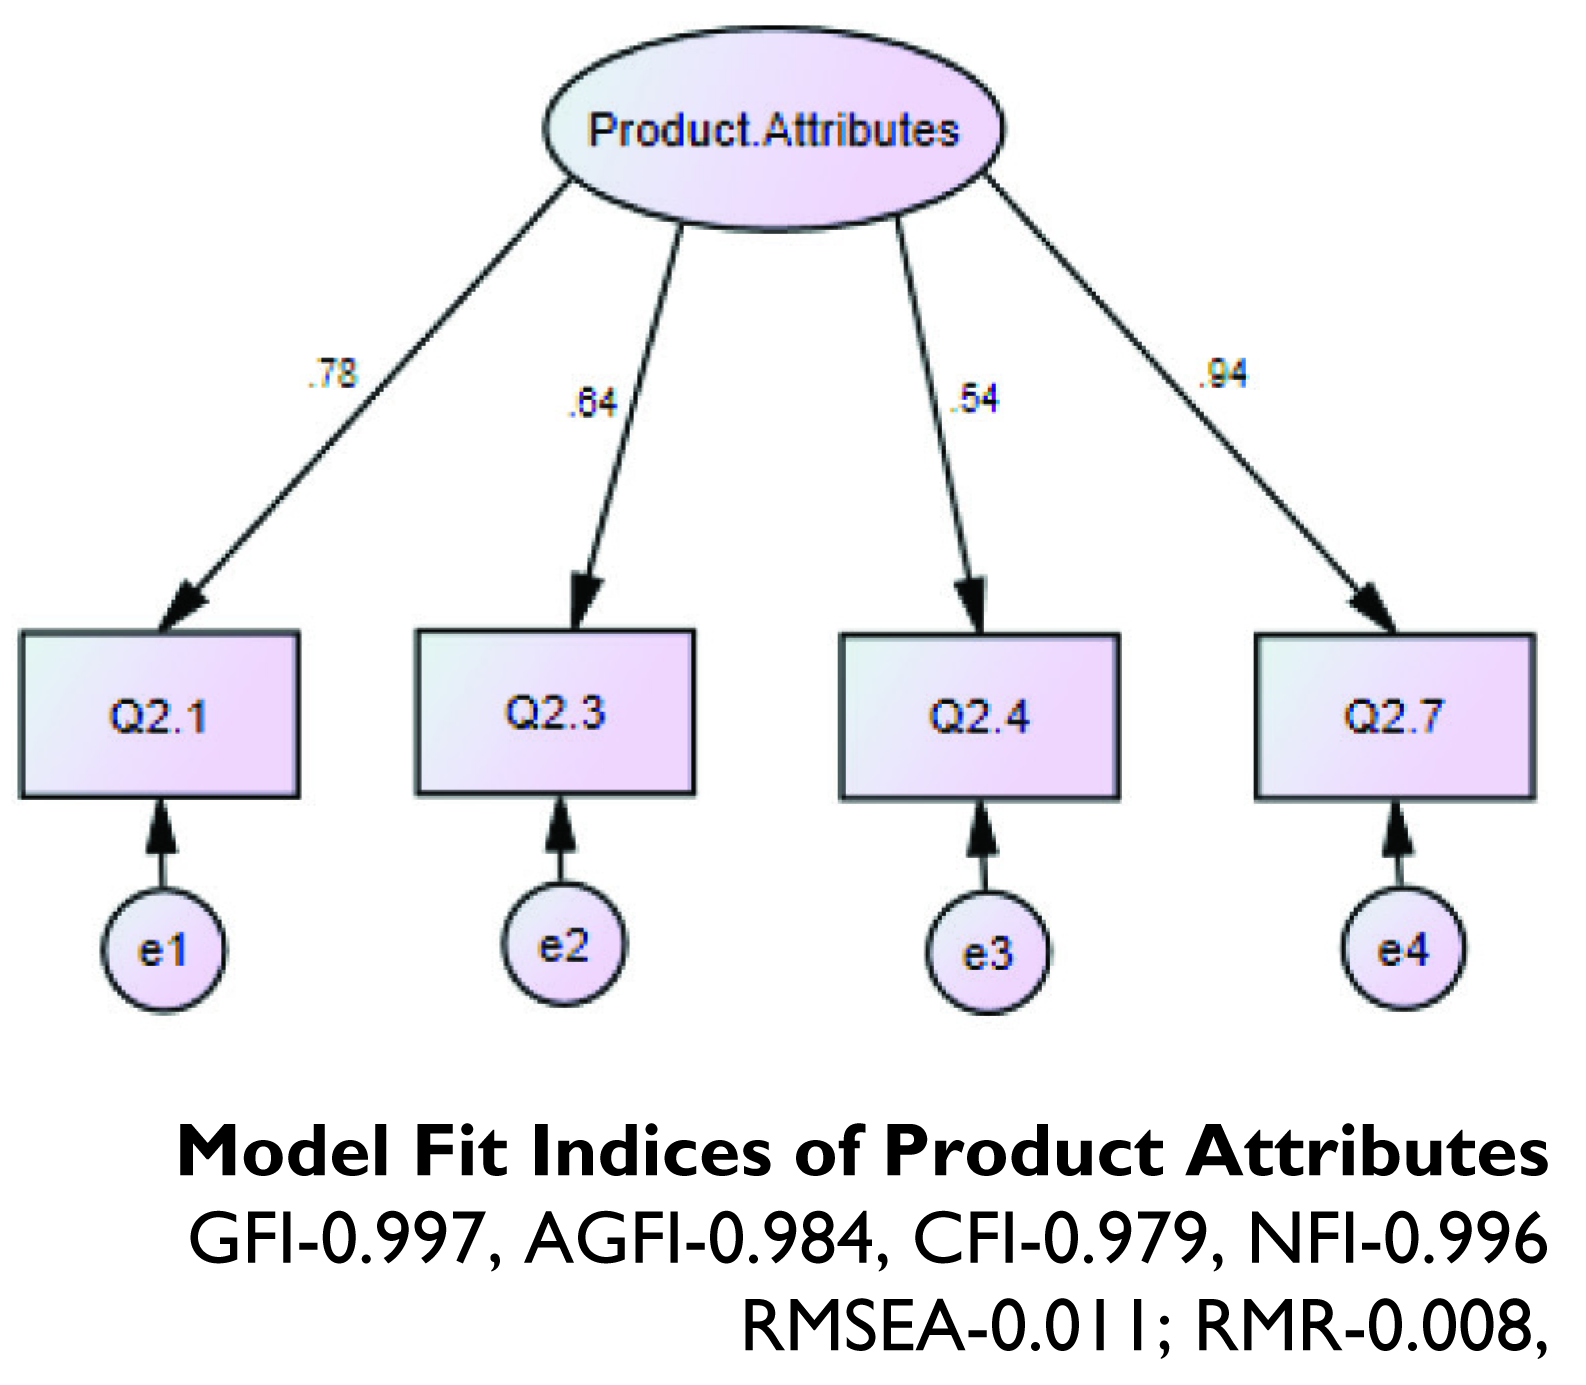
The CFA analysis showed that all the observed items are highly loaded on their respective factor.
The PA construct comprises four items, namely, variety and appearance, physical comforts, merchandise quality and merchandise price. CFA findings showed that all the observed items represent their respective factors, so there was no need to delete any items from Figure 2.
Confirmatory Factor Analysis of Other Attributes
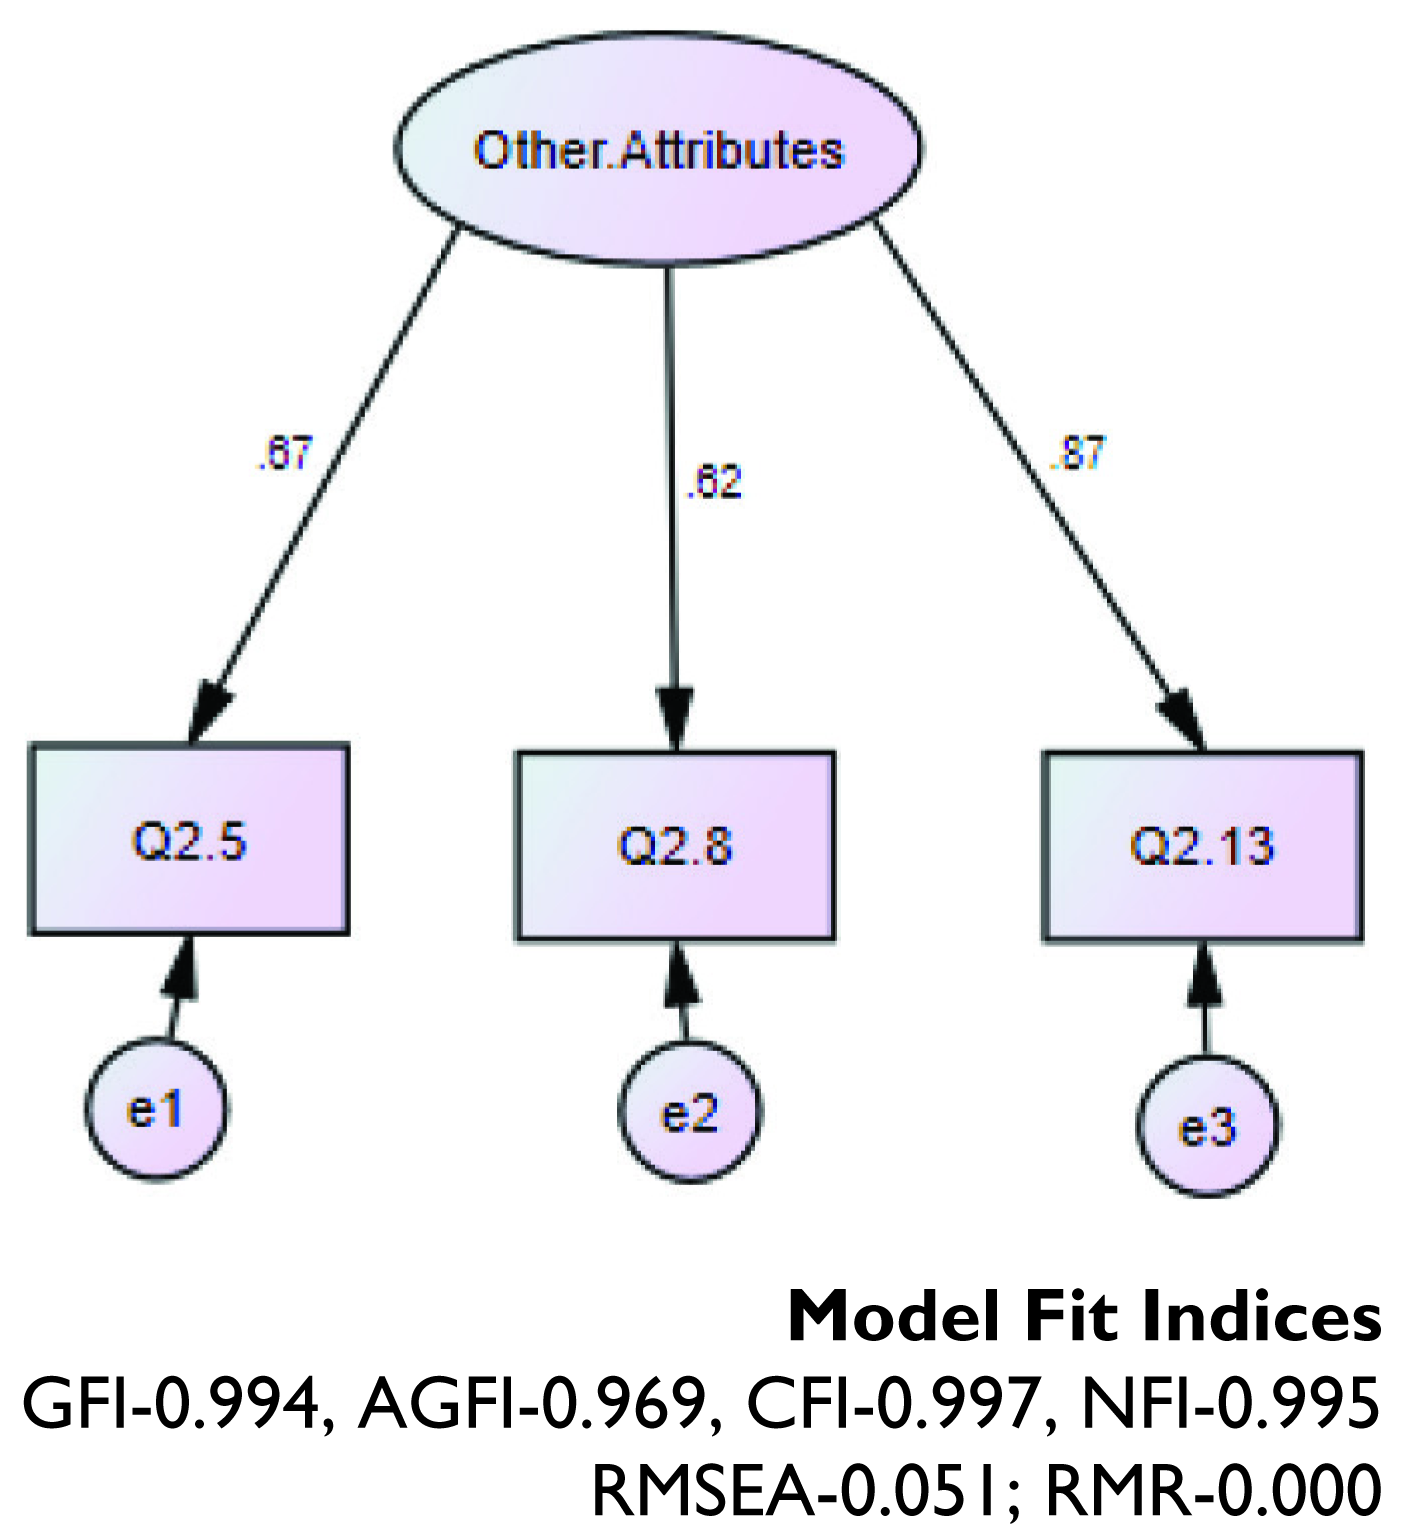
The third factor, namely, OA, is represented by three manifest variables, and standardized regression weights of all the three items are also acceptable. The CFA indicates that all three items had a good model fit in Figure 3. CFA scores of all three scales are found to have a good model fit. The goodness of fit measures confirmatory fit index (CFI), goodness of fit index (GFI) and adjusted goodness of fit index (AGFI) of OA which also signify the same result.
Common Method Variance Via Harman’s One-Factor Test
Principal component method (un-rotated) was used to explain the variance. Score of all three constructs are as follows: SA, 37.34 per cent; PA, 17.17 per cent; and OA 15.56 per cent. It revealed that the first un-rotated factor is less than 50 per cent, which indicated favourable results.
Psychometric Properties of the Instrument
Validity
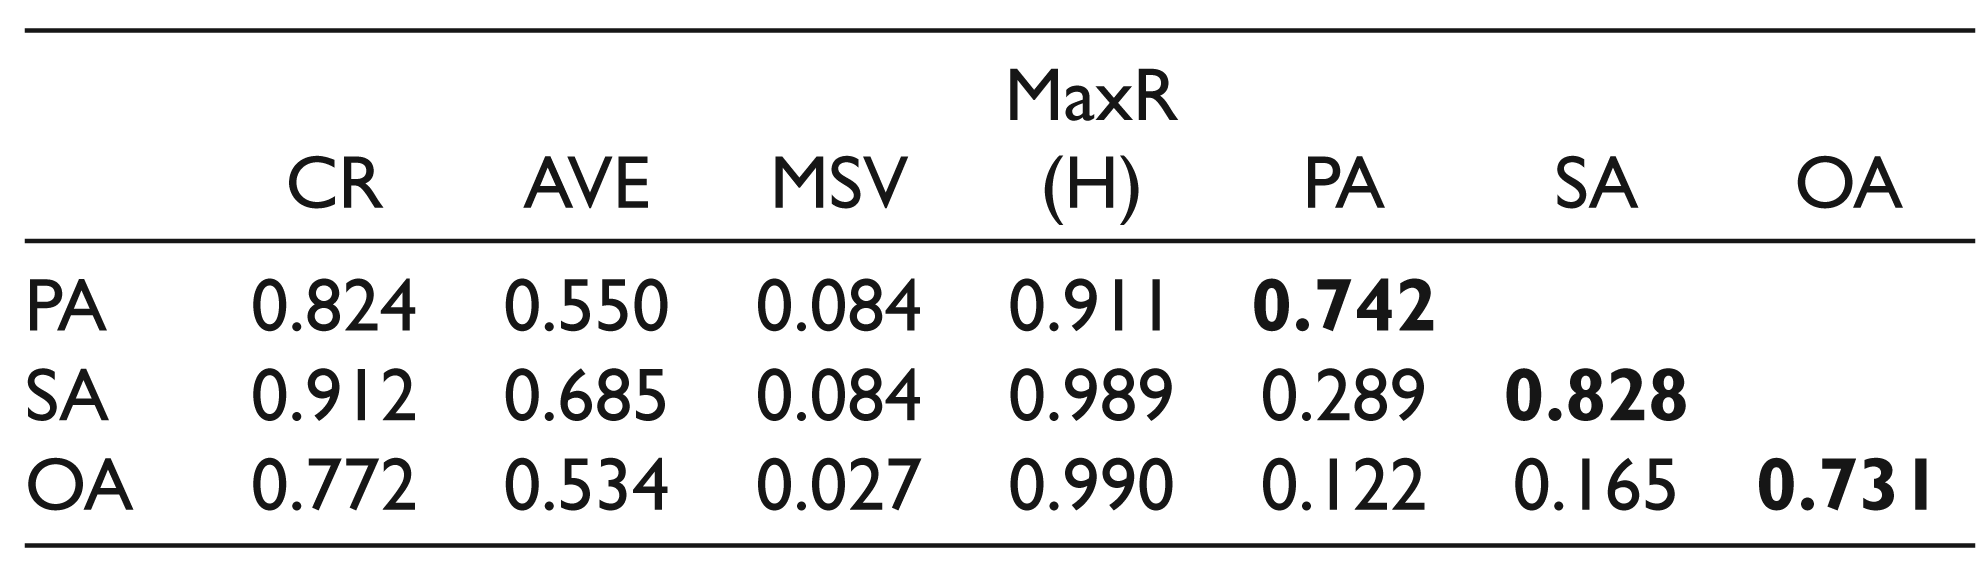
Validity is assessed through (a) criterion validity, which is established through comparing ASSPQS with other established measures; (b) predictive validity, which is achieved as the researcher enabled himself to predict the outcome and future event; (c) concurrent validity, which includes dimensions of adopted ASSPQS that are found to be consistent with other established scales which established concurrent validity (refer to Table 3); (d) nomological validity, achieved as it is found that a logical relationship existed between the construct and items of the adopted scale that is ASSPQS; further, the items and construct relatedness is also assessed (refer to Table 3); (e) discriminant validity, which includes association among different items under their respective factors which was found in the scale; besides this, the identified factors discriminate among each other and are free from redundant items (refer to Table 3); (f) construct validity—it tries to improve through ‘thinking through the concept’, ‘compilation of multiple source of evidence’ and ‘expert critique about construct’; it is more concerned with the ability to capture the latent variable (refer to Table 3); (g) convergent validity—it was established as there was no cross-correlation of items with factors well with each other within their parent factor (refer to Table 3); and (h) construct (factorial) and discriminant (divergent) validity—the bold value is represented for the square root of average variance extracted (AVE while the other value is the correlation of latent constructs (refer to Table 3).
Convergent and Discriminant Validity
Reliability
The Cronbach’s alpha score is 0.830; it is a satisfactory reliability coefficient. Item-wise reliability scores are as follows: SA, 0.910; PA, 0.811; and OA, 0.762.
Instrument
The items of this questionnaire have been taken from Manolis, Keep, Joyce, and Lambert (1994), Dabholkar, Thorpe, and Rentz (1996); Yoo and Chang (2005); and Sinha, Banerjee, and Uniyal (2002). Employed-structured instruments have two sections. The first section includes demographic characteristics of the respondents, while the second section includes retail SAs, PAs and other influencing attribute statements. Responses of all the statements in the questionnaire with respect to the second section have a 5-point Likert scale.
Data Analysis and Interpretation
Sample Description
Out of the 328 participants, 47 per cent were males and 53 per cent were females. Majority of the sample that is 32 per cent were earning between ₹10,000 and ₹25,000 a month. Furthermore, majority of the participants that is 43 per cent shopped between three and five times in a month, pursued by 29 per cent who shopped at least once in a month.
Positions of Select Stores in the Organized Ready-to-wear Apparel Industry through Multidimensional Perceptual Mapping
The participants approached to identify the present positions of selected EBOs based on the 12 identified attributes. First, researcher calculated mean scores of select stores and after that plotted on multidimensional perceptual maps. The multidimensional perceptual maps using factor analysis allow an evaluation of each store in relation to the other competitor stores. It indicates how ‘close’ one store is to competing with other stores. Stores near to each other are interpreted similar and competitive in terms of service, while stores situated at a distance are less similar and competitive with each other, and their target shoppers are also not similar.
The perceptual map can help marketers devise the affective marketing strategies as per shoppers’ choice (Gilligan & Wilson, 2003). The multidimensional maps plot shoppers’ preferences regarding the selected organized stores, including their strengths and weaknesses. Table 4 shows the mean scores of all the selected stores on the identified attributes deemed to be most important for shoppers.
Stores’ Comparison based on Attribute Means
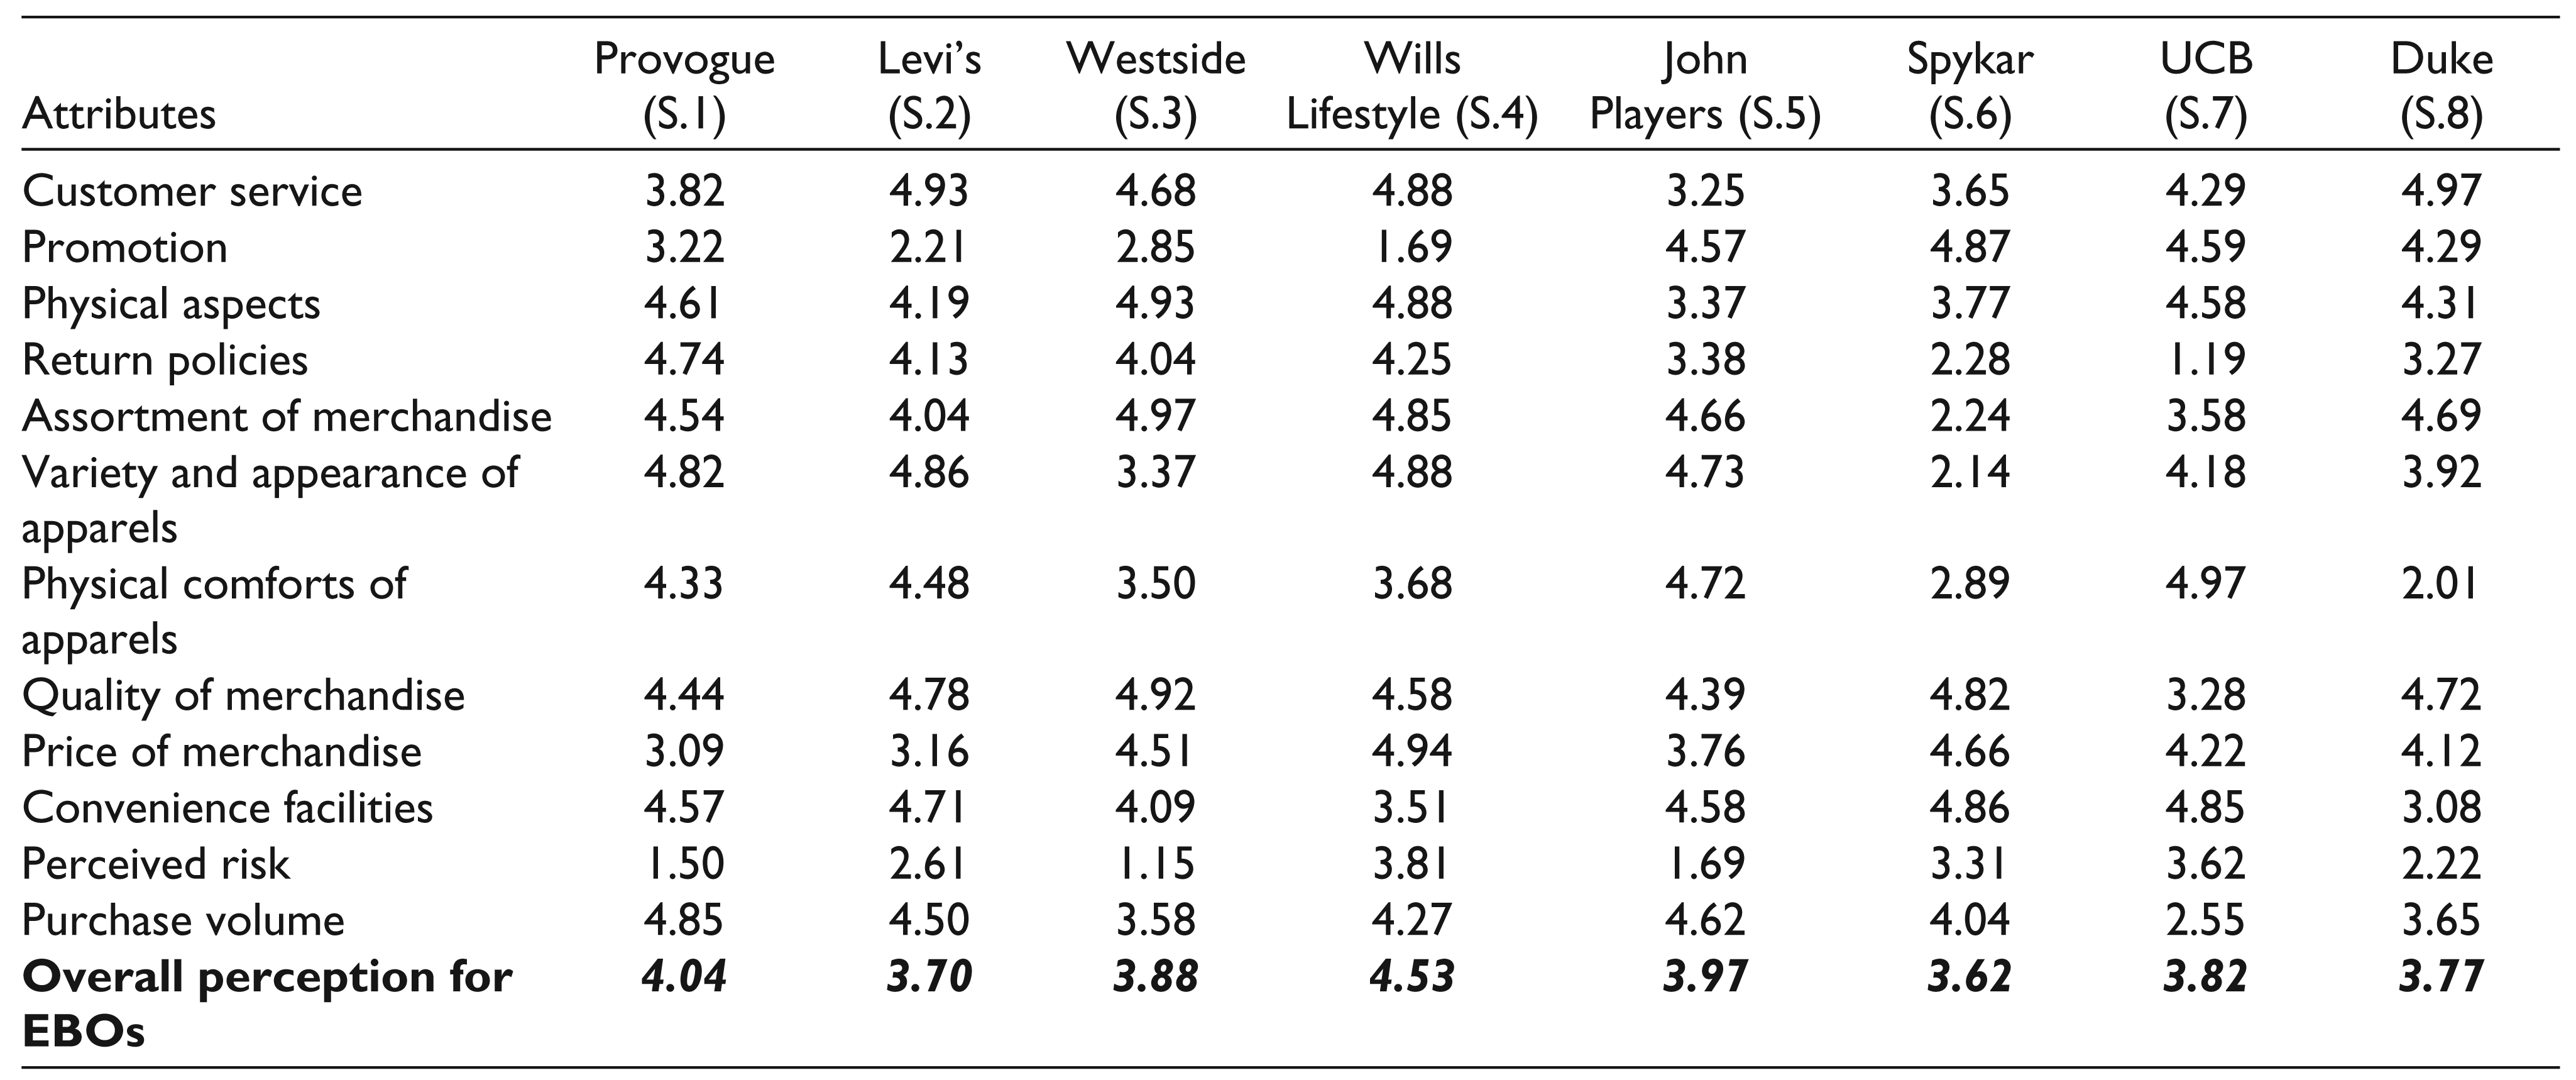
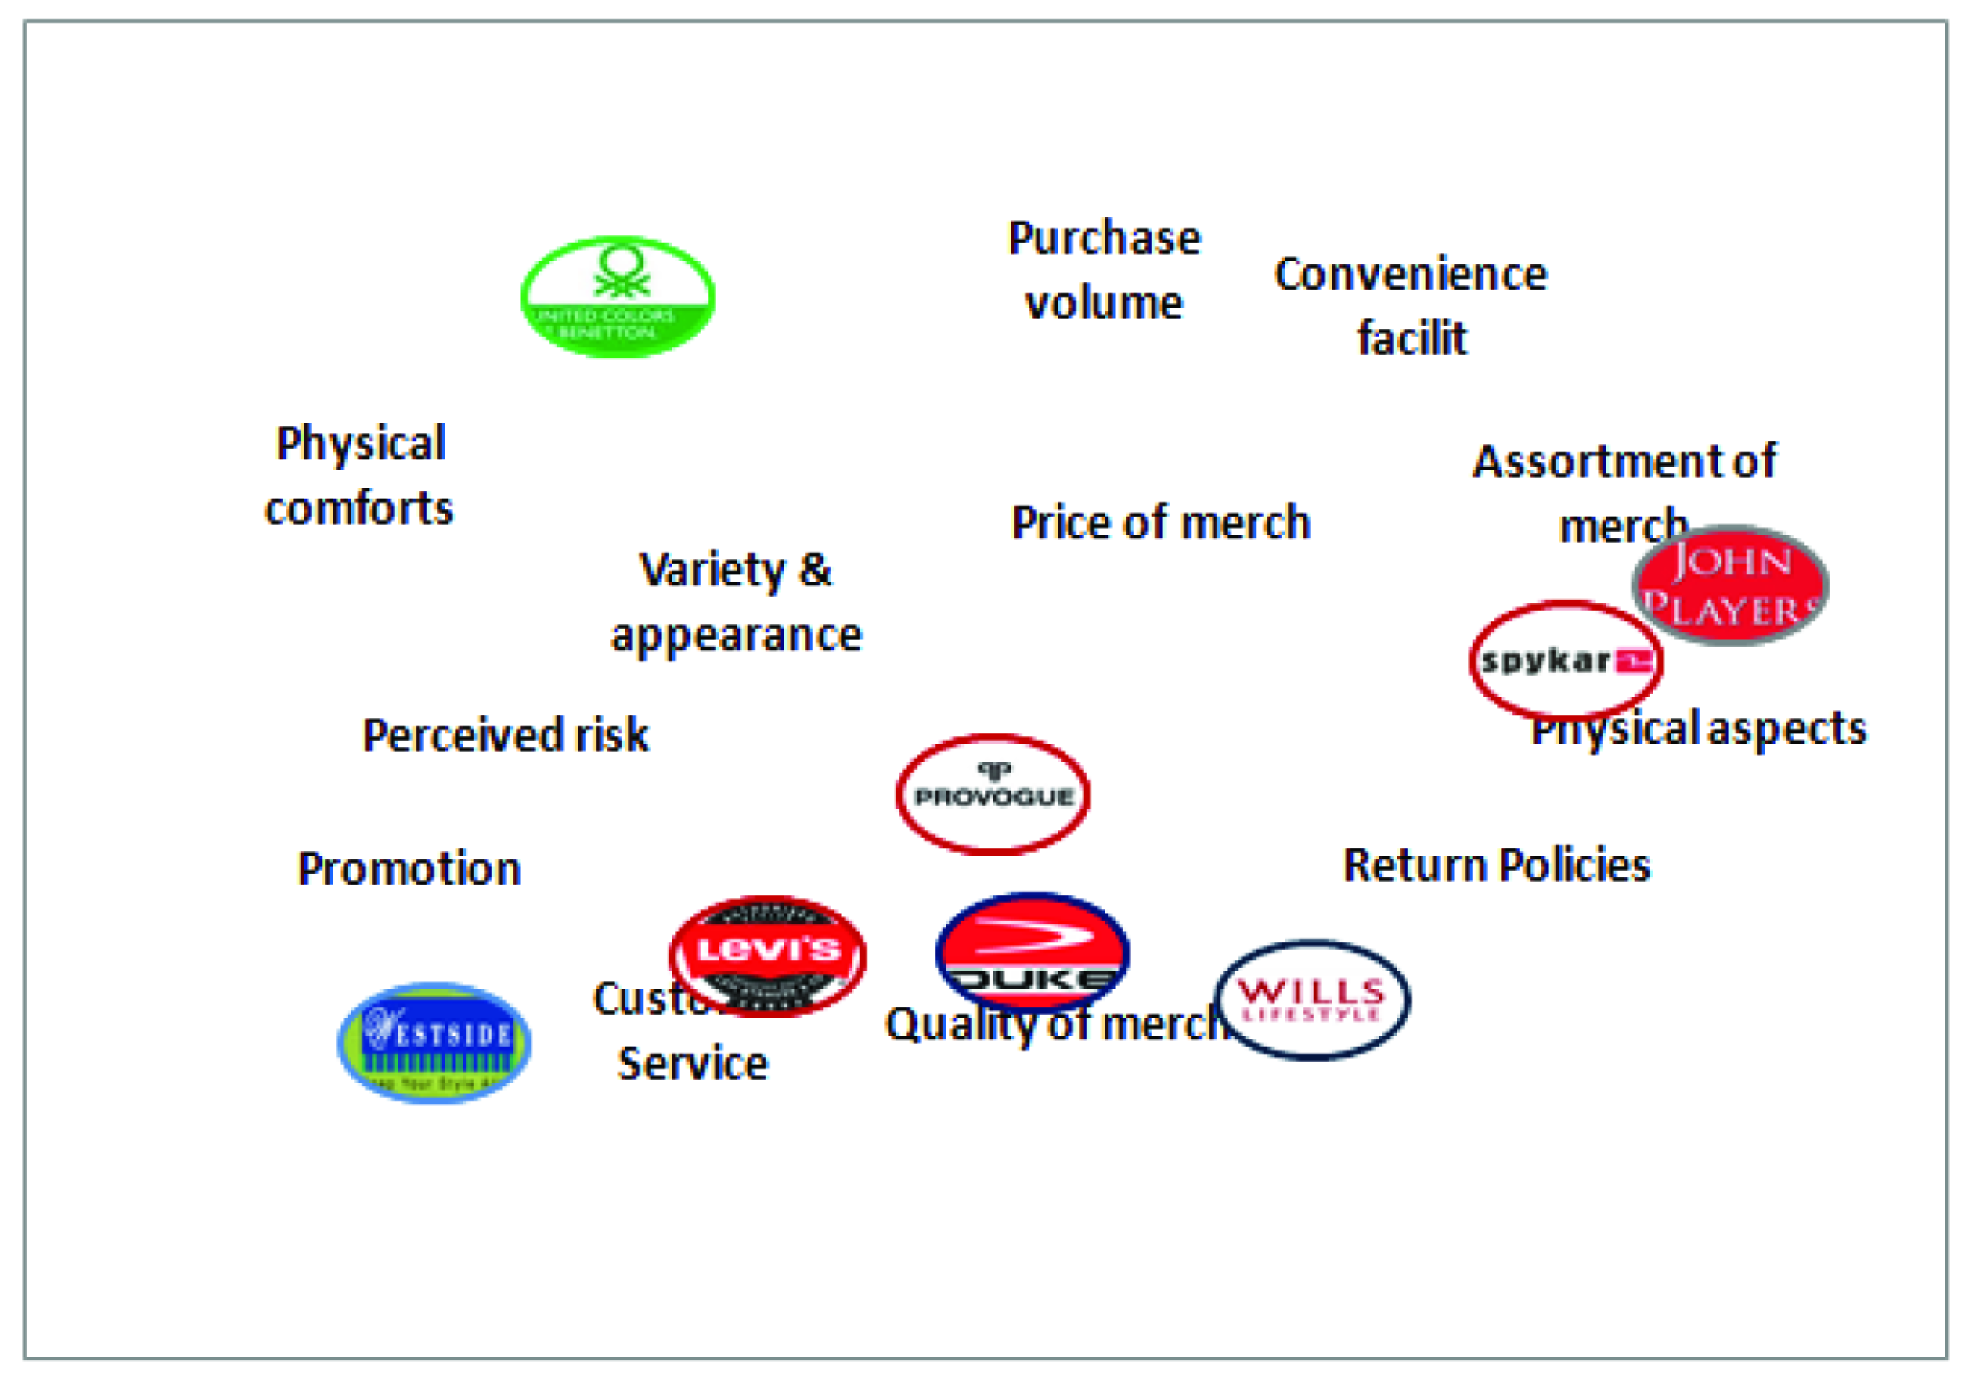
Perceptual maps are based on identified attributes of select stores presenting comparative situations of the stores and this helps in choosing among stores. Wills Lifestyle (mean = 4.53) is perceived as the best among the other select stores, followed by Provogue (mean = 4.04) and John Players (mean = 3.97). Besides this, the overall perception of other selected stores in the minds of shoppers is as follows: Westside (mean = 3.88); UCB (mean = 3.82), Duke (mean = 3.77), Levi’s (mean = 3.70) and Spykar (mean = 3.62). Figure 4 presents the perceptual map of the organized ready-to-wear apparel industry.
The organized ready-to-wear apparel stores were perceived analogous in terms of offering customer service, physical aspects, convenience, quality of merchandise and so on. Among these organized stores, UCB was perceived as separate with all other competitors. The UCB was also positioned differently among other stores. While Duke, Wills Lifestyle and Levi’s stores are having similar kind of position in shopper’s mind. John Players and Spykar were perceived similar in terms of the assortment of merchandise and physical aspects of the store. Provogue was perceived as a middle-of-the-road store, having all the attributes.
Importance of Attributes Among Shoppers When Choosing Ready-to-wear EBOs
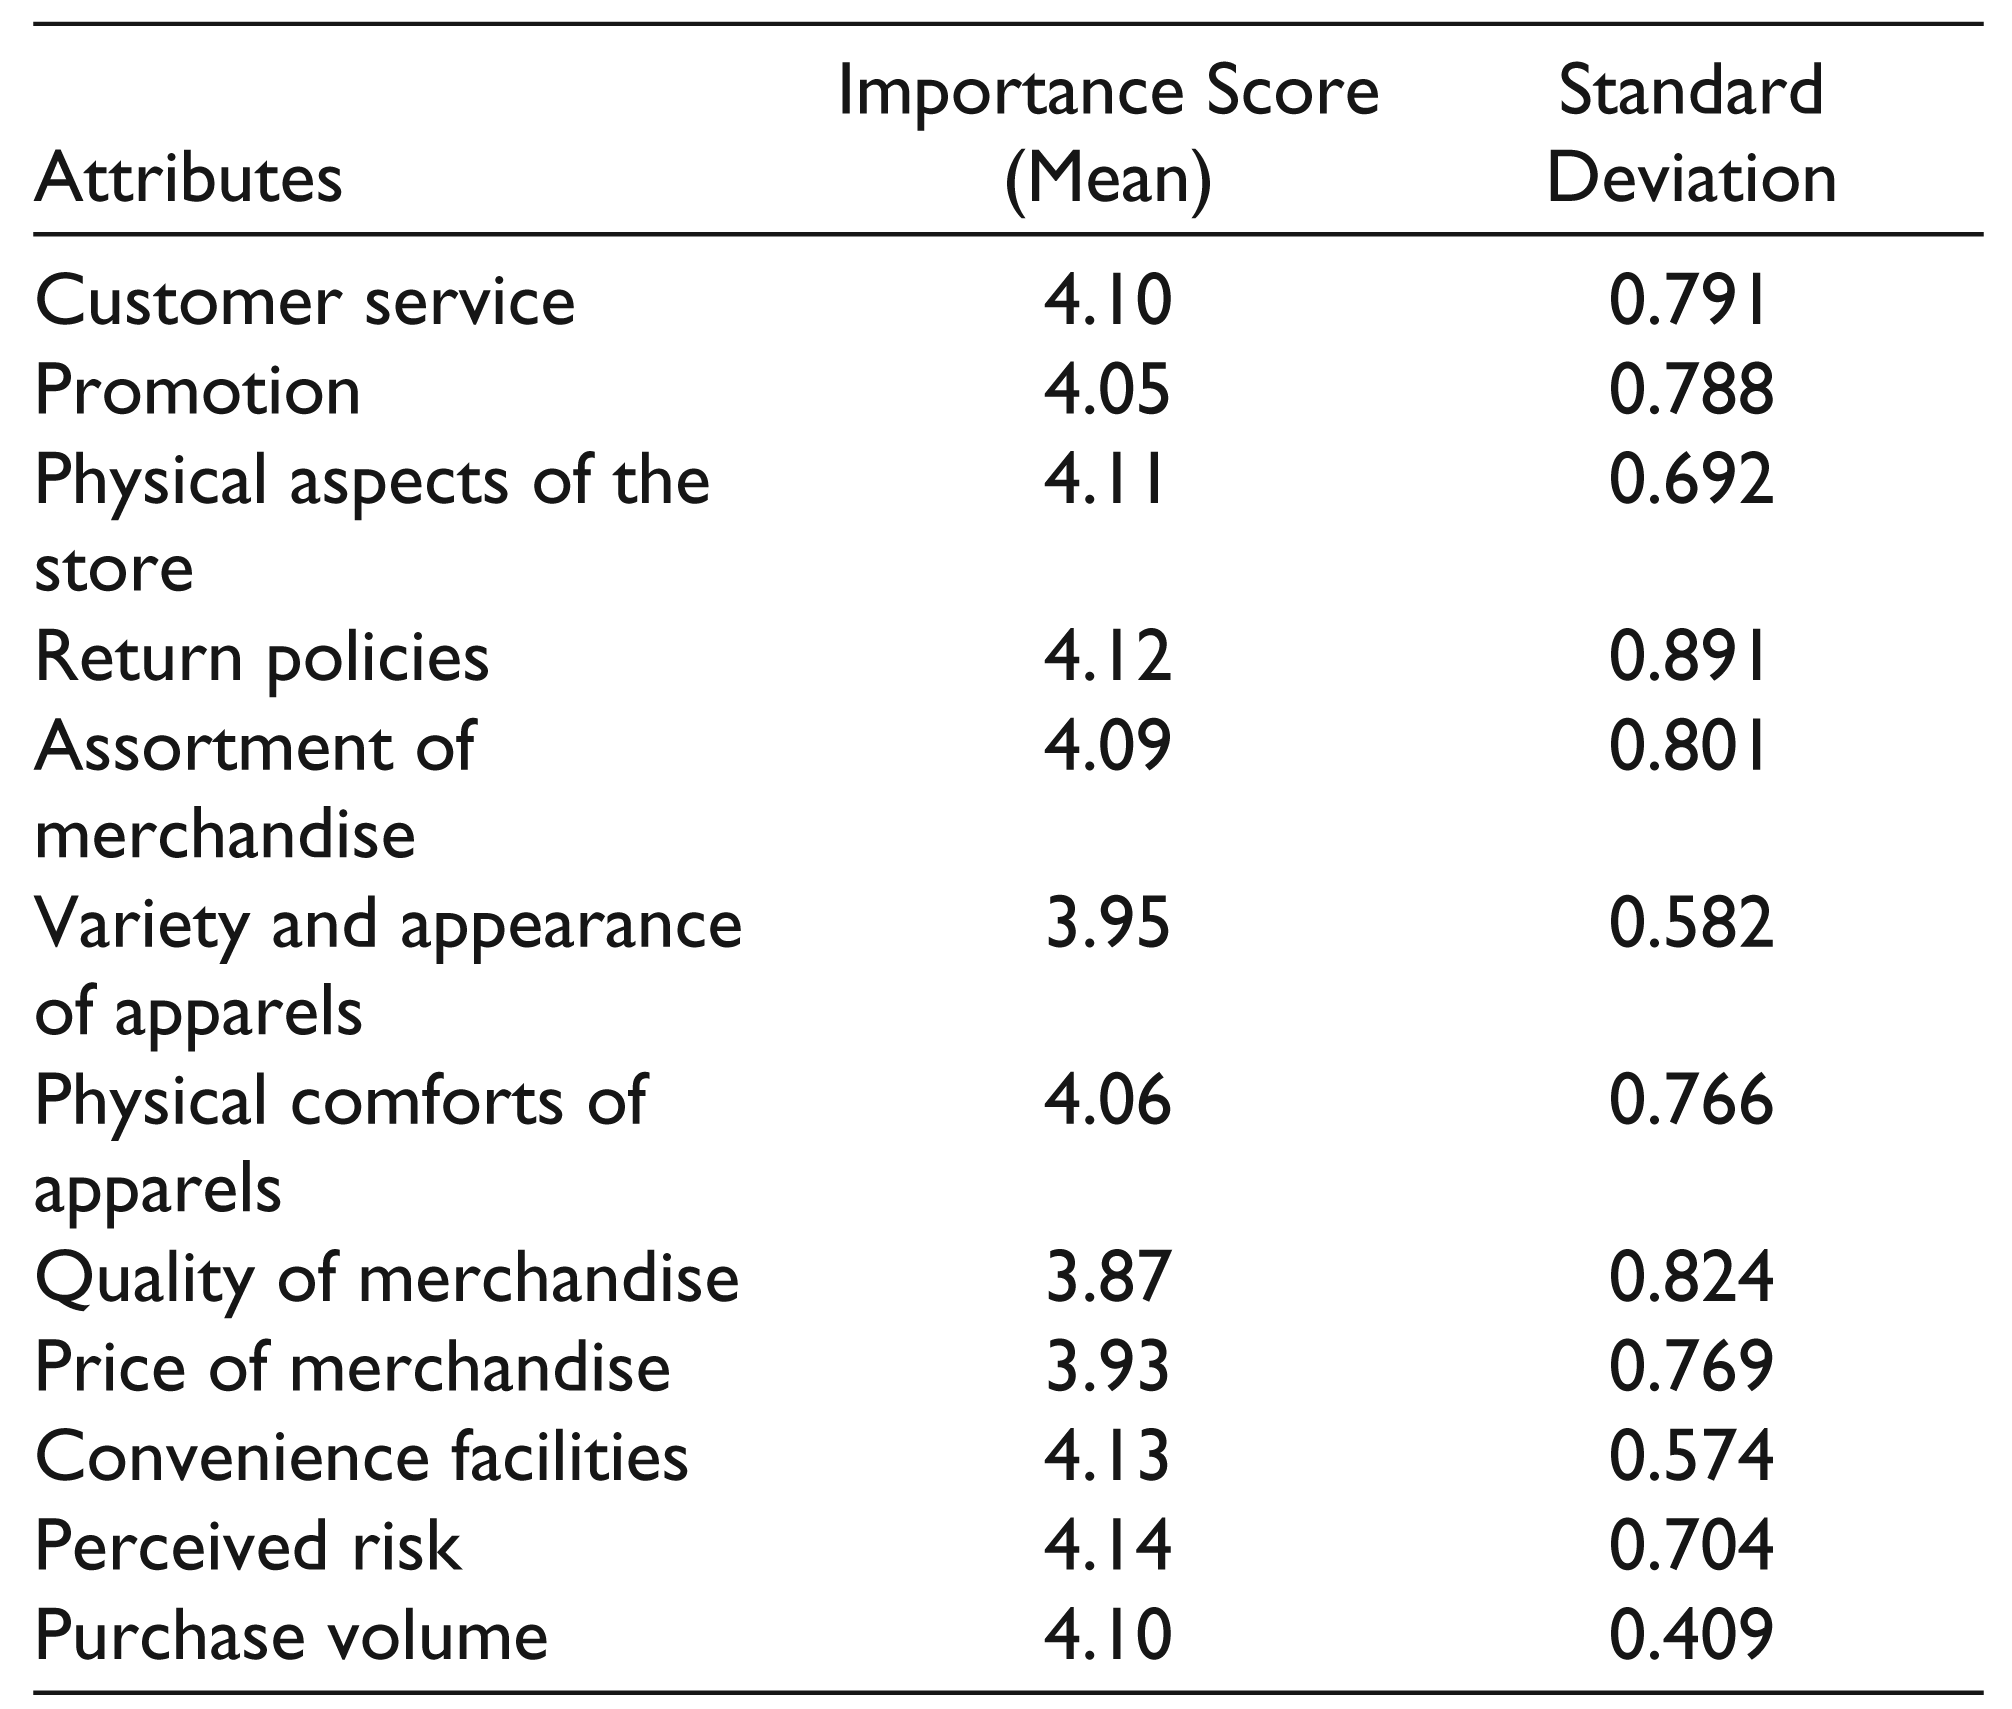
Determining significant attributes is important to the customer as well as retailers. Table 5 shows the importance of select 12 attributes.
Factors were identified while choosing ready-to-wear EBOs within the Indian domestic organized apparel industry. Means and standard deviation scores were calculated. Customer service, promotion, physical aspects, return policies, assortment of merchandise, physical comforts, convenience facilities, perceived risk and purchase volume, all with scores above 4.0 (refer to Table 5) indicate that these are important factors in store choice. The high mean score of all attributes indicate that there is no major differences among these attributes.
Importance of Choice Attributes for Exclusive Brand Outlets
Results
Identified Key Attributes of Store Choice
In order to attract and retain the customers, organized retail stores are supposed to provide momentous attributes: (a) providing store service quality mix is a non-price tool for setting it apart from other retailers to create competitive advantage and to enhance the shopping experience of shoppers. Customer service, promotion, physical aspects of the store, return policies and assortment of merchandise are major store attributes. Stores can be distinguished from competitors, if they have a unique layout, appropriate return policies and a wide promotional scheme. All retailers must choose the right message for the right group of shoppers and that should match the image of the store. Usually customers appreciate those outlets which easily handle the exchanges and returns of apparels. If employees of apparel stores do not respond quickly or are unwilling to respond to the customer queries, it leads to the alienation of shoppers; (b) shoppers expect that the desired merchandise (ready-made garment or running fabric) should be in stock. Merchandise availabilities are essentially needed by the end user in case of stock-outs; this may lead shoppers switch to other brands or stores. Design, symbol and trendiness are important attributes to apparel shoppers. The apparel trend changes rapidly, and marketers are not always certain about the market. A new trend can sometimes turn out to be no more than a fad (a very short-lived trend), and in that case retailers lose their money. It has been, however, found that variety of design is also an important attribute in ready-made apparels; (c) shoppers’ perception varies directly with their level of purchase volume. Moreover, shoppers feel more excited and satisfied during their shopping when the stores have low perceived risk. Convenience facilities are identified as one of the major underlying factors affecting shoppers in the purchase of apparels. An understanding of buying behaviour, and specifically of what shoppers’ value when their apparel purchase decisions are made, can be of great value to marketers.
Perceptual Map Evaluation of Selected Stores
The presence of a number of organized apparel retail stores in the industry leads to the identification of their present positions, and stores showed their performance based on perceptual maps. Beginning with Provogue, this store is perceived as the best organized apparel store in terms of providing variety and appearance of apparels and perceived risk, the best (tied with Levi’s) in terms of having variety and appearance of apparels and low perceived risk. Levi’s was perceived the best ready-to-wear store in terms of customer services but was perceived to be low in terms of convenience facilities. Westside was perceived awesome in terms of customer service, assortment of merchandise and quality of merchandise, and the best (tied with Spykar) in terms of quality of merchandise. Wills Lifestyle was also perceived the best in merchandise quality and customer service among other attributes listed by respondents. John Players was considered moderate among most of the select attributes of stores. Moreover, Spykar was indicated nastiest on 4 attributes out of the 12. Physical aspects of store showed the highest position among ready-to-wear apparel stores. UCB was perceived as the best in physical comforts and purchase volume. Duke was perceived the best in terms of quality of merchandise by shoppers.
Key Attributes among Shoppers for Store Choice
In order to investigate the domestic retail industry, shoppers of MP found that the ‘perceived risk’ mean score was 4.14 (Table 5), which shows the highest importance of this attribute. ‘Convenience facilities’ were considered second among the select attributes of store. Customer service, promotion, physical aspects, return policies and purchase volume were also perceived among the best of the organized stores in terms of select attributes for the study. Variety, quality, price and assortment of merchandise were considered moderate among the select attributes of store choice.
Conclusions and Implications
A pictorial view of eight stores in relation to other stores leads store managers to evaluate stores’ relative positions among each other. The map is useful for both new and already existing market players to identify new markets and expand the market share. This will lead to improving the lacking features and expanding market shares. This could happen with the improvement of product and service features such as price of the product, shopping environment and so on. The result also reveals that perceived risk followed by convenience facilities, return policies and physical aspects of the store are the primary factors for shoppers with regard to preference of organized EBOs. It also identified that apparels are more product driven, and less brand driven, and hence there is a need to have more varieties of apparels. EBOs need to have more efficient and skill-trained staff, as they are the face of the brand.
By developing perceptual maps, marketers can identify which stores are doing well and in what attributes. Since these stores are perceived quite similar in select dimensions of store choice, store managers should make an effort to maintain a distinguished place in the market. It may lead to stores tapping new opportunities in order to keep abreast with the ever-changing shoppers’ expectations in the constantly changing retail scenario.
Limitations and Future Research
Due to the use of specific category that is selecting the ready-to-wear apparels and a specific retail format (EBOs), the generalization of the result is not achievable to other categories. In future, researchers can conduct studies on all category shoppers for their in-depth study. Besides this, only three factors were studied which are responsible for store choice, while other factors also influence store choice decisions of shoppers. Cross-sectional nature and being conducted in only one state of India also made the study limited; a longitudinal study may be conducted in future.
Declaration of Conflicting Interests
The author declared no potential conflicts of interest with respect to the research, authorship and/or publication of this article.
Funding
The author received no financial support for the research, authorship and/or publication of this article.