



Abstract
Information technology (IT) industry in India has been facing a systemic issue of high attrition in the past few years, resulting in monetary and knowledge-based loses to the companies. The aim of this research is to develop a model to predict employee attrition and provide the organizations opportunities to address any issue and improve retention. Predictive model was developed based on supervised machine learning algorithm, support vector machine (SVM). Archival employee data (consisting of 22 input features) were collected from Human Resource databases of three IT companies in India, including their employment status (response variable) at the time of collection. Accuracy results from the confusion matrix for the SVM model showed that the model has an accuracy of 85 per cent. Also, results show that the model performs better in predicting who will leave the firm as compared to predicting who will not leave the company.
Introduction
Attrition Problem in Indian IT Industry
The information technology (IT) sector in India has grown to a great extent to cover several aspects of technology and computing. The revenue of this industry was estimated at approximately US$130 billion in 2015–2016 and contributes to 7.7 per cent of the country’s GDP. The Indian IT/ITeS industry also contributes towards the economic growth of the nation by employing about 10 million people. According to Mohapatra (2015), the sector is expected to rise at the rate of 12 per cent–14 per cent in 2016–2017 with the expectations of witnessing annual revenues triple times by the year 2025. The most successful companies operating in the Indian IT sector are International Business Machines (IBM) Corporation, Dell, Microsoft and Hewlett-Packard (HP; Mohapatra, 2015). Moreover, the IT industry has also played a leading role in the Indian economy by promoting exports, improving standards of living and generating revenues (Jain & Tandon, 2014).
In spite of the industry’s good performance, it faces a systemic issue of high employee turnover, which in turn affects the industry’s performance. Most of the employees leave their current organizations for learning new skills and increasing their competencies. In view of this trend, companies announced several training and development programmes with an aim of encouraging and hence retain them. Therefore, companies are focusing on career planning and development of the employees in order to retain them, which have become a critical success strategy for the Indian IT industry.
Impact of Employee Turnover on Performance of IT Industry
The employee turnover is the greatest loss for the business as the company has to suffer from high indirect cost. These costs include recruitment cost for finding replacements, expenses related to training and development of new employees, productivity loss on account of experienced employees leaving and morale loss to the organization (Cascio & Boudreau, 2010; Matthew & Kung, 2007). Also, new employees are hired who undergo training for a significant time period that takes up extensive time and resources of the organization. Meanwhile, businesses suffer from low productivity as employees will not be able to meet the expectations of the customers until they learn the overall procedure of the firm in the right manner (Bapna, Langer, Mehra, Gopal, & Gupta, 2013). However, when poorly skilled employees leave the company, the overall company productivity increases, although drastic increase in attrition rate can clearly indicate a poor IT sector performance (Purohit, 2016; Shanmugam & Giri Babu, 2016). Furthermore, client satisfaction is also affected by employees, where trained and skilled employees can positively lead to satisfaction, but newly joined employees may not be able to (Kamalanabhan, Sai, & Mayuri, 2009). This shows that high employee turnover will directly affect the productivity of the business as client requirement might not be met in the right manner.
Need for Prediction of Attrition Rate to Improve Performance
Long-term success and health of the company are based on the retention of skilled employees that helps in meeting the expectations of client and increasing the productivity of the business (Vasantham & Swarnalatha, 2013). With evidence of issues in the IT sector, it is important for the management to take corrective actions for reducing the employee turnover. For this purpose, research can be conducted to assess the satisfaction level of employees and potential reasons behind the high attrition rate. It facilitates to understand whether employees are satisfied or not so as to provide the quick solution of the issues which are being faced by the business (Jha, 2011). This in turn becomes easy to reduce the rate of attrition and accordingly increase overall productivity and profitability of the business. Furthermore, the prediction of employee turnover will help company in finding the suitable personnel for future vacancy. At the same time, it assists management in offering right motivation to personnel as per their level of satisfaction or intention to leave the company. Moreover, company will be able to amend its plan or targets related to expansion or productivity (Perryer, Travaglione, & Leighton, 2010). Therefore, prediction of the attrition rate is important to ensure continuous growth and development of the business. This will also be helpful in maintaining the higher rate of return of the business.
Aim of the Study
The aim of this article is to develop a prediction model based on the employee data in order to tackle the problem of employee turnover of the Indian IT sector.
Literature Review
Introduction to Attrition
Employee turnover refers to the number of employees who are leaving the organization over a particular time span which is generally expressed in the percentage of the total number of employees in an organization (Purohit, 2016). Staff turnover refers to a rate at which employees leave and replaced by others in an organization. The aspect of employee turnover can be either voluntary or non- voluntary (Shaw et al., 1998). The voluntary turnover takes place when employees willingly leave workplace at the expiry of an employment contract or natural reasons. On the other hand, involuntary employment takes place at the end of HRM department with the specific reasons such as promotion, transfer and lay-off. Furthermore, there are different types of employee turnover such as internal vs. external and skilled vs. unskilled (refer to Table 1).
Storey (2016) argues that success of a business is based on the retention of employee and job satisfaction. These two factors are interlinked as job satisfaction is the input of their retention. However, attrition takes place because of several reasons such as ineffective working practices, poor support of management and poor compensation as well as work–life balance. These factors influence an employee to leave the current workplace with the aim to search for better opportunities. In case the current workplace is interesting and meeting the requirement of employees, then they extend their service period. Owing to this, management is tasked with creating a comfortable work environment and appropriate pay scale in the line of the ability of hired employees (Perryer et al., 2010).
Types of Employee Turnover

High attrition rate in the Indian ITeS call centres is affected by issues such as appraisal system, career planning and salary as well as timing. This indicates that employees get dissatisfaction with their pay and they do not seek their career growth being at call centres (Pandey & Kaur, 2011). Owing to this, they shift their focus to other centres which can provide them growth opportunities along with appropriate payment. Similarly, IT industry of India is facing local and technological issues in retaining employees. However, companies are adopting the attrition control measures in order to get the long-term benefits (Bairi, Murali Manohar, & Kundu, 2011). Therefore, employees are seeking for their development and growth opportunities; owing to this, they move to latest technology-enabled organizations.
Impact of Attrition on Company Performance, Productivity and Profitability
The attrition rate or employee turnover in the IT sector is the never-ending issue because of low compensation and low career growth along with several critical factors. These factors include organizational commitment, employment branding, age and culture, career planning and alternative job (Kanwar, Singh, & Kodwani, 2012). However, IT professionals are in great demand in India due to rapid growth in technology, although fewer onsite opportunities influence employee to switch from one to another job. Armstrong (2016) explained that employee turnover affects the profit-ability of the business by increasing the indirect cost of the production. This is because IT sector provides several kinds of work-related training to employees but if they leave, then their rate of return is affected to a great extent as their resources go waste.
Dhillon (2016) stated that employee turnover affects the satisfaction of customers as the quality of services gets affected to a great extent. In addition to this, customer complaints increase if the attrition rate remains high and the subsequent effect can be seen on productivity and profitability of the company. Moreover, the organization will not be able to maintain its competitive edge in the marketplace. Therefore, employee retention is crucial to ensure the long-term growth and success of the entire IT sector of the India.
Prediction Models for Employee Attrition
Since employee attrition has been found to be influenced by several factors, such as, personal, job-related and organizational, these same factors can be used to predict their turnover in an organization. Job performance and level of satisfaction expressed by employees are also significant in influencing their attrition. Organizations typically conduct surveys to understand employee attitudes towards organization and their jobs, and subsequently predict employee turnover (Carraher, 2011; DeTienne, Agle, Phillips, & Ingerson, 2012; Medina, 2012). However, conducting surveys can be time- and resource-consuming, especially in big multinational organizations, and employees may not willingly share their opinions on leaving or dissatisfaction with the organization (Fan, Fan, Chan, & Chang, 2012). Alternatively, predictive models that use employee background data (from HR databases) can be faster and more accurate, since information of all employees can be analysed. History of employees and their performance within the organization can provide insights to managers and HR departments, on their intentions of leaving the organization. Therefore, prediction models can be developed that studies archival data of employees, their performance and extent of participation or behaviours within the organization. Typically, logistic regression, market basket data analysis or back-propagation networks have been adopted to predict turnover, but suffer from lack of validation of the model (Fan et al., 2012).
Alternatively, supervised machine learning classification models that train on existing employee data can be tested for their accuracy and hence validated. Validation of a trained predictive model is possible by testing it on either 20 per cent of the master dataset (not used during training) or using a separate dataset (Saradhi & Palshikar, 2011). Commonly used supervised classification models include naïve Bayes, support vector machine (SVM), decision trees, random forests and neural networks (Kisaoglu, 2014; Sikaroudi, Ghousi, & Sikaroudi, 2015). Supervised learning models are trained on a dataset that has been classified (in one of k classes), such that the model discovers or learns a new function, f, that allows it to classify new data/objects into one of the k classes. While the classified dataset is called trained data, the new data (not classified) are called testing data (Saradhi & Palshikar, 2011).
Organizations currently are attempting to collect and utilize information in the form of big data to extract relevant and important knowledge. This knowledge is used to take important business decisions and further improve the organizations competitive advantage. Machine learning classification tools are advantageous data mining techniques to predict future employee behaviours (performance and attrition probabilities) based on past data trends. Based on the Human Resources past employee data mining and analysis, it is possible to predict future behaviours in the organization.
Empirical Review
Several predictive models have been developed that can assist Human Resources departments in organizations, based on supervised machine learning methods. These models are trained based on the existing employee data and can help predict if an employee will leave the organization in future, based on the interaction with several variables.
Addressing the issue of losing competitive advantages in organizations as a result of high employee turnover, Sexton, McMurtrey, Michalopoulos, and Smith (2005) developed a neural network-based predictive model, neural network simultaneous optimization algorithm (NNSOA). This model adopted a modified genetic algorithm as a search technique, in order to successfully train the model. Comparing it with four commercially available software, it was found that the newly developed NN model gave an overall classification error percentage of 0 almost 75 per cent of the times it was run. Moreover, the model correctly predicted if an employee will leave, 94 per cent of the time, and was also easier to use than existing commercial software.
Since not many employee turnover prediction models exist, and since employee churn is similar to customer churn, a study by Saradhi and Palshikar (2011) developed and compared kernel-based methods, SVM, naïve Bayes and random forest models. The authors chose these models since kernel-based models had not been explored sufficiently. In order to improve the true positive rates of the model, derived attributes (summaries of last 2 years of work history of employees) were introduced. Results showed that although SVM had the highest true positive rates, naïve Bayes and random forest methods had higher total accuracy rates.
A case study by Sikaroudi et al. (2015) attempted to mitigate the problem of monetary and time-related loss of the organization as a result of employee turnover, by developing a predictive model. Prediction of employee turnover is possible by analysing patterns in their organizational and personal data. Based on the data from an automotive parts manufacturing company, predictive models based on 10 supervised machine learning methods, multilayer perceptron, probabilistic neural network, SVM, classification and regression tree, K-nearest neighbour, naïve Bayes, random forest, Apriori and CN2 algorithm, were tested for their accuracy, time for calculation and user-friendly methods. Results showed that naïve Bayes and random forest had the highest accuracy, while naïve Bayes was the most user-friendly model. However, decision trees were the best models, considering the time, accuracy as well as friendliness factors.
In order to determine the significance of employee characteristics and organizational variables, Heiat (2016) tested two supervised machine learning-based methods to predict employee turnover. Both artificial neural network and decision trees (C&R tree) were trained on IBM Watson Analytics Community attrition data, where feature extraction revealed importance of employee years in company, and employees working overtime, for both the models. While ANN-based model showed an accuracy of 85.33 per cent, the decision tree-based model was accurate only 80.89 per cent times. However, the study suffered from inability to address the problem of background noise found usually in Human Resources data of any organization.
In this study, SVMs have been used to help classify and predict employee attrition, which is easier to adopt in organizations, as opposed to previously reviewed models.
Comparison of SVM with Other Supervised Algorithms
The SVM is one of the most popular regression models within the ambit of supervised learning algorithms. In this study, the researcher has applied the SVM model as against numerous others such as linear/logistic regression, KNN, GLM, random forests, decision trees due to a number of reasons.
First, when compared with logistic regression, SVM holds a superior position since it can be used on data that is not linearly separable while logistic regression cannot be used on such data. Being distinct from logistic regression, SVMs have ways to check the model from being sensitive to outliers in the data. As voiced by Pochet and Suykens (2006), this characteristic makes the model capable of making good predictions for prospective analyses. After initial inspection of the dataset, the researcher assessed the presence of outliers to a moderate extent and wanted to treat it using a more inclusive approach. This is the biggest defining characteristic for encouraging the researcher to prefer SVM.
Second, the size of the data was another parameter of the selection criteria. When compared with KNN, when the number of training cycles is more and the size of data is large (especially for textual dataset), SVM performs better than KNN. Further, KNN is best fit for small datasets while SVM works fine with large datasets as well (Raikwal & Saxena, 2012). Even though the eventual dataset consisted of 1,650 employees, initially the researcher foresaw the presence of a much larger number of observations, thus making SVM a better fit.
Limitations of Predictive Algorithms
Predictive algorithms, like most others, are subject to some limitations, particularly with respect to overfitting and underfitting. Overfitting takes place when a model acquires the feature and noise in the training data to the extent that it negatively impacts the performance of the model on new data. In other words, the noise or random fluctuations in the training data are chosen up and learned as concepts by the model. This negatively impacts the models’ ability to generalize (Ghasemian, Hosseinmardi, & Clauset, 2018). On the other hand, underfitting of a model means that can neither model the training data nor generalize to new data. This leads to poor performance on the training data (Uddin, Lee, Rizvi, & Hamada, 2018).
Apart from the aforementioned, certain algorithms such as naïve Bayes have restricted applicability due to the assumption that variables are independent (Dua & U, 2016; Winters, 2017). Others such as K-means clustering and MLS are unsuitable for datasets that do not contain Gaussian distributions. These limitations of the algorithms were kept in mind while selecting the appropriate algorithm for this study.
Methodology
Support Vector Machines
The SVMs are a type of generalized linear models used in pattern classification and function approximation problems. These models are trained on a dataset, where no prior knowledge about the data distribution is assumed, a non-parametric approach (Abe, 2010a). The SVM models, based on training, will attempt to generalize about the input data, based on their features and, subsequently, predict correctly on novel data. They can act as a classifier (categorizing data into different ‘classes’) or regression function (estimating numerical value of a desired output) based on a linear combination of features. Figure 1 shows how SVMs function during classification. Here, X1 and X2 represent the planes in which the data points are distributed, whereas the maximum margin hyperplane shown optimally classifies the data points into two different classes.

In the present study, SVM is used to classify employee using specific features, into ‘active’ and ‘inactive’ groups, signifying their current status in the organization. Based on such a learned classifier model, predictions can be made on novel data of employee features, if the employee may continue to work or leave the organization (refer to Figure 1).
The objective of SVM technique is to produce a model which predicts the target values of the test data given only the test data attributes (Hsu, Chang, & Lin 2003). They formulate that provided a training set of instance-label pairs g (xi, yi), I = 1, …, l where xk _i!R^n and y!{1,−1}^l is given, the SVM solves the following optimization problem:
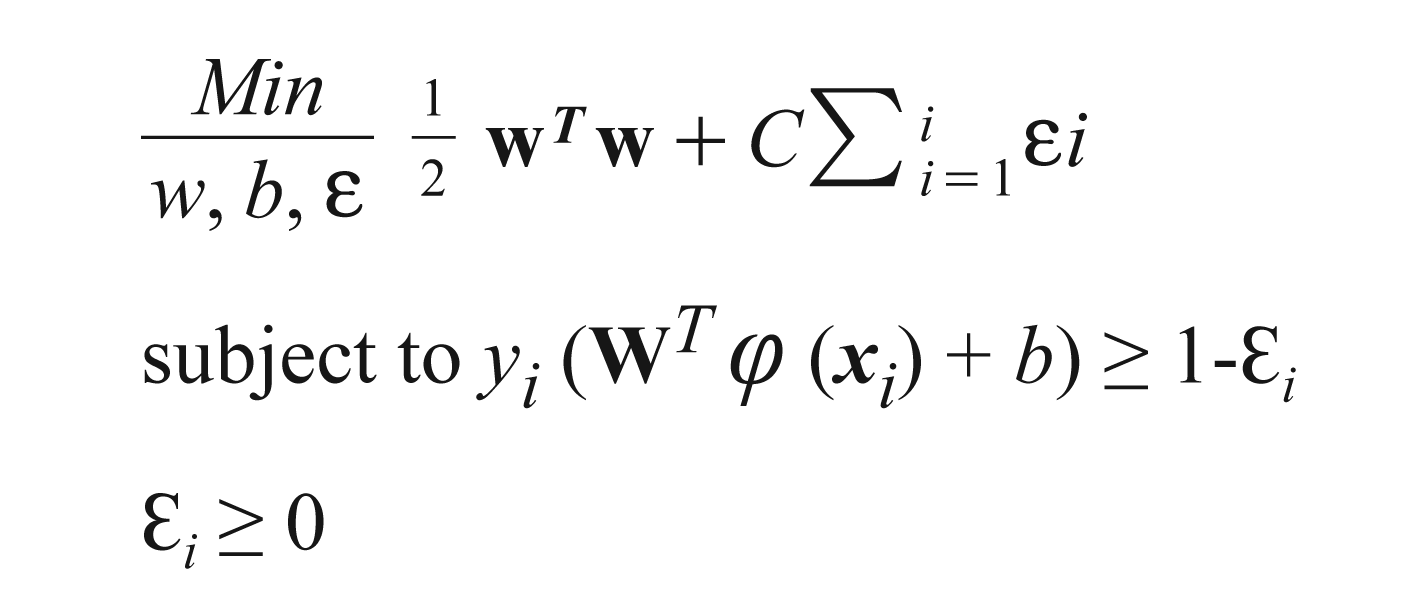
where training vectors x_i are mapped into a higher dimensional space by the function φ and SVM finds a liner separating hyperplane with the maximal margin in this higher dimensional space. C > 0 denotes the penalty parameter of the error term
Input Dataset
In order to train the SVM-based model for predicting employee attrition in IT industry, HR data were collected from three IT institutes in India, of employees that have worked in the past 3 years. These data include those who left the organization within the same time period. Data of total 1,650 employees were collected, and for each employee, their demographics (age, gender, marital status and so on) and job-related (profile, performance rating, income and so on) information was extracted from the HR databases. There are two class labels for attrition, active (1) and inactive (0), for the current status of the employees.
Consequently, a total of 22 features were considered initially for training the model, of which 14 were numeric in nature, while the other 8 were categorical variables. Table 2 lists these variables. While variables such as age and number of years spent in current role/company were defined by numerical values, ‘attrition’ referred to the current status of the employee, ‘active’ in case the employee was still working at the time of data collection, or ‘inactive’ if the employee had left the organization.
Variables Included for the Analysis

For classifying and predicting attrition, SVM was selected by the researchers since it was optimum due to its capability of classifying numerical and object values more accurately, as compared to other classifiers (Huang, Lu, & Ling, 2003). In a supervised machine learning classifier, SVM, each data point is plotted in n-dimensional space, where n denotes features, and the value of each feature is its plotted coordinate.
Tools and Platform
The SVM classifier model was built, trained and executed using Python, within the Jupyter Notebook environment. For processing the data and conducting feature selection, Pandas were imported from scikit-learn library. The SVM algorithm was also imported from scikit-learn library (Pedregosa et al., 2011). All numerical computations on the data, especially descriptive statistics, were conducted using the NumPy package (van der Walt, Colbert, & Varoquaux, 2011).

Data Preprocessing
Preprocessing of the data is one of the important parts of data mining process. The results from the data mining or any other techniques produce significant and meaningful results only if the quality of dataset is maintained (Chamatkar, 2014). Data collected from HR databases were preprocessed by structuring and formatting it. Subsequently, missing values and outliers were checked, since they can lead to biasness during model training (Cousineau & Chartier, 2010). Those observations which had missing values were excluded from the study, so that the final dataset had a total of 1,470 data points. With respect to outliers, standard deviation analysis showed no significant skewness in data, and hence the data were considered fit for further model development. Lastly, the data were reduced, where the transformed data were merged into a data frame to start of the feature selection and engineering process followed by the stages of model building and evaluation.

Confusion Matrix for Measuring Accuracy of Classifiers

Characteristics of Features
The features selected for training were analysed for trends and variability, using two Python packages, NumPy and Matplotlib. The 7 most important features have been defined in this section, even though all 22 features were included in the study.
Feature Selection
Feature selection is the process of selecting the subset of variables which will be further used to construct and train the model. It is the most critical process in machine learning, as it will influence the overall accuracy of the model. In this process, only those variables were selected which are most appropriate to describe the response variable, while other variables are dropped. Before assessing the features, the characteristics of data were evaluated, and any non-numeric (object) variables were converted to numeric format. The class, ‘LabelEncoder’ was used (imported from ‘sklearn.preprocessing’ package), turning non-numeric data to numeric and assigning them weights for model building. Following this, ‘oneHotencoder’ module was used to convert the numerical labels of categorical features into array format, so that they can be used with continuous variable features.
Confusion Matrix

Results from the Confusion Matrix

As discussed in the previous section, 22 features were identified on the basis of the literature reviews and logical reasoning. A major characteristic of classifier models like SVM is that its accuracy depends on the predictors or features selected, known as ‘Feature Selection’. During this step, the model assesses the importance of each feature using filtering metrics. For the current model, the ‘ExtraTreesClassifier’ module in Python was used. The features, ‘Business travel’, ‘Gender’ and ‘Number of companies worked before’ (Figure 1), were found to be irrelevant for training the model during feature selection. This is because they do not show important contribution in predicting the response variable. These variables were subsequently dropped during algorithm training and testing stages.
Evaluation Criteria for Models
Performance of trained classifiers is evaluated on the basis of their accuracy, as calculated in a confusion matrix. A confusion matrix is a table used to describe the performance of a classification model on a set of test data whose true values are known beforehand (Abe, 2010b). Accuracy of a trained machine learning model is calculated using the following formula:
Accuracy =
*TN = true negatives; FP = false positive; FN = false negative and TP = true positive
For evaluating the accuracy of the present trained model, ‘metrics’ module from ‘sklearn’ was imported (refer to Table 3).
Model Building
For building and training the SVM classifier model to predict employee attrition, the dataset was divided into training data (80%) and testing data (20%). The ‘train_test_split’ module from ‘sklearn.cross_validation’ package was imported for this, giving a value of 0.2 for the test_ size parameter. Training data consist of the feature values on which the model of SVM is trained. This is followed by trained model being tested on the unseen test dataset to match up the predictions and accuracy. The data were imported and instantiated into the classifier. This was followed by fitting of the training data with its hyper-parameters. After fitting, the class predictions were performed on the test dataset, followed by calculating real predicted values using accuracy function present in the ‘metrics’ module.
For SVM model, the ‘Svc_linear’ Python module was used and its parameter kernel which is presently ‘linear’ is used for linear hyperplane, since the main purpose is to classify whether the employee would leave the organization or not. Other than ‘linear’, other values which could be used are ‘rbf’ and ‘poly’, which is generally used for non-linear classification problems and hence not applicable in this model.
Findings
Model Accuracy
The accuracy of the model was found to be 0.85 (or 85%), which is a significantly accuracy level. This indicates that the trained SVM model classifies and hence predicts an employee’s attrition possibility in the future accurately by 85 per cent. This classification is based on the 19 features selected, for each of the employee, including their demography and job-related characteristics.
Confusion Matrix of Trained Model
The confusion matrix for the present SVM attrition classifier is given in Table 2 (also see Figure 3). It shows a high true negatives (the model predicted correctly ‘No’ for an employee who did not leave the company), but also a significant number of false negatives (refer to Table 4).
On the basis of the confusion matrix, the model was further evaluated by calculating several other metrics, as shown in Table 5.
The misclassification rate at 14 per cent of this model suggests that the model has a small error rate, which could be due to the similarity of features of some employees belonging to active and inactive classes. Further, the specificity of the classifier or the classifying power of the model to predict who will not leave the company is 97 per cent. However, the precision of the model which correctly predicts that an employee would leave the firm at 65 per cent is low, which could be attributed to the disproportion of active and inactive employee data in the training dataset. Here, precision of this classifier is different from accuracy, in that accuracy represents the total sample that is been correctly identified, while precision represents only those samples that have been positively identified and are actually positive.
Conclusion
Employee attrition is a major problem that the Indian IT industry has been experiencing in the last decade. This research was aimed to develop a prediction model using machine learning, to tackle the problem of employee turnover in the Indian information technology industry. Although classification tools have been used to predict employee churn in the past, more focus has been given to neural networks as an effective machine learning tool and comparing the accuracies of different classification tools. In this study, an attempt has been made to test the accuracy of a simple classification tool, SVM, to predict employee attrition in IT industry, with an aim of encouraging organizations in the country to adopt it. Using current status of employee as a response variable, a SVM model was trained and its performance evaluated. Results from the feature selection showed that gender, business travel and the number of companies worked are not relevant to predict the attrition in the current study. Gender bias and glass ceiling have been known to plague the IT industry, especially in developing countries like India (Bhattacharya & Ghosh, 2012). The present model by identifying gender as an unimportant feature that can contribute to an employee leaving an IT organization in India could suggest that the situation has improved recently. Attrition was also not seen to be influenced by the number of companies that the employees have worked in before, which signify the extent of their experience.
Results from the confusion matrix show that the accuracy of the model is 85 per cent with a small misclassification error of 14 per cent. This model can correctly predict if employees in an IT organization may leave or continue to work, in the near future, based on their job characteristics and performance. Previous machine learning models developed to predict employee attrition had an average accuracy range of 52 per cent–97 per cent, suggesting our model has significantly high accuracy to be adopted by organizations in India.
This study is the first of its kind to directly apply a machine learning classification tool to address the attrition problem of a particular industry, the Indian IT industry. Moreover, this study has significantly large dataset in order to train and test the model and hence provide a more significantly accurate model for employee prediction. Managers and IT organizations in India can adopt this model to analyse and predict their employee attrition behaviour and accordingly adopt strategies to improve job satisfaction among them. Moreover, managers can also isolate important factors that lead to attrition behaviours within their organization, to provide optimal solutions for eliminating them. In future, the feature set needs to be changed, to develop a more accurate model and also reduce the misclassification rates.
Declaration of Conflicting Interests
The authors declared no potential conflicts of interest with respect to the research, authorship and/or publication of this article.
Funding
The authors received no financial support for the research, authorship and/or publication of this article.