
Abstract
Intellectual capital (IC) has gained recognition in enhancing the firms’ value and gain competitive advantage in the developed world. Thus, it is imperative for all stakeholders to have an understanding of its impact on firms’ profitability. The present study aims to analyse the impact of intellectual capital on firms’ profitability of Indian pharmaceutical companies listed in National Stock Exchange (NSE-500) for the time period of 10 years (i.e. 2009–2018). The paper has used modified version of Pulic’s Value Added Intellectual Coefficient, i.e., M-VAIC as a proxy to measure intellectual capital and firms’ profitability as represented by ROA, ROE and EBITDA. In line to analyse the effectiveness, a balanced panel data regression technique has been used. The results of the paper indicate a significant relationship between intellectual capital and firms’ profitability. Also, it is found that human capital, relational capital and physical capital have a significant role in increasing the profitability of the firm. The analysis would help the administration and management of pharmaceutical companies in the composition and organization of intellectual capital, stakeholders in the decisions related to investment and financial specialist for enhancing intellectual capital efficiency and value creation for the firm. Human capital is found to be having a positively significant impact on firms’ profitability; their inclusion and management are suggested for the companies.
Executive Summary
Intellectual capital (IC) which is generally known as intangible assets covers the substantial components such as information, knowledge, copyrights and patents, research and development, human capital and innovation. Forbes, 2014, stated that more than 80 per cent of business value is generated from innovations and intangibles. In the initial era of business, tangible assets were the driving source of company value, whereas intangible assets contributed a small part in it and were largely speculated for estimating the value of brands. However, the present scenario has changed where intangible assets have developed from disclosing 20 per cent to 80 per cent of corporate value, due to growing and rising significance. The present paper offers insights on impact of IC on firms’ performance of Indian pharmaceutical companies.
The paper has used Value Added Intellectual Coefficient (VAIC
With the intent to examine IC, the study has taken Indian pharmaceutical firms listed under NSE-500. From 34 firms, the firms with a negative book value of tangible assets and negative M-VAIC were deleted. The data used for the analysis of the study has been collected from published annual reports and S&P Capital IQ database. The period considered for the study is from 2009 to 2018. Owing to missing data of few firms, the final sample size used for the analysis is 26 firms for 10 years. In order to find out the impact of IC on firms’ profitability panel data regression analysis has been conducted.
The findings infer that human capital efficiency should be considered as the most important component of IC and advocate that firms do gain from investing in the enhancement of knowledge and skills of the employees. Additionally, companies benefit from the relationships they maintain with the shareholders and customers. The results support that physical capital continues to play a significant role in boosting and increasing the profitability of the firm. Further, the process capital and innovation capital still need to be recognized. Moreover, the overall intellectual capital can be used in order to create value, reduce sole dependence on the tangible assets and thus, gain an edge in the competitive world.
This study gains interest and has practical implication for various stakeholders such as shareholders, policymakers, investors, regulators and management. For managers, it helps by indicating the requirement of regulating and improving IC of organization and magnifying investment in intangible resources so as to gain a competitive advantage over rival companies. The results are valuable for investors and shareholders, as they can make decisions regarding their investment in companies and evaluate the firms’ IC in order to obtain better financial returns. For policymakers and regulators, to assess the IC efficiency of the firms and comparing different industries to make proper standards of reporting of intellectual capital, the study provides fruitful insights.
Introduction
The global economy has developed from a factory-made one to a knowledge-based economy, and firms, to boost cut-throat competition and generate value, have concentrated on building their intangible assets as vital to succeed over time. Intellectual capital (IC), which is generally known as intangible assets, covers substantial components such as information, knowledge, copyrights and patents, research and development, human capital, and innovation. Traditional financial reporting of the companies lays emphasis mostly on the disclosure of tangible assets and, thereby ignores the intangible assets that also serve as a major proportion of a company’s total value (Guthrie, Petty, & Ricceri, 2006). With an increase in the knowledge concentrated economy, the accounting and disclosure of IC have gained immense importance. In this era, tangible and intangible assets are treated as probable sources of competitive advantage (Ruta, 2009).
The term IC isn’t new; its presence has been seen from the point when there existed a valuable relationship between the merchants and consumers. IC incorporates ‘hidden capabilities’ of companies (Edvinsson, 1997) or knowledge-based sources that help to develop a competitive edge in today’s economy (Ordoñez de Pablos, 2005). Forbes, 2014, stated that more than 80 per cent of business value is generated from innovations and intangibles. In the initial era of business, tangible assets were the driving source of company value, whereas intangible assets contributed a small part in it and were largely speculated for estimating the value of brands. However, the present scenario has changed. Now intangible assets have developed from disclosing 20 per cent to 80 per cent of corporate value, due to its growing significance.
The knowledge economy as explained by Organization for Economic Co-operation and Development (OECD, 1996) is the economy where primary drivers of development and growth are generation, production and usage of knowledge and thus, the term ‘knowledge economy’ emerged. Companies recognized the significance of knowledge and the need to oversee it effectively, thus, contributed to evolving the knowledge economy. The significance of IC has been developed due to the expansion of the knowledge economy (Cabrita & Vas, 2005). In an economy whose large part is determined by knowledge, IC can be utilized to create substance, increase the physical output and obtain a competitive edge for organizations (Bontis, 2001; Pulic, 1998; Seviby, 1997). Whether the organization belongs to the primary, secondary or tertiary sector, IC has become an essential component for their success. It’s just the level of contribution that varies; some companies are highly knowledge driven while others are less knowledge driven. Due to increased innovation and research in the organizations, IC has now turned into the most significant asset (Drucker, 1993; Stewart, 1997; Wang & Chang, 2005).
IC has been categorized into three major components: structural capital, relational (customer) capital and human capital (Bontis, 1996; Edvinsson & Malone, 1997). After two major studies (Pulic, 1998; Bontis, 1998), IC has gained importance for estimating its impact on firms’ performance. Bontis (1998), in his exploratory research using questionnaires, established this relationship and provided that IC contains relational capital, structural capital and human capital. Pulic (1998, 2000) proposed a model namely Value Added Intellectual Coefficient (VAIC
This model has been extensively adopted and accepted by various authors (Chen, Cheng, & Hwang, 2005; Chu et al., 2011; Joshi, Cahill, Sidhu, & Kansal 2013; Kamath, 2007; Mondal & Ghosh, 2012; Ting & Lean, 2009; Wang & Chang, 2005) for determining the link between IC and firms’ performance. The VAIC
The paper offers insights on IC performance of Indian pharmaceutical companies during the time span of 2009–2018 and the results would help the administration and management of pharmaceutical companies in the composition and organization of IC. The paper is taken forward as follows: the next section discusses the background and review of literature to support the previous studies on IC. Following this the third section defines the data, sample size, variables and models. The fourth section explains the findings and their interpretation. The fifth section deals with the conclusion and implication of the study. The last section discusses the limitations and future scope of the study.
Background and Review of Literature
Intellectual Capital – The Concept
IC as a concept was first described by Nassau William Senior in 1836. There is no commonly recognized definition of IC. However, a review of literature indicates that IC is basically identified as ‘knowledge that can be converted into value’ (Edvinsson & Sullivan, 1996). Stewart (1997) extends the concept of IC to ‘collection of knowledge, information, intellectual property rights, experience of each individual in a business entity’. It is difficult to quantify the market price and the expenses of generating IC (Zambon, 2004). The most significant challenge that arises for researchers is to show that IC generates value for the firm (Sánchez et al., 2001). Various empirical studies have laid down the gravity of knowledge, information and intangible assets for the enhancement of business. Currently, IC is associated with knowledge assets (Marr, Schiuma, & Neely, 2004). Furthermore, it serves basic information to strengthen the regular advancement of performance in the business. According to VAIC
Measuring Intellectual Capital – Value Added Intellectual Coefficient (VAIC
tm
)
Ante Pulic (1998, 2000) proposed a model to administer the efficiency of a company’s physical and intangible assets. This tool is suitable for estimating the firms’ intellectual capital. Because the data which is a prerequisite for the calculation of IC, as per this model, is conveniently available on different sources. It allows computing every resource used to increase the efficiency of companies, namely, physical capital, human capital and structural capital. The model studies the financial or physical and intellectual capital used by organizations to appreciate their value. The model has been employed in various studies for the examination of association that IC has with firms’ performance (Chen et al., 2005; Kamath, 2015; Vishnu & Gupta, 2014). The drivers and components of IC that create value are to be recognized and which component is the most profitable one depends on the internal and external factors that affect the organization.
To generate value within any organization, two key assets play a prominent role viz. capital employed and intellectual capital (Pulic, 1998). IC includes Human Capital (HC) and Structural Capital (SC).
1. Human Capital
Human capital is the people employed in the organization. This capital is not accounted for in the financial statements of the organization and is considered the ‘economic value’ of employee’s education and knowledge. Schiuma and Lerro (2008) considered human capital the composition of skills and qualifications, knowledge, experience, attitude, emotional intelligence, and judgment of employees. Human capital is critical as it builds efficiency and profitability.
2. Structural Capital
Structural capital is the strong foundation that empowers the firm to work in a systematic and versatile manner. This capital stays with the firm even when individuals vacate the premises. It can also be called organizational capital (Mouritsen, Larsen, Bukh, 2001). It comprises of processes, innovation, frameworks, information, designs, structure, policies and composition that provide an edge for the formation of knowledge and information. Structural capital has three sub-components: relational capital (RC), process capital (PC) and innovation capital (InC).
i) Relational Capital
Relational capital is the value that the organization creates through its relations with customers, shareholders, suppliers, government and employees. It is also known as customer capital and subsists the relationships between society and organization (Grasenick & Low, 2004).
ii) Process Capital
Process capital is the value of processes that are bought by the organization to enhance the distribution of products or services. This capital is important to the organization for development, implementation of strategies, and to frame unique external and internal structures for attaining strategic goals.
iii) Innovation Capital
Innovation capital is the expenditure on research and development, which, in turn, helps to build a competitive advantage. This capital analyses how the firm can gain from their unique innovations. The capital is made of resources, information, knowledge, research and growth.
3. Capital Employed
Capital employed or financial capital of the firm is the summation of all tangible assets. The firm needs the capital for providing goods or services. It is the amount of capital used for the acquisition of profits.
Therefore, Intellectual Capital Efficiency (ICE) is thus estimated by HCE, RCE, PCE and InCE. Hence, M-VAIC is calculated as the summation of ICE and CEE (refer Figure 1).
The varied methods for estimation of IC are restricted to financial and non-financial indicators.
The non-financial indicators, which are not easily accessible otherwise, are usually not documented by the companies in their financial statements. Therefore, the capability to execute the measurement reliably with a sizeable varied sample is narrow (Firer & Mitchell Williams, 2003). Chan (2009) recommended VAIC

Impact of IC on Firms’ Performance—Review of Literature
Intellectual capital, as highlighted in many pieces of research, is the prime resource for gaining a competitive advantage by individuals, businesses, and nations in the present economy. Additionally, researchers consider that IC can be utilized for the enhancement and development of organizations’ performance and to increase the corporate value (Chen et al., 2005; Ghosh & Mondal, 2009). Numerous researches have provided detailed positive and negative relationships among the variables. The strength of the association between business performance and IC was tested by Bontis, Chua Chong Keow, and Richardson (2000) in services and non-service industries through questionnaires filled by 107 students in Kuala Lumpur and Seremban. The results depict that investment in IC, precisely structural capital, will notably give the upper hand in the market. Also, human capital is significant for both the industries but the impact for the non-service industry is higher as compared with the service industry. Bollen, Vergauwen, and Schnieders (2005) collected data by way of a survey from managers in 41 German pharmaceutical companies and studied the link between components of IC, performance, and intellectual property. The results depict that IC and its components are somewhat indirectly linked with performance through intellectual property.
The relationship of VAIC
Appuhami (2007) explored the influence of IC on firms indexed on Thailand’s Stock Exchange, and the study underpins the theory based on resources and exhibits that IC is vital in generating value for the firm. On the contrary, Hang Chan (2009a, 2009b) examined firms listed on the Hong Kong Stock Exchange and established that there is no significant association between IC and firms’ profitability, productivity and market value. However, it was found that capital employed is the most significant constituent of the firm. Additionally, Phusavat, Comepa, Sitko-Lutek, and Ooi, (2011) recorded the effect of IC and the elements comprising it on employee productivity as a proxy for economic performance for manufacturing companies. The findings suggest that positive influence of IC on economic performance is highly significant. In contrast, Mondal and Ghosh (2012) and Firer and Stainbank (2003) have reported that IC has a negative relation with economic efficiency.
Similarly, Vishnu and Gupta (2014) analysed 22 Indian pharmaceutical companies using extended VAIC during the time frame 2005–2011 and established the positive effect of IC components on financial profitability, except for CEE. Ghosh and Maji (2015) investigated the basic VAIC
Research Gap
From the above discussion and review of literature, it can be emphasized that study into intellectual capital is in the beginning stage in India. The pharmaceutical industry faces major difficulties globally, confirming additional requirements by companies to increase their use of IC. Also, the present study is one of the pioneer works using modified VAIC in context of Indian pharmaceutical companies. This research seeks to address the gap in expanding the IC literature by discussing the absence of evidence concerning IC’s effectiveness and, in specific, its impact on pharmaceutical company’s performance in developing nation like India.
In the meantime, aside from the above diverse outcome, various researchers have failed to document any critical relationship between variables. Kamath (2007) and Ghosh and Mondal (2009) found no association between IC and performance. To broaden the horizon of IC in the context of Indian pharmaceutical companies, the study formulates the following hypothesis to explore the effect of M-VAIC and its components on firms’ profitability as represented by ROA, ROE and Earnings Before Interest, Tax, Depreciation and Amortization (EBITDA) (Refer Figure 2).
H1: No significant relationship exists between M-VAIC and firms’ profitability.
H2: No significant relationship exists between HCE and firms’ profitability.
H3: No significant relationship exists between RCE and firms’ profitability.
H4: No significant relationship exists between PCE and firms’ profitability.
H5: No significant relationship exists between InCE and firms’ profitability.
H6: No significant relationship exists between CEE and firms’ profitability.

Research Methodology
In order to analyse the effectiveness of M-VAIC model, the Indian pharmaceutical sector has been considered for the study. The sector is influenced by information-based resources and is suitable to examine the components of IC (Ghosh & Mondal, 2009). India relishes a great spot in the worldwide pharmaceutical sector. The Government of India’s ‘Pharma Vision 2020’ intends to make India the global leader in manufacturing various drugs. Human capital and structural capital, including innovation capital and process capital, play an imperative part in the growth and advancement of pharmaceutical firms. The growth rate of this sector is 13 per cent per year. The present section discusses the data, sample selection, variables, and models used in the study.
Data and Sample Selection
With the intent to examine IC, the study has taken all the 34 Indian pharmaceutical firms listed under NSE-500. The firms with a negative book value of tangible assets and negative M-VAIC were deleted (Pulic, 2000). VAIC
Variables Description
This section deals with the measurements of the variables and models used for the study. The study has used three types of variables: dependent, independent, and control variables.
i) Dependent Variable
As a proxy for the profitability of the firm, ROA, ROE and EBITDA have been used as the dependent variable (Alipour, 2012; Chan, 2009; Dzenopoljac, Yaacoub, Elkanj, & Bontis, 2017).
ROA measures the net income generated by the company’s total assets during the year. This ratio assesses the firms’ performance and effectiveness in engaging the resources to achieve benefits for the future.
ROE measures how efficiently the company is managing the funds that shareholders have contributed to run the organization. Basically, it measures the profitability of the company in relation to shareholders’ equity.
EBITDA measures company’s operating efficiency. It enables the company to evaluate and compare profitability across the industries and eliminates the impact of funding, government and accounting choices.
ii) Independent Variables
In this study, six independent variables are used:
HCE, the indicator of Human Capital Efficiency RCE, the indicator of Relational Capital Efficiency PCE, the indicator of Process Capital Efficiency InCE, the indicator of Innovation Capital Efficiency CEE, the indicator of Capital Employed Efficiency M-VAIC, the sum of the above five components.
Steps for calculating M-VAIC are given below:
Step 1: Calculate Value Added (VA) of the company, which is the difference between the output and input of the company.

where output is the total earnings and inputs are the expenses incurred in manufacturing the products or providing services. The following equation helps to calculate VA:

where, I = interest expenses; DP = depreciation expenses; D = dividends; T = income taxes; MI = minority interest; RE = retained earnings and EC = employees costs.
Step 2: Calculate the human capital efficiency, which is the ratio of VA divided by the total employees’ cost of the company.

where, HCE = human capital efficiency; VA = value added and HC = Human capital i.e. the total employees’ cost.
Step 3: According to the taxonomy of this study, structural capital consists of relational (customer) capital, process capital, and Innovation capital. Therefore,

In the VAIC

Pulic (1998) stated that there is an inverse relationship between SC and HC, i.e., the less the HC, the more the SC is associated with the value creation of the firm.
The equation for calculating structural capital efficiency is as follows:

or

and hence, structural capital efficiency is the summation of relational capital efficiency, process capital efficiency, and innovation capital efficiency.

or

Marketing and advertising costs are concerned with developing and maintaining customer relations and, hence, marketing and advertising costs are used as proxies for relational (customer) capital (Nazari & Herremans, 2007). Research and development expenditure is used as the proxy for innovation capital (Bosworth & Rogers, 2001), and process capital efficiency equals to structural capital efficiency minus relational capital efficiency and innovation capital efficiency (Anifowose et al., 2018).

where, SCE= structural capital efficiency, RCE= relational capital efficiency, PCE= process capital efficiency, InCE = innovation capital efficiency, SC = structural capital, RC= relational capital, PC = process capital, InC = innovation capital and VA = value added.
Step 4: Calculate the capital employed efficiency by dividing VA by Capital Employed (CE).

where, CEE = capital employed efficiency; VA = value added and CE = capital employed, i.e., the book value of total assets minus the intangible assets.
Step 5: Finally, calculate the modified Value Added Intellectual Coefficient (M-VAIC) which summarizes the model.

iii) Control Variables
The study has integrated the following control variables:
Size of the firm (SIZE): Calculated using the natural log of total assets. It is used to control the effect of firms’ size on the firms’ performance (Riahi-Belkaoui, 2003).
Financial Leverage (LEV): Is the proportion of total debt by the book value of total assets. It is used to control the effect of debt on the firms’ performance (Mondal & Ghosh, 2012).
AGE: Calculated using the number of years since the year of incorporation (Diez et al., 2010).
Regression Models
For estimating the effect of IC on firms’ profitability, various researchers have used OLS regression which has the disadvantage of not considering heterogeneity across time or groups (Greene, 2003). In order to solve this problem, the study has used an appropriate panel data regression model (random effect model or fixed effect model). To measure the effect of IC on firms’ profitability, six regression models have been formulated. Models 1, 2 and 3 examine the relationship between dependent variables and the aggregate measure of the intellectual capital of the firm, i.e., M-VAIC. To enhance the robustness of the study, models 4, 5 and 6 examine the relationship between dependent variables and components of M-VAIC, i.e., HCE, RCE, PCE, InCE and CEE. This study uses ROA, ROE and EBITDA as proxies for firms’ profitability as discussed earlier and uses the size, leverage and age as the control variables to remove its effect from the equations.


where ExpVar are ROA, ROE and EBITDA, α is constant, β1…… β8 are coefficients calculated for firm i (1, 2, …26) for the time period t (2009, 2010, …2018), ε is the error term, and other variables are discussed above.
Findings and Discussions
Descriptive Statistics
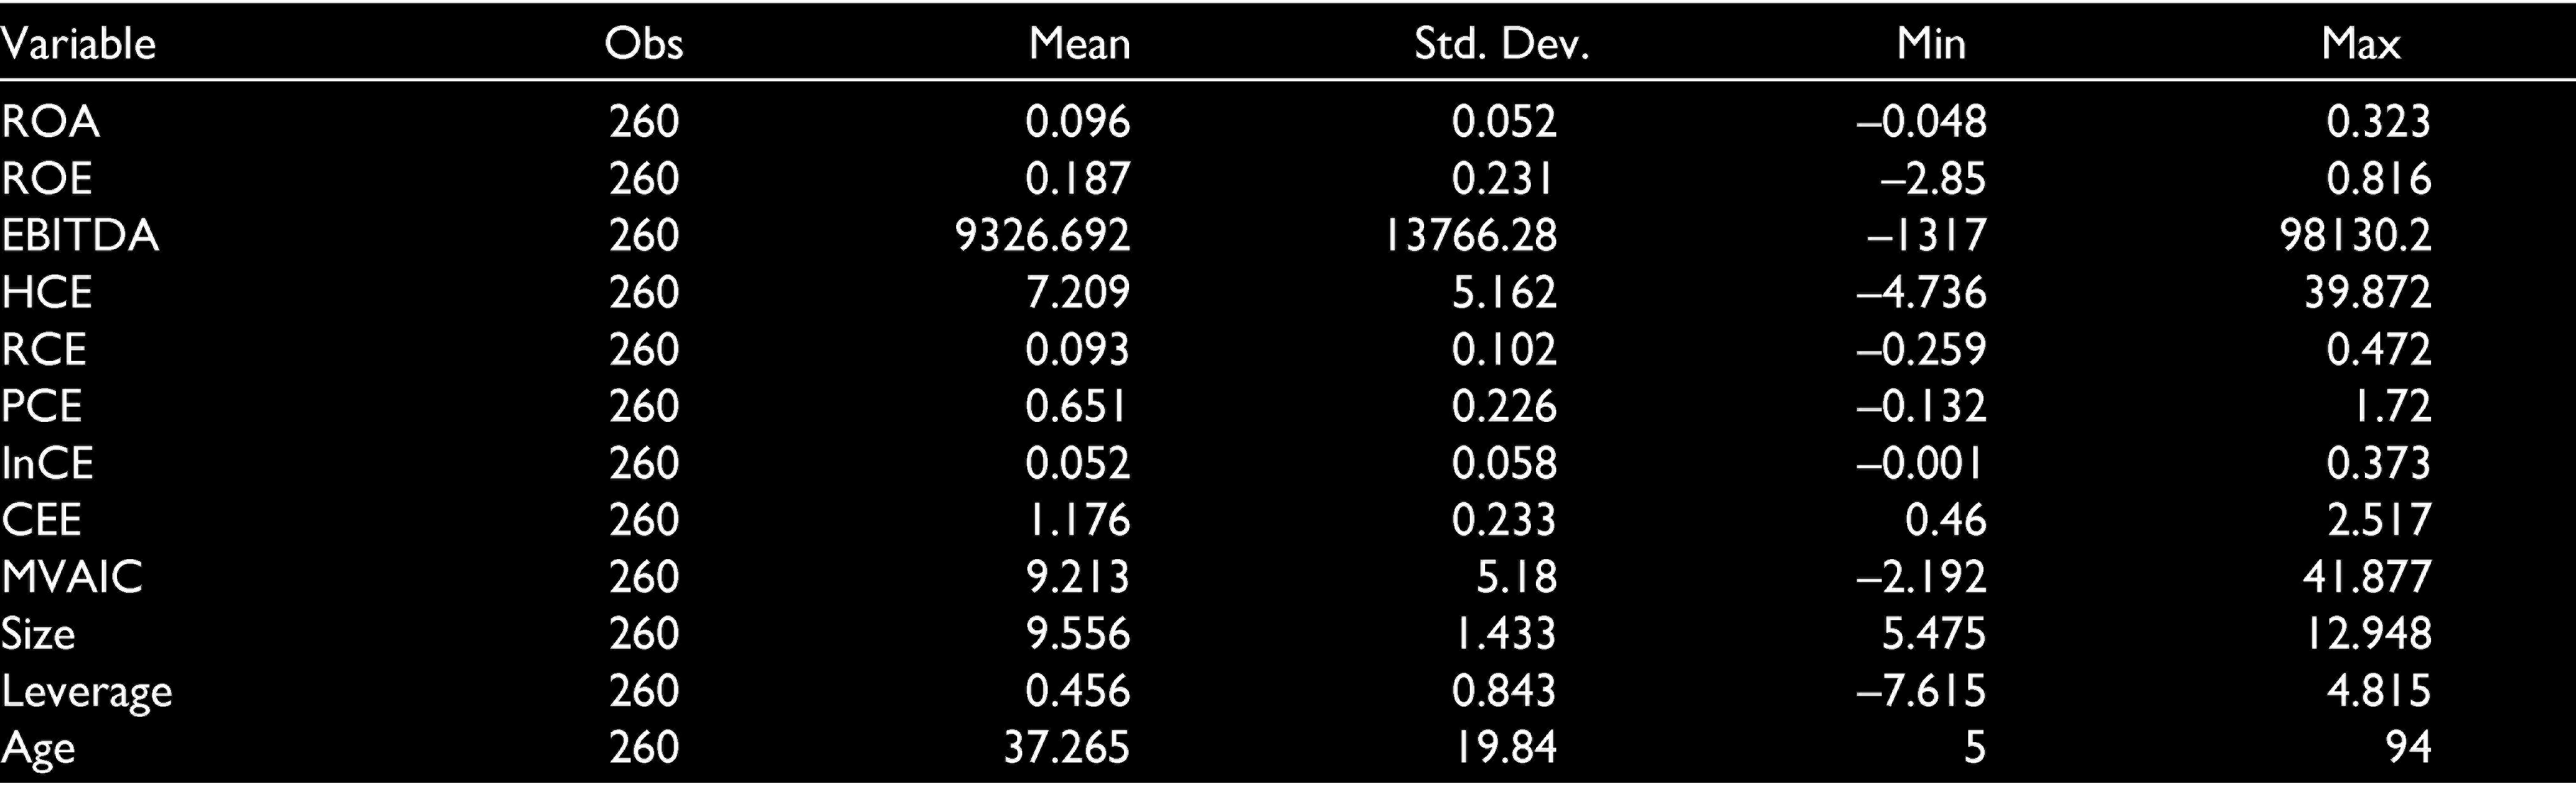
Summary statistics of the variables has been tabulated in Table 1. The table showcases the no. of observations, mean, standard deviation, minimum and maximum to give insights into the distribution of the variable. It can be seen from the table that mean value of ROA is 0.09 per cent, ROE is 0.18 per cent and EBITDA is 9326.69 over the period considered for the study. The highest standard deviation concerning the independent variables has been reported by M-VAIC (5.18), which signifies that VAIC scores of sample companies vary. The results show that in the components of intellectual capital, HCE has the highest mean value, i.e., 7.209, followed by CEE, PCE, RCE and InCE as 1.176, 0.651, 0.094 and 0.052 respectively. The summation value that represents intellectual capital (HCE, RCE, PCE and InCE) is more than the value CEE, indicating that the companies are concentrating more on intangible assets as compared to tangible assets.
Summary Statistics of Variables
Spearman Correlation between Independent Variables
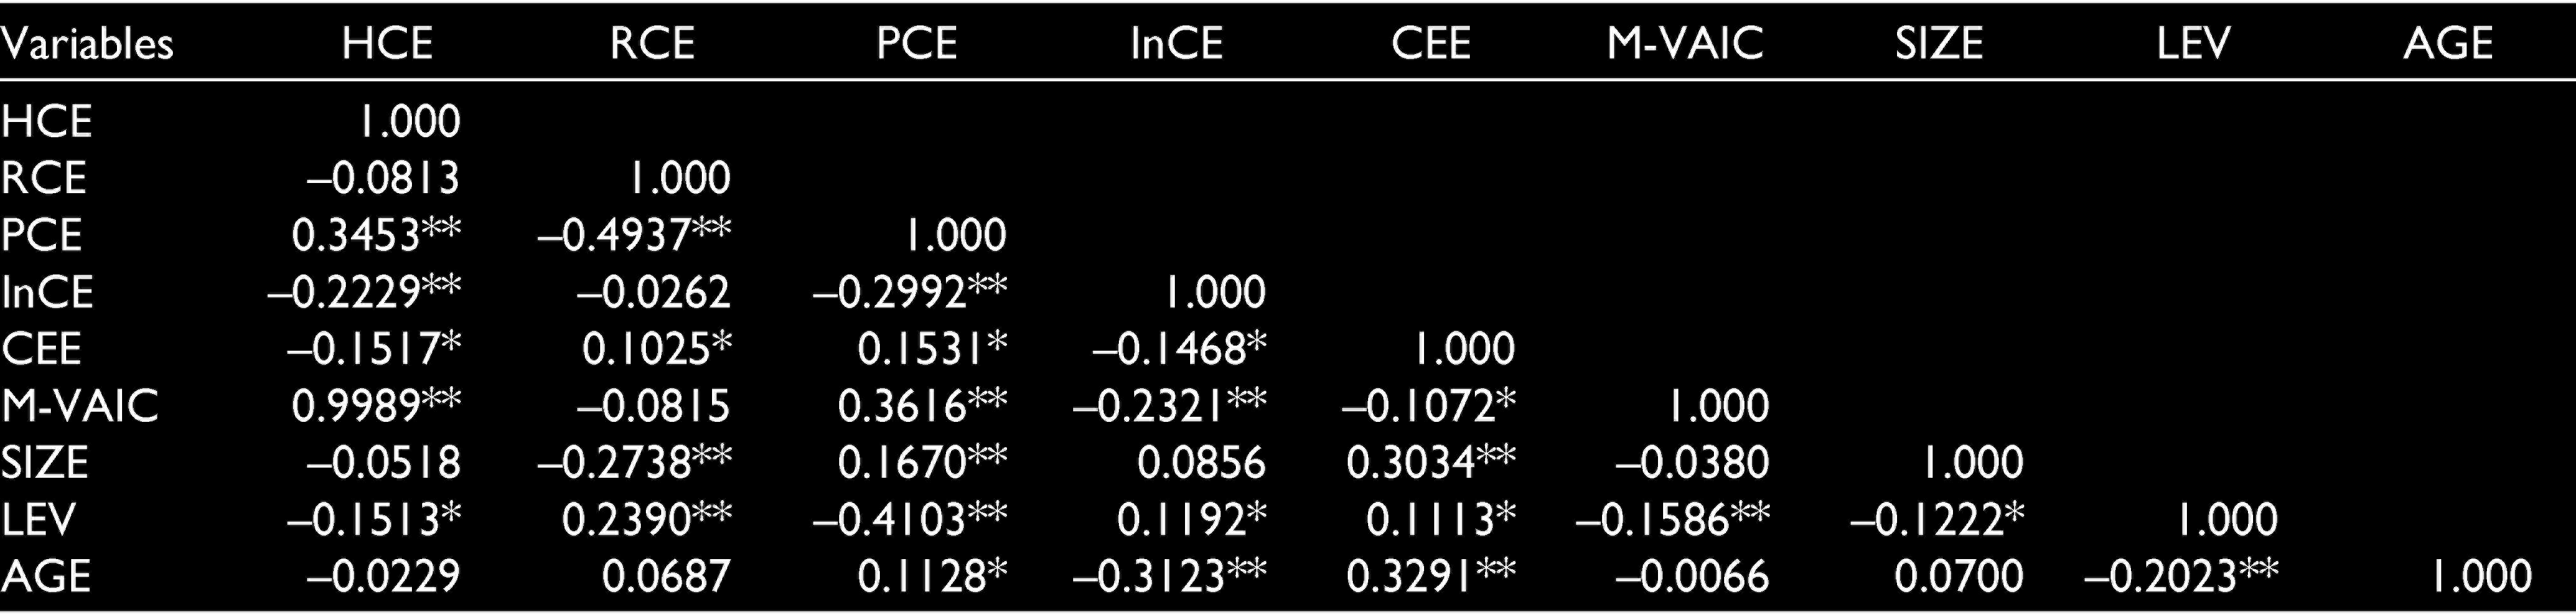
Correlation Matrix
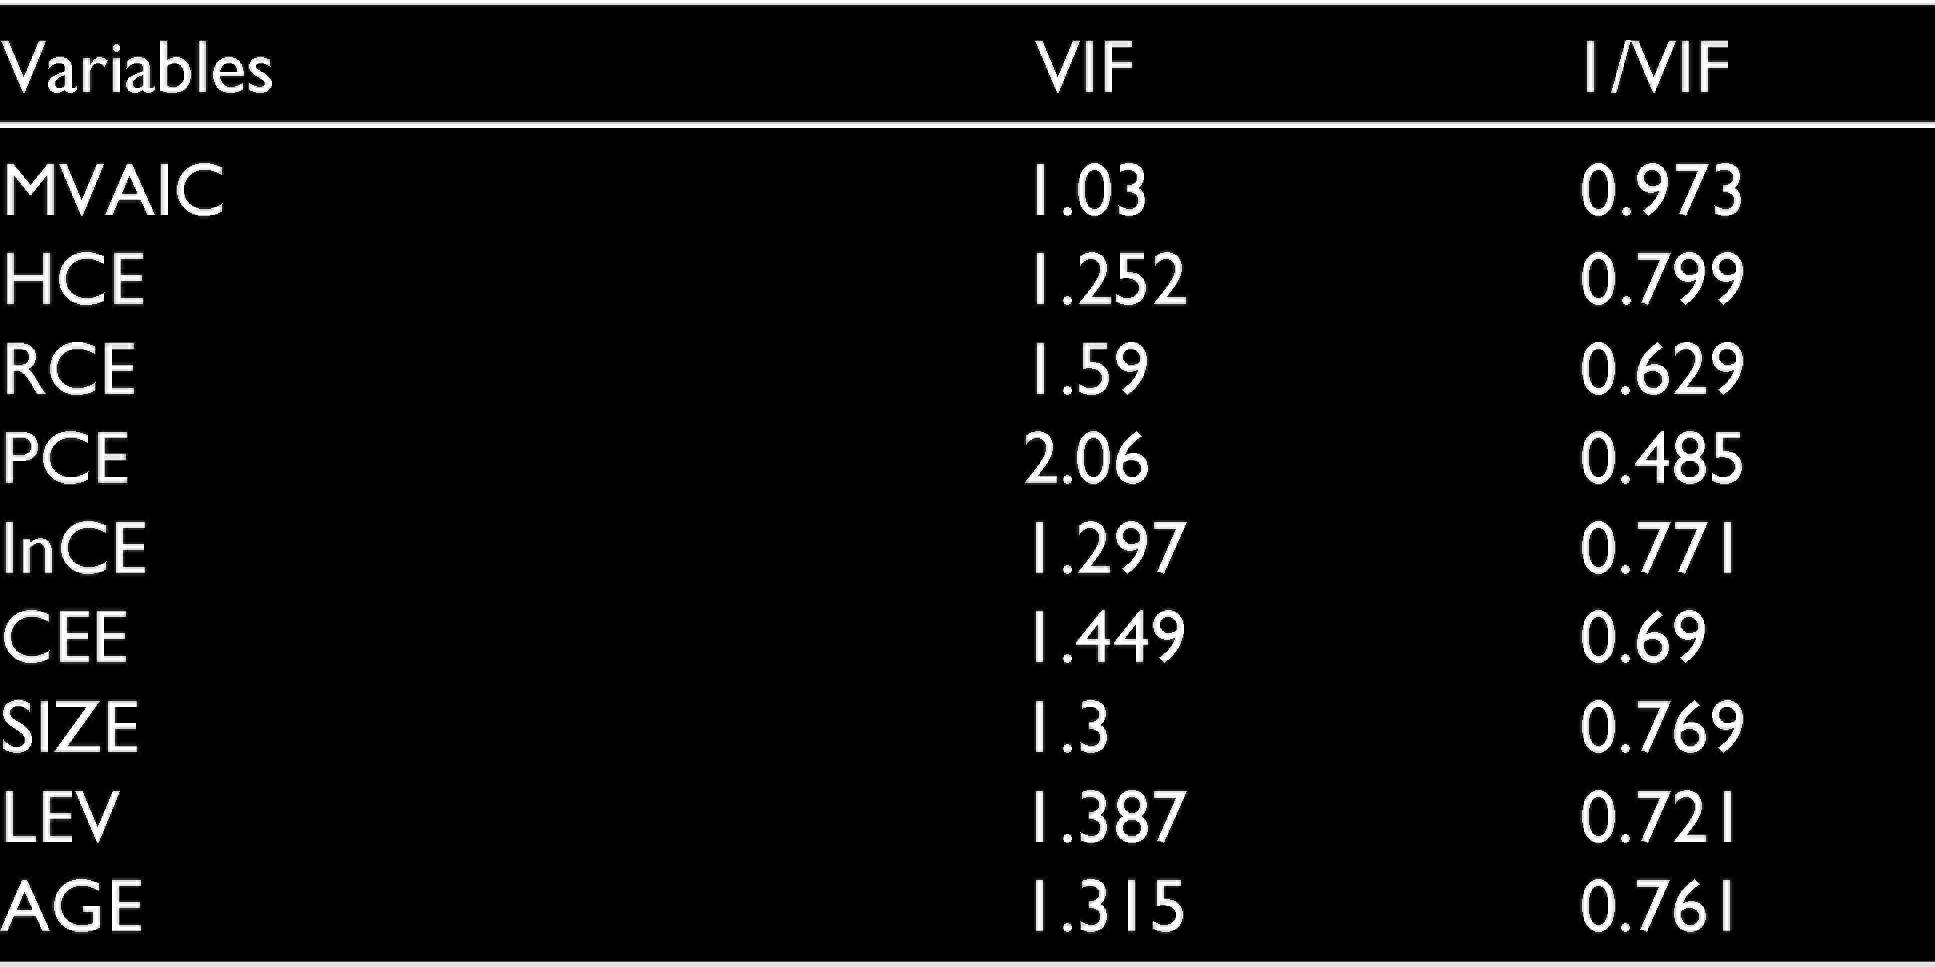
Table 2 exhibits the correlation matrix, displaying the association between independent variables. Overall, none of the independent variables are strongly correlated with each other, thus indicating that the multicollinearity will not be a problem in the regression analysis. Gujarati and Porter (2009) suggest that the degree of correlation exceeding 0.8 or 0.9 leads to the problem of multicollinearity. In the present study, the highest degree of correlation is 0.998 between M-VAIC and HCE; however, these two variables are being used in two different models proposed in the study. Apart from these two variables, the degree of correlation between all other independent variables is less than 0.8. Also, Variation Inflation Factor (VIF) have been calculated for testing the issue of multicollinearity, and the results are shown in Table 3. The independent variables are correlated with the predicted variable and, thus, are expected to have an influence on firms’ profitability.
Diagnostic Tests
Levin, Lin and Chu unit root test have been applied before running the panel data regression analysis. The results of the test show that the null hypothesis is rejected, as the p-value is less than 0.05 for all the variables, meaning that the data is stationary and that there is no unit root in the data. Moreover, multicollinearity has been checked through the VIF, and the highest value of VIF is 2.06 (Table 3), this suggests that multicollinearity does not exist in the data, as the values are below the criterion of 10 and above 0.10 for tolerance (Field, 2013; Hill, Griffiths, & Lim, 2011). Further, the Breusch-Pagan test is applied to check the heteroscedasticity in the data, and the results depict the absence of heteroscedasticity in models as the p-value is more than 0.05 showing the data is evenly scattered. Finally, Wooldridge test for serial correlation was conducted, and results supported the null hypothesis for no first-order autocorrelation (Wooldridge, 2010).
Multicollinearity Test Results: VIF and Tolerance
Panel Data Regression Analysis
To investigate the impact of IC on firms’ profitability, panel data regression analysis was employed. Panel data regression permits to control the variables across companies and report the individual heterogeneity. The present study uses three control variables (Size, Leverage and Age) so that their influence on firms’ profitability can be controlled. In order to evaluate the effect of IC, six regression models were developed. As shown in the tables below, the suitability of the Fixed Effect (FE) or Random Effect (RE) model has been confirmed by chi-square (χ2) and p-value results of the Hausman test.
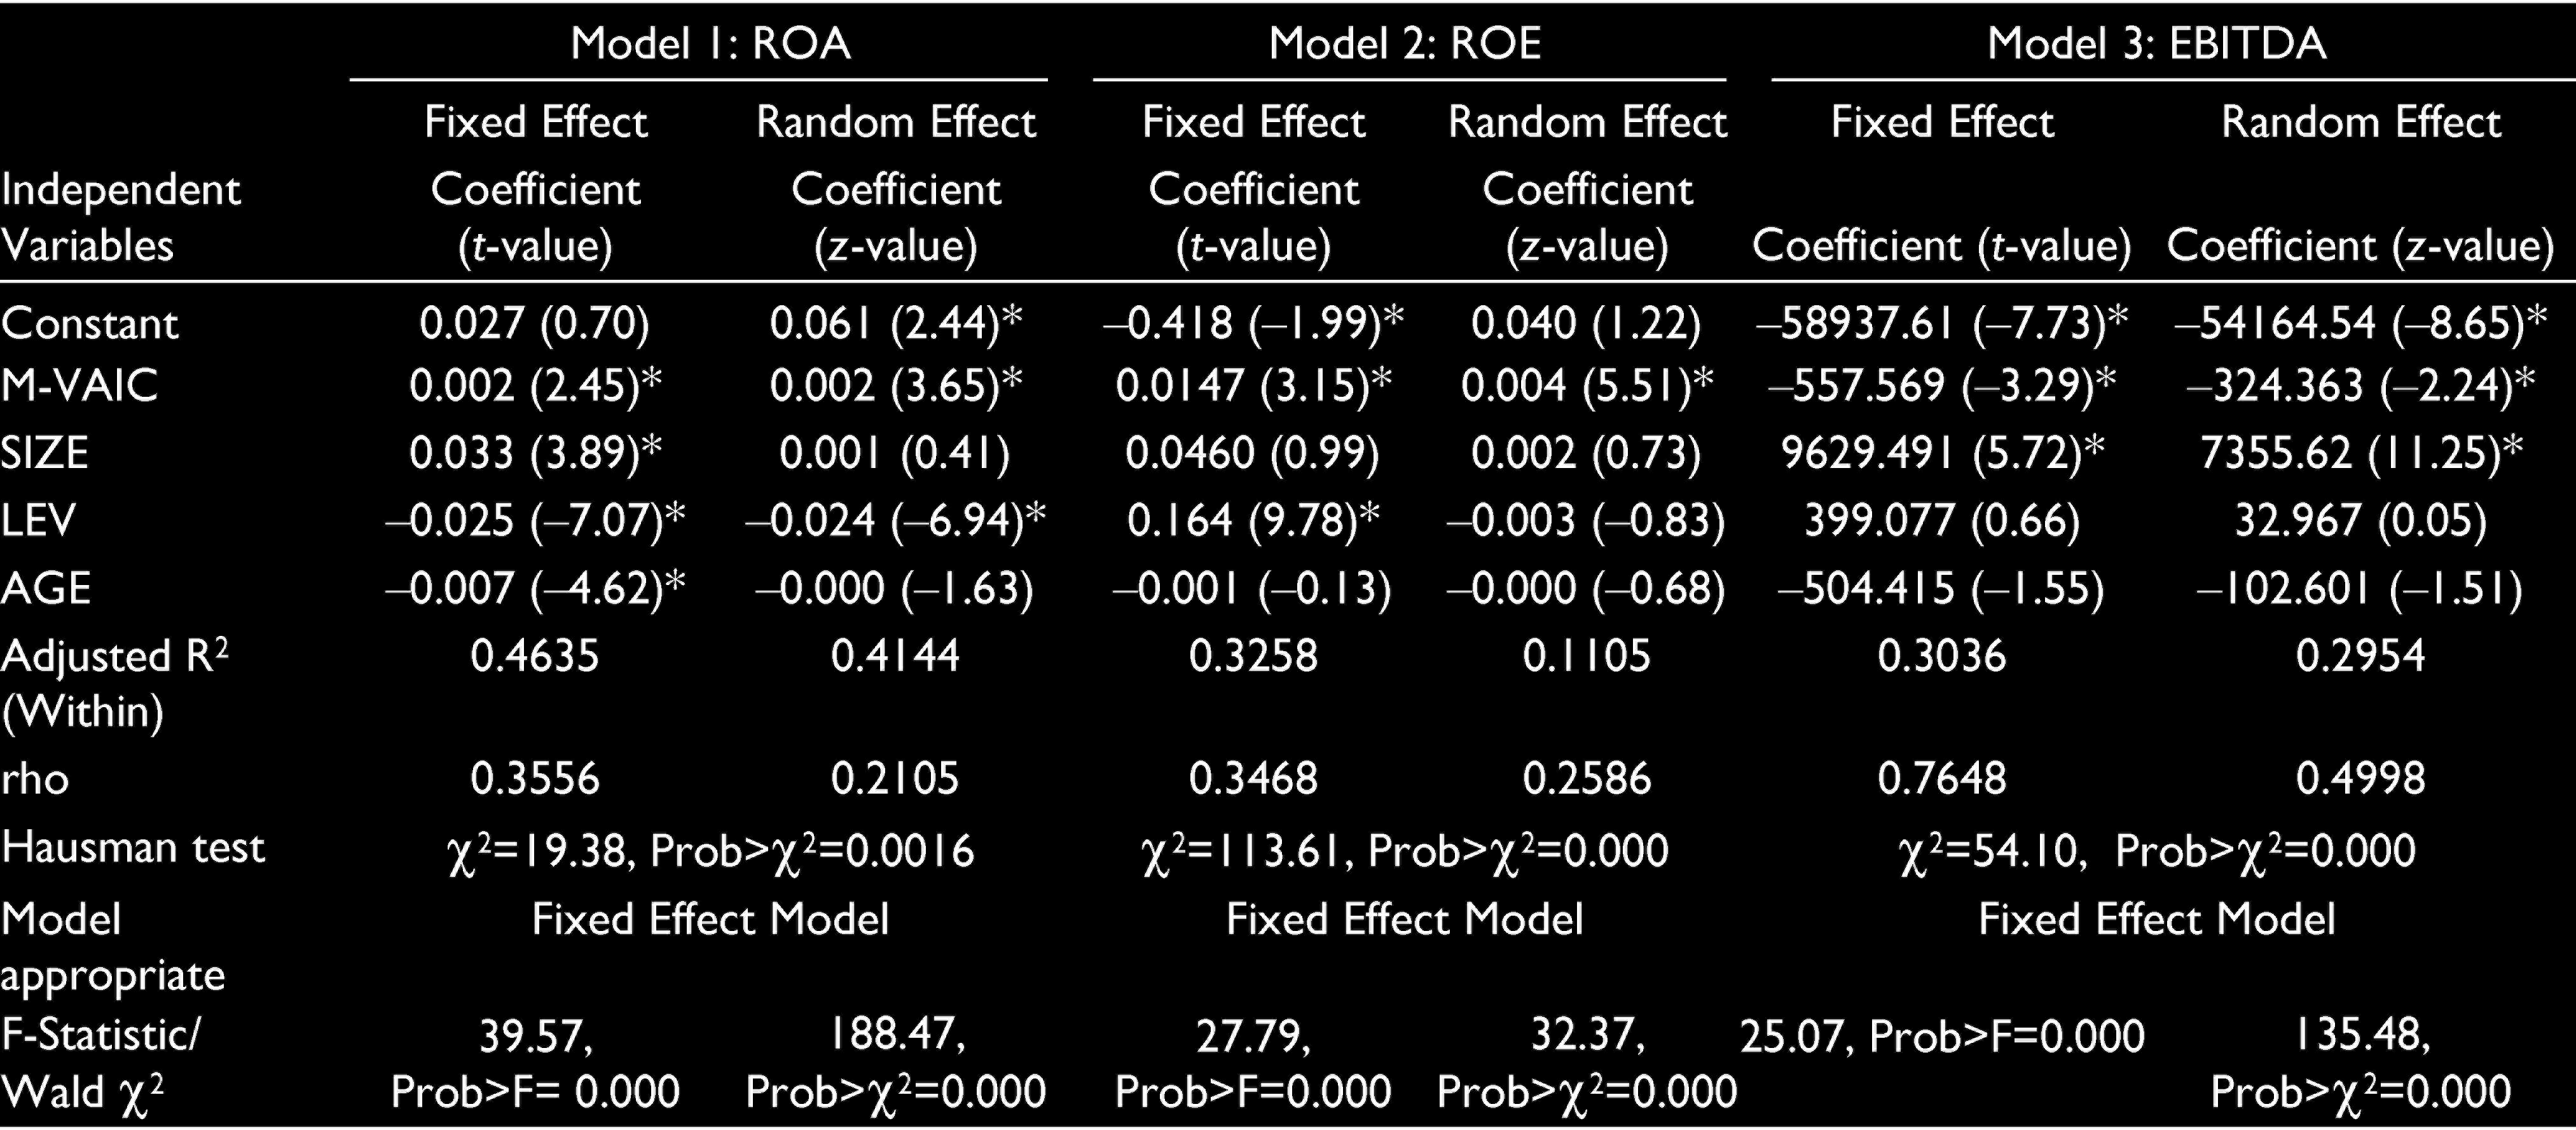
Models 1, 2 and 3 examine the impact of overall intellectual capital (M-VAIC) on ROA, ROE and EBITDA respectively and results for the same are shown in Table 4. The findings of the Hausman test rejects the null hypothesis and confirms the appropriateness of the FE model for all the three models. The results derived show the overall fitness of model 1 as represented by the value of Wald χ2, which was found to be significant at 1 per cent. As can be seen from Table 4 for model 1the value of Rho (ρ) is 0.3556, which signifies that the error term with the dependent variable. The explanatory power of the model within the firms, over the years, as expressed by R2 (Within) is calculated to be 46.35 per cent. The coefficient of M-VAIC (0.002) is found to be positive and significant at 5 per cent level, and therefore, H1a is rejected. The results of the study are in line with Chen et al. (2005), Shiu (2006), Zhang, Zhu, and Kong (2006) and Vishnu and Gupta (2014). Thus, the overall performance of the model has been found to be significant, and inference can be drawn from this that M-VAIC used as a proxy to measure intellectual capital influences the firms’ profitability in a positive and significant way. The results of model 2 and 3 are similar to that of model 1 with the exception of the impact of EBITDA with a negatively significant coefficient. Thus, leading to the rejection of H1b and H1c.
Impact of M-VAIC on ROA: Regression Results (Models 1, 2, 3)
In order to increase the robustness of the results, components of M-VAIC were individually studied, and their impact on firms’ profitability was estimated. Models 4, 5 and 6 examine the effect of HCE, RCE, PCE, InCE and CEE on profitability. The panel data regression results for the same are tabulated in Table 5. The results of the Hausman test support the selection of a fixed effect for this model. The proposed models are explaining the predicted firms’ profitability well, as indicated by their respective R2. Overall, the model is found significant at a level of 1 per cent. The predicting variables HCE, RCE, PCE, InCE and CEE are found to have a significant impact on ROA. However, only HCE and CEE bear a positive coefficient indicating their beneficial impact on dependent ROA. Therefore, all the hypotheses depicting the association between components of M-VAIC and ROA i.e., H2a, H3a, H4a, H5a, and H6a are rejected. Hence, confirming the significant relationship among them. For model 5, M-VAIC components are found to be having similar impact on ROE with the exception of InCE and CEE. The components InCE and CEE have positively insignificant coefficient and thus, don’ bear a substantial influence on firms’ profitability as measured by ROE. Owing to these results, H2b, H3b, and H4b are rejected; H5b and H6b are not rejected. The results of model 6 showing impact of M-VAIC components on EBITDA indicate that only HCE has a significant coefficient which is negative. Thus, it can be concluded that HCE is the only M-VAIC component which affects EBITDA considerably, leading to rejection of H2c alone. The results are in line with Alipour (2012), Ulum et al. (2014), Anifowose et al. (2018).
Impact of M-VAIC Components on ROA: Regression Results (Models 4, 5, 6)

It implies that the companies should focus on enhancing the skills of employees and maintaining their relationship with stakeholders. Also, expenditure made on information and networking, policies, framework should be managed efficiently so as to get their effective benefits. Moreover, customary attention should be paid to financial capital simultaneously. These assets if put to use in a well-mannered way and managed coherently, can yield more profitable results. Thus, the conclusion can be drawn from this that overall intellectual capita should be paid attention to in order to gain competitive advantage and increase firms’ financial performance.
Conclusion and Policy Implications
Indian business situation has changed due to globalization and free competition and has led to an explosion of opportunities. The organizations, to survive in this competitive era, have to pay attention to the productivity and efficiency of the intangible assets along with the growth of tangible assets. In the knowledge-based economy, IC is treated as a vital element for the creation of value for the firms. Intellectual capital comprises of assets such as human capital, processes, networking and information system and relationships maintained with stakeholders, which in turn helps the organizations to increase efficiency and reduce costs.
The primary objective of this study is to analyse the impact of Intellectual Capital on firms’ profitability. To measure IC, an extended VAIC model has been used and, thus, accordingly, the hypothesis regarding the relationship between intellectual capital and firms’ profitability has been examined. This model is widely accepted by the researchers, as it provides insights into the efficiency of the company’s assets. The main advantage of the model is the clarity in the calculation of the components which, in turn, is based on the financial statements of the companies. ROA, ROE and EBITDA have been used as the proxies to measure firms’ profitability. The study is conducted on a sample of 26 Indian pharmaceutical firms for the time period of 10 years (2009–2018), and all related hypotheses have been tested. The paper has proposed six models—the first three models examines the effect of overall intellectual capital (M-VAIC), and the next three models examines the effect of an individual component of intellectual capital (HCE, RCE, PCE, InCE and CEE) on firms’ profitability.
Based on the findings of panel data regression analysis, the overall IC of the firm is found to be significant for all measures of profitability. The paper draws the inference that human capital efficiency should be considered the most important component of IC, and advocates that Indian pharmaceutical firms do gain from investing in the enhancement of knowledge and skills of the employees. Additionally, companies benefit from the relationships it maintains with the shareholders and customers. The results support that physical capital (CEE) continues to play a significant role in boosting and increasing the profitability of the firm. The process capital and innovation capital still need to be recognized. The overall intellectual capital can be used, in order to create value, reduce sole dependence on the tangible (physical) assets and thus, gain an edge in the competitive world.
This study gains interest and has practical implications for various stakeholders such as shareholders, policymakers, investors, regulators, and management. For managers, it helps by indicating the requirement of regulating and improving IC of organization and magnifying investment in intangible resources, so as to gain a competitive advantage over rival companies. The results are valuable for investors and shareholders, as they can make decisions regarding their investment in companies and evaluate the firms’ IC in order to obtain better financial returns. For policymakers and regulators, to assess the IC efficiency of the firms and to compare different industries to make proper standards of reporting of intellectual capital, the study provides fruitful insights. Comprehensively, the result suggests companies to properly manage and invest in IC so as to increase their profitability. In spite of the increasing significance of IC, their reporting and acknowledgment in the annual reports are limited, and the concept of IC in India is still in the early stages.
The study suffers from limitations, which could be an open door for the future scope, as the sample size is limited to only the pharmaceutical sector. Other sectors can also be studied, and a comparative analysis between industries can be drawn. Also, cross-country examination can be done to compare the efficiency of intellectual capital across countries. ROA has been used as a proxy to measure profitability, the researcher can consider other variables as a means to measure profitability, and the impact of IC can also be seen on productivity, market value and economic performance of the firm.
Footnotes
Declaration of Conflicting Interests
The authors declared no potential conflicts of interest with respect to the research, authorship and/or publication of this article.
Funding
The authors received no financial support for the research, authorship and/or publication of this article.