
Abstract

This is very interesting and could not have come at a more opportune time. An essential prerequisite of a good case analysis rests on the ability of the case reader to discuss multifaceted issues and derive lessons by looking at the case problem in its entirety. Consequently, the analysis of the case is divided as follows. First, there is a general discussion surrounding the macro environment within which the banks need to function and, therefore, bear the brunt directly or indirectly. It follows with a discussion surrounding the business and financial indicators presented in the exhibits and constructing the emergent thoughts with the larger issue surrounding the performance of the bank within the prevailing business environment. And lastly, the analysis critically looks at the most suitable approach to valuation best suited to determine the intrinsic value of the City Union Bank.
The Big Picture!
At a time when the banking sector in India is undergoing tectonic shifts, be it in terms of exposure to stressed assets or the underlying wave of consolidation, City Union Bank represents a rare example as an efficiently run bank among the smaller banks, and thereby standing out of the crowd. With its headquarters located in the pristine temple town of Kumbakonam in Tamil Nadu, India, the bank always has maintained a steady momentum by remaining focused on non-infrastructure sectors to augment loan growth. It is evident from the case that the bank maintains a conservative loan exposure with 76 per cent of the loan book coming from agricultural; micro, small and medium enterprises (MSME); trade services; and gold loans. The strategy adopted by City Union Bank has significant implications. Combined with the effect of global headwinds teetering towards a possible ‘recession’ and domestic economic woes as a result of slowing growth, infrastructure remains one of the most vulnerable sectors of the Indian economy. The spate of distressed signals sent by public sector banks in general is a testament to this fact. In that sense, it is useful to argue three distinctive attributes supporting the bank’s growth momentum—regional exposure, size and strategic sectoral focus. Even as India reels under a wider economic slowdown, magnification of economic woes is relatively tempered in the southern part. Partly owing to better Human Development Index (HDI) indicators along with skilled manpower and disposable incomes imply that smaller banks focused on the southern belt are relatively better insulated from the volatile business sentiments impacting their bigger counterparts predominantly exposed to non-southern geographies. As highlighted earlier, City Union Banks is able to clearly reap rich dividends from its lack of exposure to big business conglomerates as well as the infrastructure sector.
Making Sense of the Business and Financial Exhibits
As a go-to bank for retail customers particularly in the rural areas, City Union Banks has achieved an impressive growth in enhancing the number of banking outlets from 268,454 in 2013 to 598,093 in 2017 registering a compounded annual growth rate (CAGR) of 22.17 per cent. Augmenting the steady expansion of the retail bank branch network, the bank also witnessed a healthy growth in the number of ATMs, which increased from 114,014 in 2013 to 208,354 in 2017 clocking a CAGR of 16.27 per cent.
An efficiently run bank calls for a competitive cost of funds. And this is where deposits play an important role in achieving the above objective. Given the detrimental implications of external borrowings on banks’ cost of capital, banks are well advised to shore up their deposits. Not just from the standpoint of cost of securing current account and savings account (CASA), deposits present fewer dangers as opposed to risks arising from a volatile interest environment evident in external borrowings. To that extent, it is interesting to note that the City Union Bank registered an impressive CAGR of 10.59 per cent in total deposits. In terms of loan and advances, the bank witnessed a moderately healthy CAGR of 8.39 per cent. The above trends are well reflected in the increase in net profit for the bank which increased from ₹322.03 crore in 2013 to ₹502.77 crore in 2017 registering a CAGR of 11.78 per cent.
Looking at the stock price performance, it is evident that the stock has clearly been a darling of the market evidenced by its impressive growth from approximately ₹50 in 2013 to ₹140 in 2017 registering a CAGR of 29.36 per cent. With an estimated beta value at 1.24, the stock is observed to be only moderately riskier in comparison to the market.
The Final Analysis: Valuation
As in the art, it is best to describe valuation in a single statement—value lies in the eye of the valuator! Valuation is at best an imprecise exercise and invariably imposes some degree of ‘moral hazard’ on the valuator as the latter is constantly toying with the inputs until she reconciles the intrinsic value closest to the market value. To that extent, valuation thus represents an interesting amalgamation of science and art. The scientific part goes to the extent of informing the model; the art, however, determines the final value.
Banks present an interesting scenario for valuation as there are a multitude of approaches dictating the process. Even as the conventional methods like the discounted cash flow (DCF) approaches evidenced in dividend discount model (DDM) and free cash flow to the firm (FCFF) model present significant computational challenges, relatives approach present by far the most realistic approach for valuation of banks. Prominently, the price-to-earning (P/E) and price-to-book value (P/BV) techniques appear to be the most popularly employed techniques by the analysts covering banks.
Appearing from the relative obscurity is the residual incomes approach. Given the underlying conceptual basis grounded on the equity model, residual income approach in some sense acts as a compromise between the DCF and relatives approaches on the extreme ends of the continuum. Without relying excessively on unimaginable number of inputs, the residual income approach nevertheless incorporates the discounting function retaining the conceptual rigour.
In its simple sense,

where
Equity charge = Equity capital × Cost of equity
Ke (Cost of equity as in CAPM) = Rf + βi (Rm- – Rf).
where
Rf = Risk-free rate of interest represented by long-tern Govt bond
Rm = Return on market index
βi = Measure of systematic risk.
In the discounted version, the intrinsic valuation assumes the following form:
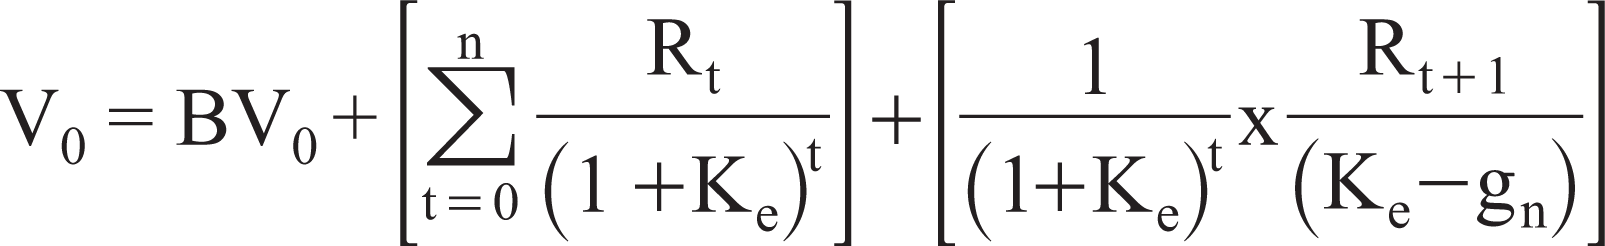
where
BV0 = Book value in the current year
gn = growth rate in the terminal year.
Readers familiar with conventional discounted cash flow techniques will be able to appreciate the above function effortlessly.
1
Therefore, without revisiting the above intricacies, the application of residual income approach in City Union Bank is presented as follows:
Book value for City Union Bank for 2017 (in crore of ₹) = 3,570.2 Net income for City Union Bank for 2017 (in crore of ₹) = 502.77 Using the CAPM model, cost of equity capital for City Union Bank = 0.0717 + (1.24 × 0.051) = 0.13494 From Equation (1), Equity charge = 3570.2 × 0.1394 = 481.763.
Therefore,
Residual income (Rt) = 502.77 – 481.763 = 21.0072.
It is assumed that City Union Bank will enjoy a supernormal growth period of 10 years after which it slips into terminal growth. During the supernormal growth phase, the growth rate is essentially computed as follows:

where
ROE = Return on equity
RR = Retention ration = 1 – Payout ratio.
Payout ratio =
where
DPS = Dividend per share
EPS = Earnings per share.
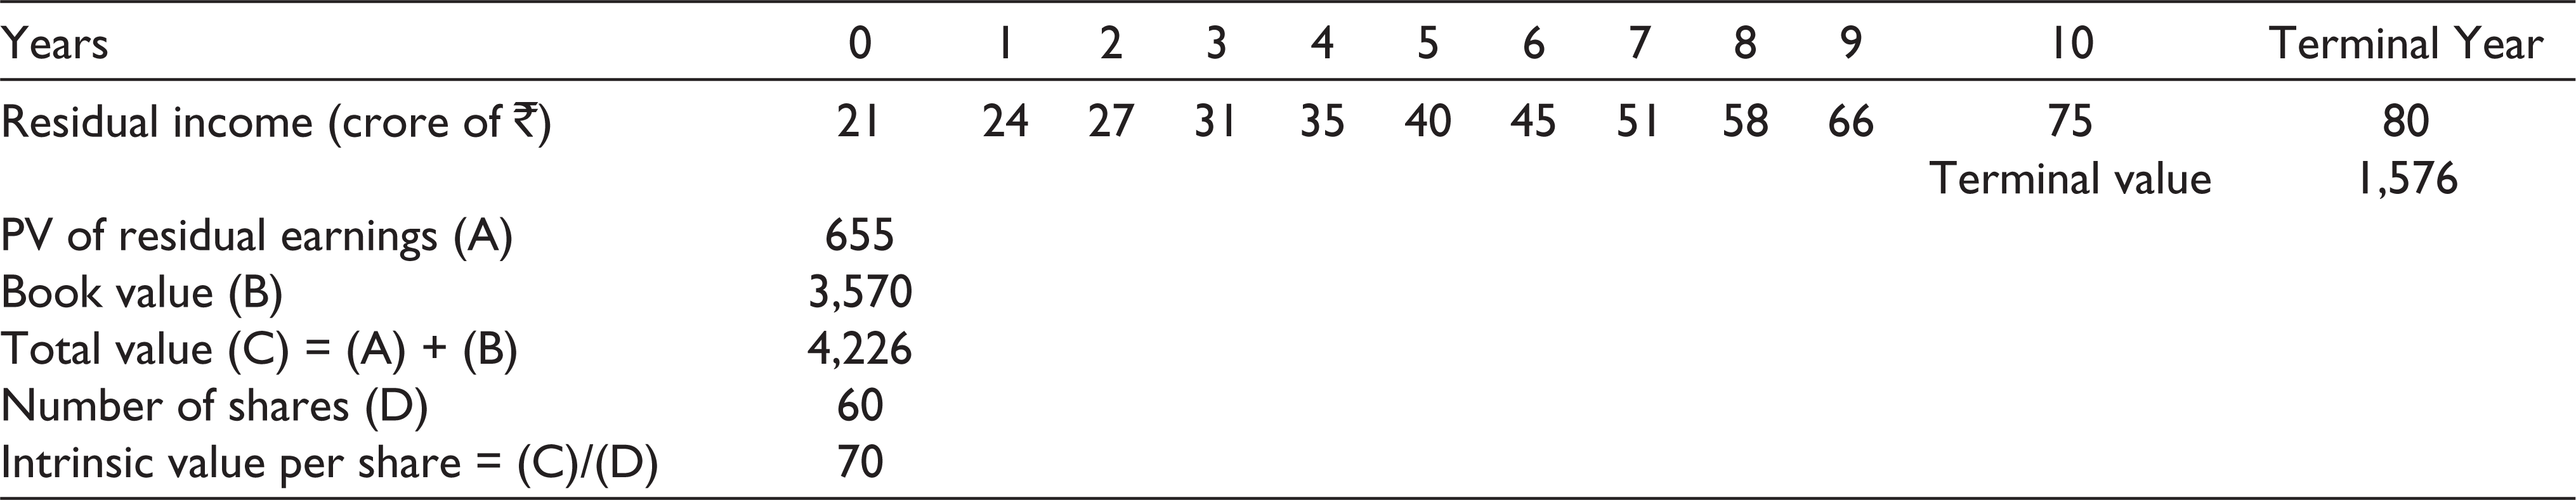
Residual Income Approach to City Union Bank (Range 1)
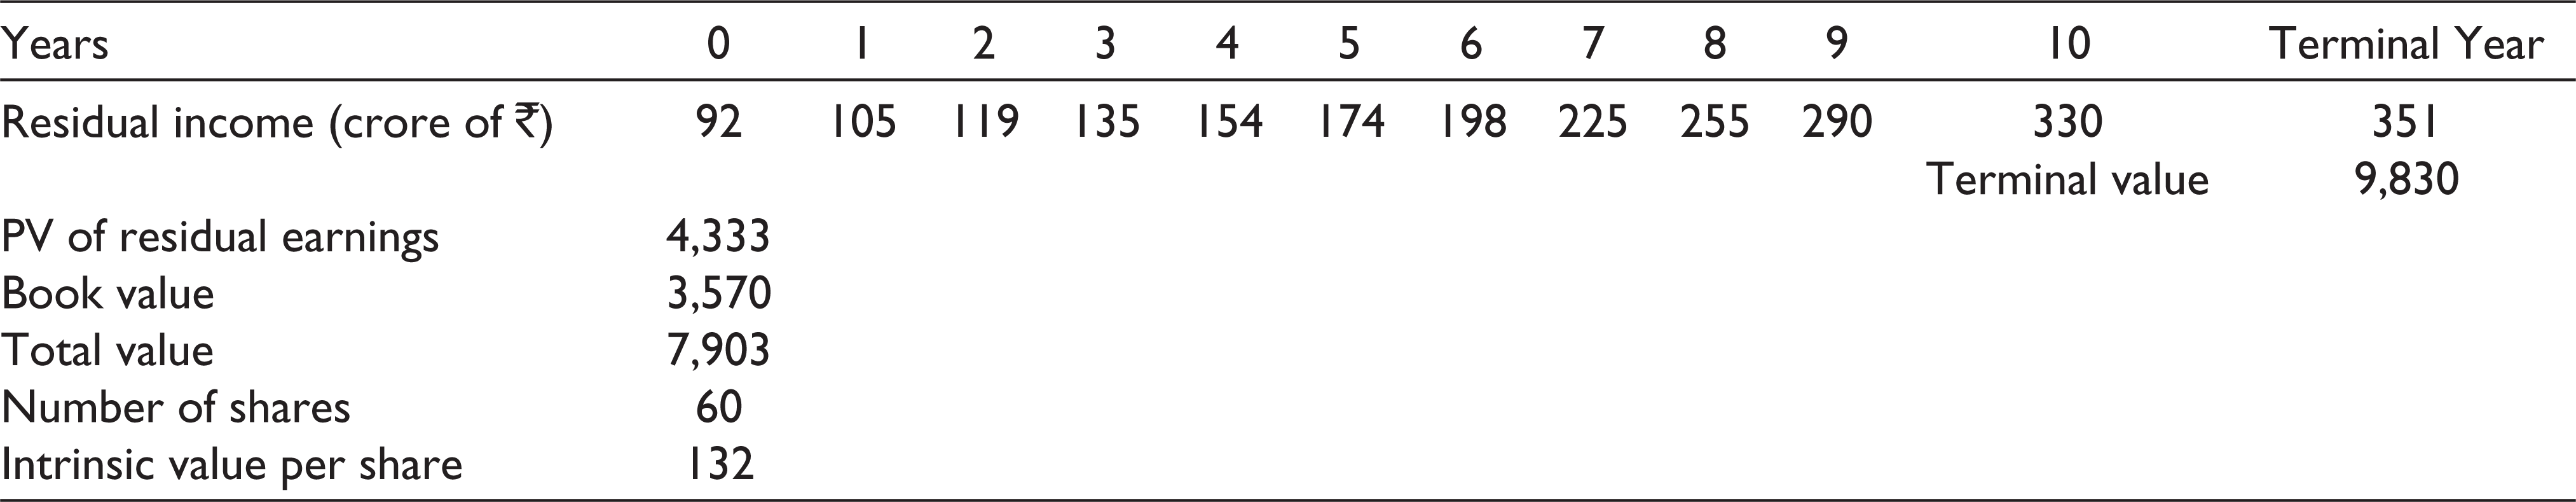
Residual Income Approach to City Union Bank (Range 2)
In case of City Union Bank, the figures of DPS and EPS for 2017 are given at ₹0.3 and ₹8.36, respectively, generating a payout ratio of 0.03589. Given that the ROE for 2017 is 14.08 per cent, using Equation (3) yields a supernormal growth rate of 0.13575 or 13.575 per cent.
In respect of the terminal valuation, it is assumed that the bank’s beta converges with the market beta with β = 1. Substituting the beta value yields a terminal cost of equity at 0.1227. Further, it is assumed that the terminal growth rate reverts to the risk-free rate at 0.0717. It is assumed that the City Union Bank enjoys a supernormal growth period of 10 years after which it will be slipping into the terminal stage.
An excel output underlying the computations is presented in Table 1. 2
Attesting to the fact that valuation is partly science and partly art, it may be vouched from the above analysis that the residual income approach yields an extremely conservative value pegging the intrinsic value of share at ₹70. However, as is the case in any valuation exercise, there is no final word as such.
To better mirror the prevalent market realities, if the analyst were to make minor adjustments underlying the above inputs:
Risk-free rate = 0.065 Estimated beta = 0.98 Terminal beta = 0.7 (assuming the risk of the stock will be much lesser than the market).
An excel output involving the above amendments is presented in Table 2.
With these changes, it may be observed that the intrinsic value of the share rises to ₹132. As an analyst, it is therefore best advised to indicate the valuation in a range using multiple approaches than thrusting a single number based on a single approach. Would relatives be better suited to value City Union Bank? That is another interesting dimension best left for the discerning readers to figure out!