




Abstract
The study advances the existing literature on corporate finance and governance by establishing a non-linear effect of large ownership on the enterprise value of Indian manufacturing firms. The study employs both static and dynamic panel models on a set of panel data consisting of 112 Indian manufacturing firms. The study establishes a U-shaped relationship between large ownership and enterprise value of the sampled firms. Large promoters until 34% of ownership are found to exert a negative effect on enterprise value which signifies expropriation effect along with poor alignment of interest with the firms. However, for ownership concentration by promoters after the said threshold, the effect is found to be positive signifying improved alignment of interests, efficient monitoring and disciplining of managerial opportunistic behaviour. Based on the findings, the study suggests the Indian manufacturing firms not to entirely rely on the role of large owners and to opt for improved external regulatory and institutional establishment for the protection of minority shareholders’ interest and ensuring stringent corporate governance.
Introduction
The manufacturing sector of India, for the last couple of years, attracts the highest amount of research efforts than any other sectors when it comes to examining the ownership-performance relationship. This is because, while ownership concentration is noticeable in almost all the sectors indiscriminately in other emerging Asian economies, in India the concentration of ownership is much more prominent in manufacturing sector (Altaf, 2016; Selarka, 2005). In developing countries like India, large ownership is also gradually considered as a part of important internal governance mechanisms (Abbas et al., 2013) of firms for alleviating agency crisis between owner and manager and for mitigating other governance problems. In Asian economies including India, the nature of agency crisis considerably differs in two firms, one having ownership of large shareholders and another with diffused shareholding pattern (Sarkar, 2010). However, the impact of large ownership or concentrated shareholdings on the agency problem, performance and value of firms has been theoretically complex and empirically dubious. More specifically, the functions of majority owners especially of big promoters are viewed in two different perspectives under two broad hypotheses: monitoring hypothesis and expropriation hypothesis. As per the first hypothesis, large owners may be more capable of monitoring and controlling the management of affairs of a company by exercising their substantial voting and cash-flow rights. According to the monitoring hypothesis, the large shareholders have sufficient rights and incentives to monitor the managerial discretions in a firm. As a result of their active monitoring, the vertical or Type 1 agency problem (owners–managers conflict of interest) reduces which leads to increased efficiency in business operations, higher financial performance and market value (Pandey & Sahu, 2019a; Shleifer & Vishny, 1986) On the other side, as per the second hypothesis, ownership concentration gives more power to a circumscribed number of shareholders and they may unjustifiably act against and expropriate value from minority shareholders (Porta et al., 1999). In this case, large owners may become costly as they can redistribute wealth in both efficient and inefficient ways from minority shareholders (Shleifer & Vishny, 1997) and oppress them in many other ways (Burkart & Panunzi, 2006). They may also potentially act against the interests of the minority shareholders by engaging in value-reducing activities while pursuing activities that diverge from the value maximization objective of the firm (Fama & Jensen, 1983). This gives rise to horizontal or Type 2 agency problem, that is, conflict of interest between minority and large shareholders. The effect of large ownership on the agency costs, performance and value of a firm thus depends on the existence or dominance of any one of these two contradictory effects in the firm. In case the monitoring effect overweighs the expropriation effect, the impact becomes favourable to firm value and vice-versa. However, it is most likely that the large promoters would pursue different role, that is, active monitor and expropriator in different levels of their ownership (Altaf & Shah, 2018; Kumar & Singh, 2013) and in such cases the relationship becomes non-linear.
Therefore, given the dominance of large promoters in the Indian manufacturing sector, it would be worthy to examine the true impact that such promoters exert on the operational efficiency and performance of manufacturing firms in India. The rest of this article is divided into four sections followed by some sub-sections. The second section contains a brief review of empirical literature. The third section of this article presents a detailed description of the data, construction of variables, statistical and econometric tests adopted to arrive at the results. The fourth section includes data analysis and reporting of the empirical results. The fifth section presents the key findings of the study. Finally, the sixth section concludes the study with some suggestions, policy recommendations and future research directions.
Literature Review and Hypothesis Development
Ownership concentration has been gaining much more attention as one of the important corporate governance issues in the emerging market economies from the corporate practitioners, financial analysts and scholars for the last couple of decades. So far as the developed countries are concerned, as per the study by Porta et al. (1999), in 27 richest countries in the world, about 64% of large firms have controlling shareholders where control is often found to be concentrated within a family. The concerns relating to large shareholders and their influential role in the governance and internal control mechanism in widely held firms are much more discussed and analysed in the United States and the United Kingdom (Franks & Mayer, 1997; Hill & Snell, 1988; Leech & Leahy, 1991).
According to a landmark study of Berle and Means (1932), the firms in the United States that ownership of capital is diffused among small shareholders and control is more concentrated in the hands of managers tend to have a low level of performance. On the other side, when the shares of a publicly-traded company are highly concentrated to a few hands it provides them sufficient power to guide and administer the management functions and decisions resulting in better firm performance (Berle & Means, 1932). This is formally termed as efficient monitoring hypothesis. Shleifer and Vishny (1986) and Friend and Lang (1988) also in consistence with this hypothesis, show the significant role played by large shareholders showing how the price of the firms’ shares increases as the proportion of shares held by these large shareholders rises. Wruck (1989) reports that private sales of blocks of shares associated with increasing concentration have a positive effect, although one that is non-monotonic on abnormal market returns. Coming to the studies of the present decade, Gaur et al. (2015) in a study on the listed firms of the New Zealand Stock Exchange from 2004 to 2007 also approves the role of large owners and show how the lack of ownership concentration leads to increased agency problems resulting into underperformance of such firms. Again, Al-Saidi and Ai-Shammari (2015) endorse the monitoring role of concentrated shareholders for Kuwaiti firms in a more specific way showing, not all concentration by large shareholders but only the government and individuals (families) ownership categories are better at monitoring and influencing performance. In another study, Najjar (2016) again corroborates a positive impact of concentrated shareholding on the value of Jordanian firms. Most recently, Yasser and Mamun (2017) applying Hirschman–Herfindahl index to represent ownership concentration approves the monitoring role of controlling owners and their positive contribution towards market-based performance and also economic profit of firms in Pakistan.
However, concentrated ownership may also give rise to a conflict of interests between minority and large shareholders (Shleifer & Vishny, 1997) and worsen performance as the expropriation hypothesis proposes (Porta et al., 1999). According to this, the large shareholders are supposed to exploit the minority shareholders (Burkart & Panunzi, 2006) and may also potentially act against the interests of the minority shareholders through engaging in value-reducing activities while pursuing activities those diverge from value maximization objective of the firm (Fama & Jensen, 1983). Fama and Jensen (1983) also argue that highly concentrated shareholding could raise firms’ cost of capital due to decreased market liquidity which may further lead to lower firm value. Morck et al. (1988) again highlight an entrenchment effect of ownership concentration which subsequently leads to lower firm performance.
The ownership concentration has also been the central focal point of McConnell and Servaes (1990). In this study, the corporate value is tried to be correlated with block-holding and insider shareholding. The study finds a strong curvilinear relation between Tobin’* Q and the fraction of shares owned by corporate insiders but no significant relationship could be documented between block-holder ownership and corporate value. The evidence of this study can be aligned with the observation of Demsetz (1983). Again, one of the important studies of the twenty-first century by Earle et al. (2005) using panel data for firms listed on the Budapest Stock Exchange, where ownership tends to be highly concentrated and frequently involves multiple blocks, suggests that the marginal costs of concentration may outweigh the benefits when the increased concentration involves ‘too many cooks’. Similarly, Kuznetsov and Muravyev (2001) in a study on Russian non-financial private enterprises show how the benefits of ownership concentration in the form of improved efficiency and productivity to not accrue to minority shareholders due to expropriation by large shareholders. Studies of Morck and Yeung (2003) and Roe (2004) also approve the prevalence of expropriation and the conflict of interest between minority and large shareholders in corporations with separated ownership and control. Again, contrary to the monitoring hypothesis, the study of Alipour (2013) on the companies listed in Tehran Stock Exchange endorses diffused ownership structure for higher firm performance. More recently, Hamid et al. (2016) in context of Malaysian firms also accept the idea of expropriation of minority shareholders and show how an independent audit committee would help reduce the tunnelling and propping activities in a company.
Moreover, there are a handful of empirical evidences that endorse a non-linear effect of large ownership and financial performance of firms. To start with, Miguel et al. (2004) in context of Spain establishes an inverted U-shaped relationship between ownership concentration and firm value. The study suggests that the value of Spanish firms increases at a low level of concentration due to active monitoring effect and decreases at a higher level of concentration as a consequence of minority shareholders’ expropriation. Latter on studies on different country perspectives like Vintila et al. (2014) in context of Romania, Ma and Tian (2014) in context of China, also approve the non-linear relationship between ownership concentration and firm value.
In India, Kumar and Singh (2013) focuses on the role of promoters on corporate performance and showed how ownership control by promoters below a certain threshold (40%) causes the entrenchment effect to be more pronounced and results in underperformance by firms. Quite similarly, Altaf and Shah (2018) also emphasize the effect of promoters’ ownership (as a measure of concentration), that is, percentage of common stock held by promoters and establishes an inverted U-shaped relationship between ownership concentration and firm performance.
The present study finds both the studies as worthy and highly significant to the development of the existing set of literature in the Indian context. However, it is also noteworthy to mention that where most of the previous studies including Kumar and Singh (2013) and Altaf and Shah (2018) have measured ownership concentration either by accumulating the largest five shareholdings or by simple considering the stock hold by promoters, this study following Selarka (2005), Vintila et al. (2014) and Brendea (2014) sets a threshold of 5% shareholding for considering a promoter as large. The former approach may include a shareholder having a very insignificant proportion of ownership and may become irrelevant and make no sense for an investigation.
Thus, it is found that the studies on the ownership-performance relationship in context of different countries across the world produce both linear as well as non-linear relationships. The evidence on non-linearity is very limited due to marginal research efforts undertaken especially in India towards this direction.
In this premise, the present study attempts to place itself among the much-selected research series in India by sensibly assuming a non-linear relationship between the variables and accordingly frames the following hypothesis:
H1: The relationship between large ownership and enterprise value is non-linear.
Research Methodology
Data
The study uses a set of panel data consisting of 112 manufacturing firms listed in the BSE 200 index of India for the period of 2011 to 2018. The data are collected from financial databases, namely Prowess and Capitaline Plus developed by Centre for Monitoring Indian Economy Pvt Ltd and Capital Market Publishers Pvt Ltd respectively. Further, the study also uses annual reports of the sample firms for different financial years. The study sets a range of x̅ ± 3σ (where x̅ and σ stand for the sample mean and standard deviation of each variable respectively) to eliminate the outliers from the panel data set to avoid distortion in results.
Description of Variables
Dependent Variable
Enterprise Value (ENT_VALUE)
It is the ratio between enterprise value and net sales of a firm. The enterprise value is measured by summing up the market capitalization and the net debt of a firm. It demonstrates the ability of a firm to generate value from a unit of its yearly sales and represents the value of a company’* core business operations that is available to all the investors, that is, equity and debt holders. Besides, the ratio is considered to be more realistic as it takes into account both, market capitalization and the amount of debt of a firm that needs to be paid back at a future date (Kakaria, 2010). Following Lie and Lie (2002), this study also considers this variable to represent the value of Indian manufacturing firms.
Independent and Control Variables
Large Ownership (LOWN)
The study considers a promoter who holds at least 5% ownership of a particular firm as a large owner. The variable LOWN is calculated by taking the total value of promoters’ ownership with at least 5% of stake in a particular firm for a particular year. Moreover, for the purpose of testing the non-linear relationship, the study, following Miguel et al. (2004) and Vintila et al. (2014), considers the squared term of this variable denoted by LOWN-Sq.
To control the effect of other possible determinants of firm value, the study introduces the following control variables:
Age of Firm (AGE)
The study simply uses the year of establishment to individually determine the age of the sample firms. Age is argued to have high significance towards the managerial effectiveness and abilities, performance, valuation and other dimensions in a firm (Kumar & Singh, 2013; Manna et al., 2016, Pareek et al., 2019; Thornhill & Amit, 2003). Generally, older firms are expected to have high value-generating ability due to accumulated experience and managerial knowledge but they also suffer from lack of adaptability to environmental changes (Thornhill & Amit, 2003). On the other hand, the younger firms suffer from lack of experience and managerial abilities but sometimes grow faster with increasing intangible assets (Black et al., 2006) which leads them to increased firm value.
Liquidity (LQDT)
It represents the ability of a firm to meet its day-to-day expenditures. It is measured by taking the ratio between quick assets (such as cash and bank balances, short-term marketable securities and debtors/receivables) and current liabilities. This ratio provides a more stringent assessment of a firm’* ability to pay its current liabilities. The liquidity position of a firm also determines its efficiency in operation and thereby market valuation (Marsha & Murtaqi, 2017).
Size of Firm (SIZE)
It is calculated by taking the natural logarithm values of total assets. It is considered as an important determinant of firm performance and valuation as it brings economies of scale, enables diversification (Berger & di Patti, 2006) and also represents high productive capacity and resource accumulation by firms.
Financial Leverage (FLR)
It is the ratio between debt and equity capital. It represents the capital structure of a firm. Capital structure is adequately studied and proved to be an important determinant of financial performance (Myers, 1977; Pandey & Sahu, 2017; Pandey & Sahu, 2019b; Zeitun & Tian, 2007).
Statistical and Econometric Tests
The study firstly applies panel data analysis which basically involves selection and application of best fit model among ordinary least square (OLS) model, fixed effect model (FEM) and random effect model (REM) through the estimation of restricted F-test, Lagrange multiplier test and Hausman test. Besides, the study also introduces diagnostic tests such as multicollinearity and heteroskedasticity to ensure robustness of results. The study frames the following regression model to represent the relationship among the variables:

ENT_VALUE it denotes the enterprise value of ith firm at time t. α depicts the constant term. γ1 to γ5 denote the coefficients of the independent and firm-specific control variables. εit represents the error term.
Furthermore, the study also attempts to cover the dynamic nature of the ownership-performance relationship and bias caused by potential endogeneity of the explanatory variables. In this direction, the study introduces Arellano and Bond (1991) dynamic panel estimation technique that determines the joint effects of the independent variables on the dependent variable while controlling for potential bias due to endogeneity of the independent variables including the lagged dependent variable.
The dynamic panel data model is mostly preferred when the number of cross-section units is larger than that of time series units, as in the present case. This is because, the estimation methods do not require larger time periods to obtain consistent parameter estimates (Mishra, 2008). The dynamic panel data regression model considers lagged value of dependent variable as one of the independent variables with the supposition that, the lagged dependent variable is potentially correlated with the random disturbance term of the model and taking this variable in the model cover-up the dynamic effects (Altaf & Shah, 2018; Wintoki et al., 2012). Notably, in such a situation when the lagged dependent variable is likely to be correlated with the error term of the model, the static panel data models such as OLS and FEM become biased and thereby produce inconsistent results as these models ignore unobserved time-variant effects and the endogeneity of dependent variable.
Therefore, following the previous literature we also take one year lagged ENT_VALUE as one of the independent variables to cover-up the dynamism of relationship and to take into account the effect of some unobservable historical factors on the current dependent variable (Wooldridge, 2009).
Therefore, the study applies the Arellano and Bond (1991) dynamic panel model under the Generalised Method of Moments (GMM) framework. Under the GMM framework, the study can control the potential bias due to endogeneity of independent variables by taking one year lagged value of the lagged dependent variable and other independent variables as instruments (Basant & Mishra, 2013). Additionally, the study introduces the Arellano–Bond test for autocorrelation and Sargan test (1958) of over-identification to test autocorrelation and validity of the instruments used in the model respectively.
Notably, there are two versions of the Arellano–Bond estimator, that is, one- and two-step estimator. The asymptotic standard errors of one-step estimator are unbiased and more reliable to draw inferences on the individual coefficients but at the same time, under this estimation, the Sargan test over-rejects the null hypothesis of over-identification restriction in the presence of heteroskedasticity. Moreover, the robust-standard error under one-step estimation can largely control the problem of heteroskedasticity but it cannot produce the Sargan statistic. Therefore, we execute both the estimations wherein we consider the individual coefficients of one-step estimation with robust-standard error to draw inferences and the statistics of two-step estimation such as Sargan statistic and Wald chi-square (χ2) statistic to check the over-identification restriction and overall significance of the model. In nutshell, recognizing the dynamism of the relationship and the issue of endogeneity we extend our analysis from static approach to dynamic approach which ultimately leads us to most robust estimates and thereby strong inferences.
Data Analysis and Findings
Summary Statistics
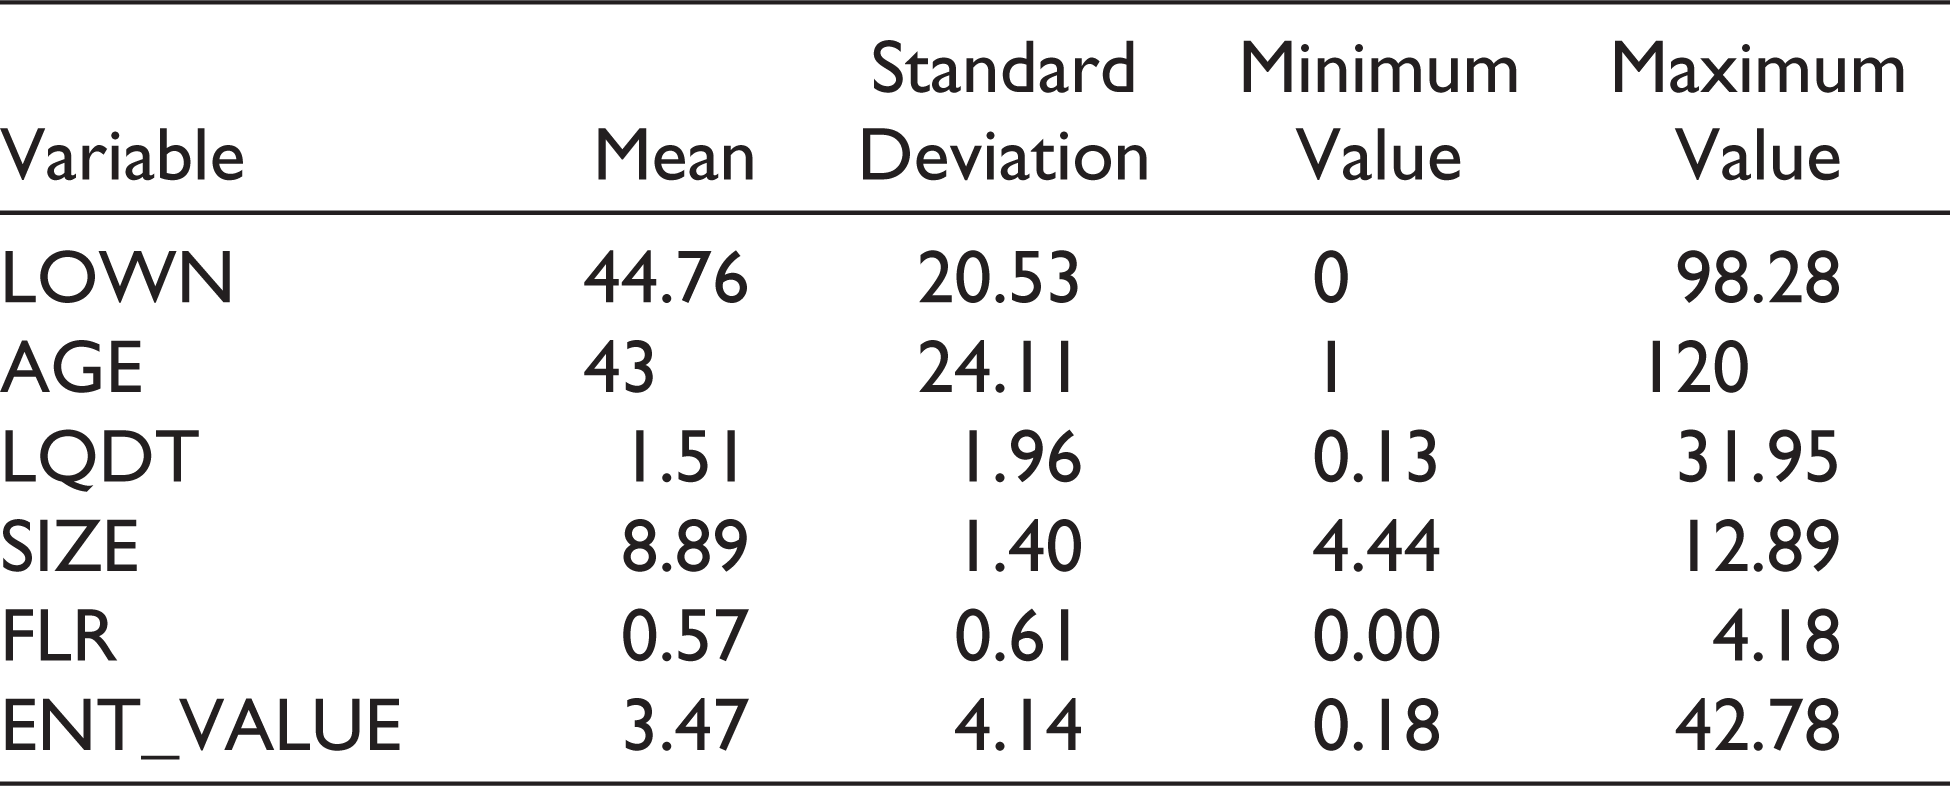
Table 1 presents the basic descriptive statistics of the variables considered in the study. Starting from the ownership pattern of the sample firms, it is observed that the mean value of the variable LOWN which represents the proportion of large ownership in a particular firm for a particular year is 44.76. The maximum value of LOWN is found to be 98.28. These indicate the dominance of large promoters in the ownership of Indian manufacturing firms. Regarding the value-generating ability, the average value of ENT_VALUE is found to be 3.47 which implies that, on an average, one unit of sales is generating more than three units of value in Indian manufacturing firms.
Summary Statistics
Diagnostic Tests
The existence of multicollinearity property among the variables can lead to erroneous results and thereby spurious conclusions. So, it is highly useful to check and detect the existence of such data property. To test the presence of multicollinearity the study estimates pair-wise correlation matrix and variance inflation factor (VIF). From Table 2, it is evident that the correlation coefficients for the variables are very low and even insignificant in many cases. Regarding VIF, there is no formally prescribed criterion for determining the bottom line of the tolerance value. However, there is a high consensus among statisticians that a tolerance value less than 0.1 or VIF greater than 10 roughly indicates significant multicollinearity. According to Klein (1962) if VIF is greater than 1/(1–R2) or a tolerance value is less than (1–R2) than it indicates statistically significant multicollinearity. The maximum VIF value of 1.20 confirms the non-existence of multicollinearity property among the variables (Table 2). Besides, regression models assume that the modelling errors or error terms are uncorrelated and uniform and the variance of such error terms is constant, which fits under a condition of Homoscedasticity. Now, when the error terms do not have constant variance, they are said to be heteroskedastic and the existence of this problem is a major concern in the application of regression analysis as it can invalidate statistical tests of significance. Hence, to test the existence of heteroskedasticity problem, the study estimates (Table 3) Breusch–Pagan/Cook–Weisberg test and Information Matrix test (White, 1980). As both the tests suggest the existence of heteroskedasticity problem therefore to control the adverse effect of this problem the study uses robust-standard errors (White, 1980) while computing the individual coefficients through the regression models.
Static Panel Data Analysis
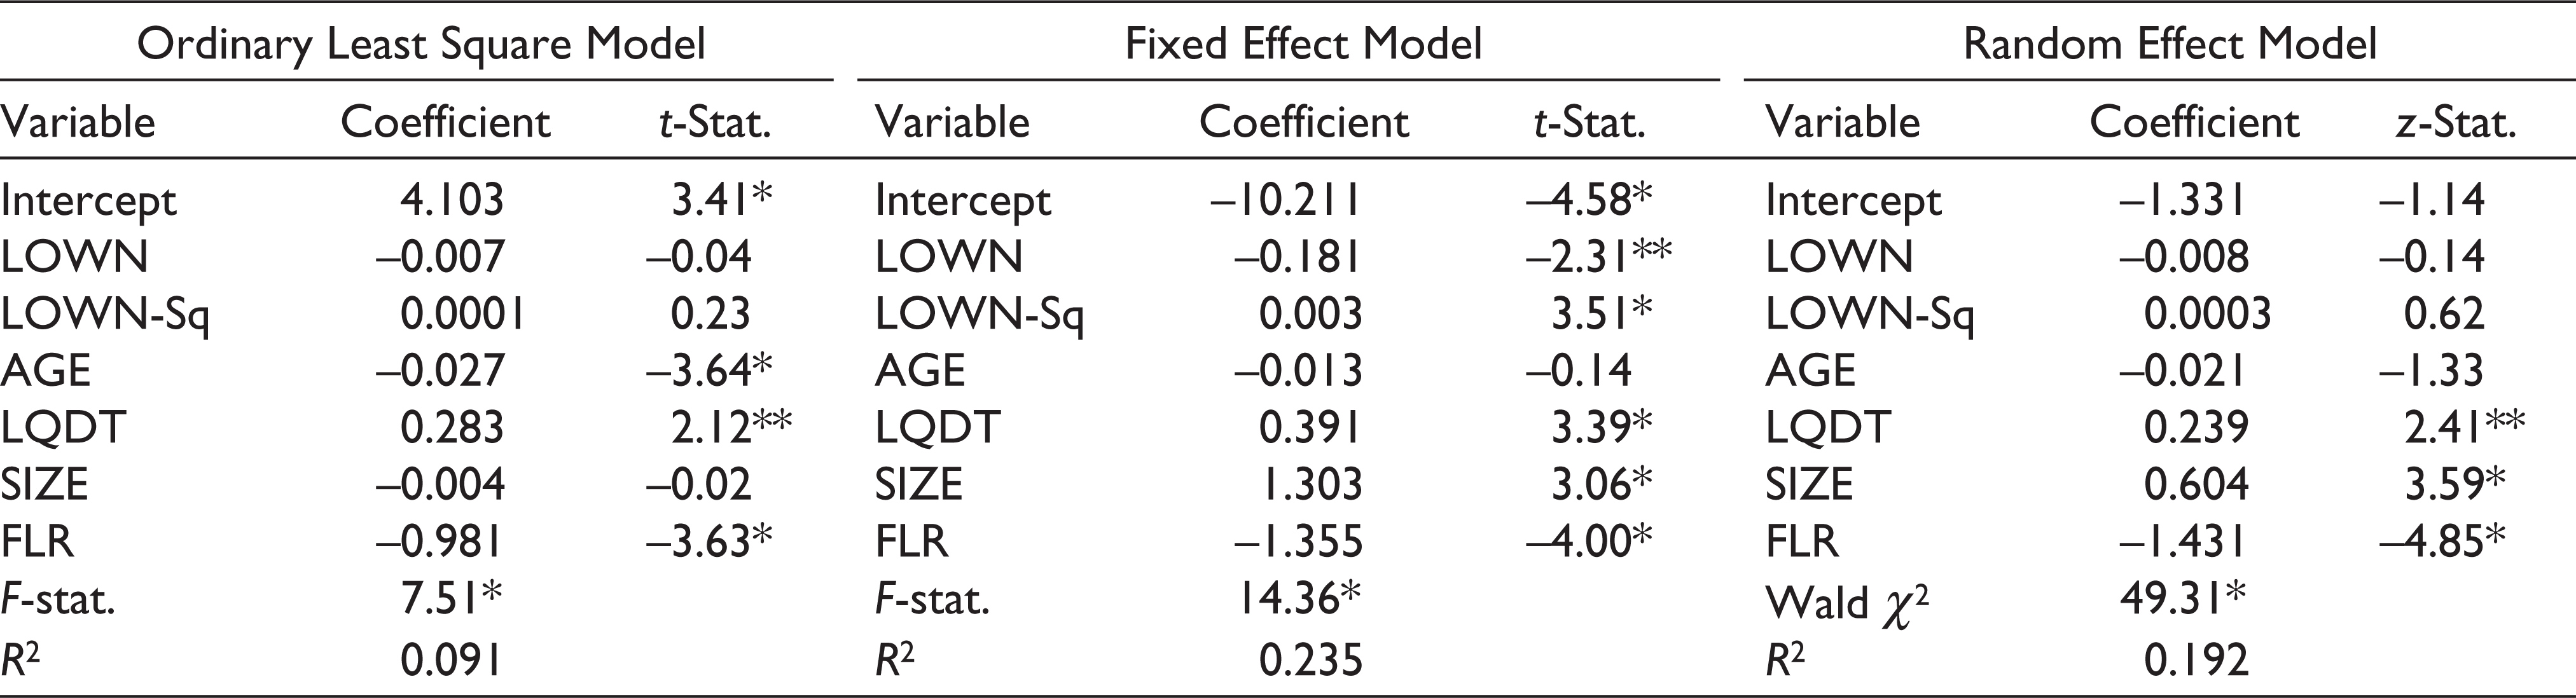
Now the study proceeds to estimate the static panel data regressions under which it estimates OLS model, FEM and REM. Table 4 shows the results of three regression analyses taking ENT_VALUE as dependent variable. The F-statistic of OLS and FEM and the Wald χ2 statistic of REM are found to be significant at 1% level of significance and therefore initially all three models are found to be fit for the study. However, each of the three regression models has different underlying assumptions.
The OLS model assumes the intercept as well as the slope coefficients to be the same for all the sample firms. The FEM allows the intercepts to vary across the firms to incorporate special characteristics of the cross-sectional units. Finally, the REM assumes the intercept of a particular firm to be a random drawing from a large population which varies non-systematically with a constant mean value. To choose between the OLS and FEM, the study considers the restricted F-test (Table 5) which uses the following test statistic:
Pair-wise Correlation Matrix with Variance Inflation Factor

Tests of Heteroskedasticity

Three Regression Results (Dependent Variable: ENT_VALUE)

where
The restricted F-test statistic is found to be significant at 1% level [F (81, 507) = 10.31]. So the concerned null hypothesis of no difference in intercepts is rejected and the study finds FEM as fit. To choose between OLS and REM the study introduces Breusch–Pagan Lagrange multiplier test as suggested by Breusch and Pagan (1980). Table 5 clearly shows that the null hypothesis of no variance in intercepts is rejected [χ2 (1) = 323.58] and REM is found to be the better fit model. Now, finally, the study estimates the Hausman test as suggested by Hausman (1978) to have a robust selection between FEM and REM. The Hausman test statistic [χ2 (5) = 50.51] is again found to be highly significant resulting in the rejection of the null hypothesis of non-systematic difference in coefficients. In this way, finally, the FEM is found to be the best fit model for the regression analysis.
Model Selection

Dynamic Panel Data Estimation
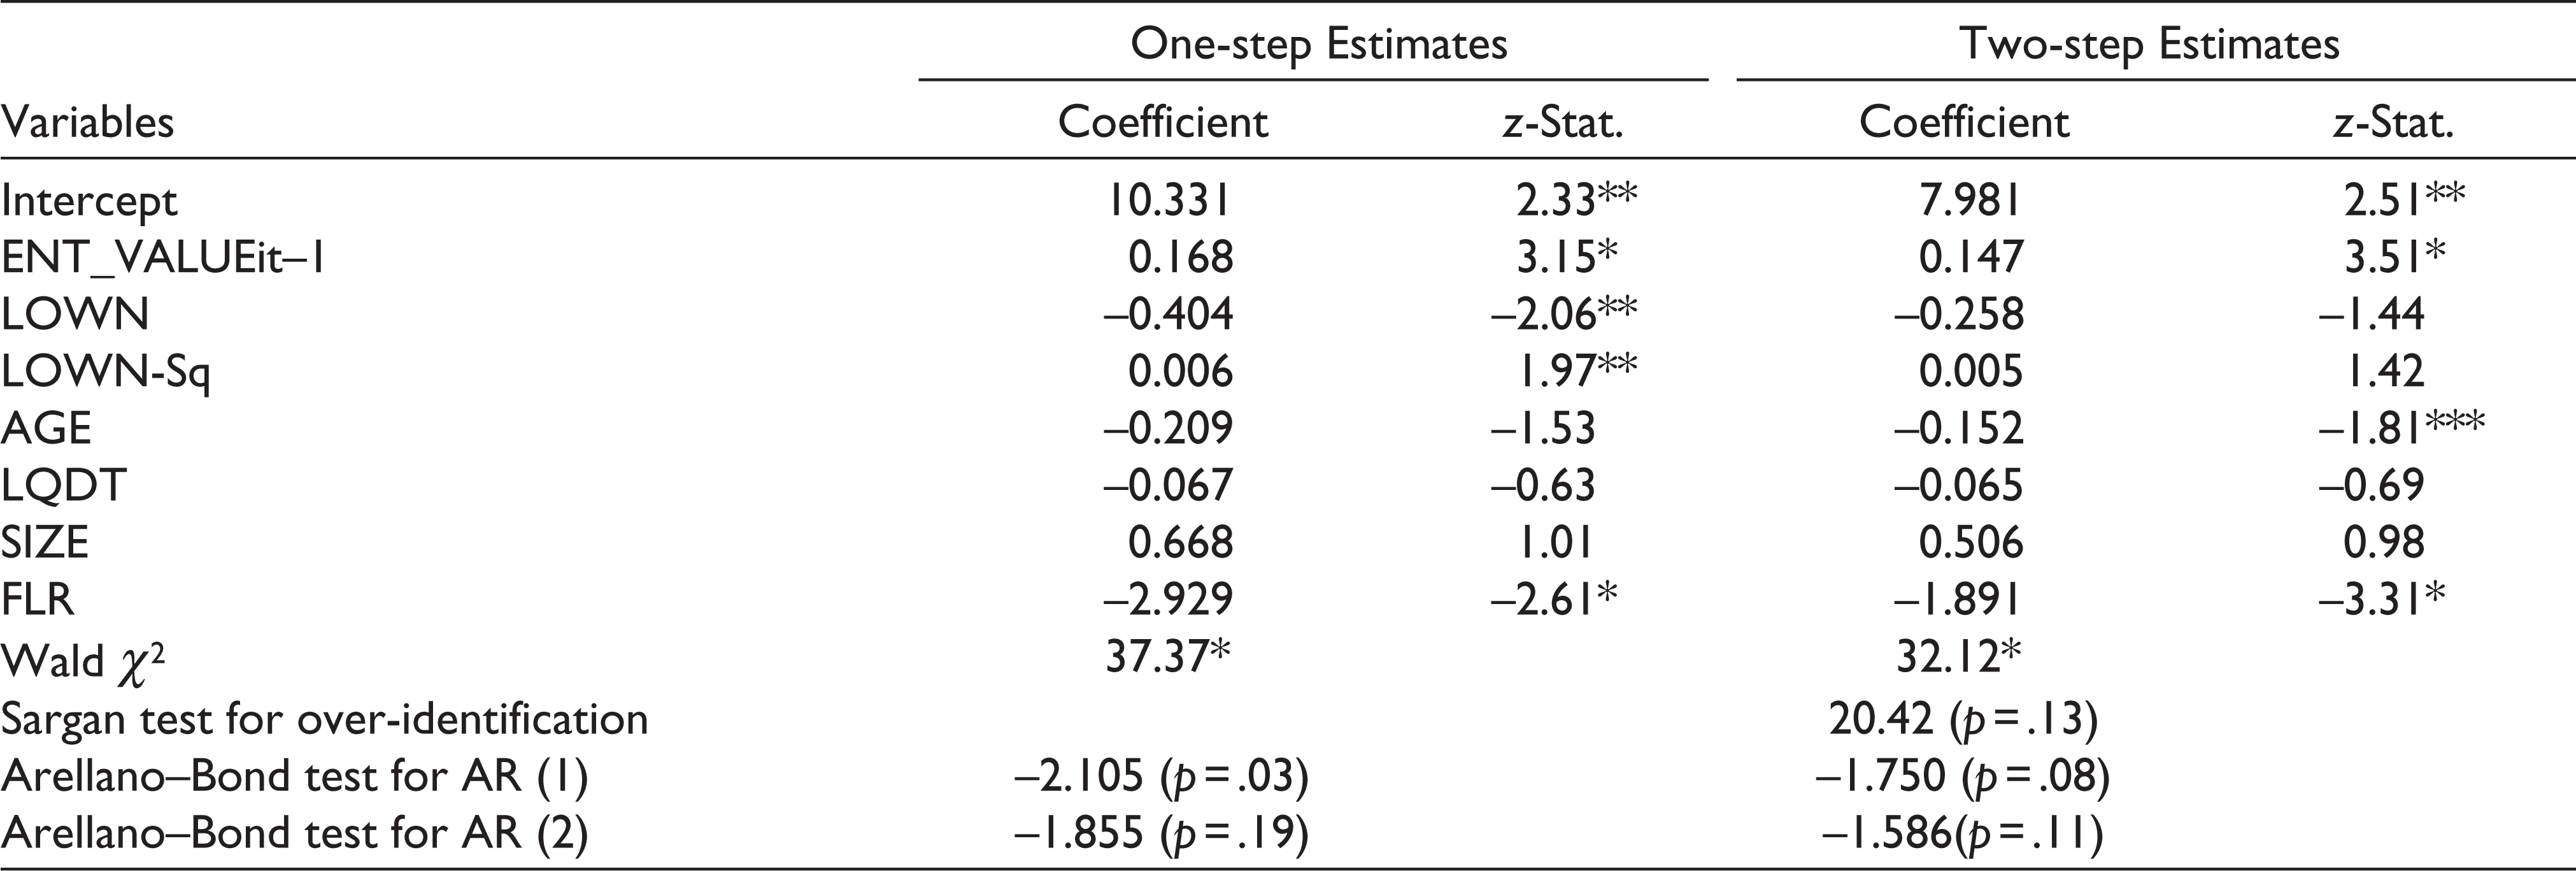
Considering the fact that, the FEM model under static panel data analysis fails to encounter the endogeneity issue and consequently the estimates under this framework cannot be robust. Now, aiming at considering the dynamism nature of the relationship and dismantling the bias caused by potential endogeneity of the independent variables including the lagged dependent variable the study introduces the Arellano and Bond (1991) dynamic panel data model (Table 6). The model estimation also includes the test of autocorrelation problem and the validity of the instruments used. The study finds the Sargan test for over-identification statistic insignificant [20.42(p = .13)]. It suggests that estimation models do not suffer from the problem of over-identification restrictions. The underlying null hypothesis of the test cannot be rejected which means the instrument used in the estimations are valid, implying that these instruments are not correlated with the error term (Mahakud & Misra, 2009).
Besides, the models are found to be free from the second-order autocorrelation problem as the result of Arellano–Bond test for AR (2) is found insignificant. In the system-GMM framework, we can well proceed with this condition (Kathavate & Mallik, 2012). Again, the study finds highly significant Wald χ2 statistics for both the versions of dynamic panel estimation which confirm that both the models are statistically significant. We already mentioned that the z-statistics of regression coefficients produced by step-one are based on robust-standard error and hence the study sensibly considers these coefficients to draw meaningful inferences.
Findings of the Study
From the overall results of the study, it can be documented that the Indian manufacturing firms are dominated by giant promoters holding a substantial fraction of ownership which allow them to take an active part in the management of affairs of these firms. Regarding the effect of these large shareholders on the value of Indian manufacturing firms measured by ENT_VALUE, both the panel data estimation techniques adopted in the study suggest a non-linear effect. In the FEM model under static panel data analysis, the coefficients of LOWN are found to be negative (–0.181) and the same for the variable LOWN-Sq is found to be positive (0.003) with 5% and 1% level of significance respectively. The one-step estimation of the dynamic panel data model under the system-GMM framework also reports similar findings regarding the relationship between these variables. The results of one-step estimation presented in Table 6 also produce a negative coefficient for LOWN (–0.404) and positive coefficient (0.006) for the squared term of the variable.
Thus, the findings of the panel data estimation techniques are found to be consistent with H1 that there is a non-linear relationship between large ownership and the enterprise value of Indian manufacturing firms. The study results confirm that initially at a lower level of promoter ownership the effect on enterprise value is negative and the higher level the effect gets shifted to positive which implies a U-shaped relationship between large ownership and enterprise value in Indian manufacturing firms. Now, we must determine the exact threshold of LOWN where the effect gets shifted from negative to positive and for the purpose, the study applies the following commonly used equation:
Results of Arellano–Bond Dynamic Panel Data Model
z-statistics in one-step estimation are based on robust-standard error to control for heteroskedasticity and autocorrelation.
The threshold of the independent variable = –(β1/2β2), where β1 and β2 are the coefficients of the respective independent variable and the squared term of the independent variable respectively.
Applying this method in the FEM and one-step estimation of dynamic panel data analysis the threshold levels of LOWN are determined and presented in Table 7.
Determination of Threshold Level of LOWN



It is found that the FEM model suggests a threshold of 30.17% ownership for the large owners to exert a favourable impact on the value of Indian manufacturing firms. Similarly, the one-step estimation of dynamic panel data model suggests a threshold of 33.67% for large ownership. Considering, the robust findings of the dynamic model it is therefore inferred that, promoters in Indian manufacturing firms exert an unfavourable impact on the financial performance until their ownership in the firms goes up to around 34%. The non-linear relationship including the threshold levels of LOWN is diagrammatically presented in Figures 1 and 2.
Regarding the control variables, the FEM under static panel data analysis suggests liquidity, age and leverage ratio of firms to have a significant impact on financial performance. However, the dynamic panel data estimation only suggests leverage ratio as an influencing factor to enterprise value of the sampled firms. Surprisingly, the relationship between leverage and financial performance under both the estimations is found to be significantly negative which indeed go in contrast to most of the extant literature in corporate finance and governance, as debt is basically perceived as a disciplinary mechanism towards controlling managerial self-servicing behaviour and thereby reducing owners–managers conflicts of interests, that is, vertical agency problem. However, in case of Indian manufacturing firms, the views of Myers (1977), Jensen (1986) and Stulz (1990) seem to be more valid, that is, where debt besides restricting managerial opportunism, creates over-restricted investment scenario in firms which ultimately leads to poor financial performance. Moreover, influential creditors sometimes impose over-restrictions on the companies and prevent the distribution of earnings to the shareholders. They also many times impose restrictive conditions on the loans by increasing the interest rates or collaterals on loans. These restrictions compel firms to mostly focus on paying the debt burden without concerning to higher earnings.
Conclusion and Policy Recommendations
This study attempts to testify the impact of large ownership on the enterprise value of Indian manufacturing firms taking a sample of 112 manufacturing firms from the BSE 200 index of India. The study estimates static and dynamic panel data analysis and finds the large owners, that is promoters having at least 5% ownership have initially negative impact up to a threshold of around 34% of ownership and thereafter a positive impact on the enterprise value of Indian manufacturing firms. Therefore, the study establishes a U-shaped relationship between large ownership and the enterprise value of Indian manufacturing firms.
The findings of this present study highly support the previously produced evidence by Kumar and Singh (2013) which suggests that at a lower level of concentration the efforts of large owners towards developing an internal governance mechanism to discipline managerial selfish behaviour remain marginal because of poorly aligned interests with the firm but at a higher level of ownership their interest get better aligned with the firm as a whole and naturally efficient monitoring effect comes into play. Besides, the negative impact of large ownership on enterprise value below a threshold of around 34% can be more sensibly justified by the fact that this may be a consequence of the joint effect of misaligned interest and minority shareholders’ expropriation.
The findings of the present study also go in line with the study like Altaf and Shah (2018) regarding the non-linear effect of large ownership on the value of Indian manufacturing firms. However, looking at the sequence of two effects we see that where Altaf and Shah (2018) suggest expropriation effect to starts only at a higher level of concentration, the present study evidences the expropriation effect to play at a lower level of concentration.
Based on the evidence of this study, the Indian manufacturing firms are suggested not to entirely rely on the role of promoters as an internal disciplinary mechanism to ensure restrained managerial opportunism and subsequently recommends exercising and promoting external regulatory and institutional specificities as a supplementary disciplining force to ensure better corporate governance, protection of minority shareholders interest and improved firms valuation as previously suggested by Kumar and Singh (2013), Hamid et al. (2016) and Altaf and Shah (2018).
To conclude, the researchers acknowledge the fact that, the findings and inferences of this study are valid only for Indian manufacturing firms and for the considered period. Moreover, the study, as future research directions, sensibly recommends a sector-specific inquiry and even a cross-country investigation to have a comparative outlook on the issue.
Footnotes
Declaration of Conflicting Interests
The authors declared no potential conflicts of interest with respect to the research, authorship and/or publication of this article.
Funding
The authors received no financial support for the research, authorship and/or publication of this article.