
Abstract
In 2018, India had 1.2 billion subscribers, and it was the second largest telecommunications market in the world. The industry had witnessed the emergence, ascendency, and dominance of private sector players during the last two decades. The telecom sector was characterized by a growing wireless user base and Internet subscriber base. The dwindling average revenue per user (ARPU) in the mobile telephony segment and the declining average cost to subscriber per GB of data were manifestations of the intense rivalry in the sector which had led to price wars among incumbent players. The Supreme Court of India’s judgement on Adjusted Gross Revenue (AGR) in October 2019 obligated the industry players to pay ₹1,470 billion as payment towards their licence fee and spectrum usage charges. Vodafone Idea and Bharti Airtel, two leading players, collectively owed 60% of the aforementioned liability. Declining revenue had already squeezed the profitability and liquidity of these companies. The AGR liability augmented their challenges.
Keywords
Introduction
On 24 October 2019, the Supreme Court of India in its order (UOI v. Association of Unified Telecom Service Providers of India etc., 2015) held the definition of Adjusted Gross Revenue (AGR) in the telecom licence agreement as valid. It brought finality to a 15-year long dispute between the telecom companies and Department of Telecommunications (DoT), Government of India. It entailed that the telecom companies would have to shell out ₹1,470 billion to clear their pending license fee and spectrum usage charges (SUC) dues. The mammoth AGR liability had accumulated over the years and had snowballed into an onerous amount.
The fixed license fee regime had paved the way for a revenue sharing mechanism under the New Telecom Policy, 1999. The revenue share of the telecom companies with DoT on account of license fee and SUC was contingent on the quantum of AGR. For years, the AGR definition had been a bone of contention between the industry players and the DoT. The tussle between the two stakeholders had witnessed many twists and turns with dissimilar outcomes in different dispute settlement forums. The AGR definition was thus of great interest and importance.
Vodafone Idea Limited, the largest telecom company in India by subscriber base, was clearly on a sticky wicket. It owed ₹530 billion to DoT by way of AGR liability. The company highlighted the adverse impact the AGR judgement had, and sought relief from the government, as the telecom sector was facing financial distress.
… Clearly this judgment has significantly damaging implications for India’s telecom industry, which is already reeling under huge financial stress and is left with only four operators. Significant investment of several billion dollars has been made in creating world class networks. Today’s order has huge impact on two private operators while most of the other impacted operators have exited the sector. We urgently request that the government engage on this matter in order to find ways to mitigate the financial stress for the industry. 1
Bharti Airtel Limited, the largest telecom company in India by revenue, was not comfortably placed either. It owed ₹356 billion to DoT by way of AGR liability. The press release issued by Airtel 2 echoed a similar sentiment.
Reliance Jio Infocomm Limited, the third largest player in the industry appeared unfettered. Its late entry in the telecom industry resulted in lower AGR liability and its robust financial position enabled it to clear the same.
Did the AGR dispute arise because of lack of clarity in policy or in license agreement? Or was it a case of industry players arguing the case for operational revenue vis-à-vis AGR, post-facto signing of the telecom license agreement? Which player, Vodafone Idea or Bharti Airtel was in a better position to come out of the woods? The government had to recover the AGR dues from the telecom companies, but at the same time, it could not allow the industry to crumble.
Adjusted Gross Revenue Issue
The Supreme Court of India Order, Dated 24 October 2019
The Supreme Court of India in its order (UOI v. Association of Unified Telecom Service Providers of India etc., 2015), dated 24 October 2019 held that telecom licence granted was a contract between the government and the licensee. The ‘broad, comprehensive and inclusive’ definition of gross revenue provided in the licence agreement was binding in the law. The definition of revenue as laid down under Indian Accounting Standard-9 was not applicable. The ‘doctrine of fairness and reasonableness’ could not be invoked (Assistant Excise Commissioner & Others v. Issac Peters & Others, 1994). The performance of the contract under migration package had required a licensee company to fulfil the obligations agreed upon, for the benefits availed (Bharti Cellular Limited v. UOI, 2010; Shyam Telelink Limited v. UOI, 2010). The ‘doctrine of unconscionable bargaining’ was not applicable in commercial contracts (S. K. Jain v. State of Haryana, 2009). The licensees should not question the validity of the licence, once they have availed the benefits (Cauvary Coffee Traders, Mangalore v. Hornor Resources (International) Company Limited, 2011; R. N. Gosain v. Yashpal Dhir, 1993).
The gross revenue definition under licence agreement included revenue from both licence and non-license activities. It explicitly included interest and dividend income even though it did not arise directly from licensed activities. Income from management consultancy services, non-refundable deposits against future discounts, excess of roaming charges over pass-through charges, loan talk time on prepaid accounts, and lease rent of telecom infrastructure should not be excluded. It was part of gross revenue for levy of licence fee.
Other incomes such as (a) gain on foreign exchange fluctuations, (b) gain on sale of investments and scrap, (c) excess of insurance claim over book value of assets, and (d) revenue under IP-1 registration under CUG licence were part of gross revenue, as they fall within the purview of ‘any other miscellaneous revenue’. Discounts, commissions, prepaid vouchers, goodwill waivers, and late fee waiver were part of gross revenue in view of definition of gross revenue, wherein no set-off for related items of expenses was allowed.
Fee demand prior to grant of spectrum was not part of gross revenue. Recovery of bad debts written off earlier and reversal of future liability provisions should not be added in gross revenue to avoid double taxation.
The Department of Telecommunications had raised the demands on telecom licensees in 2003 based on definition of gross revenue in the licence agreement. The telecom licensees had disputed the definition of gross revenue before the Telecom Disputes Settlement and Appellate Tribunal (TDSAT) once again, which was decided by the Supreme Court of India in 2011. The origination of AGR dispute and subsequent legal battle has been summarized in Exhibit 1.
The interest on delayed payment and payment of penalty on default was a contractual stipulation. It could be levied and compounded. The Supreme Court had observed:
… The objections which have been raised pertained to the definition of gross revenue for which the court held that they are part of revenue. Now, relying upon AS-9 standards, an attempt has been made by an indirect method for excluding items, which are expressly included in the definition of gross revenue. Objections are too tenuous, and, as a matter of fact, there was no scope to raise such objections in 2003 itself. (UOI v. Association of Unified Telecom Service Providers of India etc., 2015, para 188)
Accordingly, the appeals of the licensees were dismissed, and the appeal filed by the DOT was allowed by the Supreme Court of India.
Adjusted Gross Revenue Liability of Telecom Licensees
Bharti Airtel had shown DoT demands, that is, ₹97,794 million and ₹40,778 million as of 31 March 2019 and 31 March 2018, respectively, as claims against the company not acknowledged as debt under the head contingent liabilities.
The relevant extract of the disclosure on AGR dues made by the Bharti Airtel is as follows:
… The definition of AGR is sub-judice and under dispute since 2005 before the TDSAT. TDSAT had pronounced its judgment in 2015, quashed all demands raised by DoT and directed DoT to rework the demands basis the principles enunciated in its judgment. … In 2016, all the appeals were tagged together and Hon’ble Supreme Court has permitted DOT to raise demands with a direction not to enforce any demand till the final adjudication of the matter by Hon’ble Supreme Court. … The contingent liability includes such demand and interest thereto (excluding certain contentious matters, penalty and interest thereto) for the financial years for which demand have been received.
3
Vodafone Idea had shown DoT demands pertaining to AGR definition dispute, that is, ₹171,354 million and ₹107,710 million as of 31 March 2019 and 31 March 2018, respectively, as claims against the company not acknowledged as debt under the head contingent liabilities.
The telecom sector gross revenues had increased from ₹48.55 billion at the end of 31 March 2004 to ₹2,374.17 billion at the end of 31 December 2018. The liability of telecom companies on account of revenue share short paid had amounted to ₹1,470 billion to the Government of India, of which ₹926 billion was on account of licence fee and ₹551 billion on account of SUC. Interest on delayed payment of licence fee, penalty, and interest on penalty amounted to ₹430 billion, ₹110 billion, and ₹170 billion, respectively. 4 AGR liabilities of Indian telecom companies have been summarized in Table 1.5,6
AGR Liabilities of Indian Telecom Companies

Indian Telecom Industry
Competition Landscape
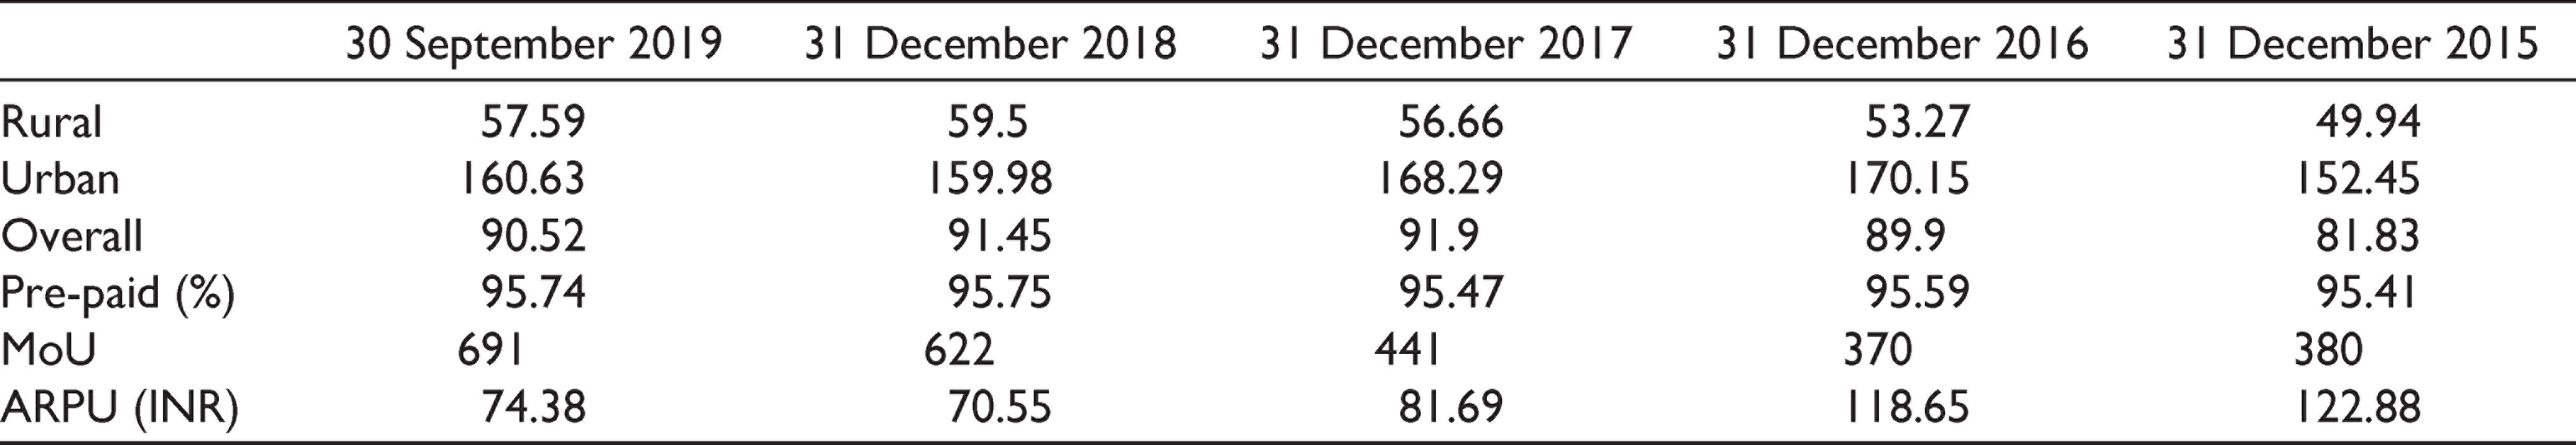
In 2018, India was the second largest telecom market in the world with 1.18 billion subscribers, it and accounted for 14.97% of world mobile cellular subscriptions vis-à-vis 21% in China. India had only 1.71% of world fixed broadband subscriptions in 2018 (Work Bank, 2010). The overall teledensity was 91.45 with urban teledensity of 159.98 and rural teledensity of 59.5, of them, 95.75% had prepaid connection. An average usage of 622 minutes per subscriber per month yielded an average revenue of ₹70.55. The average wireless data usage was 7.6 GB per month, at an average cost of ₹11.78 per GB. Only 46.13% of the population had access to Internet connection. The market size was humungous and the room for growth, especially in the data segment, was enormous. The service quality had improved substantially while there had been a significant decline in the cost to the subscriber during the last two decades.
The Indian telecom industry had become fiercely competitive. In 2019, there were eight telecom service providers. However, it was essentially a three-way contest for market share between Vodafone Idea, Reliance Jio Infocomm, and Bharti Airtel. They accounted for 88.6% of telecom market. The industry, with a focus on 5G technology, was expected to contribute to 8.2% of the India’s gross domestic product (GDP) by 2020. 7 The Indian telecom industry had witnessed consolidation as well as innovative disruption. A historical perspective of the Indian telecom sector is as at Exhibit 2.
At the end of financial year 2014–2015, there were 12 telecom operators in India. The top three players accounted for 57.3% of the 996.49 million subscribers. Details related to Telecom subscriber base in India during the period 2015–2019 are presented in Table 2.
Telecom Subscribers (Wireless + Wireline) Base in India (in million)

**Telenor merged with Bharti Airtel during QE June 2018.
***Reliance Jio Infocomm Ltd commenced operations during QE September 2016.
^Subscriber data not reported after March 2018.
#Merged with Reliance Com. During QE December 2017.
^^Stopped wireless commercial operations after QE March 2016.
##Telenor had 100% stake in Telewings. See
The Indian telecom industry witnessed consolidation and innovative disruption during this period.
Disruptive Innovation
In 2015, there were 331.66 million Internet subscribers in India with Internet teledensity of 26.19. The Indian consumer had to shell out ₹226.3 to use 1 GB wireless data. The average data usage per month was merely 0.41 GB. Teledensity in India for the period 2015–2019 is presented in Table 3a. Wireless data usage in India has been summarized in Table 3b.
Teledensity in India (wireless + wireline)
Wireless Data Usage in India

2016 was a watershed year in the history of Indian telecom. Reliance Jio Infocomm unveiled its wireless services. The pan-India launch of fourth-generation (4G) data services by Reliance Jio caused a major disruption in the voice telephony-dominant Indian telecom marketplace. Reliance Jio turned the market on its head.
The dual benefit of high-speed Internet services and low prices was a compelling value proposition for the Indian consumers. The number of Internet subscribers as well as Reliance Jio’s market share registered a sharp growth thereafter.
After 6 months of operations, Reliance Jio had 108.68 million subscribers on board and catapulted to become the fifth largest telecom player by subscriber base in the country by 31 March 2017. In 2018, Reliance Jio’s subscriber base increased to 186.56 million while revenue was ₹208.25 million. The jaw dropping growth continued in the FY 2018–2019, when Reliance Jio’s subscriber base and revenue grew by 64.41% and 89.74%, respectively. The operating margins were 15.24% and 22.23% in 2017–2018 and 2018–2019, respectively.
By 30 September 2019, 51.76% of the 687 million Internet subscribers in India used Reliance Jio’s network. The average cost per GB of wireless data had plummeted to ₹6.98 while the average wireless data usage per month had risen to 10.37 GB.
The entry and rise of Reliance Jio led to price wars among incumbent players. The quest to prevent customer churn and resultant aggressive pricing led to a decline in wireless data average revenue per user (ARPU) from ₹ 90.03 at the end of 2015 to ₹74 at the end of September 2019. The detrimental impact percolated to the voice telephony segment also. ARPU of ₹122.88 slid to ₹74.38.
Overall, the industry witnessed a decline in the gross revenue. The gross revenue had increased from ₹2,606.01 billion in 2015 to ₹2,795.91 in 2016. Telecom gross revenue data are summarized in Table 3c.
Indian Telecom Gross Revenue and User Fee Data.
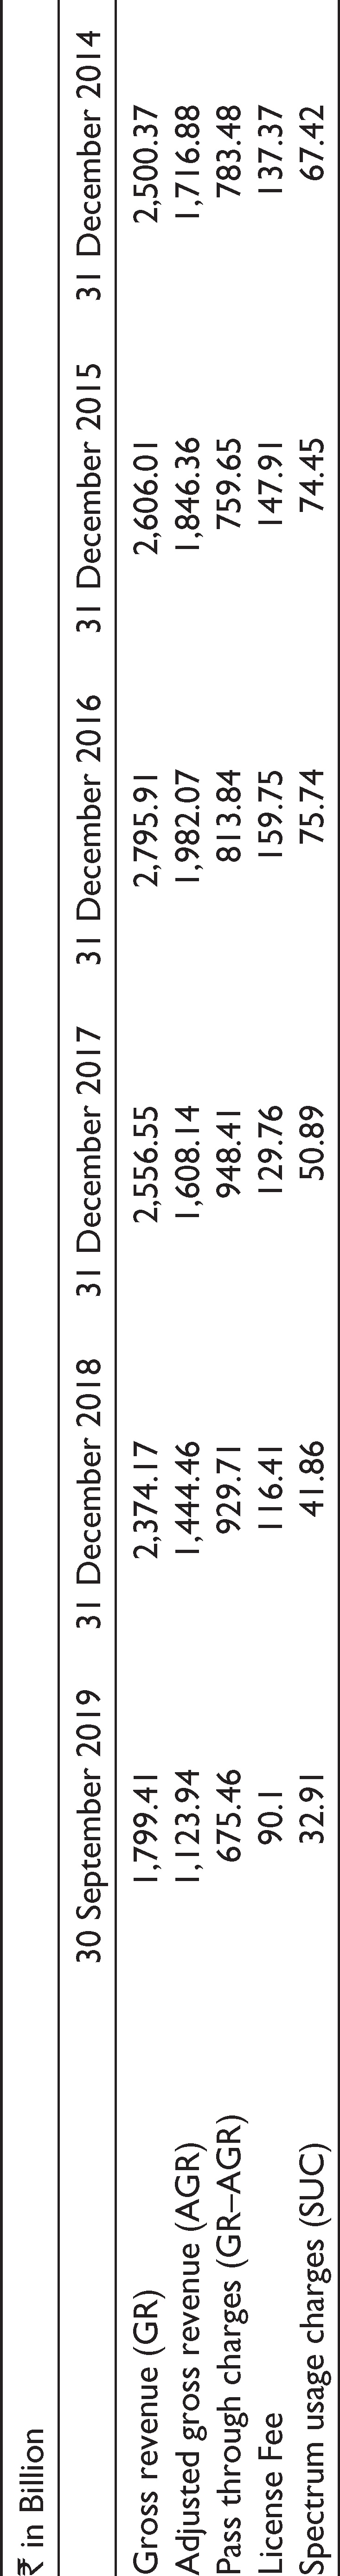
Thereafter, the gross revenue registered a year-on-year decline of 8.56% in 2017 and a decline of 7.13% in 2018. During the first three quarters of 2019, the gross revenue was ₹1799.41 billion.
Consolidation
Intense rivalry, entry of new players, and unsustainable debt led the small players in the industry to opt for alternative strategic choices. Some merged with the big players while others shut shop. A few of them went bankrupt. 8
In 2018, the industry witnessed further consolidation with two key mergers. Telenor merged with Airtel in May, 9 while Vodafone and Idea came together in August. 10
By end of June 2018, Reliance Jio had 215.26 million subscribers on board and was the fourth largest operator in the country. It marginally trailed Vodafone (222.97 million) and Idea (220.6 million) subscribers. Airtel had been the market leader for 15 consecutive years. 11 It retained the top slot, albeit for a very short while thereafter.
In August 2018, Vodafone and Idea merged to form the biggest telecom company in the country. With a combined subscriber base of 435.22 million subscribers as on 30 September 2018, the merged entity had toppled Airtel, the numero uno operator in India with 347.52 million subscribers. Nonetheless, Airtel’s revenue of ₹807.80 billion for the financial year 2018–2019 was 2.18× of the revenue of Vodafone Idea Limited.
Bharti Airtel Limited
Airtel grew steadily since its inception in 1995. Airtel was the largest telecommunications company in terms of revenue and second largest in terms of number of subscribers in India at the end of 31 March 2019. The promoters held 62.7% stake in Airtel. Airtel had managed a traffic of 11,733 billion MBs of mobile network and 2109.7 billion MBs of home network. It consolidated its manufacturing capital by having access to optical fibre network of 280,534 RKms, 181,079 mobile network towers, and 7 submarine cable systems. 12
Airtel had operations in 18 different countries across Asia and Africa which reached 24% of the world population. It employed 19,721 employees.
Airtel provided 2G, 3G, and 4G wireless services in India. Its market offerings also included fixed line and broadband services. Airtel had expanded its portfolio to offer direct-to-home (DTH), enterprise services, and payments bank. The wireless mobile services were the largest segment and contributed 46.86% to Airtel’s revenue, while landline and Internet services contributed 2.53% of the revenue. The contribution of tower infrastructure business towards revenue was 7.69%.
Airtel had 232.80 MHz spectrum in the 900 MHZ band, 250 MHz in the 2,100 MHz band, 536.10 MHz in the 1,800 MHz band, and 570 MHz in the 2,300 MHz band. 13
Airtel’s stated objectives were to grow market share, grow revenue, and drive down cost. The company strived to achieve the first two objectives through the mergers and acquisitions. Firefly, the 50:50 joint venture between Airtel and Vodafone India had deployed Wi-Fi networks in India. 14 In 2018, Airtel acquired Telenor. The acquisition augmented Airtel’s subscriber base by 37.98 million and gave it access to an additional 43.4 MHz spectrum.
The merger of consumer mobile businesses of Tata Teleservices (Maharashtra) and Tata Teleservices with Bharti Airtel and Bharti Hexacom had pending regulatory approval. The proposed merger will give Airtel an access to 178.5 MHz spectrum in the 850MHz, 1,800MHz, and 2,100MHz bands.
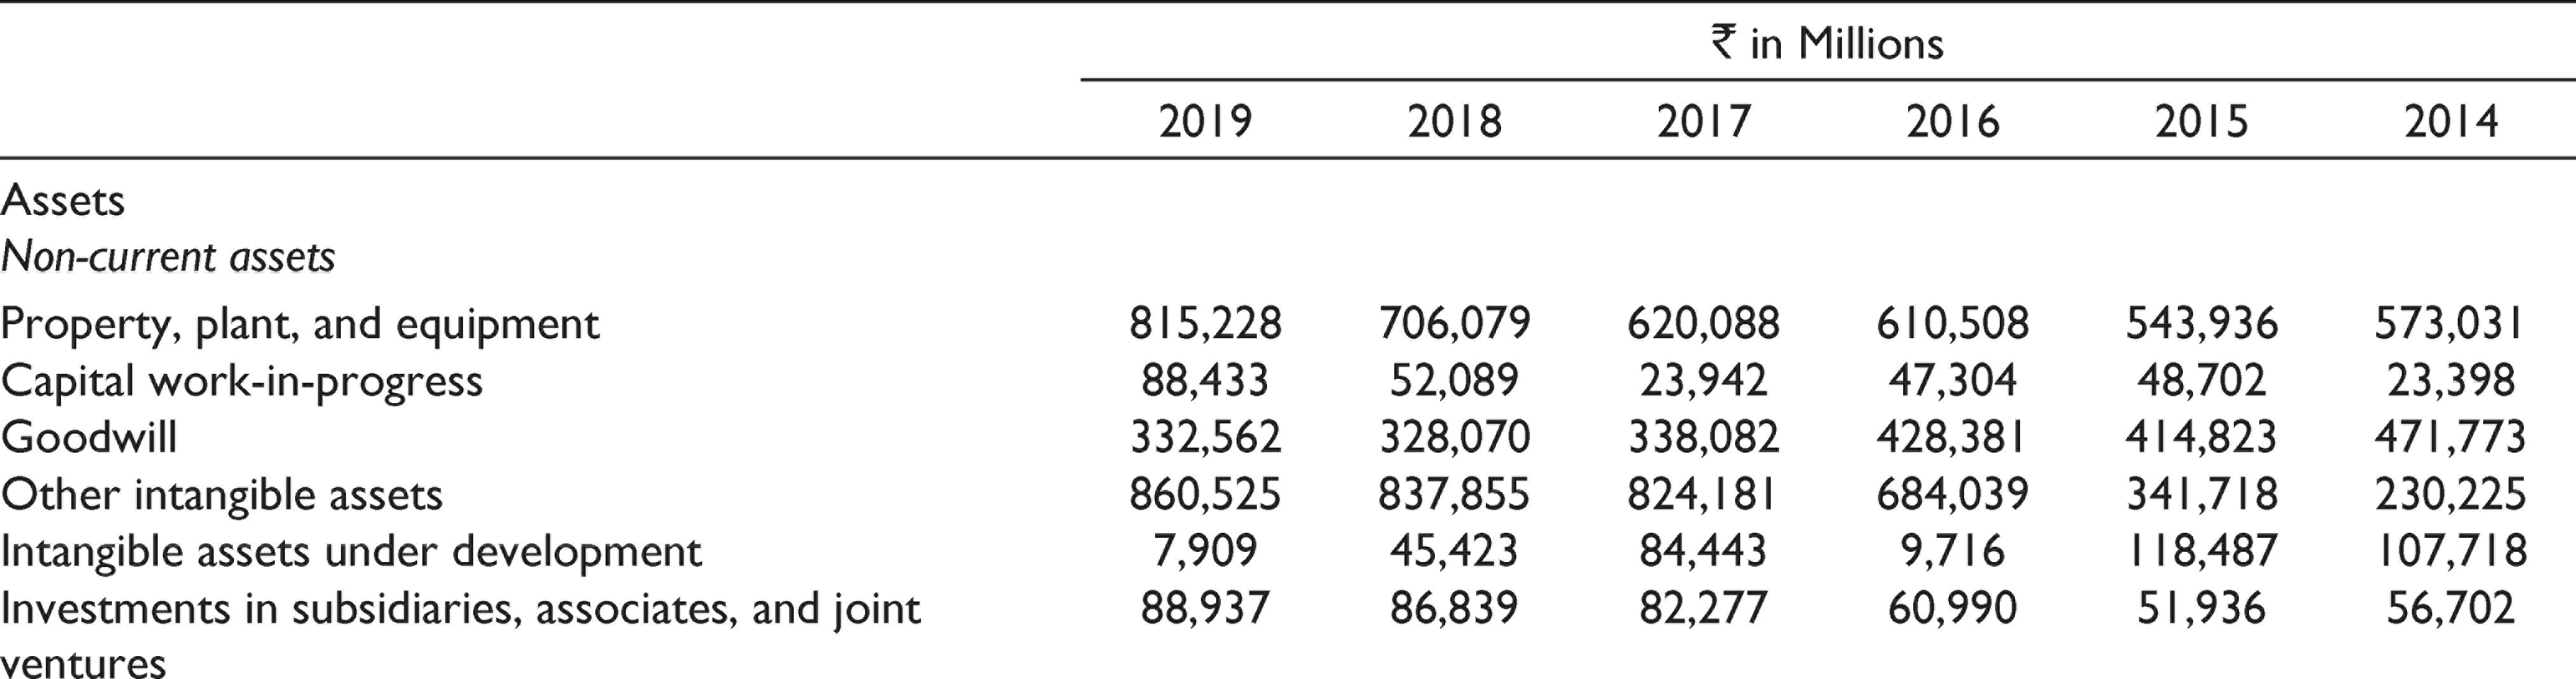
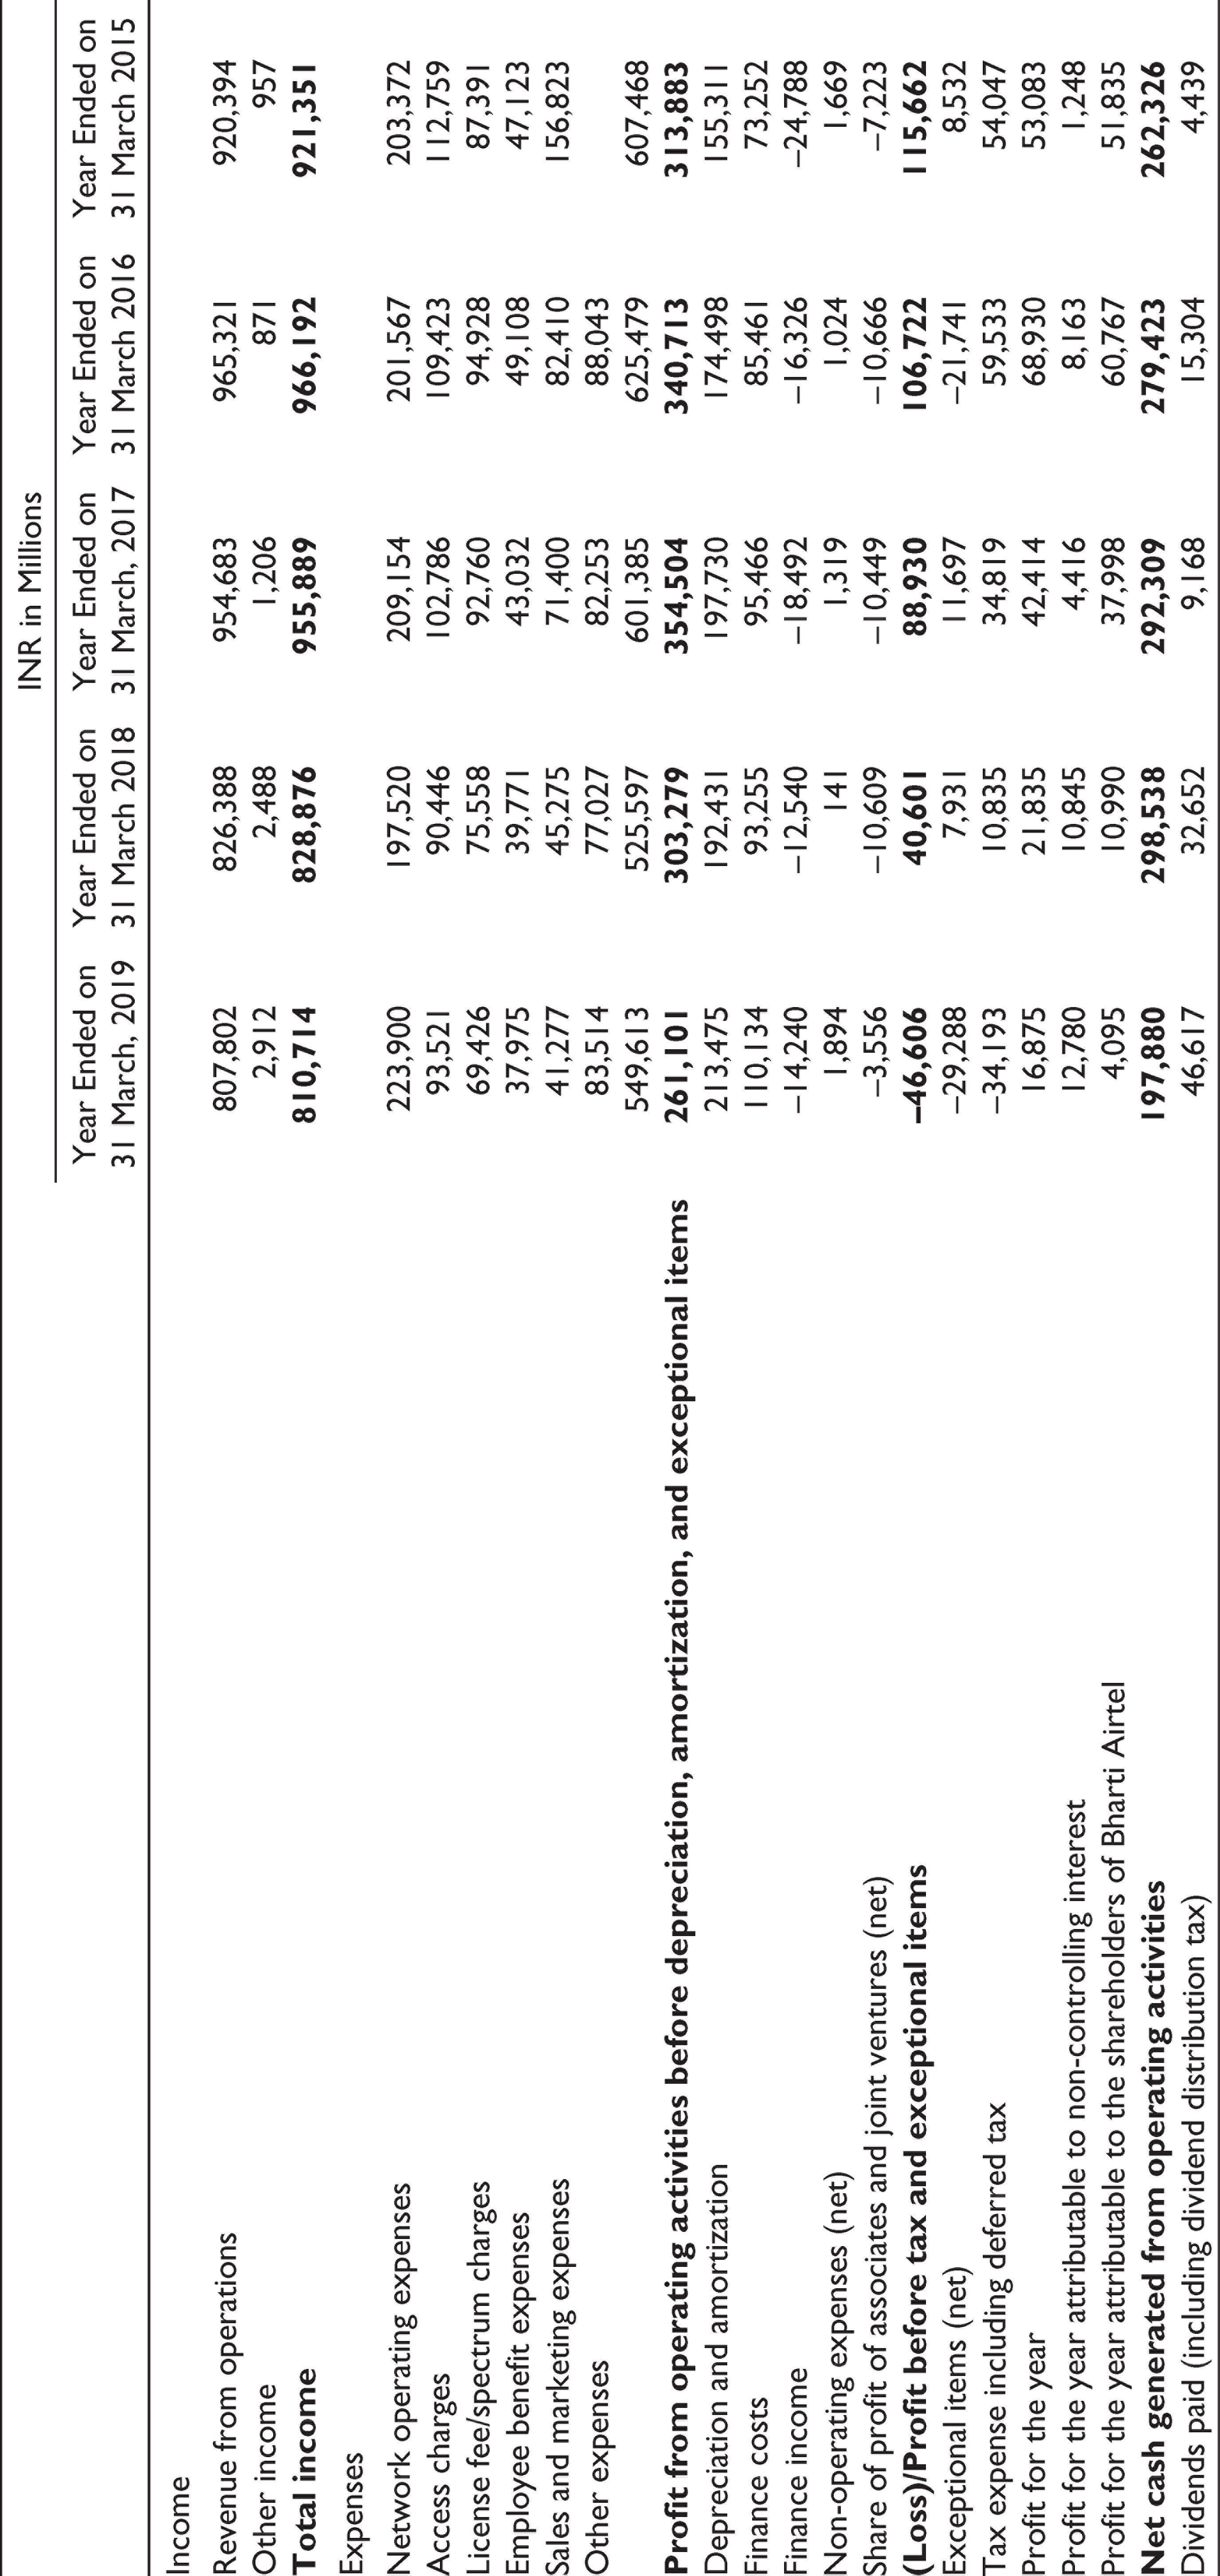
The unprecedented disruption caused by the entry of Reliance Jio, however, spoiled Airtel’s applecart. The company’s combined revenue from wireless segment and landline and Internet segment decreased from ₹593 billion in 2016–2017 to ₹487.9 billion in 2017–2018. It registered a decline of 10.24% to ₹437.93 billion in 2018–2019. EBIDA fell by 31% and 35.43% during this period. See Exhibits 3a–3c for the financial statements of Bharti Airtel Limited on consolidated basis and segment-wise basis. Table 4 presents the strength, weaknesses, opportunities and threat (SWOT) analysis of Bharti Airtel Limited.
SWOT Analysis of Bharti Airtel

Sunil Bharti Mittal, Chairman of Bharti Airtel in his communication
15
to the shareholders outlined strategy as
…In India, amidst conspicuous pricing pressure, we did well to retain our market share by focusing on ‘revenue paying customers’ and orienting ourselves towards mid to high end of the market. The introduction of the minimum commitment plans helped us register significant recovery in ARPU towards the end of the year…
Vodafone Idea Limited
In 2018, Vodafone India and Idea Cellular merged to form Vodafone Idea. Vodafone had commenced its operations in India in September 2007, when its parent Vodafone Group Plc. acquired a majority stake Hutchinson Essar. 16 Vodafone India’s telecom subscribers base had increased from 183.88 million on 31 March 2015 to 222.92 million subscribers on 31 March 2018. Though revenues had declined from €5479 million to €4648 million during this period, but operating profit had increased from €456 million to €1299 million.
Idea Cellular was incorporated as Birla Communications Limited in 1995. It was rechristened as Birla AT&T Communications Limited in 1996. It merged with Tata Cellular in 2000 and acquired RPG Cellular in 2001. The name of the company was changed to Birla Tata AT&T Limited in 2001 and to Idea Cellular Limited in 2002. It had acquired equity stake in Escotel Mobile Communications Limited and Escorts Telecommunications. After becoming an Aditya Birla Group company, Idea Cellular consolidated its operations by merging with its seven subsidiaries. In 2007, it went for initial public offering of ₹28.19 billion equity capital. 17 Idea Cellular continued to venture into different states and increased its Pan-India reach by 2009, In 2013, Idea Cellular had become a pan-India operator and became a third largest mobile operator.
The amalgamation of Vodafone India with Idea Cellular in August 2018 led Vodafone Idea to become the largest telecom player in India with a subscriber base of 435.22 million 18 . It was a joint venture between Vodafone Group and Aditya Birla Group with equity stakes of 45.2% and 26.54%, respectively. The consolidation deal was expected to achieve annual run rate savings of ₹84 billion by the financial year 2020–2021. 19
Vittorio Colao, Chief Executive, Vodafone Group Plc in the strategic review communication
20
observed
The entrance of a new operator in India offering 4G services for free has created industry turbulence, leading us to take an impairment charge of €3.7 billion net of tax. We have moved strategically to face the new context by proposing to merge Vodafone India with Idea Cellular, the number 3 operator in India, which will create a new market leader with the scale to invest in India’s digital future, while also capturing an estimated US$10 billion NPV in synergies.
Vodafone Idea’s gamut of services included voice and data services on 2G, 3G, and 4G technologies. It also offered enterprise-wide services and solutions. The company offered service under two distinct brands; Idea and Vodafone. Vodafone Idea had a spectrum portfolio of 1,849 MHz across 22 circles in India. Of this, 1,714.8 MHz of spectrum was liberalized. The company could deploy this spectrum for any technology. 21 Vodafone Idea had recorded a revenue of ₹370.06 billion and net cash generated from operating activities of ₹52.68 billion in 2018–2019. Vodafone Idea had raised an equity of ₹250 billion in May 2019. Vodafone Group Plc had invested ₹110 billion. 22
See Exhibits 4a–4c for the financial statements of Vodafone Idea Limited, and Exhibits 4d and 4e for the financial statements of Vodafone India. Table 5 presents the SWOT analysis of Vodafone Idea Limited.
SWOT Analysis of Vodafone Idea Limited

Bharti Airtel and Vodafone Idea had estimated ‘revenue sharing’ liability, on 30 September 2019 in view of the Supreme Court judgement on AGR definition, of ₹342,600 million and ₹441,500 million, respectively. Bharti Airtel created a provision of ₹284,500 million and reported loss (before Tax) of ₹343,332 million and net cash generated from operating activities of ₹149,122 million for the 6 months ending 30 September 2019. Vodafone Idea created a provision of ₹256,779 million, reported loss (before tax) of ₹436,330 million, and net cash generated from operating activities of ₹57,775 million for the 6 months ending 30 September 2019.
Dilemmas
The 24 October 2019 judgment had lent finality to the AGR dispute. The verdict had far-reaching implications for the industry and consumers. The AGR dues had to be paid within a 3-month period. In the absence of adequate provisions in the financial statements to meet the AGR liability, the leading telecom players were in a bind. The situation necessitated the need to meet a financial contingency without further compromising the already fragile financial position of the telecom companies.
The industry association had a key role to play in seeking relief by way of moratorium and extended payment deadline from the government and thus safeguarding the interest of individual companies.
The option to bailout/revive the telecom sector to allow telecom companies a 2-year moratorium on spectrum payments could not be provided, as the AGR dues payment within 3-month period was mandated by the Supreme Court of India. 23 Another option could be to allow telecom companies to make payment of remaining AGR dues of ₹1,470 billion in present value terms estimated at bank prime lending rate over a period of 20 years. 24
Intense competition bodes well for the consumers, but it was putting pressure on telecom industry profitability and liquidity. The industry revenues and ARPU were declining. Had the Indian telecom industry lost its sheen?
What could have been the motivations of the telecom companies to contest the definition of AGR on the ground of ‘licence and non-licensed activities’, when an exhaustive and broad definition was laid down in the license agreement?
Licence fee and SUC liability arising on account of revenue from non-licensed activities was not a contingent liability. The telecom companies had hitherto been skating on thin ice. Why did telecom companies not create adequate provision to meet this liability for the period under dispute, in accordance with the principles of ‘prudence’ under accrual accounting?
The AGR liability had huge consequences on different stakeholders in the telecom industry. A few of the telecom companies could possibly collapse under the license fee, short-paid liability. How will the companies discharge their liability when they are reeling under financial stress? How it will impact competition in the telecom sector?
What options does the government have to ensure payment of AGR past dues by the telecom companies, while considering financial health of telecom industry, ensuring competition, and wider economic impact? The government had to ensure that the telecom sector, an important pillar of the economy, remains viable. It had to devise a mechanism to enable full payment of overdue AGR dues.
Epilogue
The events that followed from 24 October 2019 to 1 September 2020 are enumerated in Exhibit 5.
Footnotes
Declaration of Conflicting Interests
The authors declared no potential conflicts of interest with respect to the research, authorship and/or publication of this article.
Funding
The authors received no financial support for the research, authorship and/or publication of this article.
Adjusted Gross Revenue Issue
New Telecom Policy, 1999 had allowed private service operators to migrate from ‘fixed license fee’ to ‘revenue sharing’ regime with effect from 1 August 1999. Cellular mobile service providers (CMSP) were required to share revenue with DoT as a part of license agreement. They were required to pay a license fee as a percentage of AGR. It was provisionally fixed at 15% initially, which later reduced to 13%, and then to 8% in 2013. In lieu of it, the central government had initiated universal service obligation fund (USOF) to cover remote, rural, tribal, and hilly areas. ‘Digital India Mission’ project of the Central Government had laid down optical fibre cables up to ‘Gram Panchayat’ areas.
Indian Telecom Sector—Historical Perspective
Telecom, which is an economic infrastructure, had been the exclusive privilege of the Government of India. 28 The telecom services and network management were a government monopoly.
India had a very low teledensity of 0.8 per 100 persons as against the world average of 10 in 1994. National Telecom Policy was formulated in 1994 with a moto of ‘telecommunication for all and within the reach of all’. It paved the way for liberalization of Indian telecom sector. The central government had an authority to grant telecom licenses. 29 Initially, cellular operation licenses were granted to two private operators per circle in 4 metros and 18 other circles in consideration of payment of annual fixed licence fee to DoT, Government of India. In 1997, TRAI was established to regulate the telecom sector and promote competition.
The outcome of privatization was not as it was expected. The cellular and basic telephone operators found their actual revenues were far less than the projected. They were not able to achieve financial closure and complete their projects.
A framework of providing world class telecom infrastructure to enable India to become Information technology superpower was laid down in the New Telecom Policy, 1999. The specific targets provided were to achieve teledensity of 7 by 2005 and 15 by 2010 and to provide Internet access to all. It allowed private service operators’ migration from ‘fixed license fee’ to ‘revenue sharing’ regime with effect from 1 August 1999.
The Department of Telecom Services (DTS) and the Department of Telecom Operations (DTO), Government of India were corporatized, with the incorporation of Bharat Sanchar Nigam Limited (BSNL) on 15 September 2000. Their business was transferred to BSNL with effect from 1 October 2000 on a going concern basis.
By the end of 2000, India had a wireline telephone teledensity of 2.62 and wireless teledensity of 0.19 in 2000. ARPU was ₹1319 per mobile subscriber per month.
The guidelines for migration to unified access service (UAS) licenses were introduced on 11 November 2003. 30 The foreign direct investment limit in telecom sector was increased from 49% to 74% during the financial year 2005–2006 to encourage competition and consolidation. 31
The telecom industry had witnessed a huge growth and a structural change during the period 2000–2011. The subscriber base had increased to 926.53 million, with a teledensity of 76.86 and ARPU of ₹100 per subscriber per month. The trend of dwindling fixed line connections and burgeoning wireless connections led to the decline in market share of BSNL, 32 the state-run telecom operator. The share of the private sector in the telecom market had increased to 86.09%.
The National Telecom Policy, 2012, shifted the goal post to ‘empowered and inclusive knowledge-based society, using telecommunications as a platform’. The 2G, second generation, licenses for mobile networks were issued in 2008 on first come first serve basis. Subsequently, questions were raised on the process followed for spectrum allocation. It was alleged that the process was opaque and had failed to maximize the government revenue.
The auction for radio spectrum frequencies in the 2.1 GHz band (‘3G Spectrum’) were completed on May 2010 for 71 blocks in 22 service areas. 33
In its report dated 8 November, 2010, the Comptroller and Auditor General of India (CAG) estimated the potential loss of ₹1766.45 billion to the exchequer in 2G spectrum allocation (rates on the basis of 3G auction).
34
All the 122 licenses in 22 service areas for allocation of 2G Spectrum were cancelled in 2012 by the Supreme Court of India with a direction to follow fresh competitive bidding process. The Supreme Court of India held that
… State is the legal owner of the natural resources as a trustee of the people and although it is empowered to distribute the same, the process of distribution must be guided by the constitutional principles including the doctrine of equality and larger public good. (Centre for Public Interest Litigation & Others v. UOI & Others, 2010, para 72)
The auction of use of radio spectrum frequencies in 700 MHz, 800 MHz, 900 MHz, 1,800 MHz, 2,100 MHz, 2,300 MHz, and 2,500 MHz bands for a period of 20 years had generated an upfront revenue of ₹657.89 billion (excluding service tax) for the exchequer. 35 The process was completed in October 2016. In addition, the licensees were required to pay spectrum usage (SUC) charge as a percentage of AGR.
Bharti Airtel Limited: Consolidated Balance Sheet.

| ₹ in Millions |
||||||
| 2019 | 2018 | 2017 | 2016 | 2015 | 2014 | |
| Assets Non-current assets |
||||||
| Property, plant, and equipment | 815,228 | 706,079 | 620,088 | 610,508 | 543,936 | 573,031 |
| Capital work-in-progress | 88,433 | 52,089 | 23,942 | 47,304 | 48,702 | 23,398 |
| Goodwill | 332,562 | 328,070 | 338,082 | 428,381 | 414,823 | 471,773 |
| Other intangible assets | 860,525 | 837,855 | 824,181 | 684,039 | 341,718 | 230,225 |
| Intangible assets under development | 7,909 | 45,423 | 84,443 | 9,716 | 118,487 | 107,718 |
| Investments in subsidiaries, associates, and joint ventures | 88,937 | 86,839 | 82,277 | 60,990 | 51,936 | 56,702 |
| Financial assets | ||||||
| Investments | 21,941 | 5,769 | 44,187 | 28,622 | 31,310 | 36,341 |
| Derivative instruments | 3,105 | 2,031 | 4,732 | 13,999 | 7,303 | 2,761 |
| Security deposits | 16,452 | 9,703 | 9,630 | 10,441 | 9,529 | 7,232 |
| Others | 3,227 | 5,814 | 16,653 | 17,502 | 8,031 | 10,098 |
| Income tax assets (net) | 17,694 | 25,505 | ||||
| Deferred tax assets (net) | 89,379 | 29,330 | 26,262 | 46,738 | 59,502 | 62,627 |
| Other non-current assets | 77,526 | 36,319 | 49,875 | 70,440 | 75,684 | 26,009 |
|
|
|
|
|
|
|
|
| Current assets | ||||||
| Inventories | 884 | 693 | 488 | 1,692 | 1,339 | 1,422 |
| Financial assets | ||||||
| Investments | 46,232 | 68,978 | 16,923 | 16,159 | 84,017 | 62,265 |
| Derivative instruments | 426 | 8,941 | 2,060 | 4,765 | 1,207 | 819 |
| Trade receivables | 43,006 | 58,830 | 49,838 | 55,039 | 51,961 | 62,441 |
| Cash and cash equivalent | 62,121 | 49,552 | 12,817 | 37,087 | 11,721 | 44,505 |
| Other bank balances | 18,934 | 17,154 | 3,360 | 13,900 | 8,823 | 5,303 |
| Others | 20,343 | 27,462 | 52,105 | 32,511 | 25,171 | 8,127 |
| Current tax assets | 21,454 | 11,570 | 5,721 | 9,319 | ||
| Other current assets | 137,111 | 103,380 | 44,105 | 48,827 | 32,196 | 29,656 |
| Assets-held-for-sale | 7,002 | 32,618 | ||||
|
|
|
|
|
|
|
|
|
|
|
|
|
|
|
|
| Equity and liabilities Equity |
||||||
| Equity share capital | 19,987 | 19,987 | 19,987 | 19,987 | 19,987 | 19,987 |
| Other equity | 694,235 | 675,357 | 654,576 | 647,706 | 610,603 | 577,573 |
|
|
|
|
|
|
|
|
| Non-controlling interest | 135,258 | 88,139 | 68,750 | 54,981 | 51,613 | 4,2102 |
| Liabilities Non-current liabilities Financial Liabilities |
||||||
| Borrowings | 872,454 | 849,420 | 896,373 | 892,686 | 591,575 | 549,919 |
| Derivative instruments | 826 | 5,409 | 2,726 | 8 | 164 | 4,313 |
| Others | 6,2131 | 44,547 | 15681 | 16,084 | 14,537 | 27,464 |
| Deferred revenue | 17,986 | 22,117 | 22,335 | 17,787 | 17,917 | 14,010 |
| Provisions | 6,823 | 7,212 | 7,471 | 7,350 | 7,648 | 10,044 |
| Deferred tax liabilities (net) | 11,297 | 10,606 | 9,429 | 12,512 | 13,077 | 16,850 |
| Other non-current liabilities | 429 | 623 | 727 | 1,527 | 1,466 | 1,460 |
|
|
|
|
|
|
|
|
| Current liabilities Financial liabilities |
||||||
| Borrowings | 310,097 | 129,569 | 129,442 | 57,238 | 86,680 | 97,467 |
| Current maturities of long-term borrowings | 71,732 | 134,346 | 48,466 | 54,602 | 125,366 | 111,572 |
| Derivative instruments | 12,742 | 283 | 2,335 | 1,931 | 628 | 1,097 |
| Trade payables | 280,031 | 268,536 | 268,537 | 255,806 | 215,896 | 283,981 |
| Other financial liabilities | 159,806 | 140,605 | 88,808 | 131,180 | 127,306 | |
| Deferred revenue | 43,993 | 48,666 | 48,785 | 51,336 | 50,074 | 44,899 |
| Provisions | 2,197 | 2,384 | 2,215 | 2,332 | 2,066 | 1,725 |
| Current tax liabilities (net) | 8,228 | 11,058 | 6,089 | 9,296 | 9,271 | 12,032 |
| Other current liabilities | 41,723 | 46,952 | 34,770 | 21,844 | 15,898 | 15,277 |
| Liabilities-held-for-sale | 1,039 | 3,963 | ||||
|
|
|
|
|
|
|
|
|
|
|
|
|
|
|
|
Bharti Airtel Limited: Consolidated Statement of Profit and Loss
| INR in Millions |
|||||
| Year Ended on 31 March, 2019 | Year Ended on 31 March 2018 | Year Ended on 31 March, 2017 | Year Ended on 31 March 2016 | Year Ended on 31 March 2015 | |
| Income | |||||
| Revenue from operations | 807,802 | 826,388 | 954,683 | 965,321 | 920,394 |
| Other income | 2,912 | 2,488 | 1,206 | 871 | 957 |
|
|
|
|
|
|
|
| Expenses | |||||
| Network operating expenses | 223,900 | 197,520 | 209,154 | 201,567 | 203,372 |
| Access charges | 93,521 | 90,446 | 102,786 | 109,423 | 112,759 |
| License fee/spectrum charges | 69,426 | 75,558 | 92,760 | 94,928 | 87,391 |
| Employee benefit expenses | 37,975 | 39,771 | 43,032 | 49,108 | 47,123 |
| Sales and marketing expenses | 41,277 | 45,275 | 71,400 | 82,410 | 156,823 |
| Other expenses | 83,514 | 77,027 | 82,253 | 88,043 | |
| 549,613 | 525,597 | 601,385 | 625,479 | 607,468 | |
|
|
|
|
|
|
|
| Depreciation and amortization | 213,475 | 192,431 | 197,730 | 174,498 | 155,311 |
| Finance costs | 110,134 | 93,255 | 95,466 | 85,461 | 73,252 |
| Finance income | –14,240 | –12,540 | –18,492 | –16,326 | –24,788 |
| Non-operating expenses (net) | 1,894 | 141 | 1,319 | 1,024 | 1,669 |
| Share of profit of associates and joint ventures (net) | –3,556 | –10,609 | –10,449 | –10,666 | –7,223 |
|
|
|
|
|
|
|
| Exceptional items (net) | –29,288 | 7,931 | 11,697 | –21,741 | 8,532 |
| Tax expense including deferred tax | –34,193 | 10,835 | 34,819 | 59,533 | 54,047 |
| Profit for the year | 16,875 | 21,835 | 42,414 | 68,930 | 53,083 |
| Profit for the year attributable to non-controlling interest | 12,780 | 10,845 | 4,416 | 8,163 | 1,248 |
| Profit for the year attributable to the shareholders of Bharti Airtel | 4,095 | 10,990 | 37,998 | 60,767 | 51,835 |
|
|
|
|
|
|
|
| Dividends paid (including dividend distribution tax) | 46,617 | 32,652 | 9,168 | 15,304 | 4,439 |
Bharti Airtel Limited: Segment Results
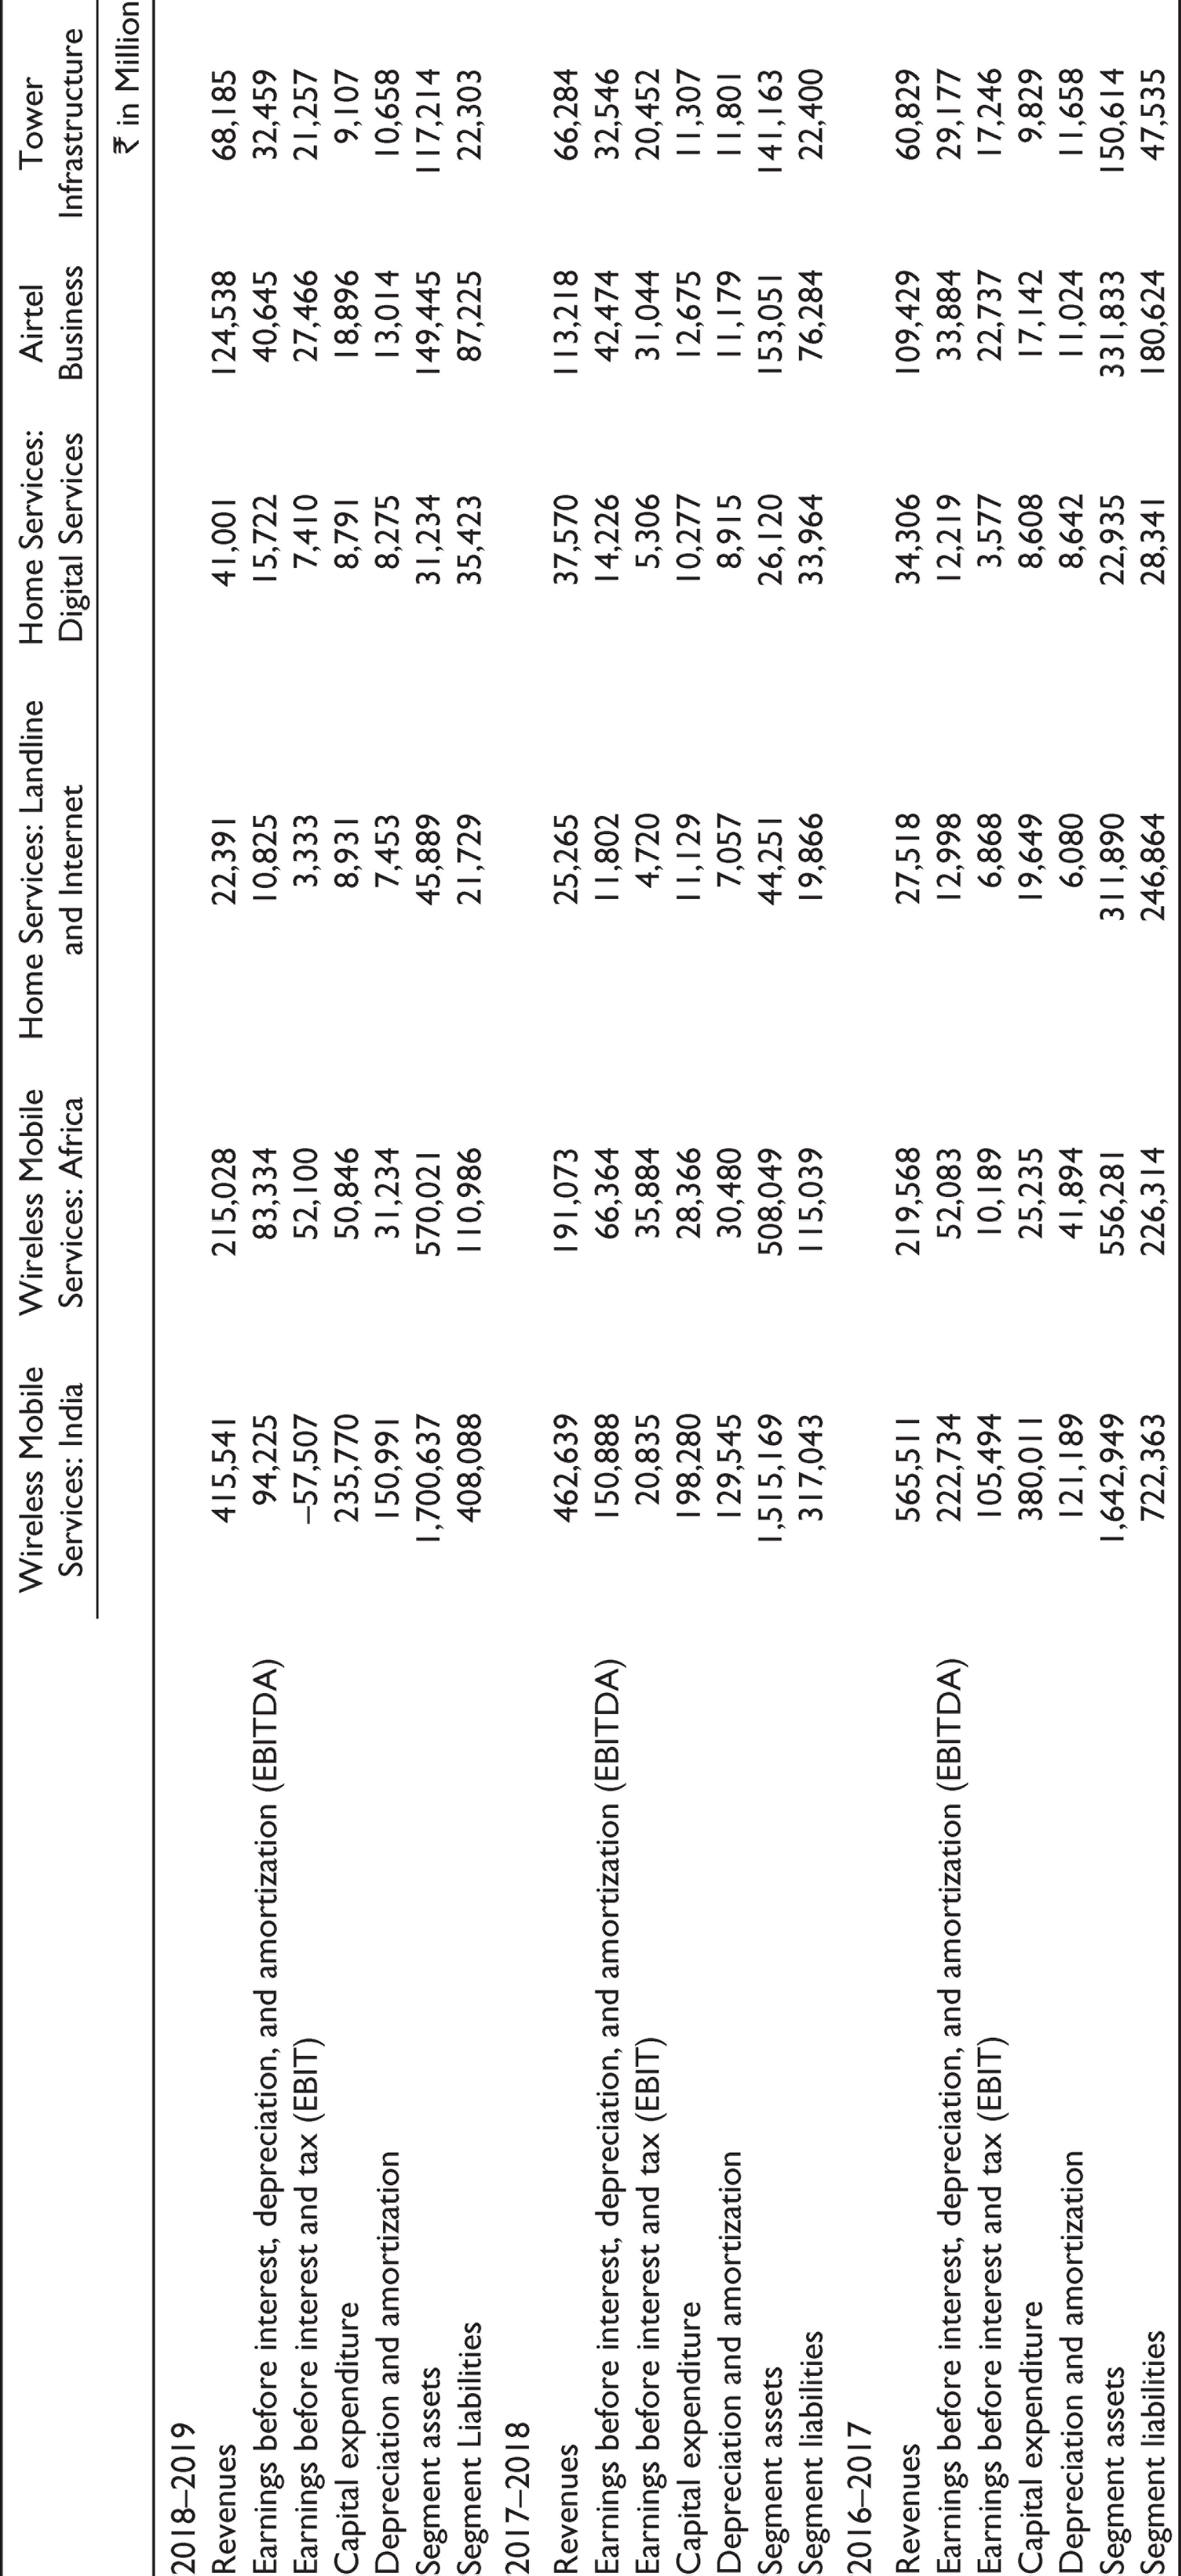
| Wireless Mobile Services: India | Wireless Mobile Services: Africa | Home Services: Landline and Internet | Home Services: Digital Services | Airtel Business | Tower Infrastructure | |
| ₹ in Million | ||||||
| 2018–2019 | ||||||
| Revenues | 415,541 | 215,028 | 22,391 | 41,001 | 124,538 | 68,185 |
| Earnings before interest, depreciation, and amortization (EBITDA) | 94,225 | 83,334 | 10,825 | 15,722 | 40,645 | 32,459 |
| Earnings before interest and tax (EBIT) | –57,507 | 52,100 | 3,333 | 7,410 | 27,466 | 21,257 |
| Capital expenditure | 235,770 | 50,846 | 8,931 | 8,791 | 18,896 | 9,107 |
| Depreciation and amortization | 150,991 | 31,234 | 7,453 | 8,275 | 13,014 | 10,658 |
| Segment assets | 1,700,637 | 570,021 | 45,889 | 31,234 | 149,445 | 117,214 |
| Segment Liabilities | 408,088 | 110,986 | 21,729 | 35,423 | 87,225 | 22,303 |
| 2017–2018 | ||||||
| Revenues | 462,639 | 191,073 | 25,265 | 37,570 | 113,218 | 66,284 |
| Earnings before interest, depreciation, and amortization (EBITDA) | 150,888 | 66,364 | 11,802 | 14,226 | 42,474 | 32,546 |
| Earnings before interest and tax (EBIT) | 20,835 | 35,884 | 4,720 | 5,306 | 31,044 | 20,452 |
| Capital expenditure | 198,280 | 28,366 | 11,129 | 10,277 | 12,675 | 11,307 |
| Depreciation and amortization | 129,545 | 30,480 | 7,057 | 8,915 | 11,179 | 11,801 |
| Segment assets | 1,515,169 | 508,049 | 44,251 | 26,120 | 153,051 | 141,163 |
| Segment liabilities | 317,043 | 115,039 | 19,866 | 33,964 | 76,284 | 22,400 |
| 2016–2017 | ||||||
| Revenues | 565,511 | 219,568 | 27,518 | 34,306 | 109,429 | 60,829 |
| Earnings before interest, depreciation, and amortization (EBITDA) | 222,734 | 52,083 | 12,998 | 12,219 | 33,884 | 29,177 |
| Earnings before interest and tax (EBIT) | 105,494 | 10,189 | 6,868 | 3,577 | 22,737 | 17,246 |
| Capital expenditure | 380,011 | 25,235 | 19,649 | 8,608 | 17,142 | 9,829 |
| Depreciation and amortization | 121,189 | 41,894 | 6,080 | 8,642 | 11,024 | 11,658 |
| Segment assets | 1,642,949 | 556,281 | 311,890 | 22,935 | 331,833 | 150,614 |
| Segment liabilities | 722,363 | 226,314 | 246,864 | 28,341 | 180,624 | 47,535 |
Vodafone Idea Limited: Consolidated Balance Sheet
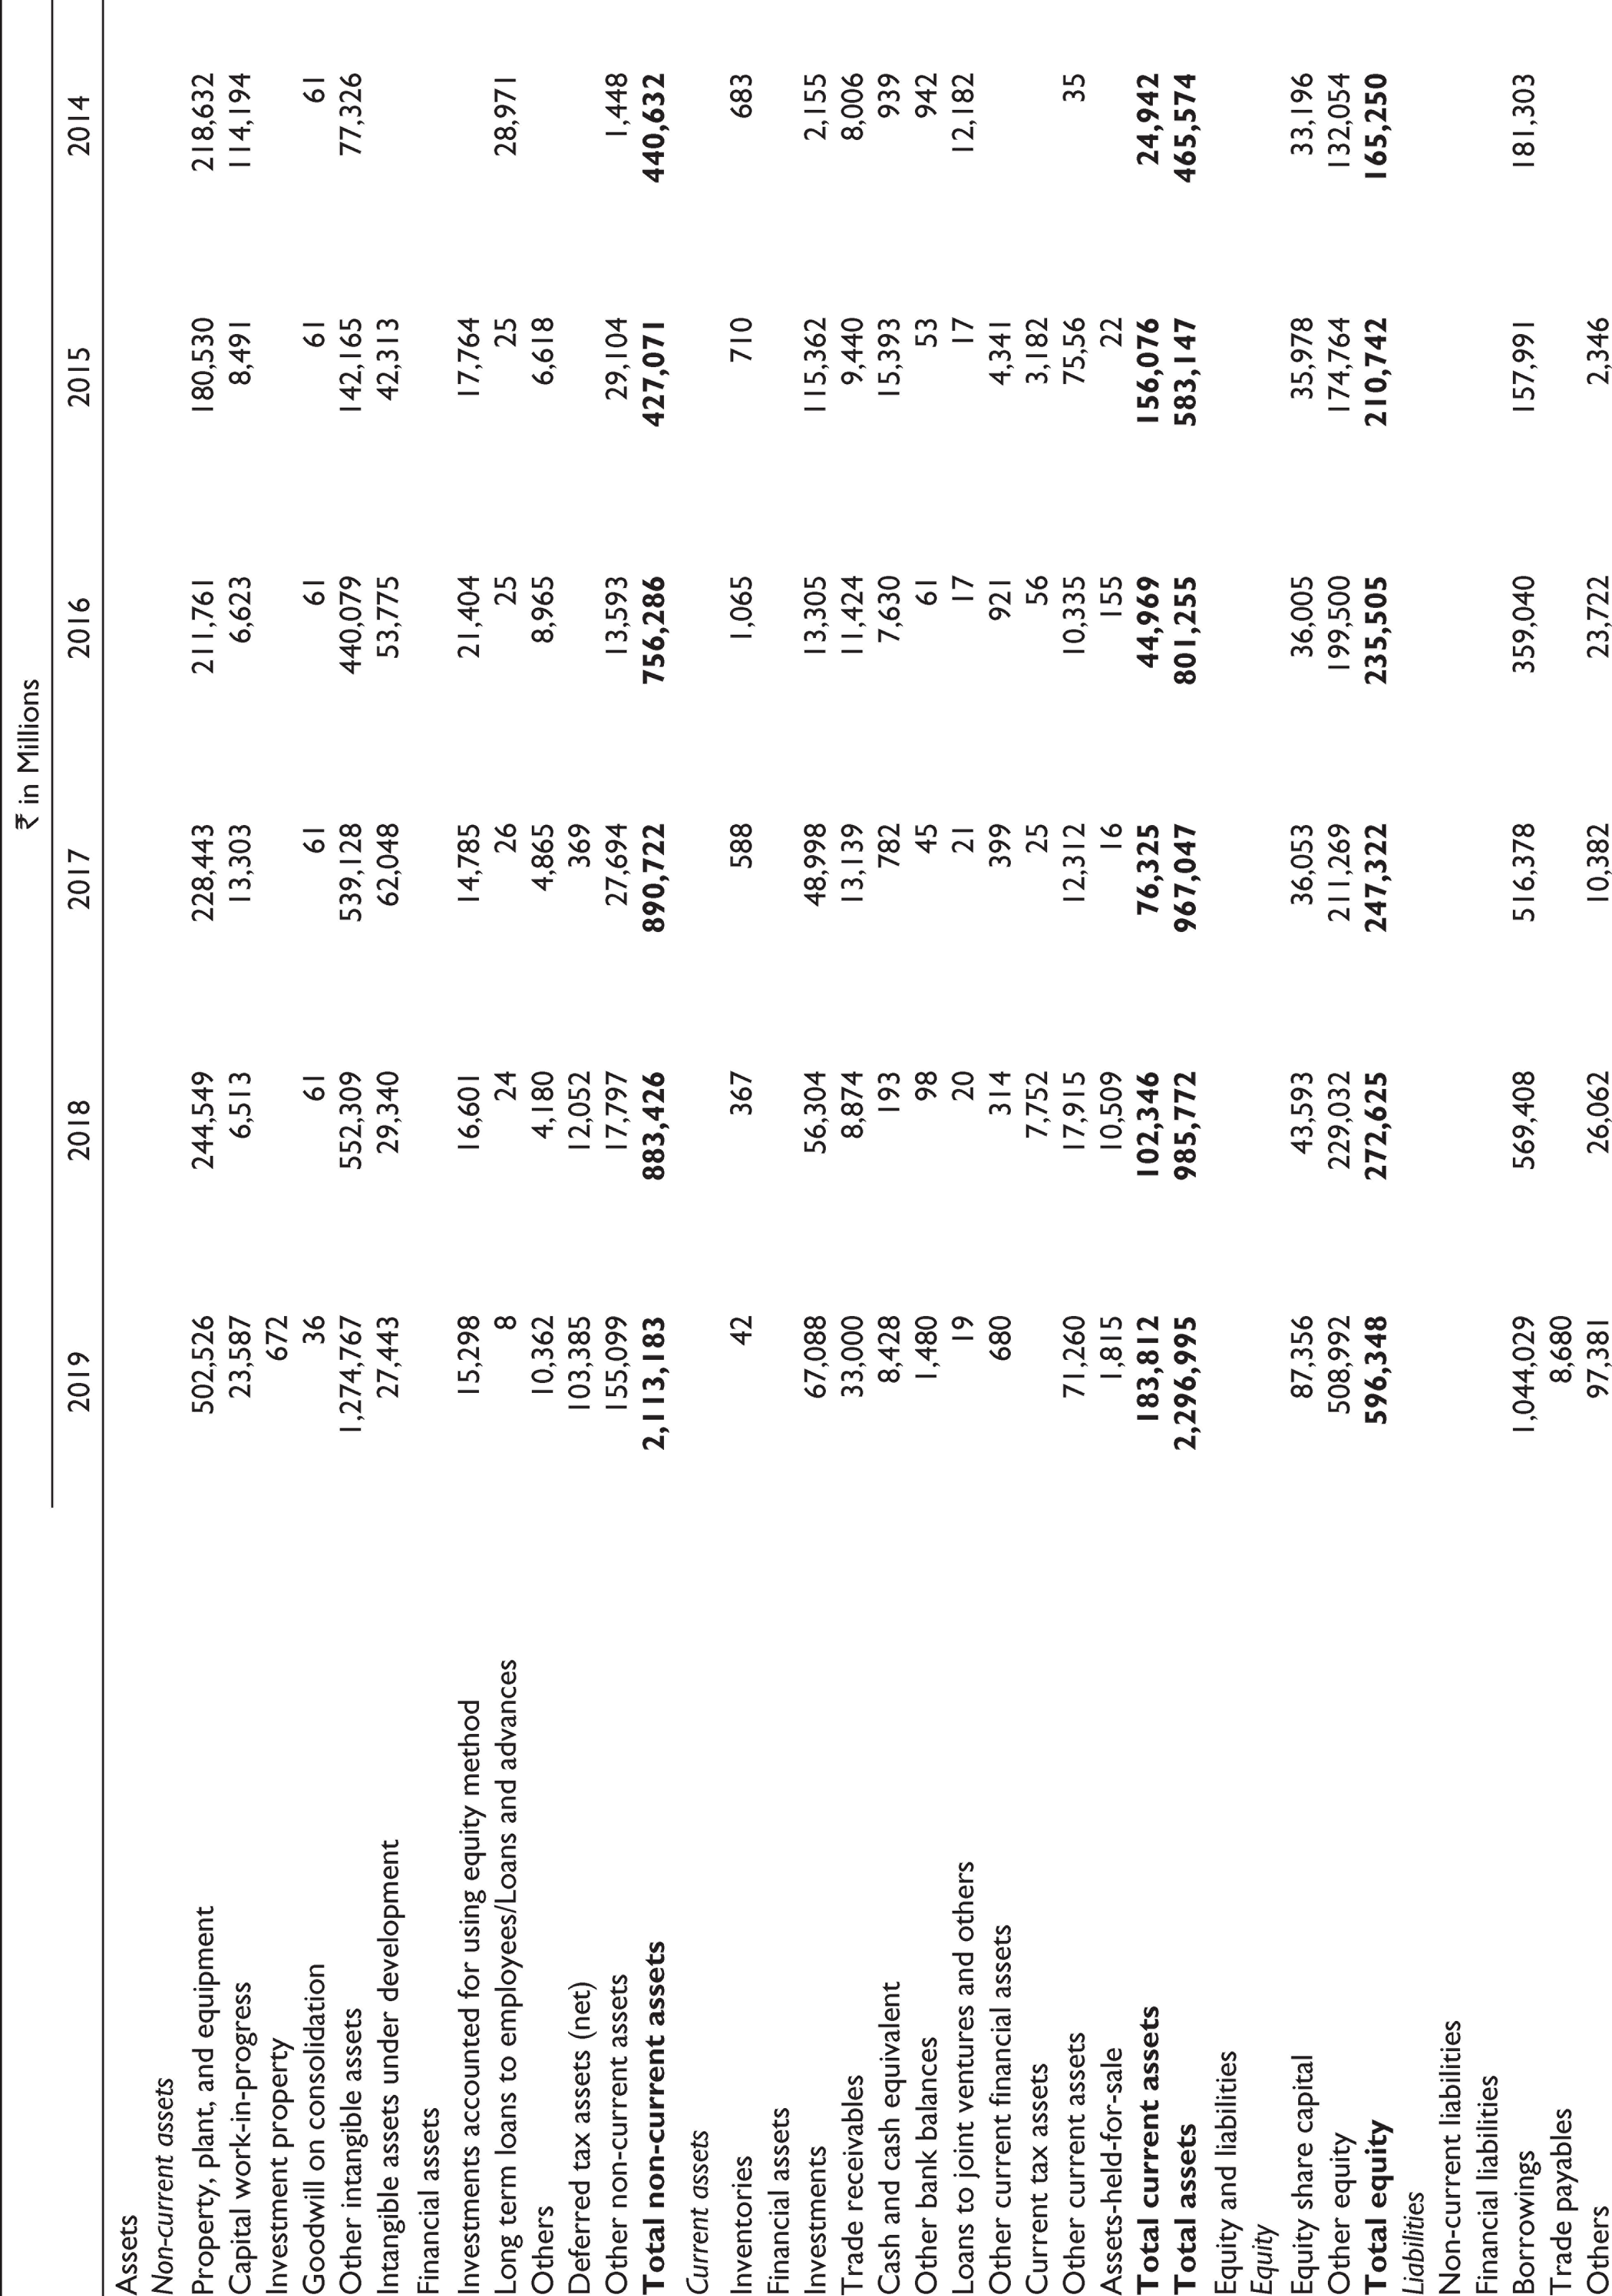
| ₹ in Millions |
||||||
| 2019 | 2018 | 2017 | 2016 | 2015 | 2014 | |
| Assets Non-current assets |
||||||
| Property, plant, and equipment | 502,526 | 244,549 | 228,443 | 211,761 | 180,530 | 218,632 |
| Capital work-in-progress | 23,587 | 6,513 | 13,303 | 6,623 | 8,491 | 114,194 |
| Investment property | 672 | |||||
| Goodwill on consolidation | 36 | 61 | 61 | 61 | 61 | 61 |
| Other intangible assets | 1,274,767 | 552,309 | 539,128 | 440,079 | 142,165 | 77,326 |
| Intangible assets under development | 27,443 | 29,340 | 62,048 | 53,775 | 42,313 | |
| Financial assets | ||||||
| Investments accounted for using equity method | 15,298 | 16,601 | 14,785 | 21,404 | 17,764 | |
| Long term loans to employees/Loans and advances | 8 | 24 | 26 | 25 | 25 | 28,971 |
| Others | 10,362 | 4,180 | 4,865 | 8,965 | 6,618 | |
| Deferred tax assets (net) | 103,385 | 12,052 | 369 | |||
| Other non-current assets | 155,099 | 17,797 | 27,694 | 13,593 | 29,104 | 1,448 |
|
|
|
|
|
|
|
|
| Current assets | ||||||
| Inventories | 42 | 367 | 588 | 1,065 | 710 | 683 |
| Financial assets | ||||||
| Investments | 67,088 | 56,304 | 48,998 | 13,305 | 115,362 | 2,155 |
| Trade receivables | 33,000 | 8,874 | 13,139 | 11,424 | 9,440 | 8,006 |
| Cash and cash equivalent | 8,428 | 193 | 782 | 7,630 | 15,393 | 939 |
| Other bank balances | 1,480 | 98 | 45 | 61 | 53 | 942 |
| Loans to joint ventures and others | 19 | 20 | 21 | 17 | 17 | 12,182 |
| Other current financial assets | 680 | 314 | 399 | 921 | 4,341 | |
| Current tax assets | 7,752 | 25 | 56 | 3,182 | ||
| Other current assets | 71,260 | 17,915 | 12,312 | 10,335 | 75,56 | 35 |
| Assets-held-for-sale | 1,815 | 10,509 | 16 | 155 | 22 | |
|
|
|
|
|
|
|
|
|
|
|
|
|
|
|
|
| Equity and liabilities Equity |
||||||
| Equity share capital | 87,356 | 43,593 | 36,053 | 36,005 | 35,978 | 33,196 |
| Other equity | 508,992 | 229,032 | 211,269 | 199,500 | 174,764 | 132,054 |
|
|
|
|
|
|
|
|
| Liabilities | ||||||
| Non-current liabilities | ||||||
| Financial liabilities | ||||||
| Borrowings | 1,044,029 | 569,408 | 516,378 | 359,040 | 157,991 | 181,303 |
| Trade payables | 8,680 | |||||
| Others | 97,381 | 26,062 | 10,382 | 23,722 | 2,346 | |
| Provisions | 3,467 | 3,107 | 3,842 | 3,454 | 2,843 | 4,986 |
| Deferred tax liabilities (net) | 471 | 659 | 13,587 | 19,539 | 13,276 | 18,133 |
| Other non-current liabilities | 4,235 | 5,602 | 4,921 | 4,108 | 3,661 | 9,229 |
|
|
|
|
|
|
|
|
| Current liabilities Financial liabilities |
||||||
| Borrowings | 41,207 | 217 | 347 | 16,456 | 1,514 | 6,472 |
| Trade payables | 126,486 | 35,479 | 40,777 | 32,471 | 29,617 | 27,880 |
| Other financial liabilities | 303,946 | 43,820 | 102,560 | 82,540 | 139,402 | 18,763 |
| Provisions | 379 | 224 | 199 | 926 | 396 | 1,877 |
| Current tax liabilities (net) | ||||||
| Other current liabilities | 69,499 | 26,597 | 26,732 | 23,494 | 21,359 | 31,681 |
| Liabilities-held-for-sale | 867 | 1,972 | ||||
|
|
|
|
|
|
|
|
|
|
|
|
|
|
|
|
Vodafone Idea Limited: Consolidated Statement of Profit and Loss
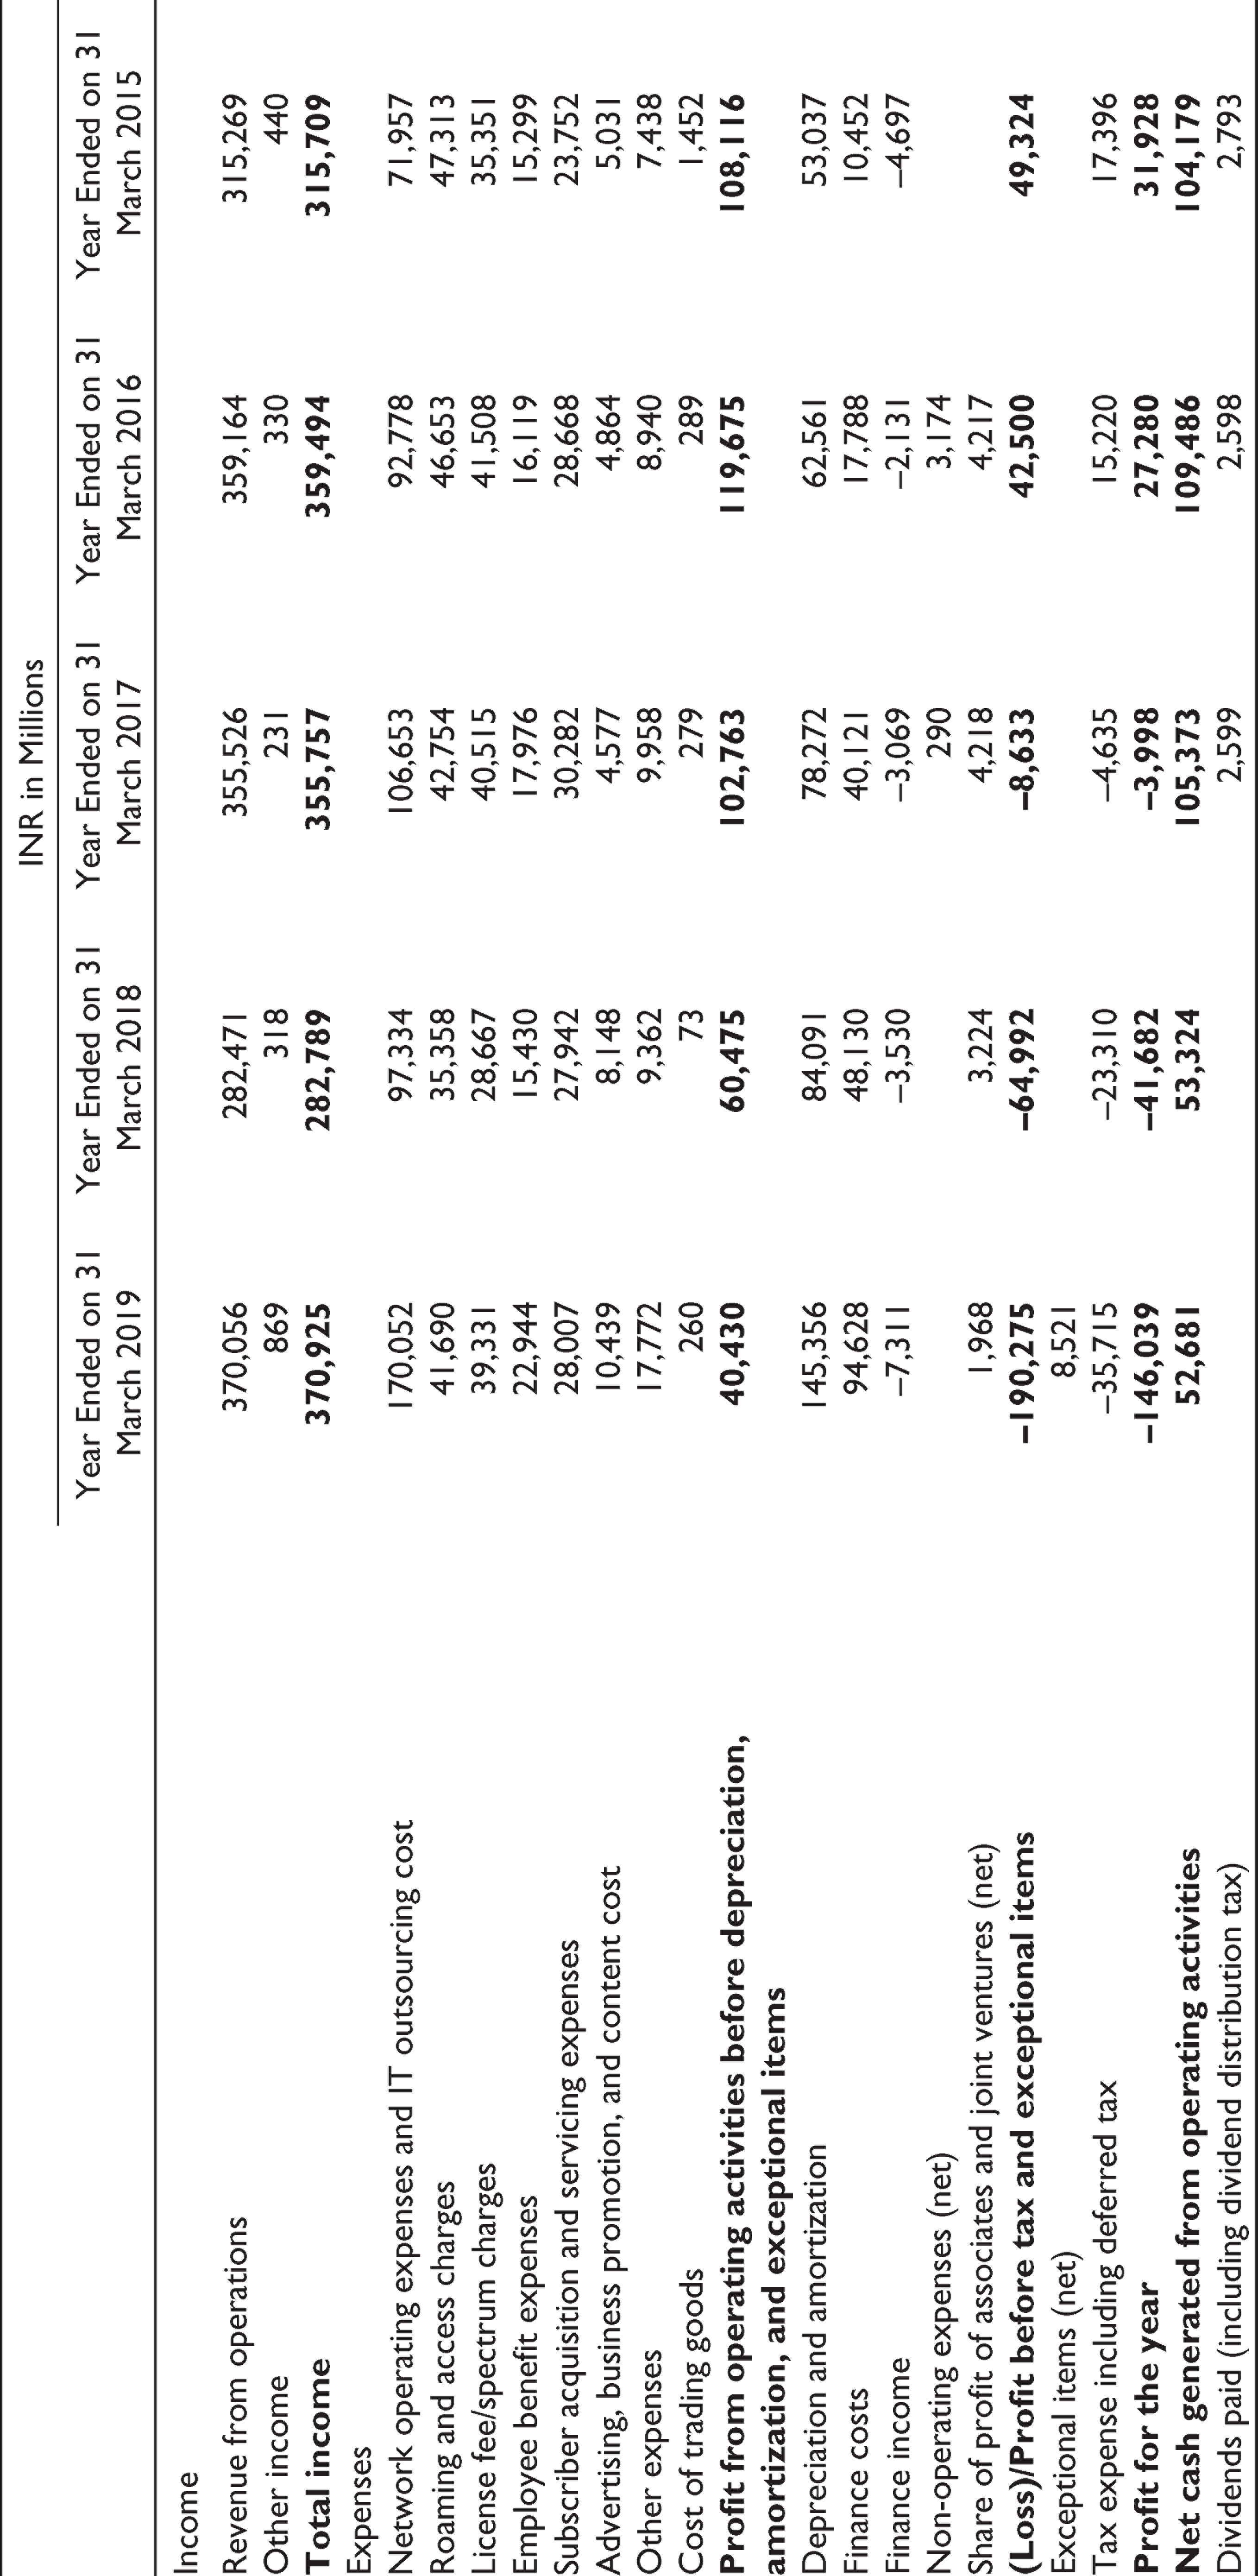
| INR in Millions |
|||||
| Year Ended on 31 March 2019 | Year Ended on 31 March 2018 | Year Ended on 31 March 2017 | Year Ended on 31 March 2016 | Year Ended on 31 March 2015 | |
| Income | |||||
| Revenue from operations | 370,056 | 282,471 | 355,526 | 359,164 | 315,269 |
| Other income | 869 | 318 | 231 | 330 | 440 |
|
|
|
|
|
|
|
| Expenses | |||||
| Network operating expenses and IT outsourcing cost | 170,052 | 97,334 | 106,653 | 92,778 | 71,957 |
| Roaming and access charges | 41,690 | 35,358 | 42,754 | 46,653 | 47,313 |
| License fee/spectrum charges | 39,331 | 28,667 | 40,515 | 41,508 | 35,351 |
| Employee benefit expenses | 22,944 | 15,430 | 17,976 | 16,119 | 15,299 |
| Subscriber acquisition and servicing expenses | 28,007 | 27,942 | 30,282 | 28,668 | 23,752 |
| Advertising, business promotion, and content cost | 10,439 | 8,148 | 4,577 | 4,864 | 5,031 |
| Other expenses | 17,772 | 9,362 | 9,958 | 8,940 | 7,438 |
| Cost of trading goods | 260 | 73 | 279 | 289 | 1,452 |
|
|
|
|
|
|
|
| Depreciation and amortization | 145,356 | 84,091 | 78,272 | 62,561 | 53,037 |
| Finance costs | 94,628 | 48,130 | 40,121 | 17,788 | 10,452 |
| Finance income | –7,311 | –3,530 | –3,069 | –2,131 | –4,697 |
| Non-operating expenses (net) | 290 | 3,174 | |||
| Share of profit of associates and joint ventures (net) | 1,968 | 3,224 | 4,218 | 4,217 | |
|
|
|
|
|
|
|
| Exceptional items (net) | 8,521 | ||||
| Tax expense including deferred tax | –35,715 | –23,310 | –4,635 | 15,220 | 17,396 |
|
|
|
|
|
|
|
|
|
|
|
|
|
|
| Dividends paid (including dividend distribution tax) | 2,599 | 2,598 | 2,793 | ||
Idea Cellular Limited: Segment Results
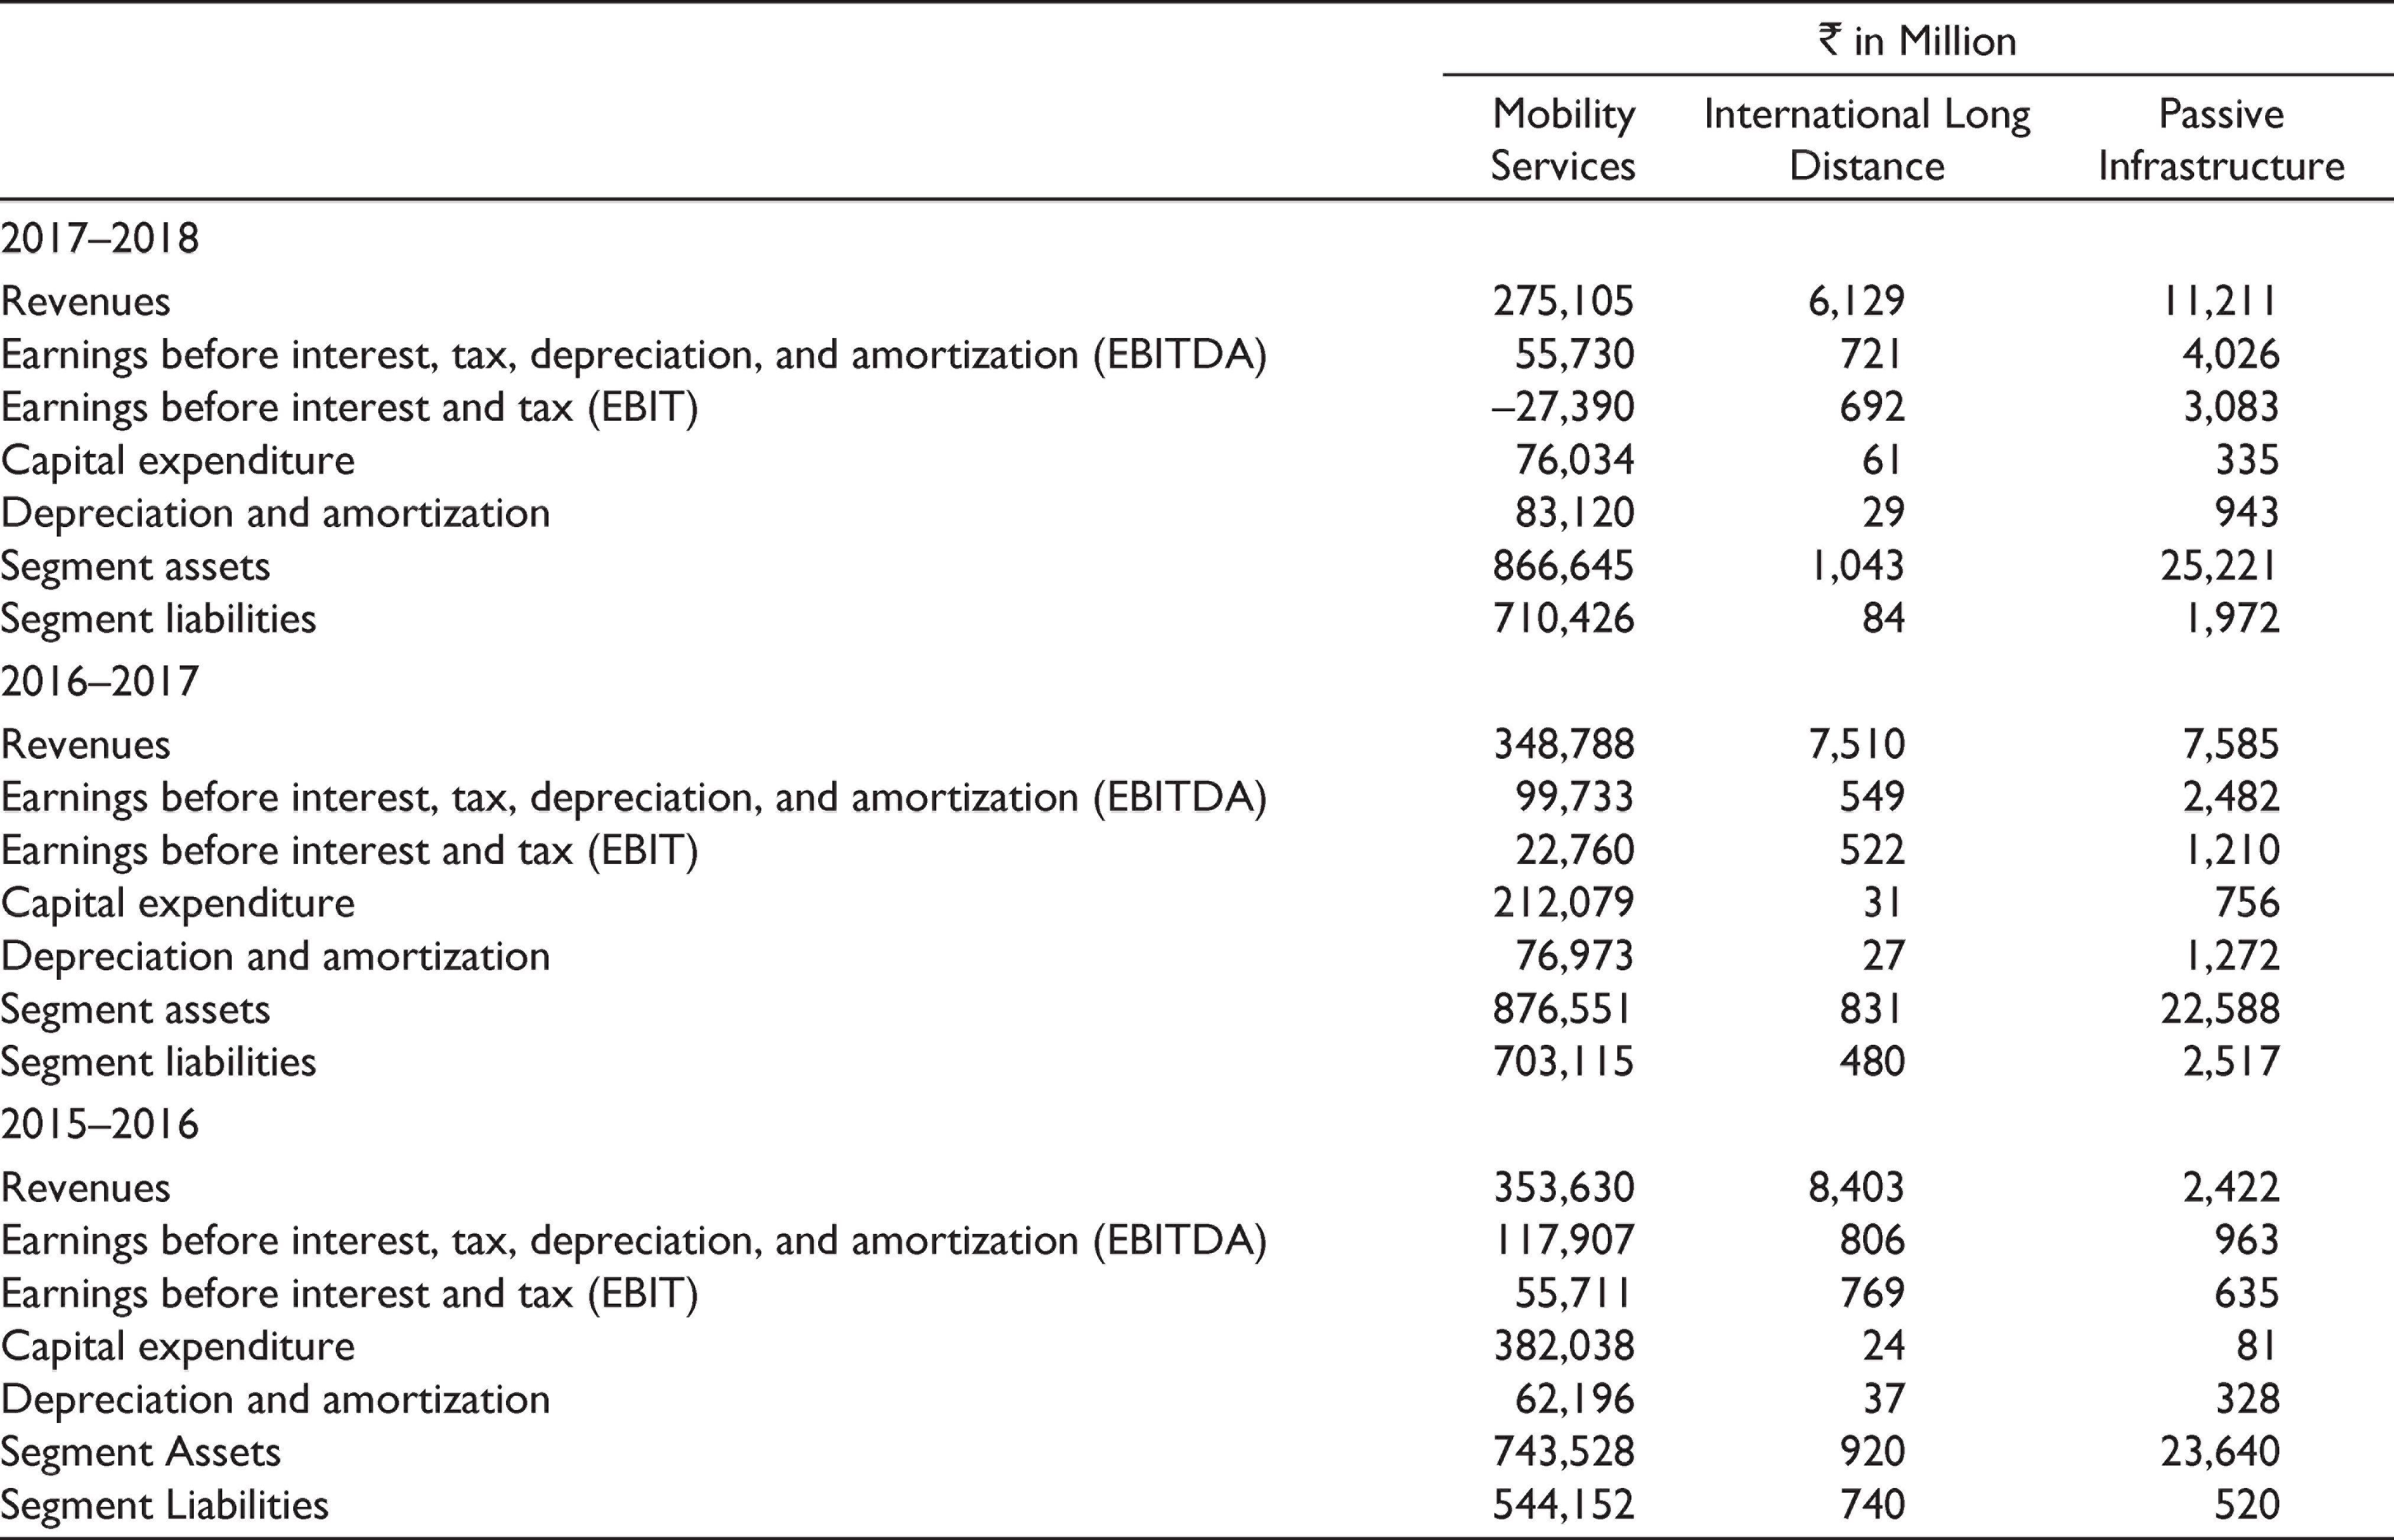
| ₹ in Million |
|||
| Mobility Services | International Long Distance | Passive Infrastructure | |
| 2017–2018 | |||
| Revenues | 275,105 | 6,129 | 11,211 |
| Earnings before interest, tax, depreciation, and amortization (EBITDA) | 55,730 | 721 | 4,026 |
| Earnings before interest and tax (EBIT) | –27,390 | 692 | 3,083 |
| Capital expenditure | 76,034 | 61 | 335 |
| Depreciation and amortization | 83,120 | 29 | 943 |
| Segment assets | 866,645 | 1,043 | 25,221 |
| Segment liabilities | 710,426 | 84 | 1,972 |
| 2016–2017 | |||
| Revenues | 348,788 | 7,510 | 7,585 |
| Earnings before interest, tax, depreciation, and amortization (EBITDA) | 99,733 | 549 | 2,482 |
| Earnings before interest and tax (EBIT) | 22,760 | 522 | 1,210 |
| Capital expenditure | 212,079 | 31 | 756 |
| Depreciation and amortization | 76,973 | 27 | 1,272 |
| Segment assets | 876,551 | 831 | 22,588 |
| Segment liabilities | 703,115 | 480 | 2,517 |
| 2015–2016 | |||
| Revenues | 353,630 | 8,403 | 2,422 |
| Earnings before interest, tax, depreciation, and amortization (EBITDA) | 117,907 | 806 | 963 |
| Earnings before interest and tax (EBIT) | 55,711 | 769 | 635 |
| Capital expenditure | 382,038 | 24 | 81 |
| Depreciation and amortization | 62,196 | 37 | 328 |
| Segment Assets | 743,528 | 920 | 23,640 |
| Segment Liabilities | 544,152 | 740 | 520 |
Vodafone Group Plc
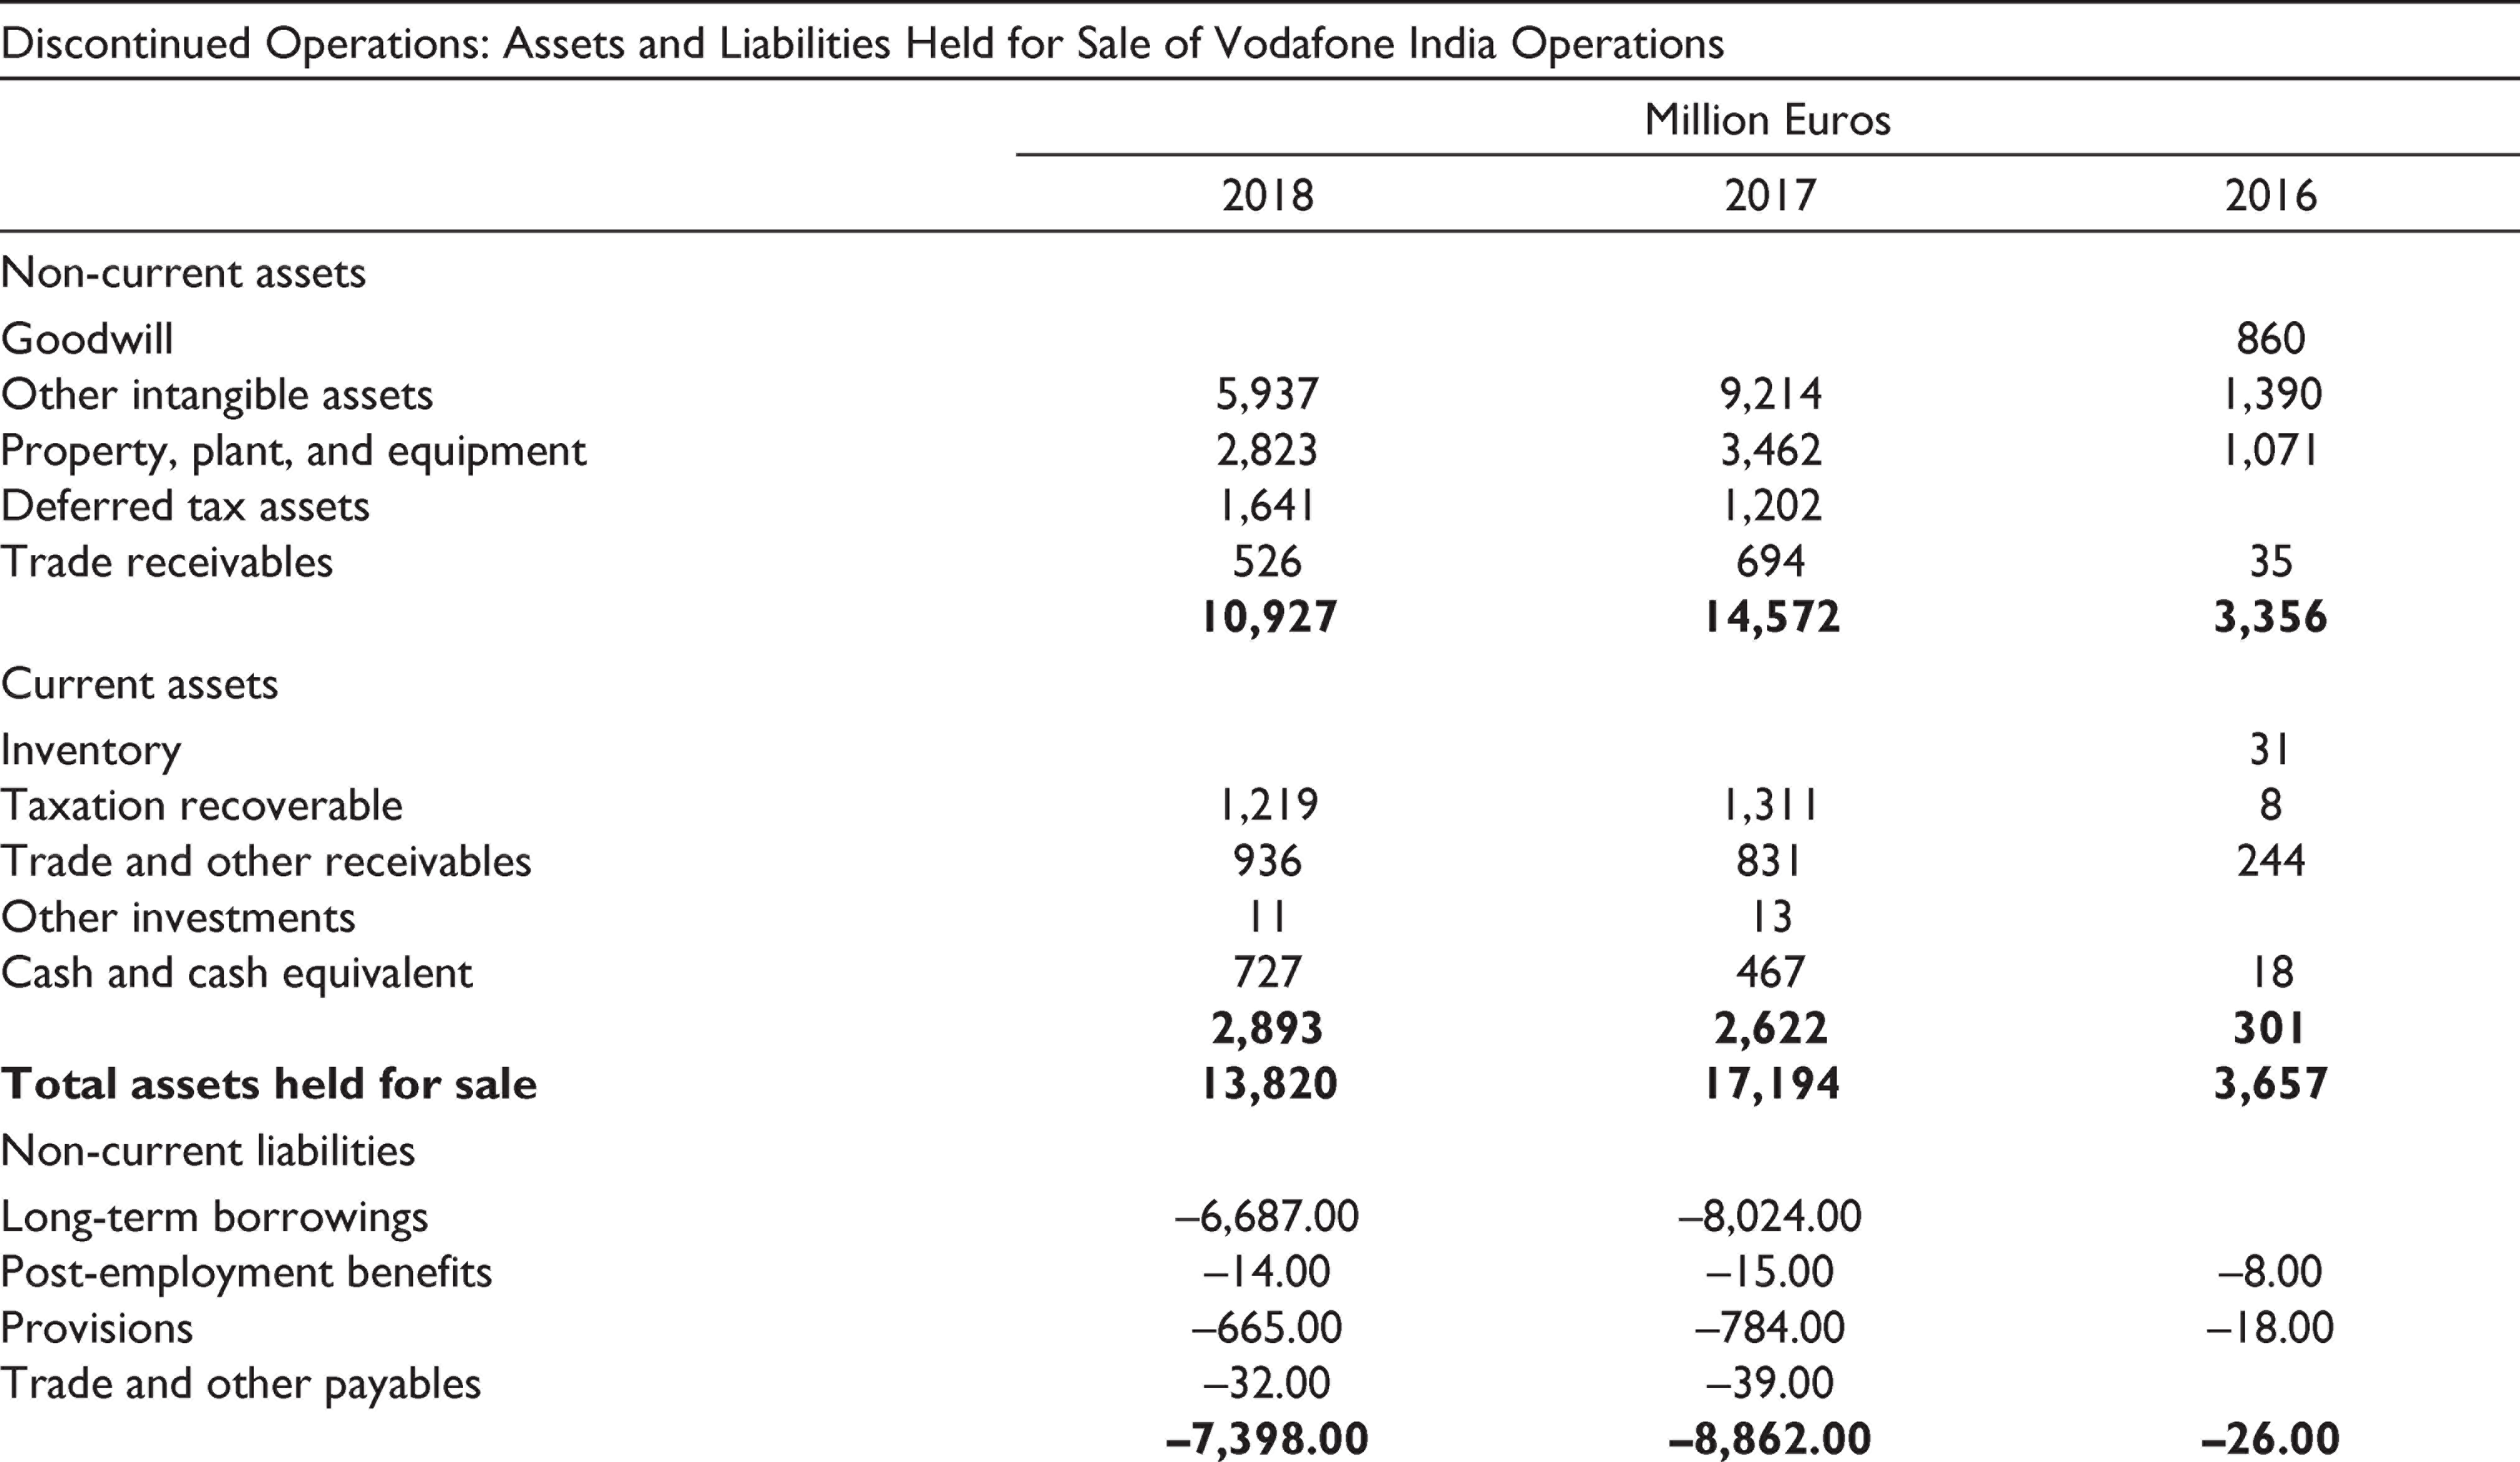
| Discontinued Operations: Assets and Liabilities Held for Sale of Vodafone India Operations |
|||
| Million Euros |
|||
| 2018 | 2017 | 2016 | |
| Non-current assets | |||
| Goodwill | 860 | ||
| Other intangible assets | 5,937 | 9,214 | 1,390 |
| Property, plant, and equipment | 2,823 | 3,462 | 1,071 |
| Deferred tax assets | 1,641 | 1,202 | |
| Trade receivables | 526 | 694 | 35 |
|
|
|
|
|
| Current assets | |||
| Inventory | 31 | ||
| Taxation recoverable | 1,219 | 1,311 | 8 |
| Trade and other receivables | 936 | 831 | 244 |
| Other investments | 11 | 13 | |
| Cash and cash equivalent | 727 | 467 | 18 |
|
|
|
|
|
|
|
|
|
|
| Non-current liabilities | |||
| Long-term borrowings | –6,687.00 | –8,024.00 | |
| Post-employment benefits | –14.00 | –15.00 | –8.00 |
| Provisions | –665.00 | –784.00 | –18.00 |
| Trade and other payables | –32.00 | –39.00 | |
|
|
|
|
|
| Current liabilities | |||
| Short-term borrowings | –1,756.00 | –1,139.00 | |
| Provisions | –18.00 | –25.00 | –5.00 |
| Trade and other payables | –1,827.00 | –1,768.00 | –407.00 |
|
|
|
|
|
|
|
|
|
|
Vodafone Group Plc
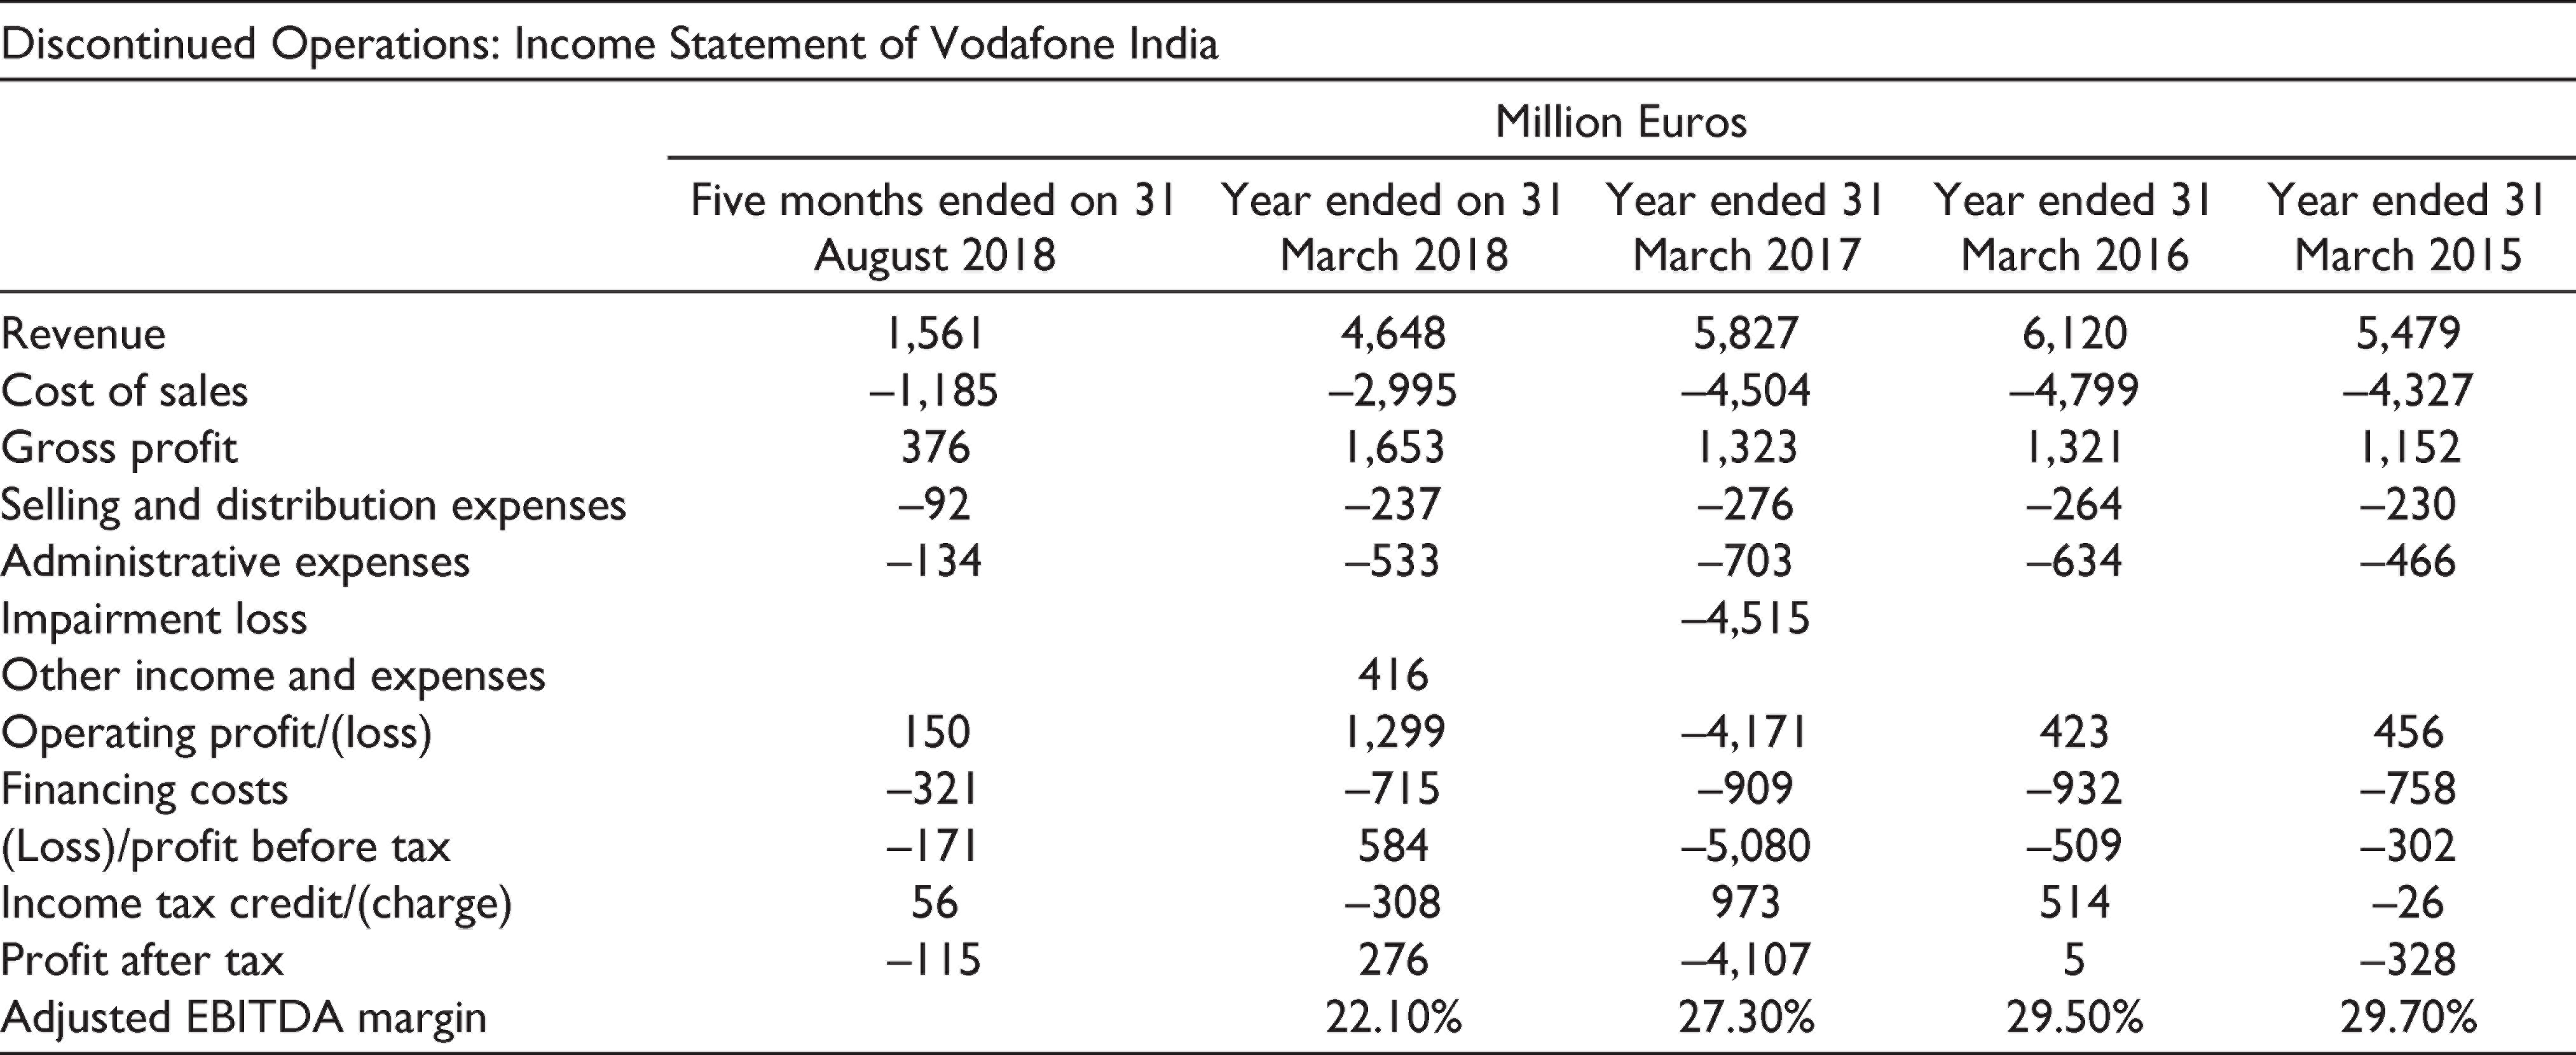
| Discontinued Operations: Income Statement of Vodafone India |
|||||
| Million Euros |
|||||
| Five months ended on 31 August 2018 | Year ended on 31 March 2018 | Year ended 31 March 2017 | Year ended 31 March 2016 | Year ended 31 March 2015 | |
| Revenue | 1,561 | 4,648 | 5,827 | 6,120 | 5,479 |
| Cost of sales | –1,185 | –2,995 | –4,504 | –4,799 | –4,327 |
| Gross profit | 376 | 1,653 | 1,323 | 1,321 | 1,152 |
| Selling and distribution expenses | –92 | –237 | –276 | –264 | –230 |
| Administrative expenses | –134 | –533 | –703 | –634 | –466 |
| Impairment loss | –4,515 | ||||
| Other income and expenses | 416 | ||||
| Operating profit/(loss) | 150 | 1,299 | –4,171 | 423 | 456 |
| Financing costs | –321 | –715 | –909 | –932 | –758 |
| (Loss)/profit before tax | –171 | 584 | –5,080 | –509 | –302 |
| Income tax credit/(charge) | 56 | –308 | 973 | 514 | –26 |
| Profit after tax | –115 | 276 | –4,107 | 5 | –328 |
| Adjusted EBITDA margin | 22.10% | 27.30% | 29.50% | 29.70% | |
Post 24 October 2019,Time Line of What Has Happened


| 25 October 2019 | In their stock exchange filing, Vodafone Idea disclosed DoT demand of ₹283.09 billion towards AGR dues. The details are: license fee—₹68.71 billion; interest on balance license fee—₹130.06billion; penalty—₹32.06 billion; and interest on penalty—: ₹52.76 billion |
| 26 October 2019 | The Supreme Court of India gave 3 months of time to telecom companies to deposit AGR dues. |
| 14 November 2019 | In their stock exchange filing, Bharti Airtel disclosed that they have created a provision of ₹284.5 billion by making a charge in their Q2 2019–2020 financial statements. The components are: ₹168.15 billion on account of license fee and ₹116.35 billion on account of spectrum usage charges (SUC). The balance outstanding in the financial statements as at 30 September 2019 are as follows: Principal—₹87.47 billion; interest—₹154.46 billion; penalty—₹37.6 billion; and interest on penalty—₹63.07 billion. |
| 18 November 2019 | COAI had sought relief from the government in payment of AGR dues stating that the telecom providers need ‘oxygen’. It had asked for a 3-year moratorium and an extended deadline for clearance of AGR dues. The 4G licences in the country had a remaining validity of 11 years. An additional 10 years to the remaining validity period was sought to repay the dues spread over this entire period. 36 |
| 21 November 2019 | Telecom dues liability of telecom companies on account of AGR definition dispute amounted to ₹1,470 billion. The components are: ₹926.42 billion on account of license fee and ₹550.54 billion on account of SUC. The AGR dues liability of leading telecom companies are as follows: Vodafone Idea—₹530.39 billion; Bharti Airtel—₹355.86 billion; Reliance Communications—₹204.34 billion; Tata Tele Services—₹138.23 billion; and Aircel—₹107.43 billion. |
| 16 January 2020 | The Supreme Court of India dismissed the review petition filed by the Association of Unified Telecom Service Providers of India against the Order dated 24 October 2019 in the AGR case. |
| COAI expressed disappointment over dismissal of review petition. It stated that telecom sector has a debt burden of ₹4,000 billion. Taxation rates on telecom sector range between 29% and 32%. COAI added that dismissal of the petition added to ‘financial distress’ of the sector and expressed apprehensions on the recovery and future viability of the sector. 37 | |
| 14 February 2020 | The Supreme Court of India observed that non-payment of AGR dues by telecom companies tantamount to violation of its order in pith and substance and took a serious note of it. Show-cause notices for contempt proceedings were issued to directors of telecom companies and the DoT official who ‘passed an order’ stating that non-payment of AGR dues by January 23 2020 (3-month deadline) would not invite coercive action against the telecom companies. 38 |
| 15 February 2020 | In its filing with the National Stock Exchange (NSE) on 15 February 2020, Vodafone Idea informed that: ‘As disclosed in the Company’s financial statements for quarter ending December 31, 2019, the Company’s ability to continue as a going concern is essentially dependent on a positive outcome of the application for modification of the Supplementary Order’. |
| 17 February 2020 | Bharti Airtel paid a sum of ₹100 billion to DoT towards AGR liability |
| 17 February 2020 | Vodafone Idea paid a sum of ₹25 billion to DoT towards AGR liability |
| 20 February 2020 | Vodafone Idea paid further a sum of ₹10 billion towards AGR liability. |
| 29 February 2020 | Bharti Airtel paid a sum of ₹80.04 billion to DoT towards AGR liability (₹30.04 billion) and ad-hoc difference to cover any difference in liability (₹50 billion). |
| 4 March 2020 | DoT sent notices to telecom companies for payment of balance AGR dues. The demand notice refers to the Supreme Court orders dated October 24 2019 and February 14 2020. Telecom companies had made part payments based on self-assessment of AGR dues which were considerably less than the liability calculated by the government. DoT asked for documents/details for reconciliation. 39 |
| 14 March 2020 | In their stock exchange filing, Bharti Airtel disclosed that they have created a provision of ₹10.48 billion on account of interest as an exceptional item by making a charge to their Q3 financial statements. |
| 18 March 2020 | The Supreme Court of India termed self-assessment of AGR dues by telecom companies, as violation of its order dated 24 October 2019. AGR dues short paid for the past 20 years, was a ‘public money’ and it had to be paid. The DoT’s plea on fixing ‘reasonable time’ for making payment of AGR dues was rescheduled. |
| 11 June 2020 | The Supreme Court of India asked telecom companies to submit a roadmap in terms of time for payment of AGR dues, and undertakings, guarantees, and securities to be furnished to honour the commitment. |
| 16 June 2020 | Both Bharti Airtel and Vodafone Idea requested for 20 years of time to make the payment of remaining AGR dues.40,41,42 |
| 18 June 2020 | The Supreme Court of India directed the telecom companies: (i) to file audited financial statements, income tax returns, AGR dues paid for the last 10 years; and (ii) to substantiate genuineness, make payment of reasonable amount of AGR dues before the next date of hearing. 43 |
| 1 September 2020 | The Supreme Court of India allowed the relief in payment schedule of past AGR dues while considering the submissions of different stakeholders. Any reassessment of the current AGR liability was disallowed and mandated that the dues be paid punctually and in toto. The telecom companies have been directed to pay 10% of the AGR dues by March 31 2021 and the remaining AGR dues in yearly instalments beginning 1 April 2021 up to 31 March 2031 and payable by March 31 of every succeeding financial year. 44 |