



Abstract
Online food delivery services (OFDs) have been growing steadily in India since the early 2000s, posing concerns about unhealthy eating behaviours and contributing to the rise of non-communicable diseases. Menu designing based on the principles of the ‘menu theory’ rarely emphasize the need to provide nutritional information or promote healthy eating behaviours. In this article, we characterized the restaurants and food items listed in a major Indian OFD service and describe the nutritional quality and price of different categories of food items. We conducted a cross-sectional study of all restaurants listed on the website of one of India’s largest OFD service during December 2020. A stratified random sample of 8,504 restaurants was obtained and the nutritional quality of all listed food items was extracted. We found that fast-food restaurants sold foods with the lowest price (Indian national rupee [INR]) [100 (IQR: 66, 150)] but with the highest calories (kilocalorie [kcal]) [194 (IQR: 130, 309)] and fat (g) [9 (IQR: 5, 16)]. Chinese cuisine restaurants sold more ‘soups and salads’ and served items with the second lowest calories per item served (kcal) [154 (IQR: 121, 230)], next only to Indian cuisine restaurants (kcal) [151 (IQR: 118, 210)]. Restaurants with high average cost (>400 INR for two) served items with lower calories (kcal) [155 (IQR: 113, 226)] and had a higher proportion of healthier items on their menu but restaurants with higher median calories per item and a higher median price per item had higher average customer ratings. In conclusion, it can be said that restaurants that served items with the highest calories and fat were also the cheapest. There is a need to increase the number of affordable and healthier options on the menu of OFD restaurants to improve dietary consumption of Indians.
Introduction
Status of Online Food Delivery Services
Online food delivery services (OFD) are a multi-billion-dollar industry worldwide and are expected to grow rapidly in the coming years. In 2021, the global revenue from OFD services was projected to be more than US$150 billion (Grand View Research, 2021; Statista, 2021d). In India too, the OFD market has been growing steadily since the early 2000s with a few large companies occupying a major share (Samuel Anbu Selvan & Andrew, 2021).
By virtue of offering more control over the ordering process and convenience, online ordering of food has been increasing (Dana et al., 2021; Kimes, 2011). This consumer behaviour is enabled by the increasing prevalence of smart-phone use and the availability of internet (Khan et al., 2021). Employed young people with enough disposable incomes, who live away from their families are the major consumers of OFD services because they enjoy the time and effort saved by online ordering (Statista, 2021a). These factors make India a perfect market for OFD services as it has a relatively young population (Office of the Registrar General & Census Commissioner, 2021a), with deep penetration of smart-phones and internet (Statista, 2021b; 2021c) along with a consistent increase in the gross national disposable income over the years (Reserve Bank of India, 2021b). Consequently, eating food from restaurants has become an increasingly common behaviour in India (Ali & Nath, 2013; Gaiha et al., 2013). OFD services that offer a better choice of restaurants, better discounts, on-time delivery and better customer services are much sought after by the Indian populace (Das, 2018).
Health Impact of Online Food Ordering
Eating food away-from-home encourages poor dietary habits like excessive reliance on fast food and lack of fresh vegetables and fruits in the diet leading to an increase in body mass index (Keshari & Mishra, 2017; Nguyen & Powell, 2014; Patel et al., 2017). The proportion of calorie intake from away-from-home food has been increasing steadily in the USA in the last four decades. About 4%–10% of calorie intake in adults now come from restaurants (Guthrie et al., 2002; Powell et al., 2012). Foods in restaurants and OFD services are known to be of high calories and poor nutritional value (Auchincloss et al., 2014; Poelman et al., 2020) and have generally known to promote unhealthy eating (Horta et al., 2021). There are very few healthier options on most restaurants’ menus owing to concerns about poor demand, high labour costs and lower profit margins (Glanz et al., 2007). This is very important for population health because poor dietary habits are a major risk factor for obesity, cardiovascular diseases and cancers, among others (Afshin et al., 2019).
Theoretical Background for the Study
Menu designing in restaurants is guided by the well-established ‘menu theory’ (Seaberg, 1990). According to this theory, customer choices are strongly influenced by the attributes of the menu and how they are designed. Attributes like pricing, popularity, description, positioning, length, options and variety are key to deciding what a customer chooses to order. However, nutritional value of food items is not a widely recognized attribute of menu designing. The spread of items on a restaurant menu are not dictated by nutritional value but mostly by price and popularity of the item. It has been hypothesized that regardless of all other attributes of menu designing, the consumer will always be price sensitive. It stands to reason that sellers may be weary of discouraging consumers to some of their items which may be seen as unhealthy due to their high calorie content. Therefore, regulatory bodies are now trying to introduce this as a legal requirement by restaurants and OFDs in the near future (Food Safety and Standards Authority of India, 2022). Before such regulations are introduced, we need to analyse the restaurant menus available on OFDs in terms of their price and nutritional value. This will help us understand the choices available to the consumers of OFDs and advocate for designing restaurant menus that enable consumers to choose healthy food items and improve health in the long run. This will also help us to monitor the changes that sellers make to their menus to comply with regulations and/or provide healthier options to their consumers.
Menu theory has provided a roadmap to design menus that attract the customers and make them choose or not choose a particular food item. A large part of the design philosophy focusses on the costing and pricing of the food items to maximize the profits for the seller (BC Cook Articulation Committee, 2015). The art of pricing the menu is considered a ‘a major marketing tool in the business’ (Egan, 2022, Chapter 8). Almost all the principles laid out in the ‘menu psychology’ are about making people choose items which maximize restaurants’ profits. These are typically best-selling items with a high profit margin, the so-called ‘stars’ of the restaurant. Little to no attention has been paid to promote a healthier eating practice in menu designing (Food and Drug Administration, 2014). Unless it is mandated by a regulatory agency, display of nutritional information on restaurant menus does not happen. The need and motivation to display such information by restaurant owners and to ask for or consume such information by the customers is not widespread in developing countries including India. Therefore, it becomes necessary to examine the current dynamics of price and nutritional value of food items available in restaurants and understand how they affect each other. This knowledge will help us to compare the changing price dynamics in the event of a regulation requiring restaurants to display such nutritional information (Food Safety and Standards Authority of India, 2022).
Rationale for the Study
Currently, studies on OFD services from India focus only on the market aspects, customer expectations and consumer behaviour. There is a need to understand the profile of food items that are available in the OFD platforms because consumers’ choices are restricted by what is available. In addition to the availability and affordability, nutritional value of the food items influences their choice (Ellison et al., 2013). Further, OFD services have not been looked at from a nutritional or health-related angle. This is essential to provide inputs for policy and guide OFD services and restaurant managements to promote healthy eating by consumers. In the long run this will have far-reaching implications for the control of obesity and non-communicable diseases in India.
Objectives of the Study
The objectives of this study were threefold—(a) to describe the characteristics of the restaurants and food items listed in a major OFD service in India, (b) to assess the relationship between nutritional value (in terms of calorie, protein, carbohydrate, fat and fibre contents) and the price of food items across different food categories (such as main course, beverage and dessert, soup and salad, combo and snack) and (c) to assess the relationship between restaurant characteristics and different food categories, nutritional value and price.
Methods and Materials
Study Setting (Description of the Application)
An online food ordering/delivery system is an online service/software (available via a website or a mobile-based application) that lets restaurants, coffee shops, fast food outlets or beverage shops accept online orders from customers. It typically allows customers to choose and pay for food and then alerts the restaurant when an order is made. For providing this service the application charges a fee from the restaurants and delivery fee from the customers. The online food delivery platform included in this study was established in 2010 in India. Its technology platform ‘connects customers, restaurant partners and delivery partners’. Customers can use the platform to search and discover restaurants, read and write customer-generated reviews and view and upload photos, order food delivery, book a table and make payments while dining out at restaurants. The platform also provides restaurant partners with marketing tools which enable them to engage and acquire customers to grow their business while also providing a reliable and efficient delivery service. This platform holds 45% of the market share in India, with over 1.5 million orders per day and is currently valued at nearly US$10 billion.
Study Design and Sampling
We conducted a cross-sectional study of restaurants listed on a major OFD service in India and performed nutritional profiling of foods items listed in a stratified random sample of restaurants. We selected an OFD service based on its market share and duration of operation. We calculated the sample size to estimate the mean calorie content of a food item available in the sampled restaurants by assuming that the mean calorie content of an average restaurant meal will be 1,205 ± 465 calories. The calculated sample size was 333 restaurants (Urban et al., 2016) and we randomly sampled 333 restaurants within each state/union territory (UT). If a state/UT had less than 333 restaurants, we included all the restaurants. Within the sampled restaurants, we collected nutritional information for all the menu items.
Operational Definitions
Data Extraction
Data was collected from the website of the OFD service from 1 to 30 December 2020. For the data extraction to work without preference for location, no user accounts were used. All restaurants listed on the website and their characteristics such as location, cuisines offered, timings, vegetarian only status, average cost for two, ratings and other information were extracted before sampling. Each food item listed in the menu of the restaurants was analysed as a distinct entity within several grouping variables. These grouping variables included different characteristics such as whether vegetarian food or not, food category (combo, dessert and beverage, main course, snack, soup and salad, or others), tags given by the service (recommended, bestseller, new item, chef special, must try, healthy), whether discounted or not, price (>400, 201–400 or ≤200) and nutritional value (calorie, protein, carbohydrate, fat and fibre). The nutritional value was only extracted for all food items with a frequency of at least 100 occurrences across the sampled restaurants. The nutritional content of the food items was extracted by entering the items’ names into either one of the two nutritional value calculating applications—HealthifyMe® and National Institute of Nutrition’s ‘Count What You Eat’ (HealthifyMe Private Limited, 2021; ICMR & National Institute of Nutrition, 2021). Calorie, carbohydrate, protein, fat and fibre content of the food items was extracted and tabulated for each item. All costs were described in INR.
Statistical Analyses
We provided frequencies and percentages for categorical variables and median and inter-quartile range (IQR) for continuous variables. We compared median (IQR) nutritional value of food items across the different restaurant and food item characteristics and tested their statistical significance using Kruskal–Wallis test. A p-value of <0.05 was considered to be statistically significant. To demonstrate the relationship between cost of food item and its calorie content, we produced scatterplots with calorie content in the x-axis and cost in the y-axis for each category of food item. For spatial analysis, we presented the state-wise density of the restaurants per 100,000 population and the point locations of all the restaurants (using latitude and longitude information). We performed the analyses using Python v. 3.6.10, R v.3.6.3 and QGIS v 3.16.
Results
Characteristics of Restaurants
The data extraction process yielded 93,424 restaurants distributed across 143 cities of India. The spatial distribution of the restaurants listed in the online food delivery app and their density per 100,000 population across these states is presented in Figure 1. Chandigarh had the highest density of restaurants among states/UTs studied and Mumbai had the highest density of restaurants per lakh population among cities.

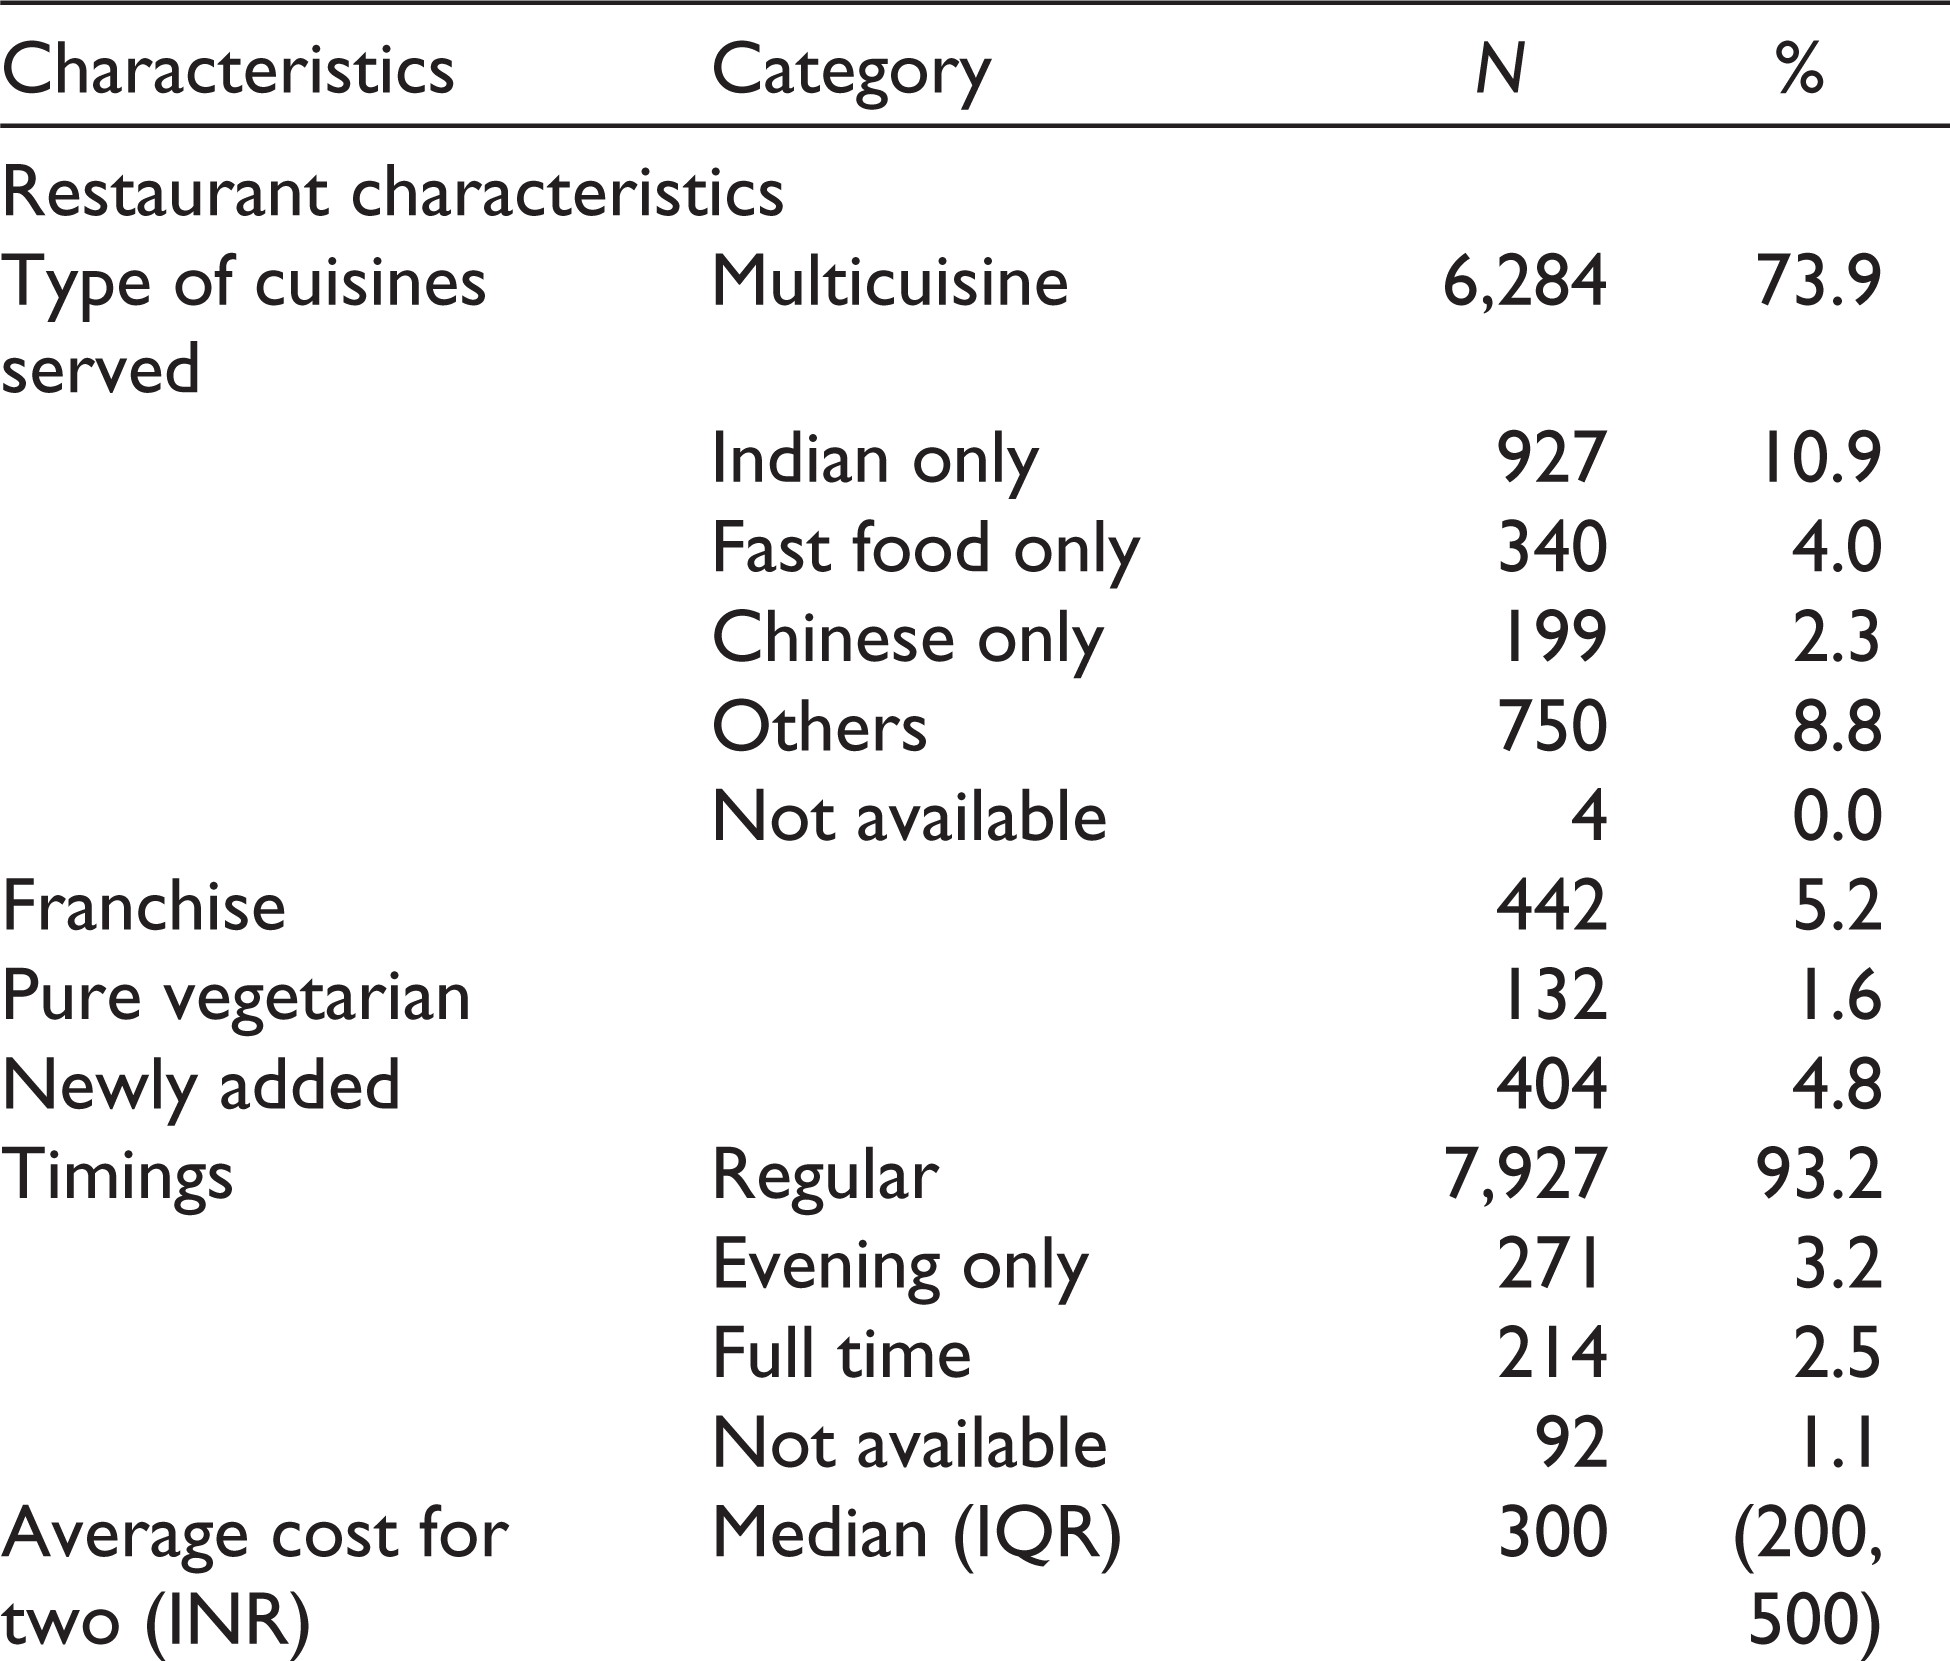
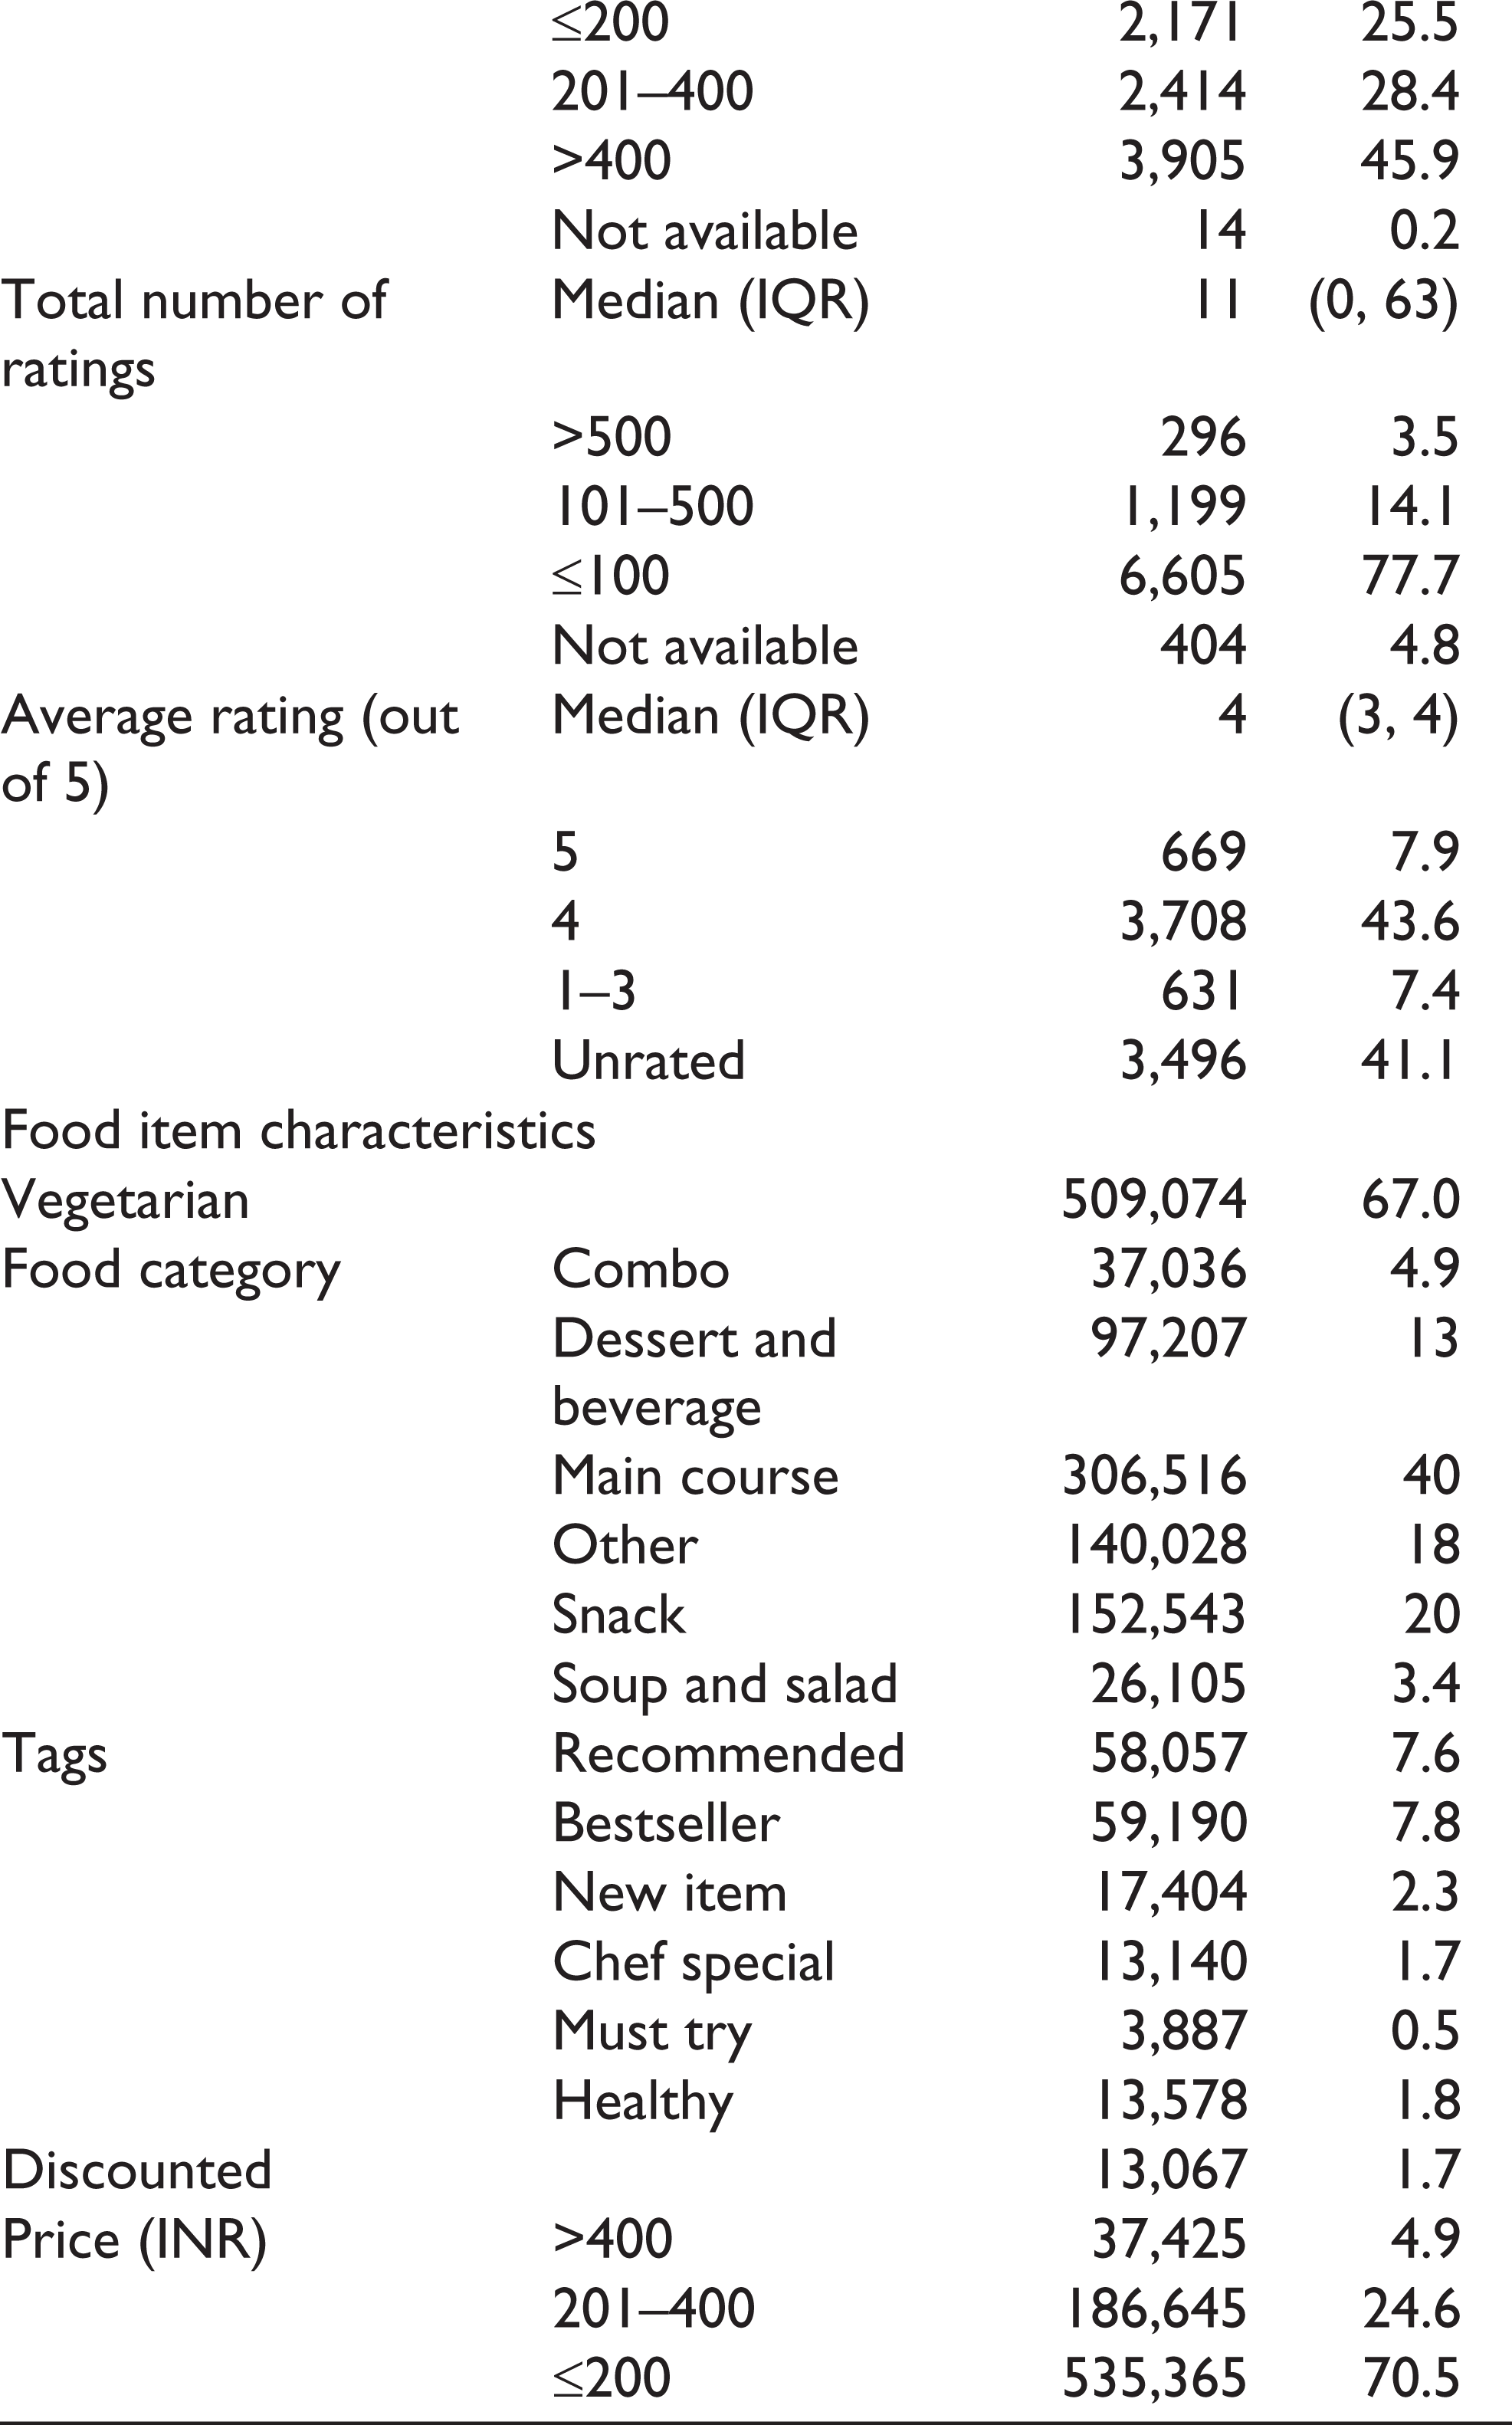
Of the 8,504 sampled restaurants, 442 (5.2%) were franchises, 132 (1.6%) were vegetarian only and 6,284 (73.9%) were multicuisine restaurants (Table 1). The median (IQR) cost (INR) for two was 300 (200, 500) among the restaurants. While 3,494 (45.1%) restaurants were unrated, the median (IQR) rating was 4 (3, 4) among those restaurants which were given a rating.
Characteristics of the Restaurants (n = 8,504) and Food Items (n = 759,435) in an Online Food Ordering Application, India, 2020
Characteristics of Food Items
Among 759,435 food items listed in the sampled restaurants, 509,074(67%) were vegetarian and 535,365 items had a cost of <200 INR (Table 1). Main course (40%) followed by snack (20%) were the most common categories of the items listed. We were able to extract the nutritional value information for 531,809 out of the 759,435 food items.
Nutritional Value and Pricing of Food Items
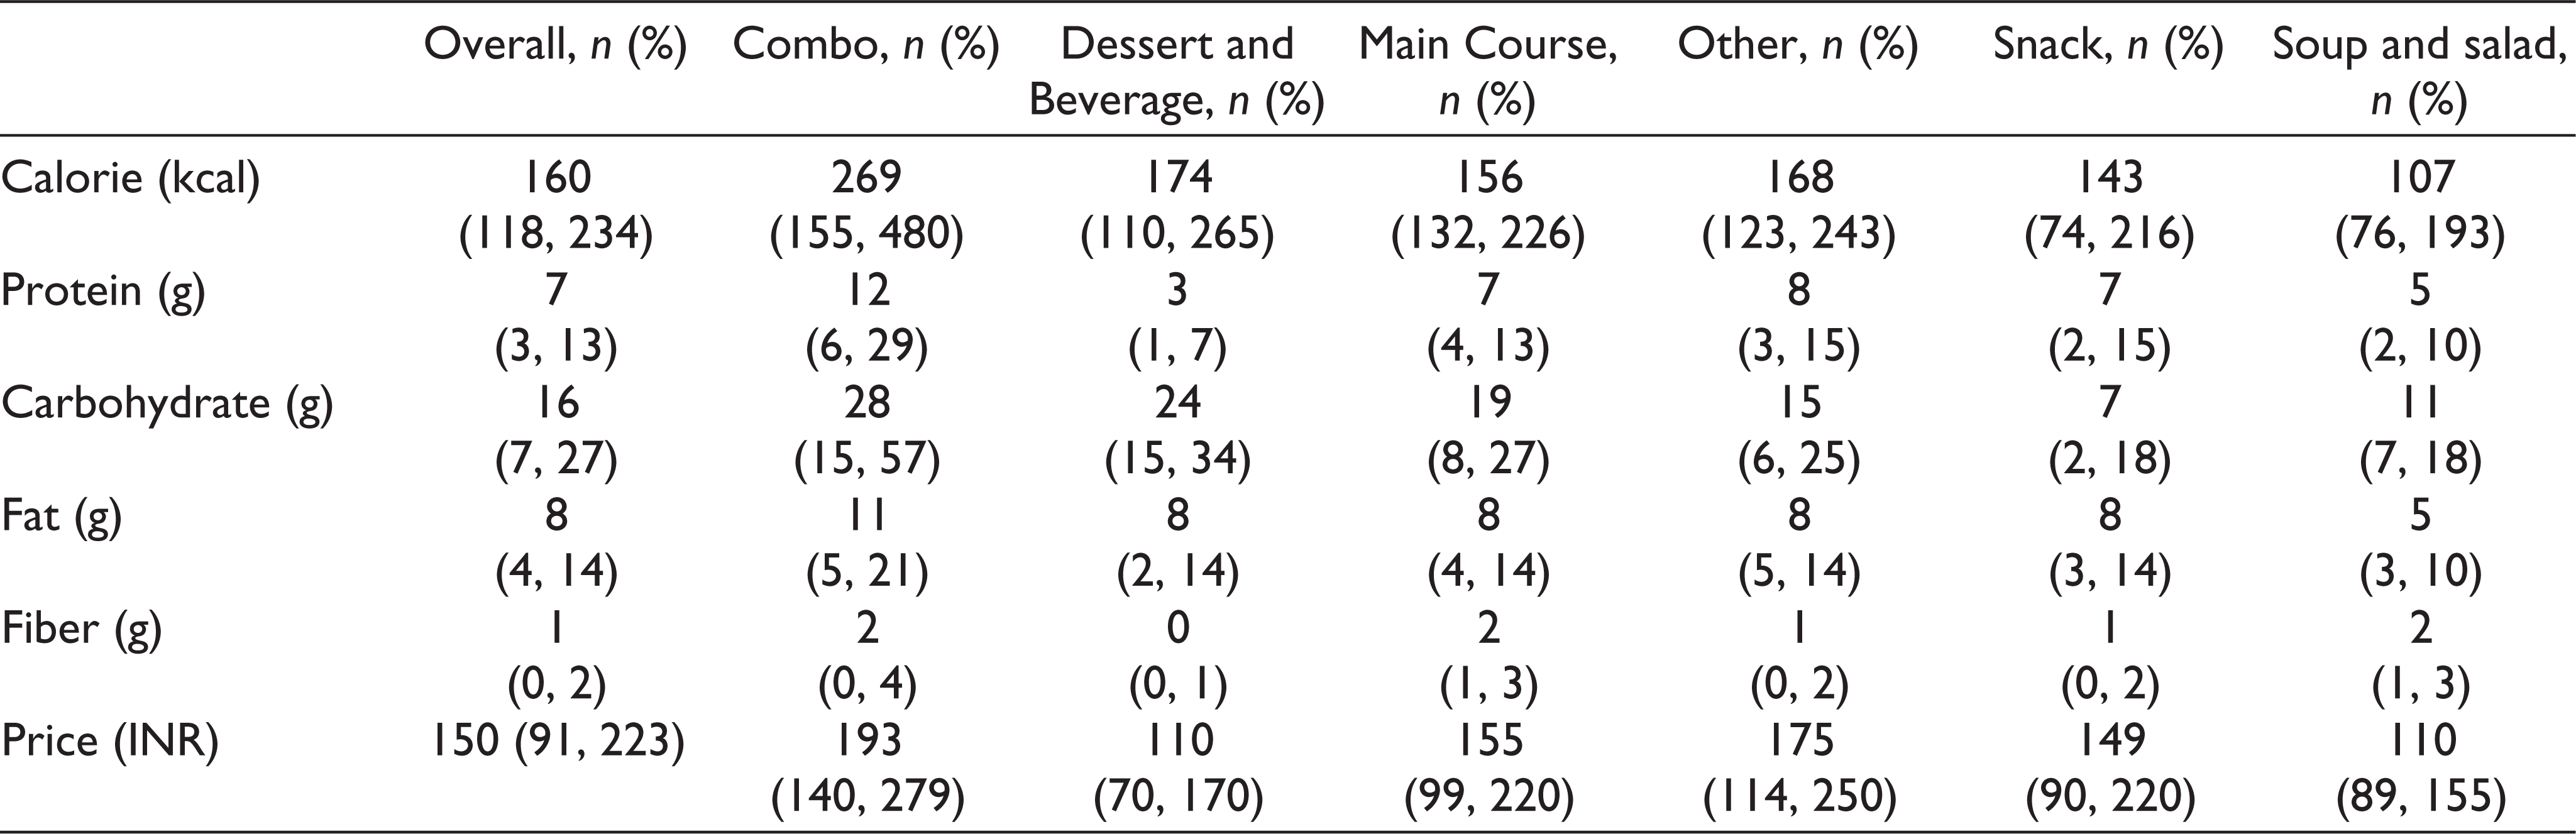
The median (IQR) highest calorie (kcals) content per item was observed for combos (269; 155, 480) followed by desserts & beverages (174; 110, 265). Soups and salads had the least median calories (107; 76, 193) and were priced lowest (110; 89, 155) as well (Table 2).
Nutritional Value of Different Food Categories in Sampled Restaurants in an Online Food Ordering Application, India, 2020 (n = 531,809)
Vegetarian items, items tagged as healthy had lower calorie values and lower prices than their counterparts (p < 0.01). Items tagged as recommended, best seller, new, must try and chef special had significantly (p < 0.05) higher calorie content compared to those not tagged so (Supplementary Table S1a and b). These categories of items, except those tagged must try, were also priced significantly (p < 0.01) higher than those not tagged.
While analysing nutritional value by restaurant characteristics, Indian cuisine restaurants (151; 118, 210) followed by Chinese cuisine restaurants (154; 121, 230) served items with the lowest median (IQR) calorie content of food. Across all restaurant categories, soups and salads comprised the least proportion of all item categories served, except at Chinese cuisines where desserts and beverages constituted the lowest proportion (1.4%) of items served (Table 3).
Distribution of Food Categories by Different Restaurant Characteristics in Sampled Restaurants in an Online Food Ordering Application, India, 2020 (n = 759,435)

Relationship Between Cost and Calorie
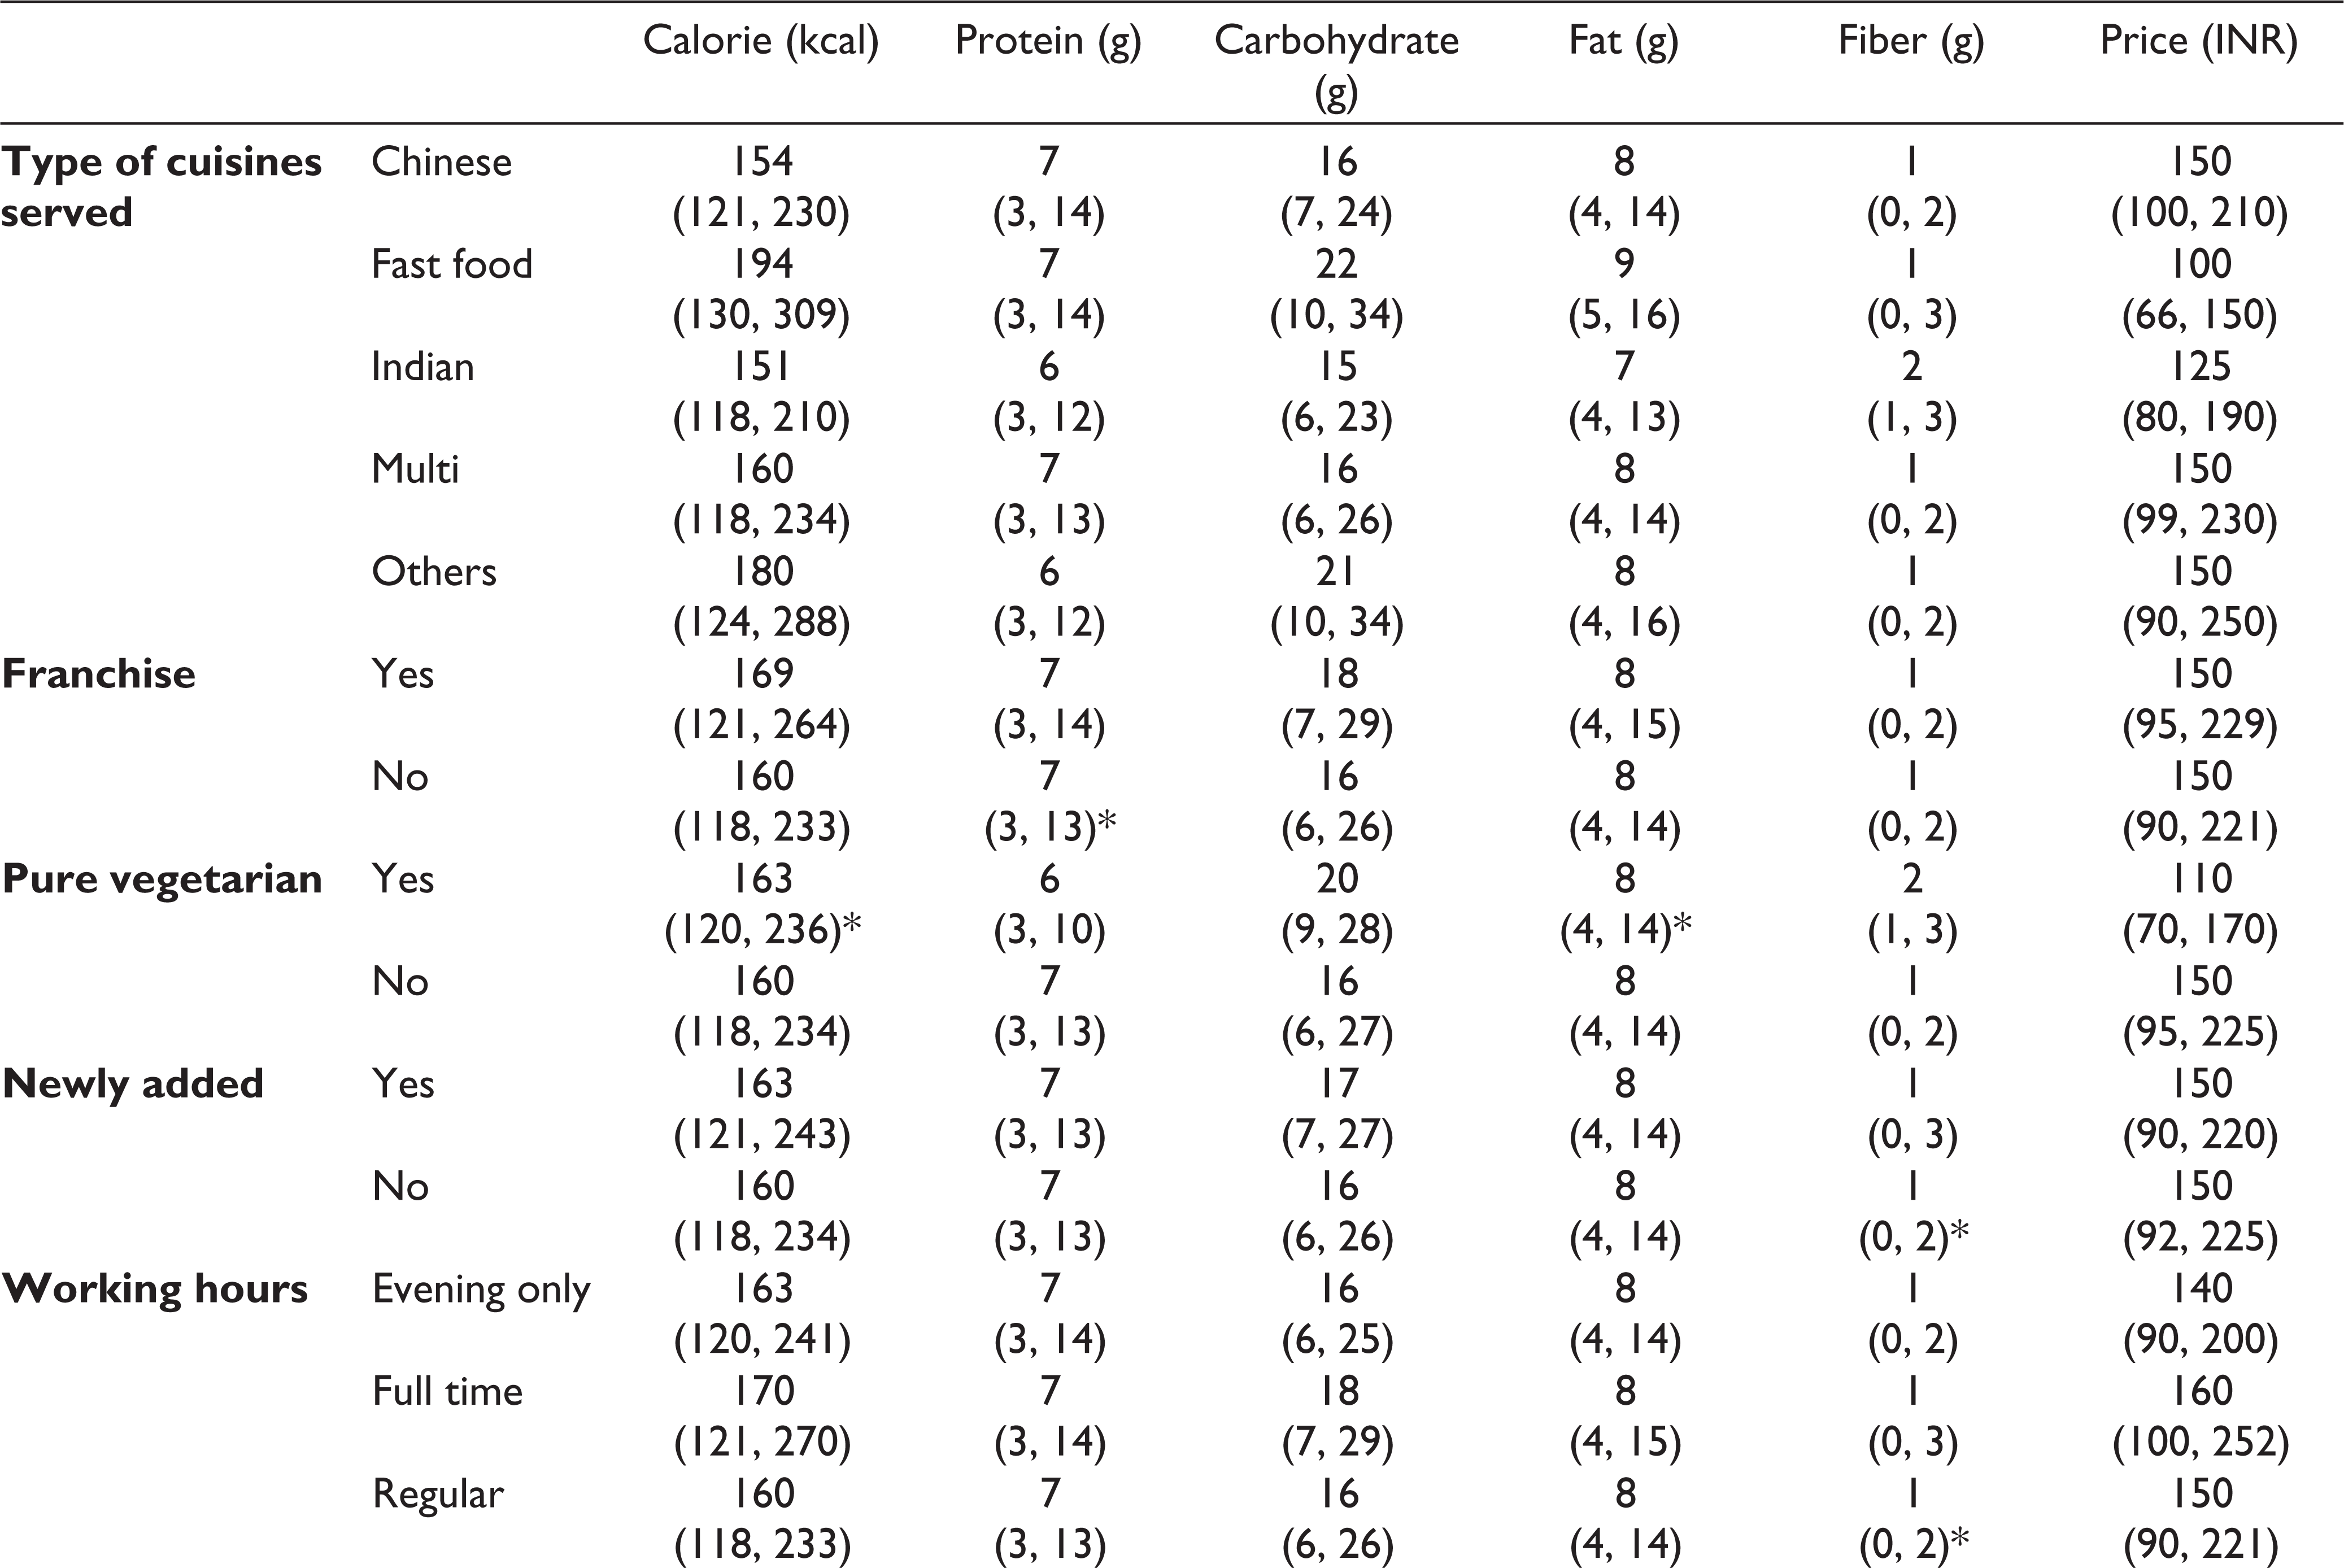
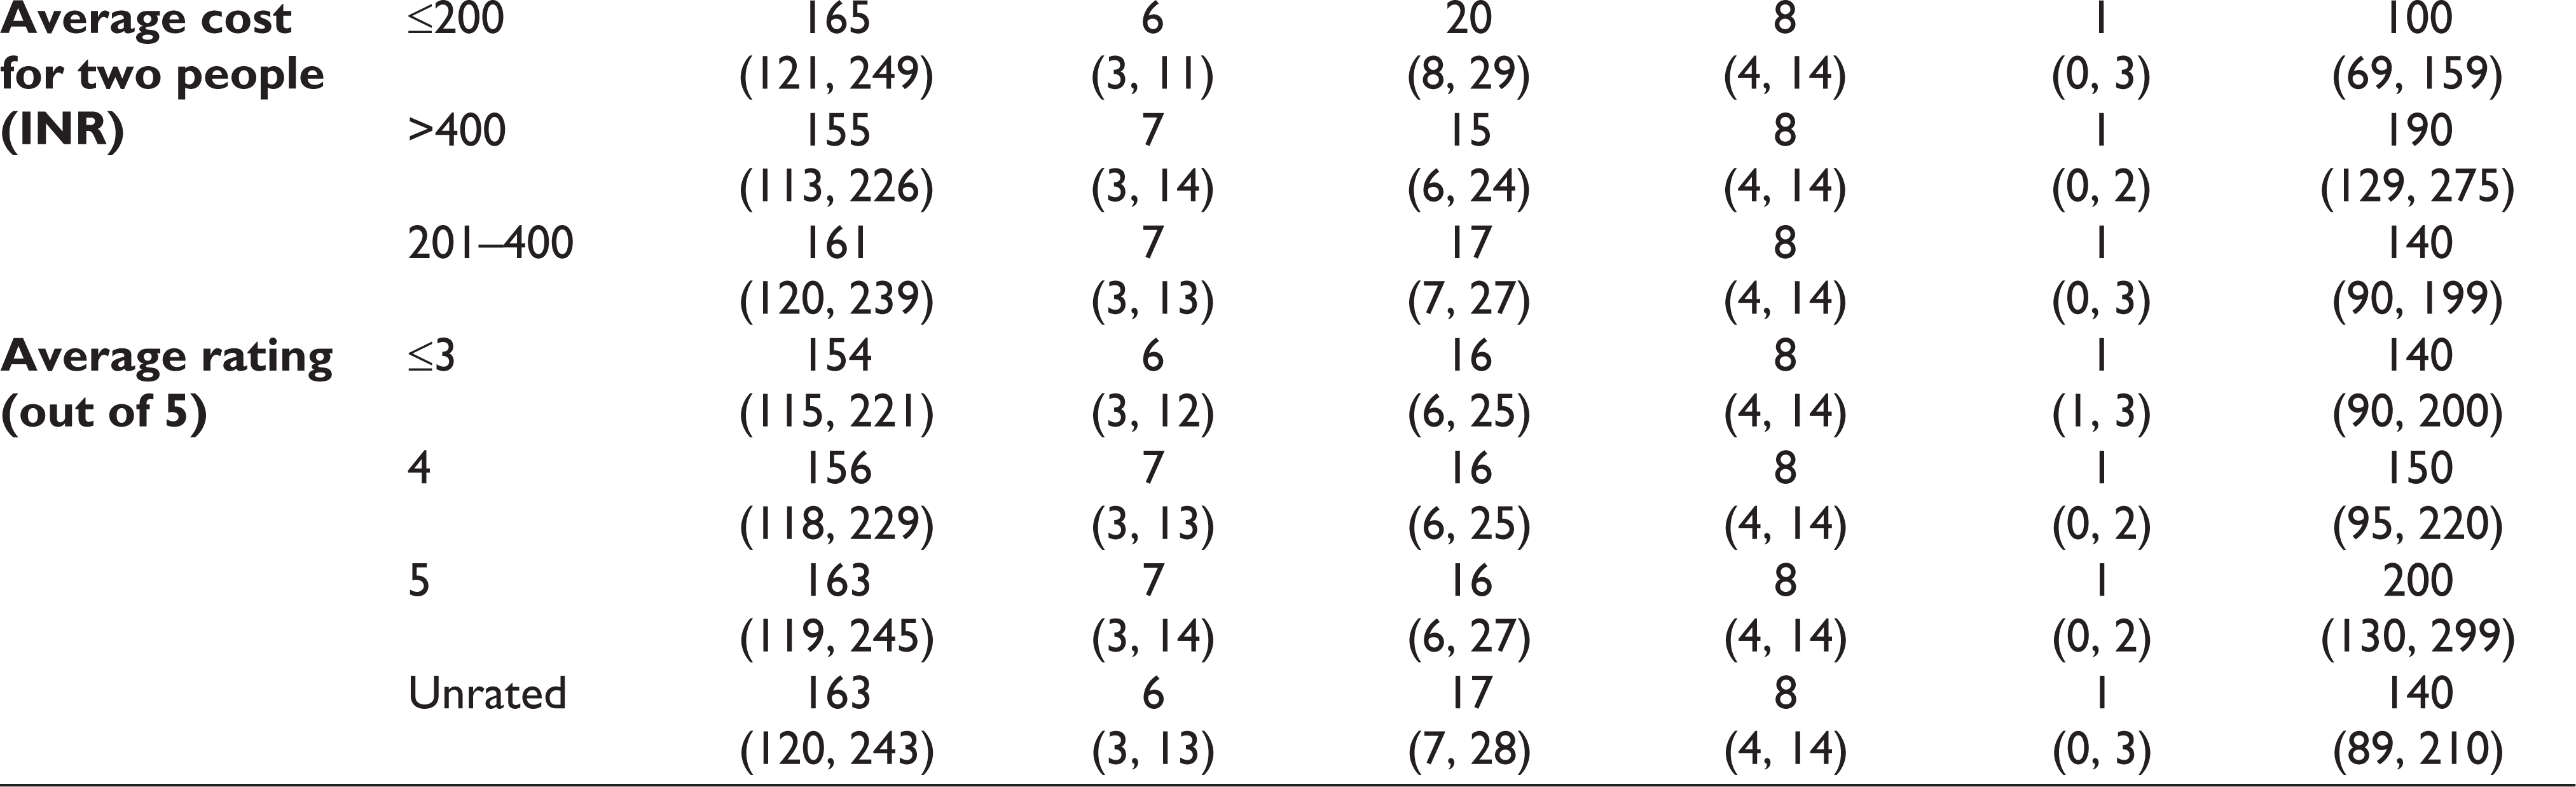
Items served in fast food restaurants had the highest median (IQR) calorie content (194; 130, 309) but were priced the least (median price 100 INR) compared to other cuisines (Figure 2 and Table 4). Restaurants with the average cost for two ≥400 INR had the highest proportion of soups and salad (5%) and items with the lowest median (IQR) calories; (155; 113, 226; Tables 3 and 4). The median (IQR) price per item was highest (200; 130, 299) in restaurants with an average rating of 5 but also served items with higher median (IQR) calories (163; 119, 245).

Median (IQR) Nutritional Value and Price of Food Items by Different Restaurant Characteristics in Sampled Restaurants in an Online Food Ordering Application, India, 2020
Discussion
Summary of the Study Findings
Our cross-sectional data analysis of 759,435 items sold in 8,504 randomly sampled restaurants across India show that the restaurants classified as selling fast food only were serving food items that were priced lowest but had the highest calories and fat content. Restaurants with higher average cost for two served items with lower calories and had more healthier items on their menu.
Characteristics of Restaurants
Density of restaurants in a location have been found to correlate positively with consumption of refined grains, desserts, fruit juice and sugar-sweetened beverages (Patel et al., 2017). The highest density of restaurants in our study was observed in UTs such as Delhi, Puducherry and Chandigarh and Goa state. These UTs have some of the highest per capita gross domestic product (GDP) than any state in India which could reflect on their purchasing power (Reserve Bank of India, 2021a). These places also have the highest proportion of urban population in the country—National Capital Territory of Delhi (97.5%); UTs of Chandigarh (97.2%) and Puducherry (68.3%); and Goa state (62.2%) (Bren d’Amour et al., 2020; Reserve Bank of India, 2021a). Urbanization and higher purchasing power have been linked with more eating-out behaviour and having different socializing behaviours (Meenakshi & Darda, 2019; Samuel Anbu Selvan & Andrew, 2021). Other reasons could be due to the high population density, larger migrant population (Office of the Registrar General & Census Commissioner, 2021b) dependence on restaurant food, higher workforce participation by women, smartphone (Council for Social Development, 2017) and internet usage (International Institute for Population Sciences, 2021), age composition of the resident population and their socioeconomic status, preferences for other culinary specialties and socializing behaviours which have not been studied in our study. It could also be possible that the OFD in this study was more popular in certain locations capturing more restaurants in a given geographical area than others.
Nutritional Value and Pricing of Food Items
Franchise outlets were found to serve items with higher calories compared to non-franchise outlets (Supplementary Table S2a and b). This could be due to the significantly higher proportion of combo meals served at these restaurants compared to the non-franchise outlets. Similar observation was held by Partridge et al in Australia and New Zealand where the franchise outlets were more likely to offer items that are classified as unhealthy (Partridge et al., 2020).
Fast food only restaurants served items with the highest calories and highest fat content, while they had the lowest median price per item served. This has also been previously reported in literature (Auchincloss et al., 2014; Poelman et al., 2020). Price sensitivity and price saving orientation are important drivers in the online food ordering behaviour displayed by customers (Saldanha & Sen, 2021; Yeo et al., 2017). Fast food meals have poor quality and nutritional value and their easier availability and affordability increase the chances that they are more likely to be consumed (Liu et al., 2020). This might facilitate the purchase on foods of poor nutritional quality. Asian fast foods have been found to be as energy dense as Western fast foods and thus equally posing a health risk (Henry et al., 2020; Partridge et al., 2020). These foods have been shown to be popular food choices of customers, especially adolescents, and have been consistently linked to various health issues (Sahoo et al., 2015). Though these restaurants constituted only 4% of all the listed restaurants in our sample, it is important to note that the fast foods constituted more than 20% of the items served in other types of restaurants also. This has important implications to the customer, as whichever restaurant is chosen, s/he is lured to an item that is lower priced though potentially with higher calorie and fat content.
Chinese restaurants were found to have a greater proportion of soups and salads and the least proportion of desserts/beverages. They were found to have the second lowest amount calories per item served, next only to Indian items. Roberts et al. (2018) also made similar observations that fast food and full-service restaurants in China had lower calories than their counterparts in the USA. Further they added that the measured energy content of meals from restaurants in Brazil, Ghana, India and Finland were not significantly different from the very high values reported from the USA, and only one country (China) had measured values lower than the USA.
Restaurants where the average cost for two, an indicator of the priciness of restaurants, was higher served items with lower calorie content and they served greater proportion of soups/salads compared to restaurants. This could have important public health implications because the average price at the outlet has been known to influence purchasing behaviour (Wang et al., 2021). So, if only the relatively expensive restaurants offer healthier choices, it makes healthier options less accessible to the majority of the population. The fundamental principle of health promotion is to make the healthier choice the easier choice. However, what has been observed in our study is that the unhealthy fast foods are priced the least and the expensive restaurants are the ones more likely to offer healthier items in the menu. Whether this affects the consumer choices can only be determined by a study analysing the actual purchasing behaviour of the customers.
The only attribute of consumer preference captured in our study is the average customer rating for restaurants. It was observed that restaurants with higher median calories and higher median price per item also had higher ratings. This could mean that there is a customer preference for restaurants serving higher calories and those that are expensive. This could also mean that restaurants increase the pricing of food items after a desirable higher rating is achieved. However, we do not place much emphasis on this finding as the proportion of the less expensive restaurants that were unrated were thrice as much as that of expensive restaurants. This could be because of the difference in clientele of different types of restaurants deciding on whether the restaurants are rated or not.
Strengths and Limitations
To the best of our knowledge this is the first ever study in India to report on the spatial distribution and characteristics of restaurants of an OFD application across the country. We also study the profile of food items reporting their nutritional value based on standard estimates of nutritional content of locally available food items and correlate with restaurant and food item characteristics.
We did not have access to the data on actual orders and billed quantities of food from the restaurants and we could not assess the consumer behaviour and comment on actual ordering behaviour. However, we have presented the ratings provided by consumers to the restaurants which reflect their preferences.
Conclusions
Restaurant density was not uniform across India with very high densities seen in territories with higher urbanization and per capita GDP. Fast food restaurants served items with highest calories, fat and were also the cheapest among all restaurants. Restaurants that were relatively expensive had greater proportion of healthier food items and had items with the least median calories.
Recommendations
There is a need to increase the assortment of affordably priced healthier options in the restaurant menus to make healthier choice, the easier choice. The quality and nutritional value of fast foods must be regulated by nutritional labelling, and regulations on nutritional content in fast foods. The labelling of foods as healthy or low calorie should be supported by providing disaggregated information on composition of calories, proteins, trans fats, additives, preservatives and others. Some of the online food ordering apps have initiated this, but the information is sketchy and not universally provided for all items and restaurants. The barriers faced by restaurant owners to promote healthier eating habits need to be identified and effectively negotiated for sustainability. Awareness generation among the youngsters who are the majority of the consumers of online food ordering apps to encourage wise nutritional choices for healthy life. Monitoring purchase pattern and behaviour on online food ordering apps will help us understand the actual nutritional value of items consumed per order and understand actual consumer choices, preferences and costs incurred.
Supplementary Material
Supplementary material for this paper is available online.
Footnotes
Acknowledgements
We thank the anonymous reviewers for their critical review which significantly improved the article.
Author Contributions
RSA and KJ conceived the study. RSA, KSK and DV developed the study methods. VK performed the data extraction. RSA, JK and VK performed the data analysis for which critical inputs were provided by KSK and DV. RSA and KJ wrote the first draft of the manuscript. The manuscript was critically modified by the KSK, VK and DV. All authors approved the final draft of the manuscript.
Availability of Data and Materials
The datasets are available from the corresponding author on reasonable request.
Declaration of Conflicting Interests
The authors declared no potential conflicts of interest with respect to the research, authorship and/or publication of this article.
Funding
The authors received no financial support for the research, authorship and/or publication of this article.