



Abstract
This article presents a qualitative comparative assessment of the Australian and New Zealand tourism industry performance following the emergence of the COVID-19 pandemic. The analysis focuses on a qualitative assessment of achievements in several key tourism aggregates from 2020 to 2021 and compares it with industry achievements in 2019. The assessment reveals that following the COVID-19 pandemic, by 2020, the shares of tourism output and export earnings plunged to 6.0% and 1.6%, respectively, in Australia. In New Zealand, tourism output and earnings contracted to 8.8% and 9.4%, respectively. The overall economic contractions in both countries were more severe in 2020–2021 than in 2019. It is anticipated that the contribution of tourism to national output, employment, export earnings and hotel occupancy rates will continue to remain subdued in 2022, with the likelihood of some degree of recovery in late 2022, assuming rapid progress in vaccinations against the COVID-19 disease. This study makes a new contribution to the tourism literature as the assessment presented here provides a comparative distinctive analysis of the effects of the pandemic in the local economy context of two neighbouring similar economies of Australia and New Zealand. Research has been deficient in providing this type of analysis despite the numerous studies addressing the effects of the pandemic across the tourism industry globally.
Introduction
The outbreak of COVID-19, first identified in December 2019 in Wuhan (China), has become the most significant threat to humankind and the global economy since the Spanish Flu of 1918 (Barro et al., 2020; Thomas et al., 2020). Following its identification and possible origin of location, COVID-19 quickly spread worldwide and transited into a pandemic at the beginning of 2020. It has resulted in unprecedented losses of human lives through infections, severe contractions in economic activities and severe disruptions to people’s lifestyles. According to Thangavel et al. (2022), while the COVID-19 pandemic and political protection agenda slowed the pace of globalization for some time to come, it has also allowed the creation of new globalization that prioritizes people’s safety and prosperity. Melesi-Ferretti (2021), in his study on the economic impact of COVID-19 travel shock, found that on a cross-country basis, the share of tourism activities in GDP was the single most important predictor of the growth shortfall in 2020. Crises such as pandemics and war can impose severe economic difficulties. In their recent study on tourism business resilience in a time of war (Russia and Ukraine), Tomej et al. (2023) observed that the personal resilience of tourism business managers is an essential variable for tourism entrepreneurs. Other than the direct human costs of rising mortality, since early 2020, the COVID-19 pandemic has strained the world’s healthcare system, severely disrupted societies and jeopardized the world economy (Chang et al., 2020; Yang et al., 2020). As recently as 28 February 2022, the worldwide confirmed cases of COVID-19 infections reached around 434,154,739 and loss of 5,944,342 human lives (World Health Organisation, 2021). As of the end of 2021, the world’s societies continue to bear the health impacts of this disease while several economies show mild signs of a speedier recovery to pre-pandemic levels.
Across the world, the tourism industry emerged as one of the most vital production sectors in many countries, directly generating foreign revenues, employing domestic labour and establishing strong linkages with other sectors of the economy (United Nations Conference of Trade and Development, 2021). Given tourism’s close connections and its linkages with other sectors of the economy (air transportation, hotels and restaurants, wholesale and retail, and finance), it also delivered a strong multiplier effect that allowed the expansions of these close interlinked sectors (Chidakel et al., 2021). The interconnectivity of tourism also increased sectoral dependency on economic and financial services that promoted many businesses outside its core. The tourism industry has been subject to detrimental effects of the COVID-19 pandemic (Barbate et al., 2021; Pandey et al., 2021) as most countries instituted disease containment policies such as short- and long-term bans on international travel, complete border closers and in-country lockdowns to control the transmission of the virus. Unfortunately, the tourism sector has been the most adversely impacted, taking an unprecedented brunt of the pandemic with the closure of several businesses within the industry and externally connected industries (Pandey et al., 2021).
Although the government instituted COVID-19 containment measures that dampened the spread of the disease, it had severe repercussions on the world’s tourism industry. Based on the United Nations World Tourism Organisation (UNWTO, 2020), international tourist arrivals worldwide declined by 70%–75% in 2020. In January 2021, the drop was even worse, reported to be around 87%, attributed to border closures that restricted world travel. The economic effect across the world is apparent waves of contractions. According to the data from the World Travel and Tourism Council (2022, pp. 5–10), before the pandemic, the world’s travel and tourism sector accounted for 10.6% of all jobs, 10.4% of global gross domestic product (GDP) and international visitor spending 6.8% of total exports. Dramatic contractions in economic activities worldwide became visible one year after the pandemic. For example, in 2020, the travel and tourism sector contributed 5.5% of the world GDP, with 272 million employed across the sector globally (compared to 334 million in 2019), with international visitor spending plummeting by an unprecedented 69.4% (World Travel and Tourism Council, 2022, pp. 5–10).
The COVID-19-related economic impacts have been of different magnitudes across the world. Large and small low, middle and high-income economies alike have all borne the economic brunt of this pandemic. India and China, the largest developing economies, were impacted more severely than other large developed nations. Barbate et al. (2021) and Pandey et al. (2021) noted the significant adverse impact of the pandemic on the Indian economy, while Kanupriya (2021) noted that other than the tourism sector, the Indian textile sector (second to agriculture) has been one of the worst hit other than the tourism with job losses and disruptions to livelihoods. In their study on the COVID-19 impact on tourism sectors in Zhejiang, Fujian and Shandong provinces in China, Shang et al. (2022) observed that lower growth and recessions translated into a significant decline in green investments. In a study of the COVID-19 pandemic and public health policies in China, Wang et al. (2022) revealed that the Chinese government’s prevention and control policy mitigated the impact of COVID-19 significantly for the tourism and non-tourism sectors. The impact of the pandemic on smaller economies has been similar to that of large economies. For example, Al-Mughairi et al. (2022), in their study of Oman, found negative economic and social impacts of COVID-19, including financial loss to businesses, reduced consumer demand, disruptions in the logistics sector and deterioration in business relationships with suppliers, customers and employees. In another study, Jafari et al. (2021) on Famagusta town in Northern Cyprus showed that the COVID-19 pandemic already impacted tourism-reliant sectors such as hotels, restaurants, travel agencies and transport sectors. These authors also noted gains in private sectors (internet and technology providers).
Countries with significant and outward-oriented tourism industries have been affected more severely than those with smaller and inward-oriented tourism sectors (International Monetary Fund, 2021). For Australia and New Zealand, the two high-income neighbouring countries in the Asia Pacific region, tourism has been an essential part of their economies for several decades (Pham et al., 2021; Scrimgeour & Duppati, 2014), with tourism contribution to the national economy expanding gradually. Australia and New Zealand, despite bringing the world’s attention to most effectively controlling the community transmission of the COVID-19 pandemic, the tourism sector remained in the collapse of tourism activities experienced by several other countries worldwide (Pham et al., 2021). Other than agriculture (among other sectors) and the significant contributions to national output in Australia and New Zealand (Scrimgeour, 2020), these countries are also highly tourism-dependent, and tourism has generated billions of dollars towards national income. Like many other countries worldwide, tourism is a vital source of foreign exchange and employs domestic labour. Well-developed institutional structure, innovations and excellent tourism infrastructure (Scrimgeour & Duppati, 2014; Scrimgeour et al., 2006) have enabled both countries to enhance regional integration, which also attracted international visitors for decades from several countries worldwide with significant visitor sources countries primarily the high-income countries and several source countries located within the Asia Pacific region (listed in ‘Source Markets and Visitor Arrivals’ section).
Official statistics from Australia and New Zealand’s government agencies (Tourism Research Australia, 2020b and Statistics New Zealand, 2022) provide strong evidence that their tourism sector grew into one of the significant service-related industries and positively impacted their economic activities. Much of this is attributable to these nations’ unique natural environment, architecture, events, shopping, diverse cultural set-up, democratic values and good governance, high-quality tourism infrastructure and commercial airline connectivity that combined to attract increasingly large numbers of visitors from several countries worldwide (Gani & Clemes, 2017; Roberts, 2022). According to the official government sources of data, the Australian and New Zealand Bureau of Statistics (Australian Bureau of Statistics, 2021; Statistics New Zealand, 2022), common among both countries is that holidays ranked as the most crucial purpose of the visit by international travellers, followed by visits to friends and relatives, higher education, conferences and participation in conventions and business.
The onset of COVID-19 immediately impacted both countries as the first COVID-19 case was detected in Australia in January 2020 (Hunt, 2020), while in New Zealand, the first case was identified February 2020. The effect on the tourism sector of the announcement of these reported first incidences of COVID-19 detection was immediate. According to Costantino et al. (2020) and Pham et al. (2021), the lucrative Australian tourism industry started to deteriorate, while in New Zealand, its tourism sector started to withstand the worst of falling visitor arrivals early in 2020 as the government moved swiftly to impose travel restrictions for non-residents and foreign nationalities. More stringent travel restrictions were imposed following the March 2020 announcement from the WHO, which declared COVID-19 a pandemic in response to the rising number of infected people. Exponential increases in COVID-19 deaths worldwide daily (Osseni, 2020) triggered both governments to continue instituting more robust containment measures. As a result, worldwide international arrivals dropped sharply because international travel restrictions strengthened (Chen et al., 2022).
Given the COVID-19 outbreak, Australia and New Zealand showed the world their leading examples of containing the community spread of COVID-19 through some of the very stringent government containment measures, including border closures and banning flights from several countries for very extended periods, much of which remained effective in 2022 (Gauld, 2022). Despite the benefits of their containment actions, both countries’ tourism industries bore the brunt of government COVID-19 containment measures quite severely, as noted by Cumming (2022). However, both countries’ desire to open their borders amongst themselves and the wider world remains the cornerstone of the medium to the long-run national strategy for tourism recovery.
Studies providing a comparative assessment of the pandemic’s effects on Australia and New Zealand’s tourism sector are exceedingly rare other than a few studies such as Pham et al. (2021) and Cumming (2022). Hence, one of the main contributions of this article is that it provides a reliable comparative analysis of how key tourism aggregates have changed since 2019. It is worth noting that when writing this article, data for 2022 was unavailable for several variables. While the discussion extends to 2022, much of the supporting data is till 2021. This assessment is valuable to researchers, including research students in tourism studies, enhancing their understanding of Australian and New Zealand tourism performance. At the same time, this article makes another essential contribution by providing an improved understanding of the Australian and New Zealand tourism sector’s performance following the COVID-19 pandemic, which is highly essential for industry policymakers in crafting more effective policies to improve their international competitiveness, facilitate a post-COVID-19 market demand analysis and promote better utilization of governmental financial resources for tourism recovery extended to the industry following the pandemic. Hence, in this study, we address this and attempt to comprehensively assess how COVID-19-inspired international inbound travel restrictions instituted by the Australian and New Zealand governments impacted their tourism sector. In doing so, overall data on crucial tourism performance variables are analysed for 2020. A qualitative assessment of the direct impacts of the COVID-19 pandemic needs to be included. Based on the current study’s findings, some policy-oriented recommendations are provided to recover the tourism industry.
Some Aspects of Visitor Characteristics in Australia and New Zealand
Understanding traveller characteristics is essential in gauging visitors’ perceived quality of services that can be made available by tourism service providers. It also gives the industry a constructive foundation to structure the demand pressures of tourism and hospitality services. According to Boo and Busser (2005), understanding visitor characteristics is essential as it can predict the destination image formation of potential tourists. Service providers can then structure their tourism goods according to visitor characteristics for a competitive advantage. Hence, key features capturing international visitor characteristics are analysed in this section. These are total visitor arrivals, visitors’ purpose of visits, demographics (age), length of stay and nationality. Table 1 presents visitor characteristics data for Australia and New Zealand for January 2019, 2020 and 2021.
According to Table 1, there are significant gaps in international visitor arrivals between Australia and New Zealand. While the size of the two nations can be understood to matter, Australia’s close proximately to significant source countries in the Asia Pacific region hosting large populations and rising per capita incomes together with increased airline connectivity are essential elements, amongst others, that explain the visitor arrival gaps with New Zealand. New Zealand’s geographical setting also makes it a distant country from significant visitor source markets compared to Australia, giving Australia an edge in attracting more visitors.
Before the widespread transmission of the COVID-19 pandemic, in 2019, New Zealand received just over 3.8 million visitors, while Australia received almost 9.5 million visitors, almost two and half times more than New Zealand. By 2021, the effects of the pandemic on visitor arrivals took their course as sharp declines became visible. For the year ending January 2021, in New Zealand, total visitor arrivals dropped by almost six and a half times compared to the preceding years. In Australia, in 2020, there were just over 1.8 million visitor arrivals, five times less than the previous year. Further dramatic reductions were recorded for January 2021.
While visitors may have specific purposes for travel (reviewed in Liu et al., 2020), Australia and New Zealand categorize visitors’ purpose of travel into five broad categories: holidays, visiting friends and relatives, business, education and conferences and conventions. In New Zealand, over 50% of visitors’ primary purpose of travel is a holiday, followed by visiting friends and relatives and for business in the third place. Two notable changes are evident for New Zealand from the data in Table 1 regarding the purpose of the visit. First, for the year ending January 2021, holidays recorded a drop to 47%, with a slight drop also recorded for education and conferences. The drop recorded for education is that continuing students went home for summer and could not return for their education for the new academic year (starting late February and early March) due to international travel bans and border closures by Australia and New Zealand. Second and interestingly, people intending to visit friends and relatives rose from 28.3% in 2019 to 29.8% in 2021. A possible explanation is that it is highly likely that the pandemic also had a social side effect, driving people to seek more connectivity and closeness with their friends and relatives because of extended periods of isolation during lockdowns. It has been shown (for example, Toepoel, 2013) that people with fewer social contacts often feel lonely, and friends correlate positively to leisure activities.
Visitor arrivals to Australia follow a similar pattern to that of New Zealand. For 2019 and 2020, just over 47% and 43% of visitors declared holidays their prime purpose of visit, respectively. This was followed by visiting friends in second place and business in third place. In 2021, the purpose of the visit to Australia turned out to be overt than that of New Zealand. Almost 52% of visitors declared their main reason for visiting friends and relatives, whereas, in New Zealand, almost 30% of visitors were recorded to visit friends and relatives as their prime reason. Visitors chose to spend more time with their friends and relatives rather than holidaying due to nationwide lockdowns or lockdowns in areas where the clusters of COVID-19 infections emerged.
Key Visitor Characteristics to Australia and New Zealand.
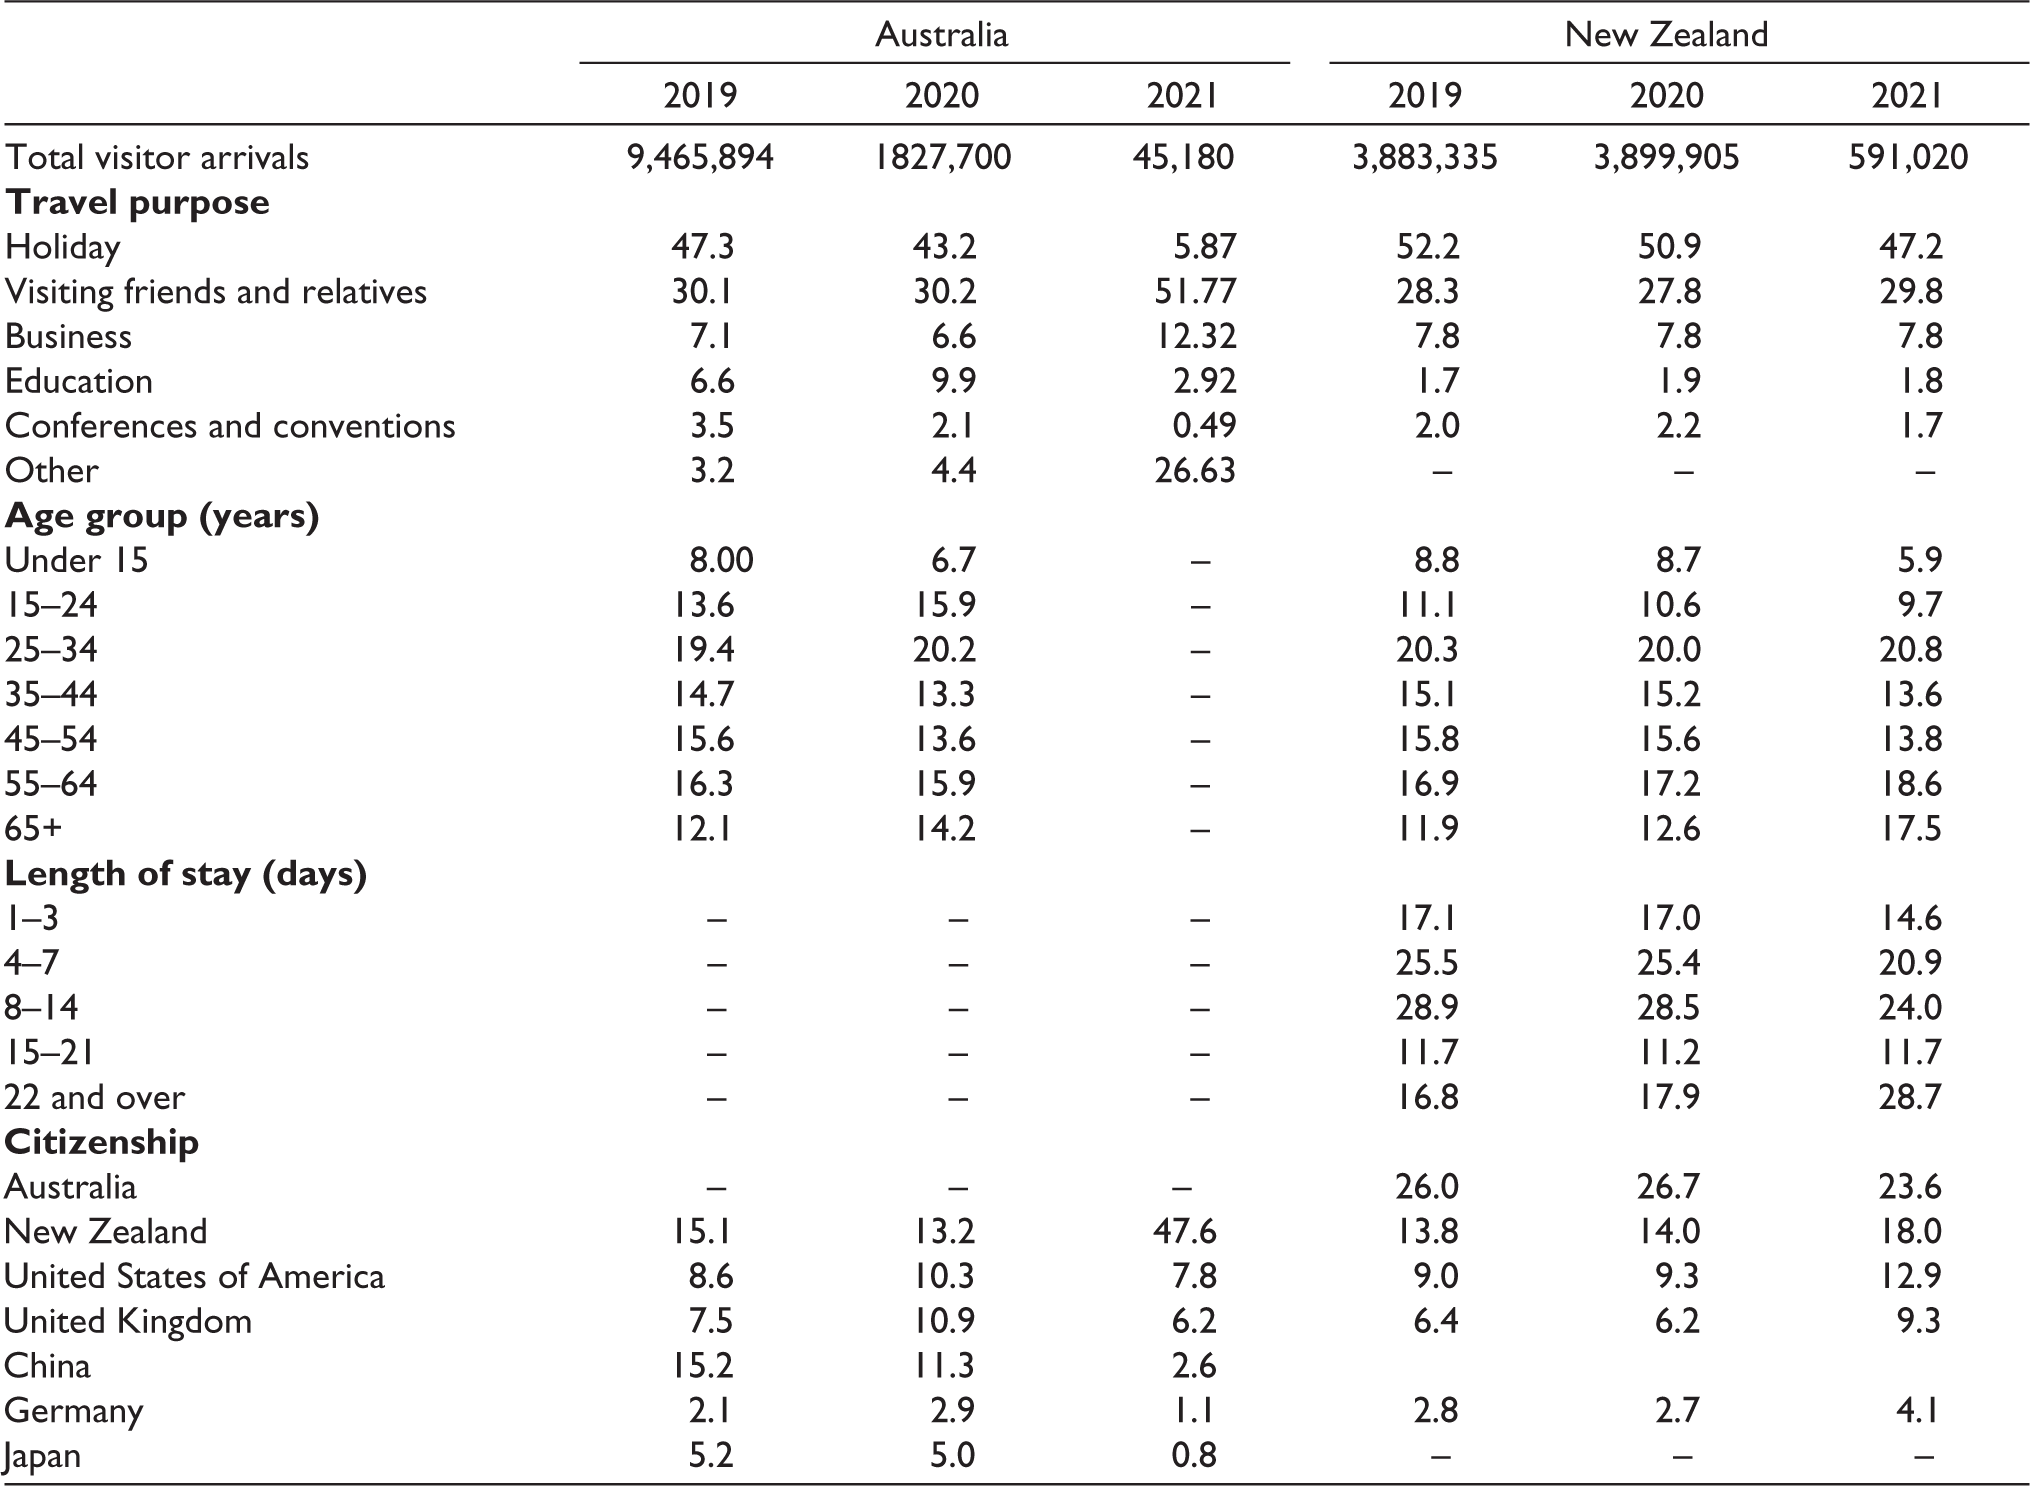
Demographics such as age also reveal another characteristic of visitors. Theoretical literature reveals that age impacts an individual’s decision to travel, as reviewed by Kara and Mkwizu (2020). The visitor demographic attributes, such as age, follow a similar pattern in Australia and New Zealand (Table 1). In both countries, visitors are dominated by 25 to 34 year-old age groups (around 20% of all arrivals), followed by 55–64 age groups. This reflects that people aged 25–34 years are most likely to be adventure seekers and desire to participate in nature exploration and outdoor activities, which Australia and New Zealand are naturally endowed with and indeed have much in abundance to offer. However, Patterson and Pegg (2009) study revealed that older people have also demonstrated their participation in more adventurous forms of leisure that are more physically challenging. Both countries have well-developed adventurous outdoor activities with elevated levels of safety and security that are competitively priced, explaining the choice by older people for adventurous outdoor leisure activities.
The younger generation, aged 15 years and under, tend to travel the least; Australia and New Zealand data confirm this. This is directly attributable to their time and financial constraints; those under 15 years are usually in school. When they travel, they usually accompany their parents, which may enhance an additional financial burden. On the other hand, visitors aged 55 years, entering or are close to entering retirement, usually concentrate on seeking leisure holidays. Regarding demographic effects, in New Zealand, people aged 25–34 years are the dominant age group of travellers, while those under 15 years are at the lowest rank. While visitors aged 24 years and under declined from 2019 to 2020, an increase in travellers aged 55 years and above was noted in 2020.
Data in terms of length of stay is available only for New Zealand. In terms of length of stay (days) in New Zealand, most visitors stay between 8 days and 14 days. Visitors staying for very short-term (1–3) days declined from 17.1% in 2019 to 14.6% in 2020, while visitors staying for 22 days and over rose significantly from 16.8% in 2019 to 28.7% in 2021. Likely, visitors could not return to their home countries within the planned return dates because of sudden border closures leading them to extend their stay beyond their desired length. According to the Australian Bureau of Statistics data, during 2020, the median duration of stay in Australia was 14 days, which also varied between the states and the numerous source countries and travellers’ main reason for the journey. In Australia, New Zealand citizens primarily dominated visitors. While Australian citizens dominate the nationality category of visitors, people with New Zealand citizenship increased from 13.8% in 2019 to 18% in 2021.
Tourism’s Contributions and Impacts
Tourism is one of the production sectors that can gyrate and go through periods of rapid growth and sudden downturns. A vibrant tourism industry promotes economic growth by increasing domestic incomes and effective demand. This section assesses the impact of tourism on a range of variables directly impacted since the outbreak of COVID-19. The focus is on the extent of disruption to the tourism sector in Australia and New Zealand and the effects on crucial tourism aggregates. An analysis of a range of crucial confounding variables is conducted to gauge the extent to which the tourism contributions were impacted. Key variables assessed include visitor source markets, contribution to national output, changes in export earnings, labour market, tourism expenditure and government response to promote tourism recovery.
Source Markets and Visitor Arrivals
The tourism industry worldwide remains vulnerable and can be adversely affected by exogenous shocks. In particular, the changes in source markets driven by economic downturns, political and social unrest and pandemics like COVID-19 can severely impact destination countries’ tourism industries. For Australia and New Zealand, while significant source markets are concentrated among the high-income countries, their markets are also diversified as they attract tourists worldwide.
According to Tourism Research Australia (2020a), 20 countries made up the list of significant visitor source countries for Australia for the year ending March 2020. New Zealand, Japan, Hong Kong, Singapore, Malaysia, Indonesia, Taiwan, Thailand, Korea, China, India, the United States of America, Canada, the United Kingdom, Germany, Scandinavia, France, Italy, Netherlands and Switzerland. In New Zealand, Statistics New Zealand (2022) recorded 30 source countries in 2020. These were Australia, the United Kingdom, the United States of America, Samoa, Cook Islands, Russia, China, Canada, India, Hong Kong, Germany, Philippines, Singapore, Fiji, Japan, Switzerland, United Arab Emirates, Netherlands, Italy, France, Korea, Ireland, South Africa, Indonesia, Taiwan, Denmark, Malaysia, Qatar, Austria and Spain.
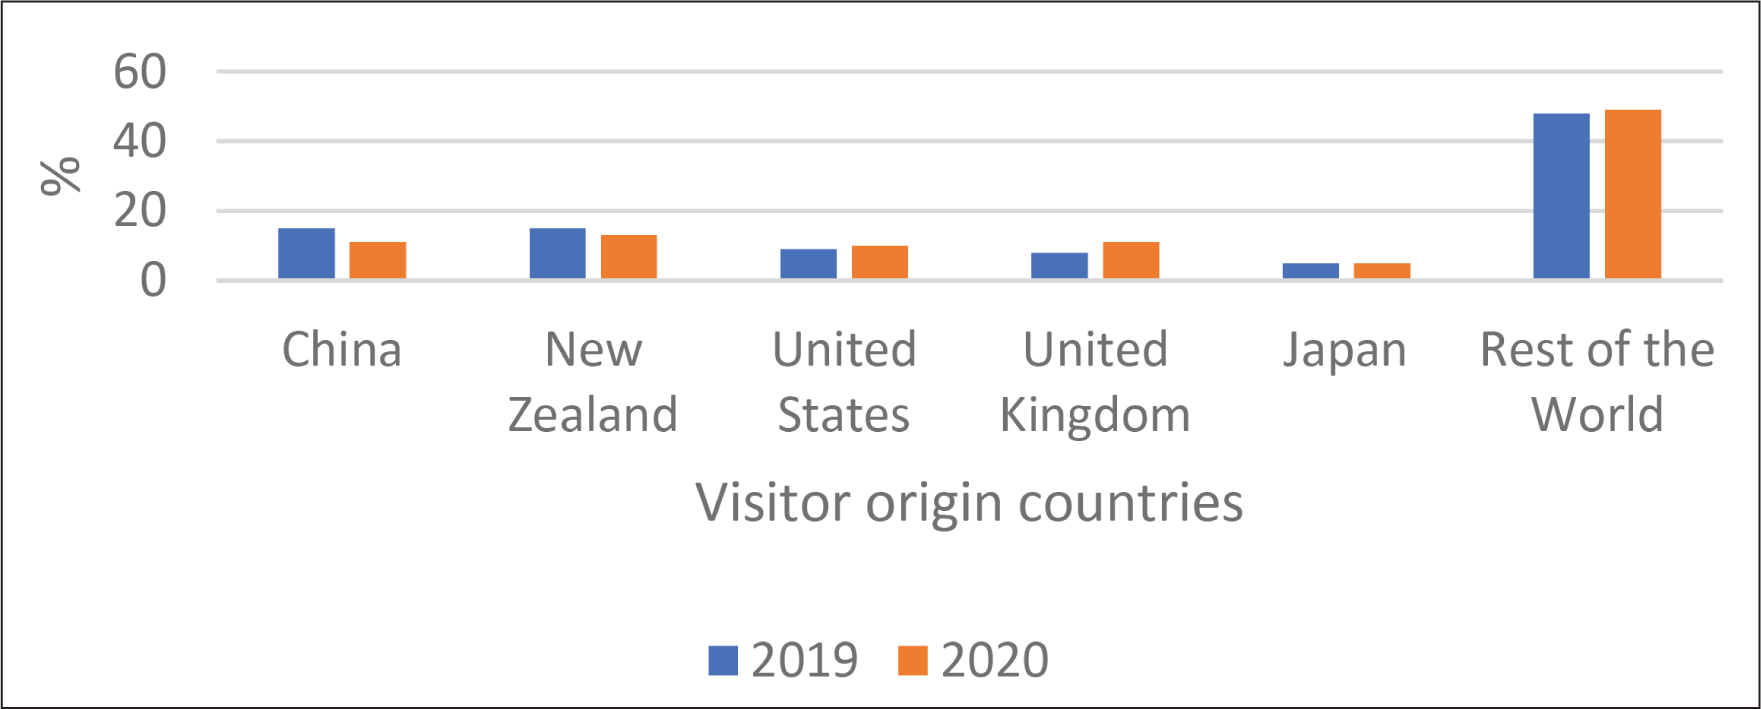
In 2019, Australia received a total of 9.4 million visitors from across the globe, an increase of 2.4% (9.2 million) from the previous year, 2018 (TA, 2021). According to Tourism Research Australia, in 2019, visitors to Australia, numbering 50,000 and more, came from 20 different countries (mentioned above), with New Zealand as the prime visitor origin country with almost 1.3 million visitors and Switzerland at the lowest end with 50,000 visitors. However, Australia’s top five visitor source markets were China, New Zealand, the United States of America, Japan and the United Kingdom (Tourism Research Australia, 2020b). Figure 1 depicts five main visitor source markets for Australia. According to Figure 1, in 2020, visitors to Australia declined from China, New Zealand and Japan. In 2020, Australia received a total of 1.8 million visitors worldwide compared to 9.4 million in 2019.
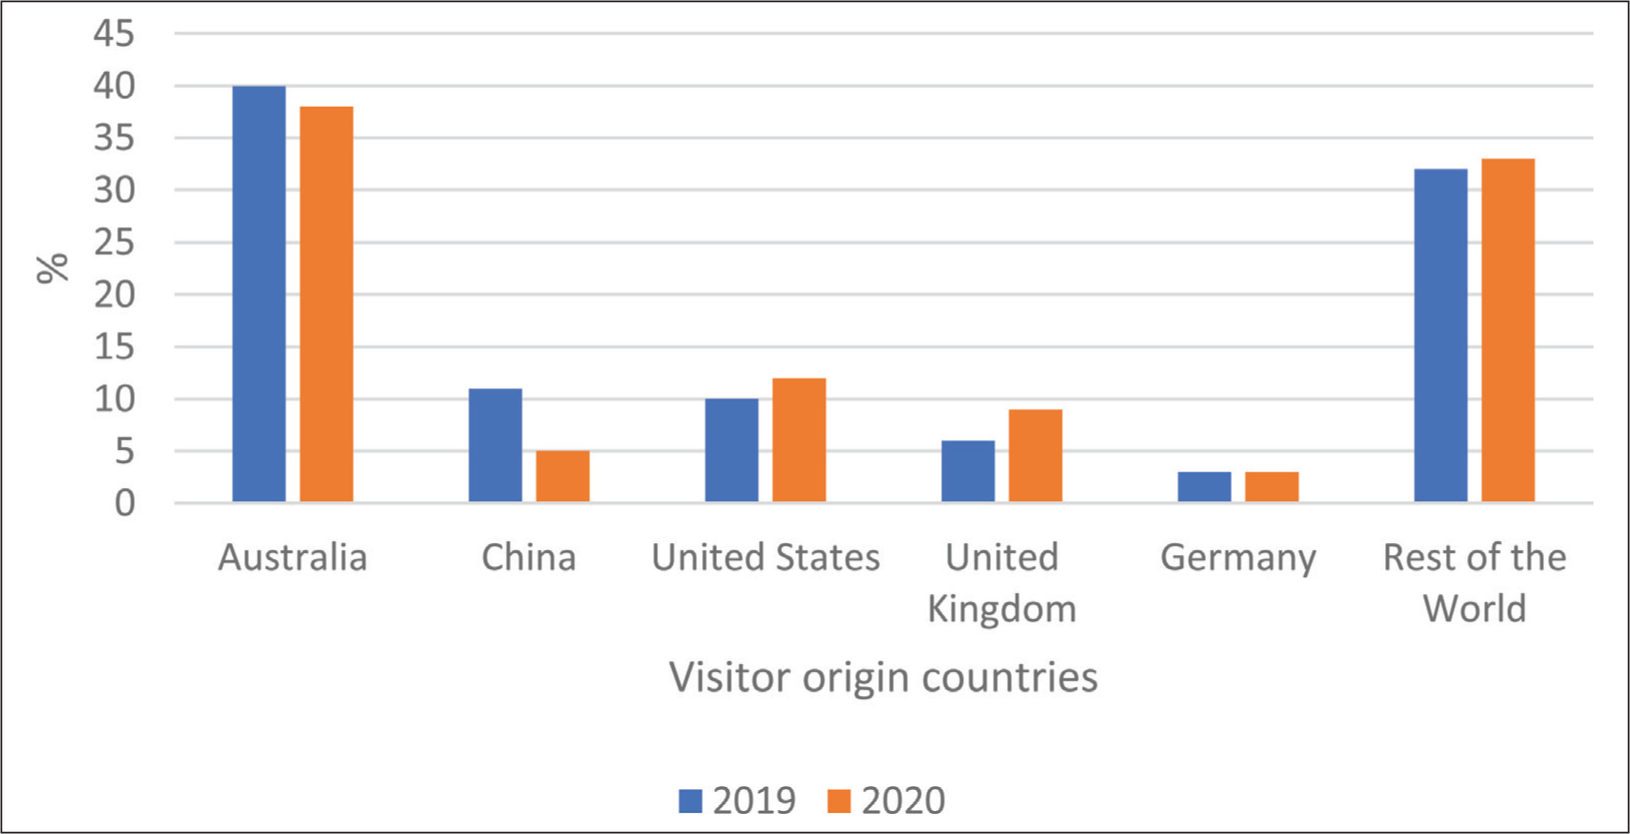
In terms of inbound visitors, in 2019, New Zealand received a total of 3.88 million worldwide visitors (Table 1). According to Statistics New Zealand, in 2019, visitors to New Zealand numbering 10,000 and more came from 30 countries, with Australia at the top with just over 1.5 million visitors and the Cook Islands at the lowest rank of just over 12,000 visitors. Figure 2 depicts five main visitor source markets for New Zealand. According to Figure 2, in 2020, visitors to New Zealand declined from the primary source markets of Australia and China.
The Australian and New Zealand tourism sector remains competitive and shares the same source markets. The developments (economic growth and household financial wellness) in main source markets matter much as this will steer the long-run competitiveness of these two countries tourism. Given Australia and New Zealand’s geographical position in the Asia Pacific region, per capita incomes will eventually rise for many Asian Pacific economies and other emerging markets outside the region. Once international travel gets normalized, and vaccination rates against COVID-19 accelerate in the visitor source countries, international travel will spike upwards even in the short run. Hence, the medium to long-term optimism in Asia Pacific economies will guarantee more tourist flows to Australia and New Zealand.
Tourism Contribution to National Output
The flow of international visitors and the importance of the tourism industry for a nation’s development process has been widely studied. Numerous studies (for example, Calero & Turner, 2020; Neuts, 2020; Santamaria & Filis, 2019, Tosun et al., 2003, among others) have examined the impact of tourism on a nation’s growth and development process, revealing beneficial impacts on international visitor recipient countries. Tourism positively impacted several economies worldwide, including stimulating new economic activities, job creation, income generation, inter-industry linkages and regional development. In some of the world’s tourist-dependent developing countries, its contribution to output has exceeded that in other world regions, as noted in the Caribbean countries (Cannonier & Burke, 2019) and several small low, and middle-income countries in other regions. The potential effects of the tourism sector range from economic growth and social inclusion to cultural and environmental preservation. Comerio and Strozzi (2018) comprehensively review tourism’s potential benefits and detrimental effects.
The contribution of tourism to Australia and New Zealand’s economies is similar to other small and large visitor destination countries. Over several years, in Australia and New Zealand, international tourism contributed to forming a vibrant tourism industry that became a significant production part of their national economy. Over the long term, and before the onset of the COVID-19 pandemic, both countries increasingly attracted significant and rising numbers of international visitors that strongly contributed to their national output as measured by GDP, as depicted in Figure 3.
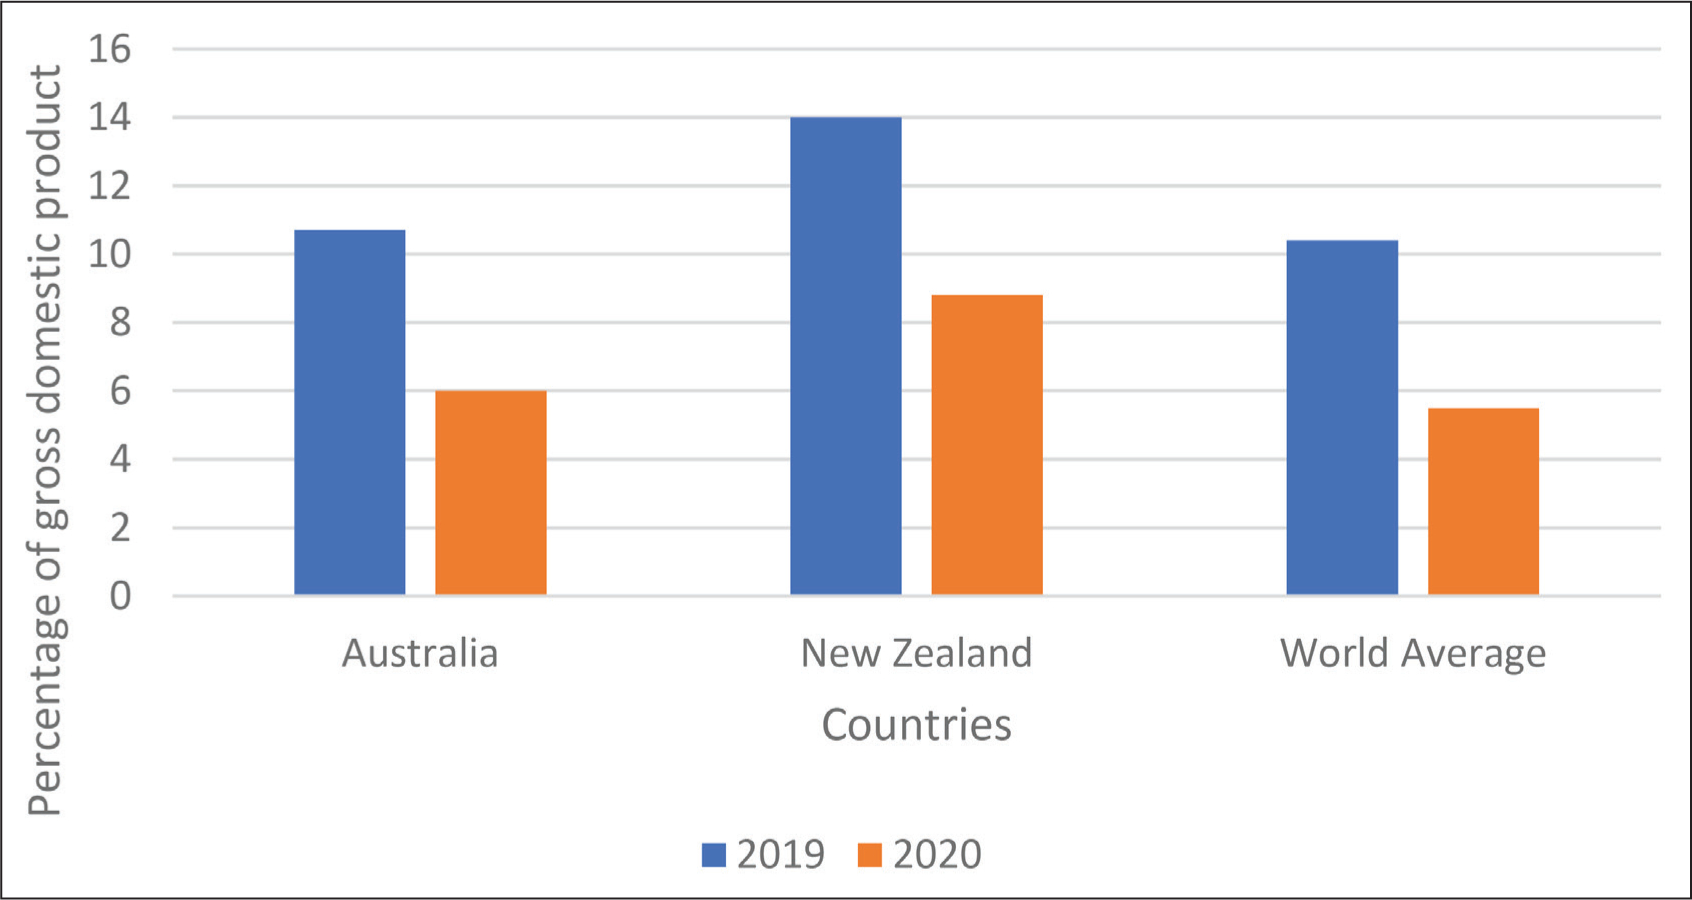
Before the COVID-19 pandemic, the tourism sector in 2019 generated a direct contribution of USD 149.1 billion and USD 29.6 billion to Australia and New Zealand’s GDP, respectively. In terms of percentage share of GDP, in 2019, on average, tourism contributed 10.7% and 14.0% to the GDPs of Australia and New Zealand, respectively. This contribution in these countries stood higher than the world average of 10.4% of GDP. The impact of the pandemic on tourism contribution to GDP recorded a massive decline in 2020—the tourism contribution to GDP fell from 10.4% to 6.0% in Australia and from 14.0% to 8.8% in New Zealand. Although tourism contribution to GDP declined significantly in 2020 from 2019 in both countries, it remained above the world average of 5.5% in 2020. The projections for 2021 remain on the downside as visitor arrivals from significant source markets are expected to remain mostly subdued for the remaining part of 2021.
Tourism and Export Earnings
Inbound tourism is a non-traditional export. It is significant towards the nation’s long-term growth, as indicated in the tourism-led growth literature (reviewed by Tang et al., 2017). Tourism exports have become an essential contributor to Australia and New Zealand’s foreign exchange earnings. Available evidence indicates that tourism has positively impacted the trade sector’s earnings in both countries. The direct impact of international visitors can be gauged through tourism share in total exports. According to the World Tourism Council, in 2019, tourism contributed to 6.0% of total exports in Australia, which fell to 1.6% in 2020. In New Zealand, in 2019, tourism made a significantly higher contribution, amounting to 18.0% of total exports, than in Australia. Like Australia, tourism exports fell dramatically to 9.4% in 2020 for New Zealand. This reveals that New Zealand’s export earnings are more exposed to international tourism than Australia’s. In both countries, export earnings from tourism are expected to remain low for most of 2021.
Tourism Effects on the Labour Market
Much of the tourism sector worldwide is labour-intensive (International Labour Organisation, 2020). The tourism sector has contributed to the absorption of the domestic labour force in both countries and has been a valuable source of job creation (Cumming, 2022; Khanal et al., 2022). Tourism sector jobs include a range of related businesses, including service industries such as accommodation, food and beverage services, transportation, travel agencies, and cultural, sporting and recreational activities. In addition, as discussed by Hor (2021), more traditional and established production sectors such as agriculture, manufacturing, retail and transport also have linkages with tourism services as suppliers of food and beverages, transport services and consumer goods.
The tourism labour market was adversely impacted in Australia and New Zealand through government containment measures relating to the transmission of COVID-19 and the falling demand for tourism goods resulting from the containment measures. In Australia, there were approximately 666,000 people involved in the tourism industry before the pandemic started, which made up around 5.2% of Australia’s workforce. This fell by 6.6% by the end of June 2020 (Australian Bureau of Statistics, 2020). The negative repercussions of international border closures immediately impacted the Australian economy. The unemployment rate soared from 5.2% in March to 7.4% in June 2021 (Lim et al., 2021).
In 2019, tourism contributed 12.9% of employment in Australia and 14.4% in New Zealand. By 2020, tourism contribution to employment fell in both countries as Australia recorded 11.3% while New Zealand recorded 14.4%. Over the period 2014–2019, in both countries, the net job creation was 1 in 4.
Tourism Expenditure
International tourists spend billions of dollars directly in the local economies, generating nationwide multiplier effects. According to Pulido-Fernandex et al. (2020), several factors determine expenditure by tourists in any country that are strongly associated with the socioeconomic attributes of the tourist, the characteristics of their trip, the activities of the tourist in the destination and the level of satisfaction with the destination. According to Tourism Research Australia (2020a), in Australia, by June 2020, international tourists’ expenditure on Australian products and services had plunged from $39.6 billion to $31.2 billion compared to the financial year 2018–2019. As a result of Australia’s COVID-19-related travel restrictions on all countries, by the year ending December 2020, the Australian economy had lost $9.7 billion from Chinese tourists, $2.1 billion from New Zealand tourists, $2.8 billion from USA tourists, $1.7 billion from Japanese Tourists and $2.3 billion from UK tourists (Tourism Research Australia, 2020b). Regarding tourist spending, a considerable proportion of 2019 was on leisure (84%), and the remainder was on business. This contrasted with New Zealand as the proportion of tourist spending in 2019 was 61%, of which 80% was on leisure and the remainder on business. By 2020, Australia recorded 91% of domestic spending, of which 84% was on leisure. New Zealand also observed a similar shift, with domestic spending recorded at 70%, and of this, 80% was leisure spending and the reminder on business.
Government Response Measures to Restart Tourism
The government response regarding financial assistance has been a common step across several economies to assist tourism operators (Corbet et al., 2022). Corbet et al. (2022) analysed investor response to government assistance to mitigate the effect of the pandemic on international tourism. Their findings revealed that providing relief packages significantly alleviated short-term investor concerns. Australia and New Zealand recorded the first incidence of COVID-19 during the early months of 2020 (Baker et al., 2020). In response to this, both countries immediately imposed international border restrictions. Both countries announced economic response financial packages to overcome the financial constraints and challenges related to the COVID-19-related economic wide disruptions (Packham & Freed, 2021). Australia’s economic response package included 17.6 billion Australian dollars to protect the economy, sustain confidence, support investment, and keep people in jobs (International Monetary Fund, 2021). Similarly, New Zealand announced a 12.1 billion New Zealand dollar economic response package for supporting businesses and jobs, out of which $400 million was explicitly targeted for tourism recovery (International Monetary Fund, 2021).
Australia’s targeted restarting tourism measures included a waiver of fees for tourism businesses operating in Great Barrier Reef Marine Park and Commonwealth National Parks as well as tourism recovery campaigns such as the ‘Holiday Here This Year Campaign’, regional tourism grants, Australian tourism exchange, international media hosting program as well as supporting international public diplomacy efforts. New Zealand’s restarting tourism measures included support for Māori tourism, the protection of strategic tourism assets, free public transportation between 24 March and 30 June 2020, supporting the tourism industry to identify their future, as well as financial support to Tourism New Zealand to stimulate demand markets other than China.
The Australian government has already changed some of its existing policies and procedures and introduced some new ones. However, the growth of the Australian economy through inbound tourism remains unsettled in the foreseeable future as the Australian government has yet to give any clear indication of when it will lift international border restrictions (Lim et al., 2021). The impact of restricted inbound tourism because of COVID-19 on the Australian economy has been addressed by Pham et al. (2021). The Australian government has assisted people in the tourism industry since the pandemic began (Pham et al., 2021). In April 2021, the Australian government formed a Visitor Economic Expert Panel to improve the Australian tourism sector and plan for long-term sustainable growth by returning visitors once the pandemic is over (ATIC, 2021). In addition, every Australian state has formulated strategies for its respective tourism sector to bring back international tourists once the pandemic is over (TA, 2021).
Conclusion
The assessment of the tourism industry in Australia and New Zealand indicates that COVID-19-related international travel restrictions have significantly adversely impacted the Australian and New Zealand tourism sector. Visitor arrivals to Australia fell by five times from 2019, while in New Zealand, they fell by six and half times from 2019. Although almost 50% of all travellers chose holiday as their primary purpose of visit to both countries in a typical year, by early 2021 in Australia, 52% of travellers chose to visit friends and relatives as their primary purpose of travel. Most visitors to Australia and New Zealand were in the 25 to 34 year age group. Australia’s five main visitor source markets are China, New Zealand, the United States, Japan and the United Kingdom. At the same time, for New Zealand, it is Australia, China, the United States, the United Kingdom and Germany. Tourism contribution to national output declined significantly because of COVID-19. In a typical year, tourism contributed to just over 10% of the GDP in Australia and over 14% in New Zealand. By 2020, both countries recorded dramatic drops, with tourism contributing 6% of GDP in Australia and 8.8% in New Zealand. By 2020, international tourists’ expenditure on Australian and New Zealand products and services plunged sharply from 2019. Australia and New Zealand announced economy-wide response financial packages totalling 17.6 billion Australian dollars and 12.1 billion New Zealand dollars to overcome the economic disruptions, respectively, which included a financial response package targeted at tourism recovery.
Most countries worldwide are inoculating their populations with COVID-19 vaccines, uplifting international travellers’ confidence in travelling. With the easing of travel restrictions in several countries, international arrivals are predicted to pick up within the next 2–3 years and return to the same level as in 2019 (UNWTO, 2021). While Australia and New Zealand temporarily resorted to opening their borders in 2021, visitor movements in both directions remain below the pre-COVID-19 levels. Any significant rises in visitor movements to both countries will depend upon the home and source country’s speed of vaccinations against COVID-19 and the speed of relaxation of the COVID-19 containment measures. It should be noted that many international visitor source countries are going through rapid rises in COVID-19 infection rates due to the new variant, Omicron. Hence, any quicker recovery in the Australian and New Zealand tourism industry still looks slim in the short run.
This study does offer some notable implications for both academic literature and practitioners. Some studies (Costantino et al., 2020; Lim et al., 2021; Pham et al., 2021; Thirumaran et al., 2021) have already covered how COVID-19 has affected Australia and New Zealand’s tourism industry and the relevant stakeholders; however, best of our knowledge, the current study is the first one in which the tourism industry of both countries, Australia and New Zealand, had been analysed mainly from the perspective of the arrival of international tourists since the start of COVID-19 last year. The findings of our study would enrich the current literature related to tourism in Australia and New Zealand during the COVID-19 pandemic.
The assessments provided in this study reveal how international travel restrictions have impacted both economies. However, as the COVID-19 situation has improved in some countries, both governments can start allowing tourists to come from those countries on a smaller scale to revive the tourism and tourism-related industries in Australia and New Zealand. Further, our study provides a clear indication of how COVID-19 has impacted the employees involved in the tourism industries of Australia and New Zealand. Therefore, policymakers should focus on assisting tourism operators in reviving this vital sector.
Limitations and Future Research
There are some limitations to this assessment. First, the study focused mainly on the COVID-19-related travel restrictions to analyse COVID-19’s impact on the tourism industry’s performance in Australia and New Zealand. Future studies could consider the broader perspectives and dynamism in the economic, social, health and governance achievements of significant source countries on their citizens travelling to Australia and New Zealand during this pandemic and post-pandemic. Second, during the writing of this article, we noticed the on-and-off lockdown situation in the major cities of Australia and New Zealand due to a sudden influx of COVID-19 patients. In this regard, a longitudinal study could be carried out by future researchers to shed more light on COVID-19’s impact on tourism industries in Australia and New Zealand. Third, we collected all the available data in the context of the Australian and New Zealand tourism industries during the COVID-19 pandemic. However, for some variables, such as the Australian context, the age of international arrivals in 2021 and length of stay (number of days) for 2019, 2020 and 2021, the relevant data were unavailable. Our study is based on secondary data, and future studies could strengthen the analysis using primary data. Closely associated with this is that published data for 2022 was not available for some variables at the time of writing. Hence, future studies may consider supplementing the analysis and discussion by including the data for 2022 and beyond to augment the study’s strength.
Footnotes
Declaration of Conflicting Interests
The authors declared no potential conflicts of interest with respect to the research, authorship and/or publication of this article.
Funding
The authors received no financial support for the research, authorship and/or publication of this article.