



Abstract
Although a plethora of studies examine the determinants of profitability, this study adds to existing literature by assessing whether foreign direct investment (FDI) inflows make any significant contribution to profitability. To do so, the article uses disaggregated annual data relating to the Indian manufacturing sector 2012−2019. Results obtained from employing panel data models showed that FDI inflows have a positive and significant impact on profitability. Further, our results indicate that FDI affects profitability only in the long run but not in the short run. Capital intensity and size do not affect the profitability of the Indian manufacturing sector. From a policy perspective, it is imperative for manufacturing industries in India to attract more FDI inflow in order to boost profitability in the long run.
Introduction
According to the OECD (2022), foreign direct investment (FDI) is a category of cross-border investment in which an investor resident in one economy establishes a lasting interest in, and a significant degree of influence over, an enterprise resident in another nation. FDI plays an integral role in the overall growth of an economy. Considerable research has been conducted on the role and impact of FDI, starting from economic growth (Belloumi, 2014; Fadhil & Almsafir, 2015; Pegkas, 2015), employment, productivity (Orlić et al., 2018; Yao & Wei, 2007), and other key macroeconomic indicators, both at cross-country and individual country levels. Wang et al. (2023) used a Schumpeterian economic growth model with Pareto income distribution across 126 countries to study how FDI influenced economic growth and inequality. Findings from their study showed that FDI increased inequality in developed countries but reduced inequality in emerging market economies (EMEs). Rong et al. (2020) found that FDI had a positive and significant impact on employment via labour market flexibilities in China. Moralles and Moreno (2020) studied conditions in Brazil, finding a link between FDI, positive spillovers and absorptive capacities. The effect of FDI has also been examined at the firm and industry levels in the manufacturing sector. For example, Anwar and Sun (2014) showed that FDI spillovers on domestic firms in case of the Chinese manufacturing sector are heterogeneous. Similarly, Okşak and Koyuncu (2021) detected a non-linear relationship between FDI and labour productivity in Turkey. Further, a study by Duramany-Lakkoh et al. (2021) in Sierra Leone found causality between output and FDI flows in the manufacturing sector.
From the supplier’s point of view, FDI from developed economies or even foreign investors has an underlying motive—market seeking, efficiency seeking or resource seeking. Resource-seeking investments are done with the aim of acquiring resources not available in the home country. Similarly, market-seeking investments are undertaken with the aim of exploiting new markets or maintaining existing ones. Efficiency-seeking FDI, which follows resource-seeking and market-seeking FDI, is of special interest because its primary aim is to increase the profitability of investors by exploiting the economies of scale and scope of the host economy (Dunning & Lundan, 2008). From the recipient’s point of view, there is a difference in the manner in which advanced economies and emerging markets or developing economies utilize FDI. In the case of advanced economies, firms and industries use network building and experiential learning to tap into the advantages of FDI (Delios & Beamish, 2001; Dunning, 1998). However, in the case of EMEs, FDI is used to overcome the ‘liabilities of emergingness’ in terms of the lack of infrastructure or resources in the home country (Boisot & Meyer, 2008; Madhok & Keyhani, 2012). This highlights the resource dependency theory, whereby firms and industries in EMEs use FDI as a strategic response to evolve and diversify given resource dependency and power deficiency in their home economies (Choudhury & Khanna, 2014).
The role and impact of FDI on the manufacturing sector’s output and employment in general and performance in terms of profitability in particular are important because ‘a broad and robust domestic manufacturing base is the key to successful economic development since it helps generate virtuous and cumulative linkages with other sectors of the economy, drives technological progress (industrial revolution), and has the strongest potential for productivity gain’ (UNCTAD, 2016). The development of this sector guarantees sustainability in the long run and hence developing countries in particular pay special attention to attracting FDI in all sectors, including manufacturing.
According to the World Investment Report (UNCTAD, 2012), in 2011, the value of FDI projects in the manufacturing sector increased by 7% at the global level. The greatest increase was observed in the food and beverage and chemical industries, while the value of FDI projects in the coke, petroleum and automobile industries registered the most decline. In developing economies, particularly in Asian countries, the value of announced projects in manufacturing rose by about 68%. In 2018–2019, the value of greenfield FDI in manufacturing processes declined by 14%.
In the Indian context, where, on the one hand, the services remained the largest recipient of FDI inflows, investment into the manufacturing sector constituted 42.3% of the face value of total FDI, being nearly 50% of the market value in 2020–2021. The motor vehicle group held the highest share, followed by food products and machinery and equipment. Aggregate sales of FDI companies under the Indian manufacturing sector declined slightly during 2019–2020 as well as in 2020–2021; however, food products, pharmaceuticals, electrical equipment and plastic products and chemicals recorded higher sales. The idea behind the above statistics is to show that Indian manufacturing industries have received significant FDI during the period post-financial crisis of 2007–2008 and even during the economic slowdown in 2012–2013. India acquired the highest inflow of FDI till date, approximately US $86.44 billion, in the financial year (FY) 2021–2022. The incoming FDI equity in the manufacturing sector rose to US $21.69 billion in FY 2021–2022 from US $11.84 billion approximately (FY 2020–2021). This is an increment of approximately 76%, as per the Ministry of Commerce & Industry, PIB Delhi. With a significant inflow of FDI in manufacturing post 2007–2008 and even post COVID-19 pandemic, it is of utmost importance to understand whether this foreign support is strengthening the performance of this sector.
For an EME such as India, FDI is essential for achieving economic growth, employment and investment from a macroeconomic perspective and for benefiting from advanced technology, cost-efficient and skill-enhancing techniques at the firm or industry level. Overall, FDI is needed to boost the performance of an institution. There are a reasonable number of studies emphasizing different aspects of the relationship between FDI and the manufacturing sector, such as FDI and manufacturing in exports (Goswami & Saikia, 2012), FDI and average wages and wage inequality (Baranwal, 2019), FDI and manufacturing employment (Pradhan et al., 2004), and FDI and vertical and horizontal spillover in the manufacturing sector (Sasidharan & Ramanathan, 2007). Similarly, a few papers have also examined the role of foreign factors in determining the profitability in the Indian manufacturing sector (Bhattarai & Negi, 2020; Nanda & Panda, 2018).
This article adds to the existing literature by identifying the following research gaps. First, while a few studies have examined the role of foreign factors such as foreign ownership, technology spillover and FDI spillovers, to the best of our knowledge, none of them have examined the effect of FDI on profitability by considering various industries within the manufacturing sector. The flow and effects of FDI vary from one industry to another industry. Thus, it is important to examine the heterogeneous industry-level effect of FDI on profitability. Second, this study considers the FDI approval for the industry over a period of time rather than the FDI as percentage of equity shares held by foreign national in a firm as a factor. This particular aspect is expected to give a more robust and clear-cut scenario of FDI in the manufacturing sector. Third, the study examines the effect of FDI on profitability both in the long run and in the short run. Although a few studies in the past have examined the effect of FDI on profitability, it is important to investigate whether FDI affects the profitability in the same manner in both the long and short runs. Theoretically, one would expect that FDI inflows into an industry may not boost its profitability immediately because the firms that operate within that industry may require time to understand the technology being transferred from developed countries to a developing economy, or the approval itself may be realistic after a certain period. However, in the long run, the benefits of FDI inflows on an industry’s profitability will be significant.
The remaining sections of the article can be summarized as follows. Section 2 contains a review of the literature. The data and methodology used in this study are discussed in the third section. The empirical results of this study are analysed in the fourth section, followed by the authors’ conclusions in the fifth section.
Review of Literature
A plethora of literature notes the impact of FDI on firms and the industry, as well as factors that determine the profitability of firms. This section is divided into two parts: the first deals with studies conducted to analyse the relationship between foreign assistance and profitability in foreign countries, and the second talks about the studies conducted to analyse this relationship in the Indian context.
Studies by Azolibe (2021) on the manufacturing sector in the Middle East and North African region and Yun (2001) in the case of the Korean manufacturing sector empirically examined the impact of FDI on performance indicators and found that it had a significant and positive impact on the growth and price cost margins in the manufacturing sector. Similarly, Gurbuz and Aybars (2010) examined how domestically owned, majority foreign-owned and minority foreign-owned companies listed on the Istanbul Stock Exchange were impacted by foreign ownership and found that the positive impact of foreign ownership was limited to minority foreign-owned companies. Fu et al. (2021) found that in the case of Chinese manufacturing firms, a reduction in tariffs significantly increases the profitability of firms through improvements in imported intermediate inputs and a decrease in costs of inventory.
Moving ahead, some studies even claimed that FDI not only improved profitability but also led to other benefits or channels that further enhanced firm or industrial performance. Rutkowski (2006) studied 13 Central and East European countries (CEEC), showing that FDI not only increased the profitability of domestic enterprises in the CEEC region but also strengthened the market position of these enterprises, such that new entrants were reduced. Hence, results showed that FDI increased profitability and reduced concentration in the industry after controlling for endogeneity. However, another study conducted in Portugal by Pacheco (2020) showed that the extent of foreign ownership did not show a significant relationship with the profitability of small- and medium-sized manufacturing enterprises. However, a nonlinear relationship was observed between the profitability of manufacturing SMEs and incoming share capital from institutionally more diverse economies, and such firms were more profitable.
Studies examining the link between FDI and spillover effects in the manufacturing sector are also found, contributing greatly to the research literature on the topic. These include the effect on labour productivity in the Canadian manufacturing sector (Globerman, 1979), vertical spillovers in the case of manufacturing firms in Vietnam (Newman et al., 2015) and market-oriented FDI generating spillovers largely through competition with local firms in China (Li et al., 2001).
In the Indian context, a study by Adamou and Sasidharan (2007) on the impact of research and development (R&D) and FDI on the manufacturing sector showed that while R&D had a positive impact on the growth of the sector, FDI showed mixed results, with some industries, such as computer hardware in high-tech sectors registering higher growth—implying better performance—while other industries registered lower growth, and thus, a less satisfactory performance. Similarly, the relationship between FDI and spillovers has been widely discussed in the form of spillover effects from different sources and their impact on various sectors (Banga, 2001) and the impact on productivity, be it labour or output, of industries in Indian manufacturing (Athreye & Kapur, 2001; Kathuria, 2000, 2002) over a period of time.
Chawla (2022) studied the influence of outward FDI on the functioning of Indian manufacturing firms and found that it had an insignificant impact on the total factor productivity of the firms but had a complementary impact on the sales and export performance of these firms. This disparity might have resulted from shortcomings in analysing the differences between the impact of being a first-time foreign investor and being a foreign investor over a period of time. On similar grounds, Bhattarai and Negi (2020) found FDI to have played a vital role in increasing profits, wage employment and sales across the construction material sector in India. This positive impact was expected to be accompanied by advanced technology and improved management techniques that usually follow FDI.
Listed above are some studies that, to the best of our knowledge, relate FDI to the profitability of manufacturing in the Indian scenario. Hence, we conclude that the relationship between FDI and profitability in the manufacturing sector in the Indian context is yet to be explored. Accordingly, studying the impact of FDI on the profitability of Indian manufacturing industries and the direction of causality between FDI and profitability forms the main focus of this study.
Methodology and Data
Methodology
To examine whether FDI inflows affect the profitability of the Indian manufacturing sector, the present study employs a family of panel data models. We consider 19 two-digit disaggregate industries in the Indian manufacturing sector, and our data comprise the annual frequency of all the variables from 2012–2013 to 2019–2020; hence, the use of panel data models is more suitable for analysis. First, we estimate the objective through fixed-effect (FE) and random-effect (RE) static panel models to produce results. However, these are not free from endogeneity. To overcome this problem, we further estimate the objective using panel two-stage least-squares (Panel 2SLS) using appropriate instruments. Finally, to check the long-run and short-run impact of FDI on profitability, we use the panel autoregressive distributive lags (ARDL) and the panel Granger causality test. The baseline model for the determinants of profitability can be written as follows:

In Equation (1), profit refers to profitability, FDI is foreign direct investment inflows, LP is labour productivity, size refers to industry size, CI stands for capital intensity, μit is industry specific characteristics, νit is a white noise, which follows i.i.d (0, σ 2 ), α and βs are unknown parameters to be estimated, i refers to number of industries, i = 1,2, 3,…19, and t refers to time, t = 1, 2, 3,…, 8.
The choice of variables on the right-hand side of Equation (1) along with FDI is based purely on a review of literature on the determinants of profitability at an industry and/or firm level. The theoretical justification and a priori relationship with profitability are highlighted in this section. Further, to address the endogeneity issue, the study uses the panel 2SLS model. The model can be written as follows:

The instrument variables, namely FDI at lag period 1, labour productivity (LP), capital intensity (CI) and size, have been chosen on the basis of a priori knowledge of the relationship among the variables. FDI represents a factor external to the industry and size, labour productivity and others are factors within the industry. There are existing studies too that validate the relationship between these instrumental variables (see, for example, Ahmed, 2010; Amador, 2011; Artige & Nicolini, 2010; Chaudhuri et al., 2013; Sawhney & Rastogi, 2019). In the 2SLS method, after estimating Equation (2) at the stage, the estimated values of FDI are replaced in Equation (1), and the second stage estimation is done.
Size
Demirgüneş & Üçler (2015) studied the inter-relationship between firm profitability and firm size using quarterly data from Turkish manufacturing industries. Results estimated for the long run using the dynamic OLS method showed a significant negative relationship between profitability and size. The direction of causality was from size to profitability. Becker-Blease et al. (2010) studied the profitability and firm size for 109 SIC 4-digit manufacturing industries in the USA. Results showed that while 52 industries showed no relationship between size and profitability, 11 industries showed a positive relationship between firm size and profitability. Thus, this relationship was industry-specific. However, profitability was negatively correlated with the number of employed persons in firms of a certain size calculated in terms of sales and total assets. Razaq and Akinlo (2017) studied the relationship between profitability, size of firms and growth of 115 listed non-financial firms in Nigeria. Using GMM, results showed that the relationship between profitability and size is significant and negative. Similar results were found by Yadav et al. (2022) in emerging and industrial markets in the Asia Pacific region. The positive growth profit but negative size profit results suggest that at first, profits rise with the firm’s growth. But, over time, profit rates decrease for larger firms, indicating that, after a point, an increase in size leads to inefficiency. In this study, size is calculated by dividing the value of output by the total number of factories for each industry (Rath, 2004).
Labour Productivity
Pérez-Gómez et al. (2018) studied small and medium-sized manufacturing enterprises in Spain. Their study revealed a positive relationship between labour productivity and profitability, thereby highlighting the importance of training and skill development of employees leading to efficiency. Chaudhuri et al. (2010) studied three manufacturing industries in India, namely, auto components, chemicals and electronics. Labour productivity was found to have a significant impact only in the electronics industry. Industries’ decisions to expand and enhance efficiency were cited as one of the reasons. Choi et al. (2013) studied subsectors in the construction industry in the USA. Their findings showed that industry subsectors with greater productivity were more profitable in terms of gross margins. In this study, labour productivity is defined as real net value added (real NVA) divided by the total number of people employed.
Capital Intensity
Capital intensity for manufacturing companies is vital for cost management and investment decisions. Oeta et al. (2019), who studied manufacturing companies listed on the Nairobi Stock Exchange, found a positive but insignificant relationship between capital intensity and firm performance. Nangih and Onuora (2020) studied how capital intensity influenced the profitability of quoted oil and gas firms in Nigeria. Findings showed that firms that were highly capital-intensive performed better financially. Gamlath and Rathiranee (2013) studied the insurance and banking companies listed on the Colombo Stock Exchange and concluded that capital intensity proxied by the capital intensity ratio, that is, dividing the total assets by the sales and the firm’s financial performance proxied by the profit margin and return on assets have a positive and significant relationship. In this study, we calculated capital intensity by dividing the capital stock by the total number of people employed. Capital stock is calculated by the perpetual inventory method (Appendix A).
Before estimating Equation (1) using the panel data models, we first checked for the stationarity of each variable using the Levin, Lin and Chu (hereafter, LLC; Levin et al., 2002) and Im, Pesaran and Shin (hereafter, IPS; Im et al., 2003) unit root tests. The LLC test assumes a common autoregressive parameter for all panels; hence, this test does not allow for the possibility that some industry variables contain unit roots while other variables do not. Every test executed also makes the assumed behaviour of the number of time periods and panels precise. Similarly, IPS allows for common time effects, time trends, and individual time effects. Based on the average of the individual Dickey–Fuller t-statistics of each unit in the panel, this test assumes that every series is non-stationary under the null hypothesis.
Next, we use the fixed-effects model (FEM) and random-effects model (REM) to examine our objective. Starting with FEM, this technique has the advantage of controlling all time-invariant omitted variables. Additionally, omitted variable bias is also prevented by variables that do not change over time. But in this model, the randomness of how the variables behave is fixed, which is a major disadvantage. Coming to REM, the dimensional conditionality is relaxed. REM allows inclusion of the variables that vary in the same dimension, called the random effects. However, these two models fail to address the issue of endogeneity. Hence, we used the panel 2SLS method. When an independent variable is endogenous or determined jointly with a dependent variable, the estimated model results in inconsistent estimators and an inflated variance of estimators (Baltagi, 2001). Thus, omitted variables lead to an endogeneity problem. This problem is dealt with by introducing instrumental variables, which eliminate the relationship between the independent variable and the error term depending on certain assumptions, namely, instrumental variables having no correlation with the error terms, instrumental variables having correlation with the regressors or the independent variables. Subsequently, the panel ARDL technique was applied to analyse the long-run and short-run relationships between profitability and its determinants. Our aim was also to understand the direction of causality. Thus, this study uses the panel Granger causality test.
Data
This study is based purely on secondary data, and its duration extends from 2012–2013 to 2019–2020. 1 The choice of starting year is based on examining the profitability of industries and FDI inflows after the global financial crisis, and the end period is based on the availability of the latest data. 2 A total of 19 two-digit industries have been covered, namely food products, beverages, textiles, leather, wood, paper products, chemicals, coke and refined petroleum products, printing and recorded media, pharmaceuticals, rubber, metallic minerals, basic metals, fabricated metal products, computer and electronics, electrical equipment, machinery and equipment, motor vehicles and other transport equipment. The data on profit, output, number of factories, total employees and gross fixed capital formation were taken from the Annual Survey of Industries (ASI, n.d.). The deflators for each industry were taken from the Reserve Bank of India (RBI). The FDI approval data were sourced from the Secretariat of Industrial Approvals (NIC). While ASI follows the National Industrial Classification, 2008 (NIC, 2008), SIA does not. Thus, we had to map FDI approvals to each industry, which is set out in Appendix B. Profitability was calculated as real profit and as a percentage of real output for each industry. Gross profit and value of output were deflated using industrial indices for the respective industries. FDI was calculated as a percentage of output. Labour productivity was calculated as real NVA divided by the total number of people employed. Real NVA was calculated by dividing net value added by industrial indices for each industry. The total number of people employed was used, so as to get a picture of the overall employment condition of each industry. Capital intensity was calculated by dividing the physical stock of capital by the total number of people employed. Finally, the size of the industry was estimated by dividing the value of output by the total number of factories, to understand the average factory-wise distribution of production.
Results and Discussion
Preliminary Analysis
Figure 1 gives a rough idea of the trend and relationship between FDI and the profitability of the manufacturing industries. There is a weak but positive correlation of 0.0338. This lays further groundwork for investigating the causation and impact.
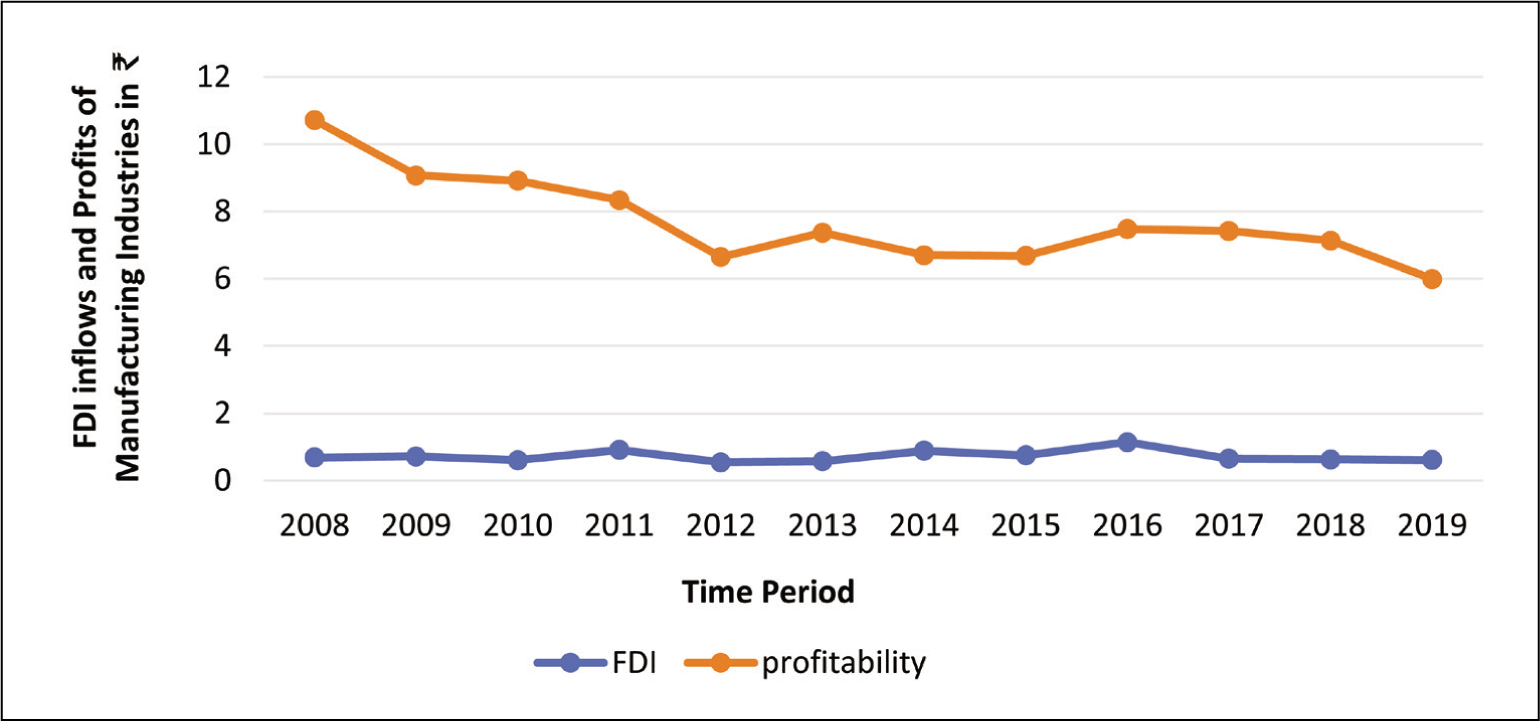
Figure 2 shows the FDI inflows in INR in some key industries in the manufacturing sector, namely automobiles, computer hardware and software, electronics, industrial machinery, air transport, chemicals, drugs and pharmaceuticals, food processing and textiles. In particular, we noted that FDI inflows in any of the industries do not display any increasing or decreasing trend in any of the industries. As per the SIA Newsletter, post the 2007–2008 financial crisis, FDI inflow in individual sectors has been inconsistent. The computer hardware and software have received the maximum FDI inflows in the past 5–6 years. The chemicals and automobile industries also received significant FDI shares, which declined significantly during the COVID-19 pandemic.
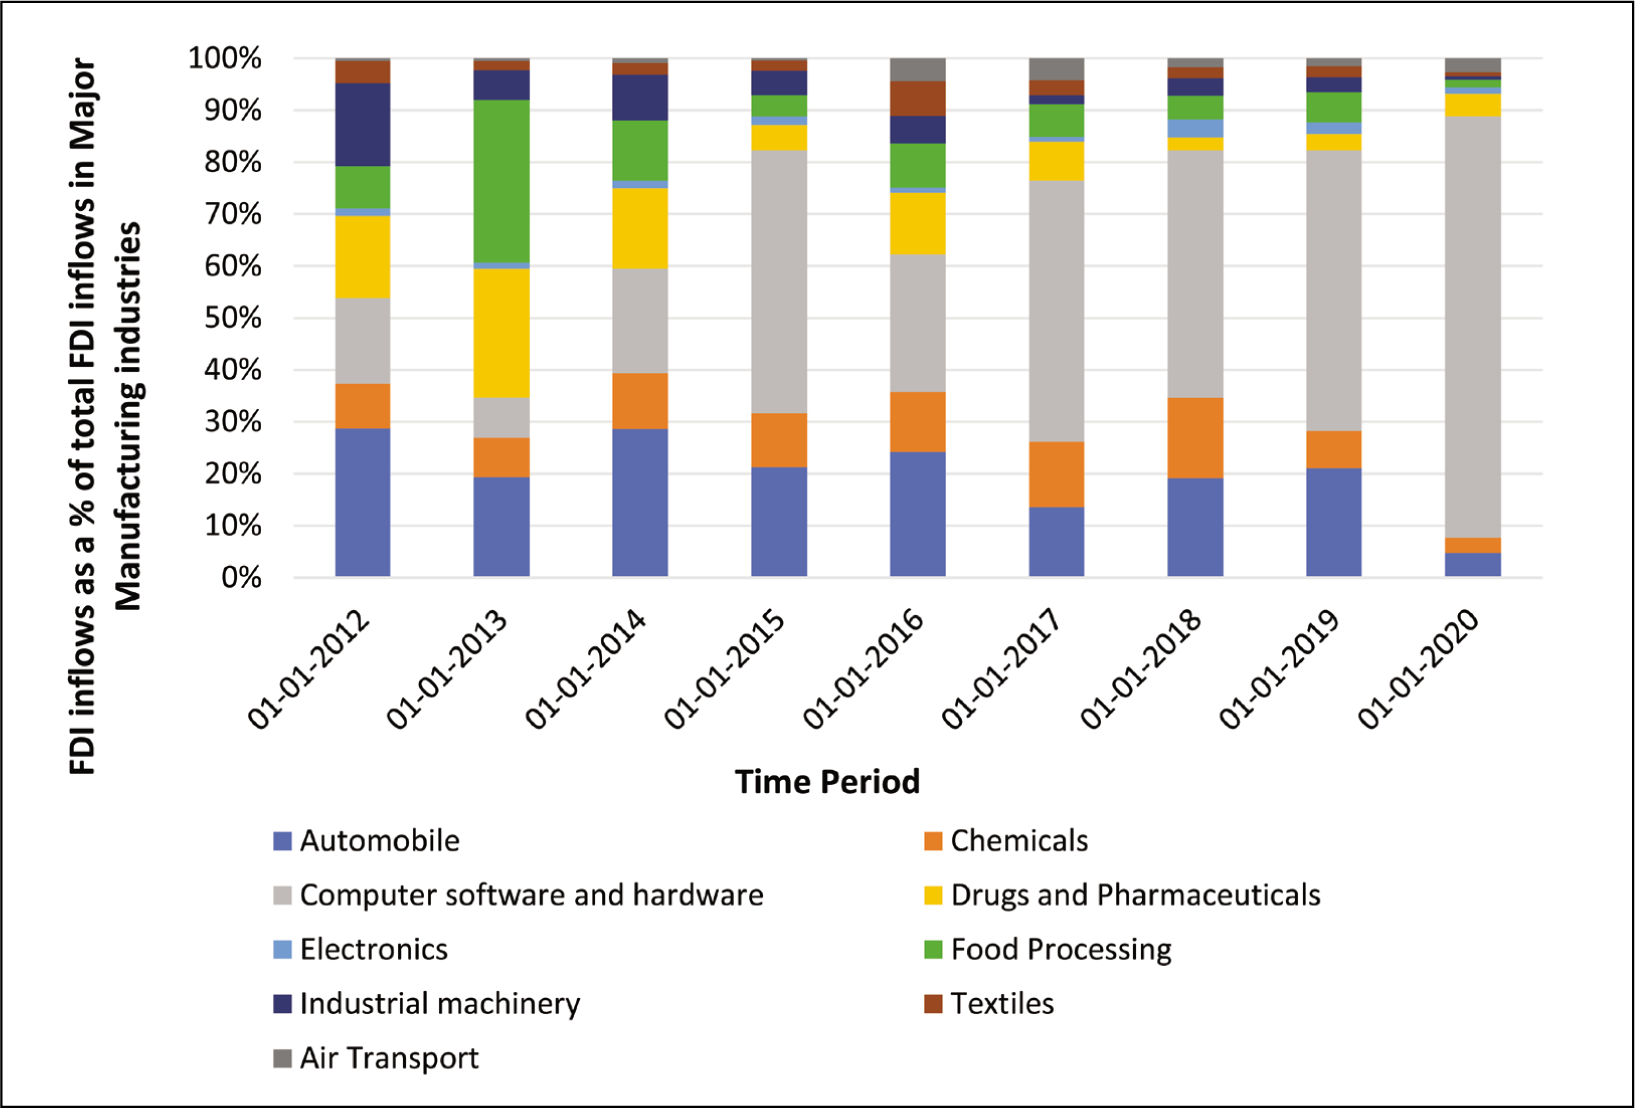
Figure 3 shows that manufacturing industries under NIC 20, that is, chemical and chemical products, and under NIC 21, that is, pharmaceuticals, registered a substantial increase as well as consistent profits. NIC 10, food products and NIC 29, motor vehicles followed a similar suit. However, NIC 26, namely computer and electronic products, has almost consistent but not very high profits.
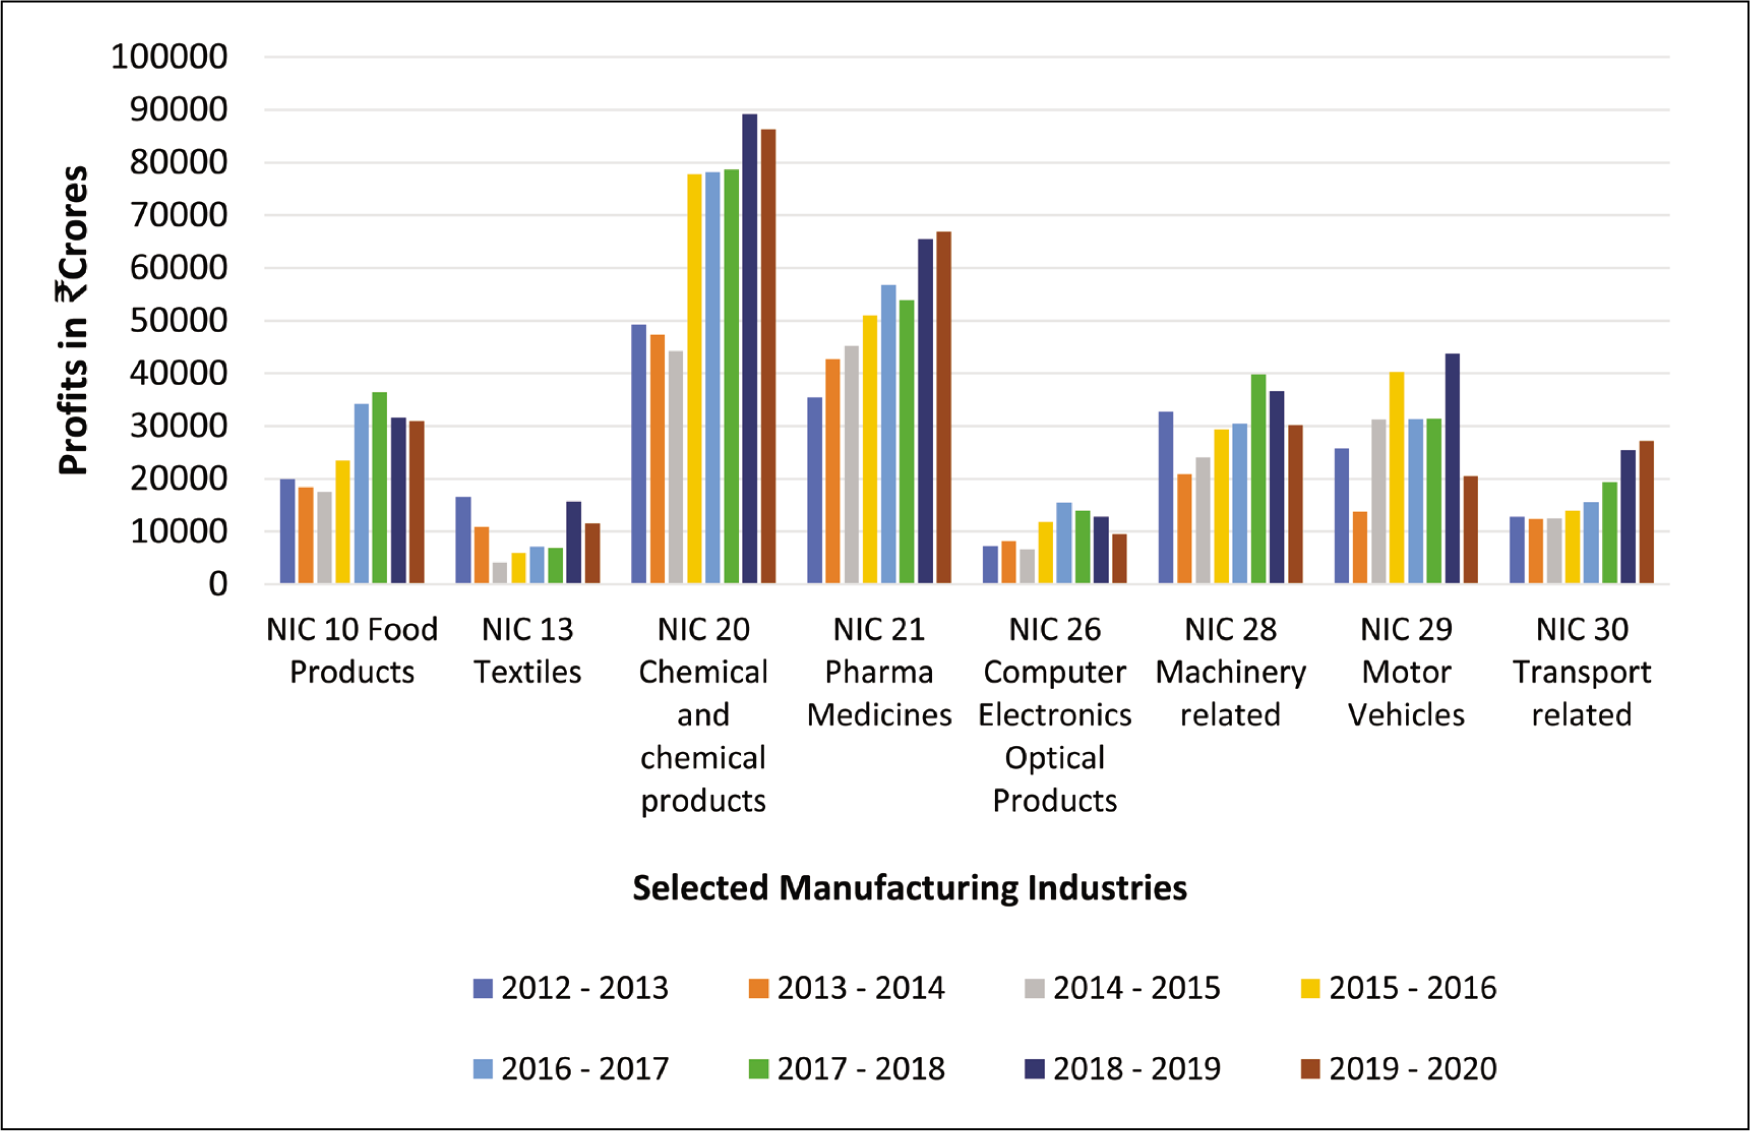
On the basis of this graphical analysis, we obtained greater grounds to investigate whether FDI is to some extent responsible for this increase or decrease in profits.
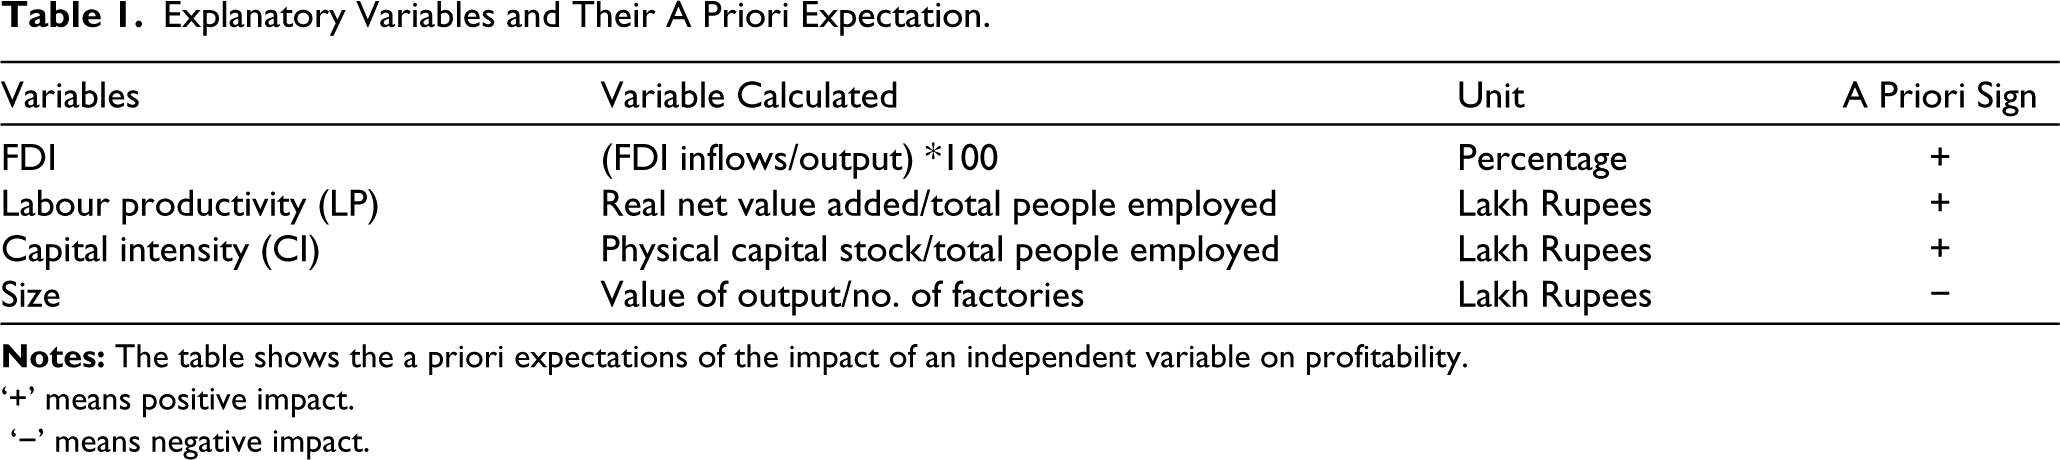
Table 1 briefly explains the explanatory variables and their a priori expectation. Table 2 illustrates the descriptive statistics for all the variables used in Equation (1). Table 2 presents various statistics such as the mean, median, skewness, kurtosis and Jarque–Bera test. The mean for profitability is 7.544, which indicates moderate profitability for the industries. The mean of FDI is 3.28, which is lower than that of profitability, indicating a lower amount of FDI inflows as compared to profitability. Skewness for profitability is 0.84, which is moderately symmetric. Skewness in the case of capital intensity is considerably high with a value of 5.40, indicating that capital intensity for a few industries is much higher than that for others. The kurtosis for all the variables is high, indicating the presence of outliers. Among them, capital intensity seems to have a higher number of outliers, again pointing to the fact that capital intensity for some industries during certain periods is much higher than for others. The outliers have not been trimmed so as to reflect the actual essence of the variables. In addition, as the duration is relatively small, outliers are not removed so as to avoid further shortening it.
Explanatory Variables and Their A Priori Expectation.
‘+’ means positive impact.
‘−’ means negative impact.
Summary Statistics.
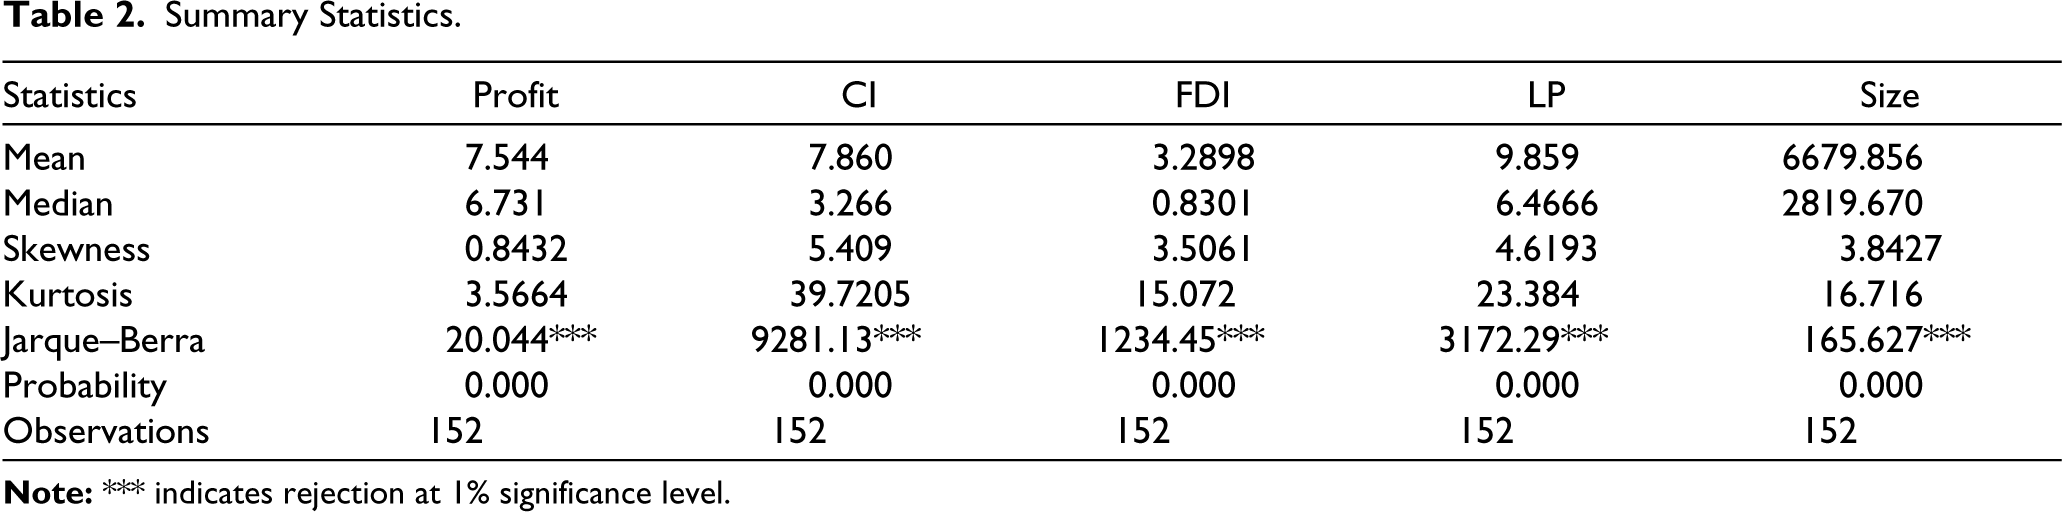
Table 3 shows the correlation among independent variables. There is a weak negative correlation between FDI and capital intensity. This result is inconclusive as the relationship between capital intensity and FDI is ambiguous and subject to the industry or the time frame of study. Labour productivity and capital intensity show a strong positive correlation. This implies that with the advancement of capital-intensive techniques, the output, or NVA per unit of labour, will increase. This indicates an increase in labour efficiency. The correlation between labour productivity and FDI is moderately negative, thereby indicating that FDI spillovers are not effective in increasing labour productivity. The correlation between size and capital intensity is strongly positive. This highlights the fact that, with an increase in the size of industry, capital-intensive technology can be more effectively implemented with better results. The relationship between size and FDI is moderately negative, so we cannot say much about its implications. The relationship between size and labour productivity showed a strong positive correlation, implying that the larger the size of the industry, the greater the number of workers it can employ.
Correlation Matrix.

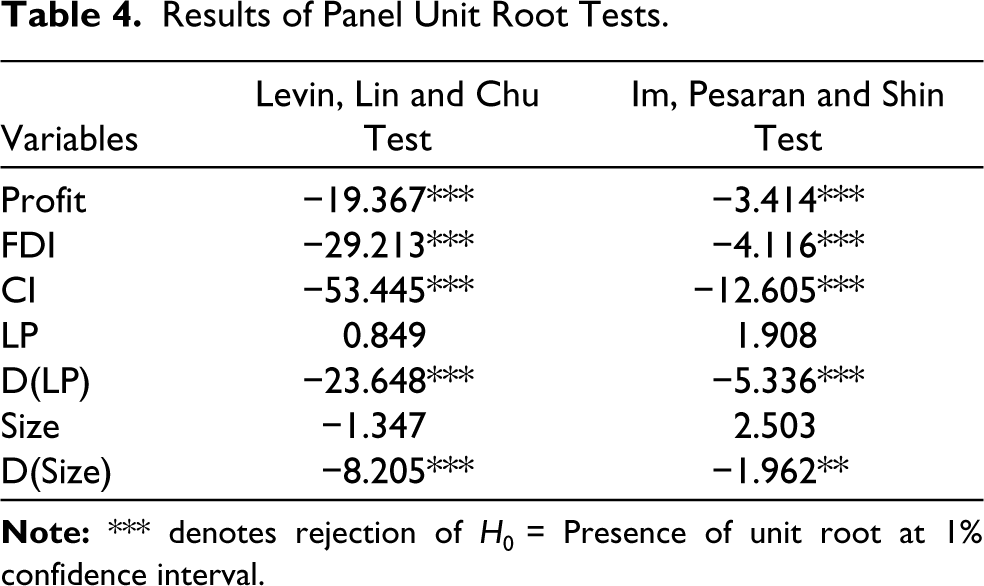
Table 4 shows that except for labour productivity (LP) and size, all other variables are stationary at level I(0). Size and labour productivity are stationary at first difference I(1). As noted previously, we used the LLC and IPS tests. The LLC test is a widely preferred method in models where there is no cross-sectional dependence and is better than the ADF test in terms of power. The IPS test allows for individual effects, time trends and common time effects. It is not as restrictive as the LLC test, since it allows for heterogeneous coefficients. Monte Carlo simulations reveal that for small samples, the performance of the IPS is more reliable. Both tests give similar results. There is no conflict in the results between the two techniques.
Results of Panel Unit Root Tests.
Results
Column 1 in Table 5 shows results from the FEM-FDI as a percentage of output, which has a significant and positive impact on the profitability of the manufacturing industries. This confirms the results of studies conducted for the manufacturing industries in other countries. In this study, an increase in FDI as a percentage of output by 1% will increase profit as a percentage of output by 0.07%, ceteris paribus. Labour productivity also positively and significantly impacts the profitability of industries. This highlights the underlying theory that an increase in labour efficiency is vital for the performance of industries. In FY 2019, growth in labour productivity in the Indian manufacturing sector was 10.9 % on a year-on-year basis. Between 2013 and 2019, labour productivity registered a minimum growth of 5.5% in 2014, while the maximum of 14.1% was seen in 2016. Thus, year on year, there was a growth of 9.38% on average, as per the Ministry of Statistics and Programme Implementation. The profits of Indian manufacturing also grew from US $79,226 million in 2012 to US $79,590 million in 2019. This further supports our findings that labour productivity and profitability go hand in hand. Industry size showed a negative but significant impact on the profitability of industries. This also confirms findings from existing literature that increasing the size of an industry or firm leads to managerial inefficiency. However, since the coefficient value of size is zero, there is a negative relationship, but there is no impact on the given set. Hence, industries should aim at reaching the optimal size to reap the maximum profit. The impact of capital intensity on profitability is negative and significant at 10% significance. One reason for this could be that capital intensity is a firm’s risk, hence its negative relationship with profits (Lee, 2010). The super game theory supports this negative relationship, but the model of entry deterrence supports a positive relationship between capital commitment and profitability (Ghemawat & Caves, 1986). Super game theory denotes situations where the same game is played repetitively and players are interested in their long-run average payoff. This theory points out that capital intensity can impact profitability because costs incurred in advance and stiff competition eliminate future profits. Net profits reported on the basis of an accounting system that ‘capitalizes’ unrecoverable expenditures instead of expensing them immediately may decline with capital intensity. The entry deterrence theory, or the magnitude of sunk costs, helps determine the profits that can be generated through pre-emption, as firms entering any industry have to undertake irreversible sunk costs depending on capital-intensive technology. Given these high sunk costs, if the profits earned by new entrants are not sustainable enough, they will not enter the industry. Lesser competition means greater profitability. Thus, we can conclude that the impact of capital intensity can be case-sensitive.
Column 2 in Table 5 shows results from REM-FDI as a percentage of output has a positive impact on profitability, but it is significant at the 10% confidence level. It is lower and less significant as compared to the results in FEM. It is hypothesized that the variability of FDI inflow within the given timeframe is what accounts for it. Referring to the SIA newsletter, we found that most industries do not show a consistent trend. Approvals for FDI are subject to a number of factors accounting for this unevenness in flow. It is primarily because of the decision to release funds from the investing country or organization to India and various FDI deals signed between the Indian government and those investment companies. Labour productivity has a strong and positive impact on the profitability of the industries. An increase in labour productivity by 1 unit would increase profitability by 0.15%, ceteris paribus. Capital intensity is seen to have a negative impact on profitability and is significant at the 10% confidence interval. This result is similar to the FEM results. The size of the industries has a negative and significant impact on their profitability, but here again, the coefficient is zero, so there is no impact on profitability. Hence, while expanding firm size and industry size, it must be taken into account that it has a substantial impact without resulting in diseconomies of scale. Despite the similarity of results from both FEM and REM, we applied the Hausmann test and found that the null hypothesis is rejected at the 10% level of significance, and hence the FEM is more suitable.
Results of the Determinants of Profitability.
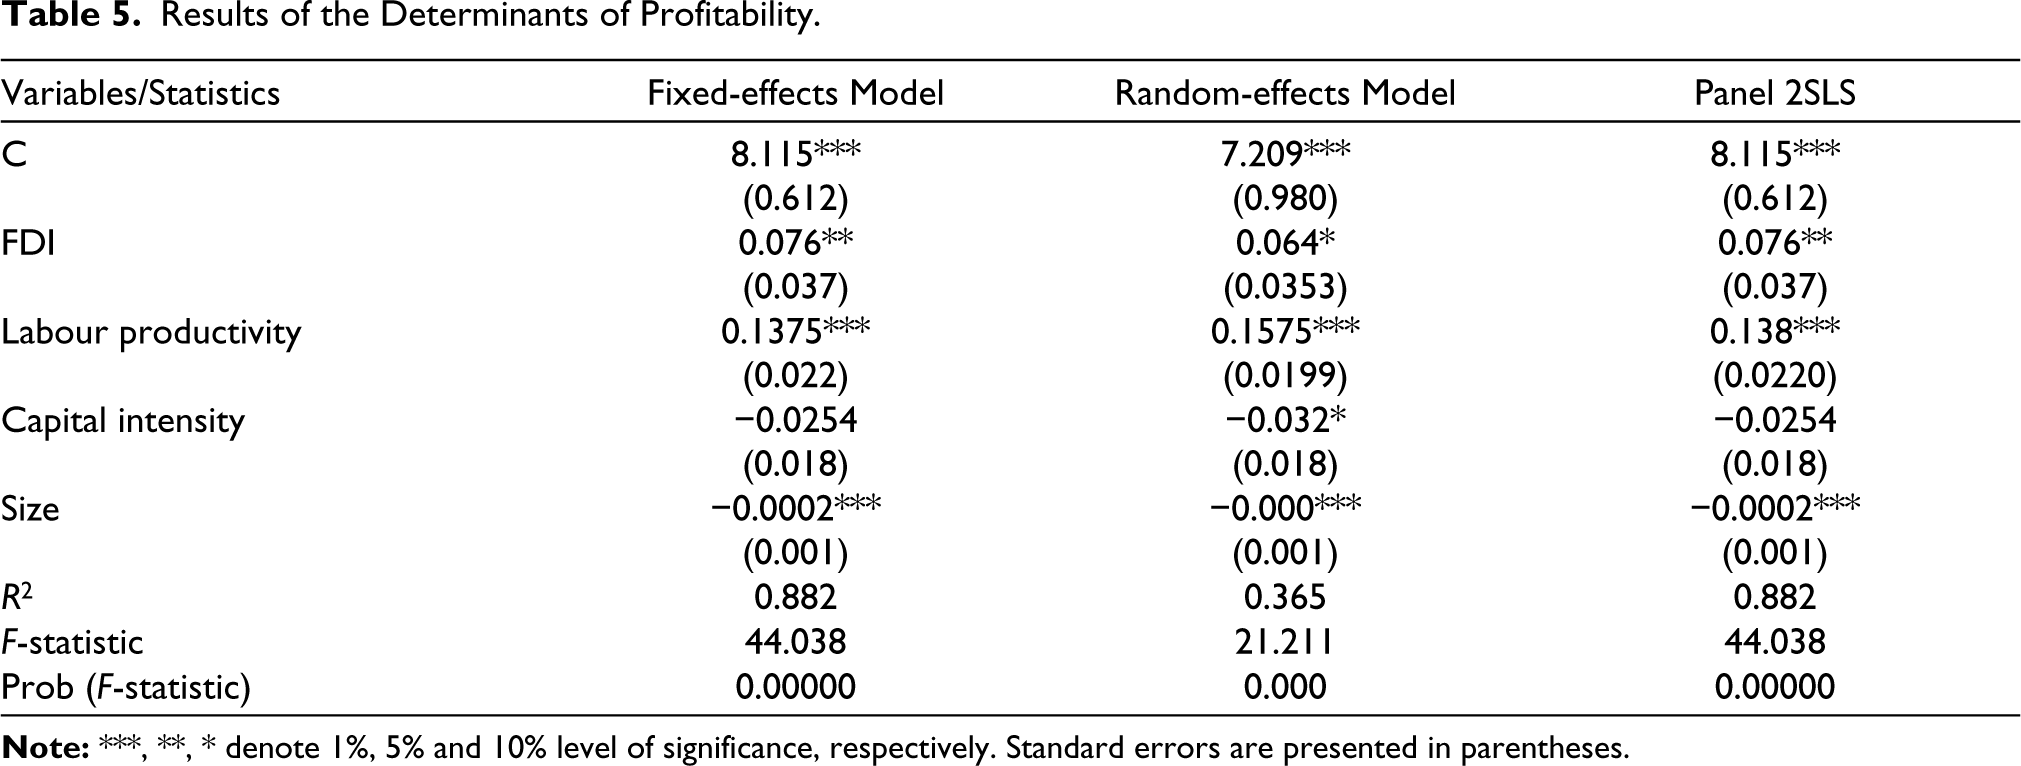
Column 3 shows results from the panel 2SLS test, FEM and REM take into consideration time-specific dummies and the randomness of variables, respectively. Still, the problem of endogeneity remains unaddressed, and to correct this, the present study uses the panel 2SLS. FDI is observed to have a significant and positive impact on profitability. Labour productivity strongly and positively impacts profitability, the size of the industry negatively impacts profitability. Capital intensity has an insignificant impact on the dependent variable. Given that the results from 2SLS are consistent with the results derived from panel FEM, we can say that our findings are free from the endogeneity problem.
Robustness Analysis
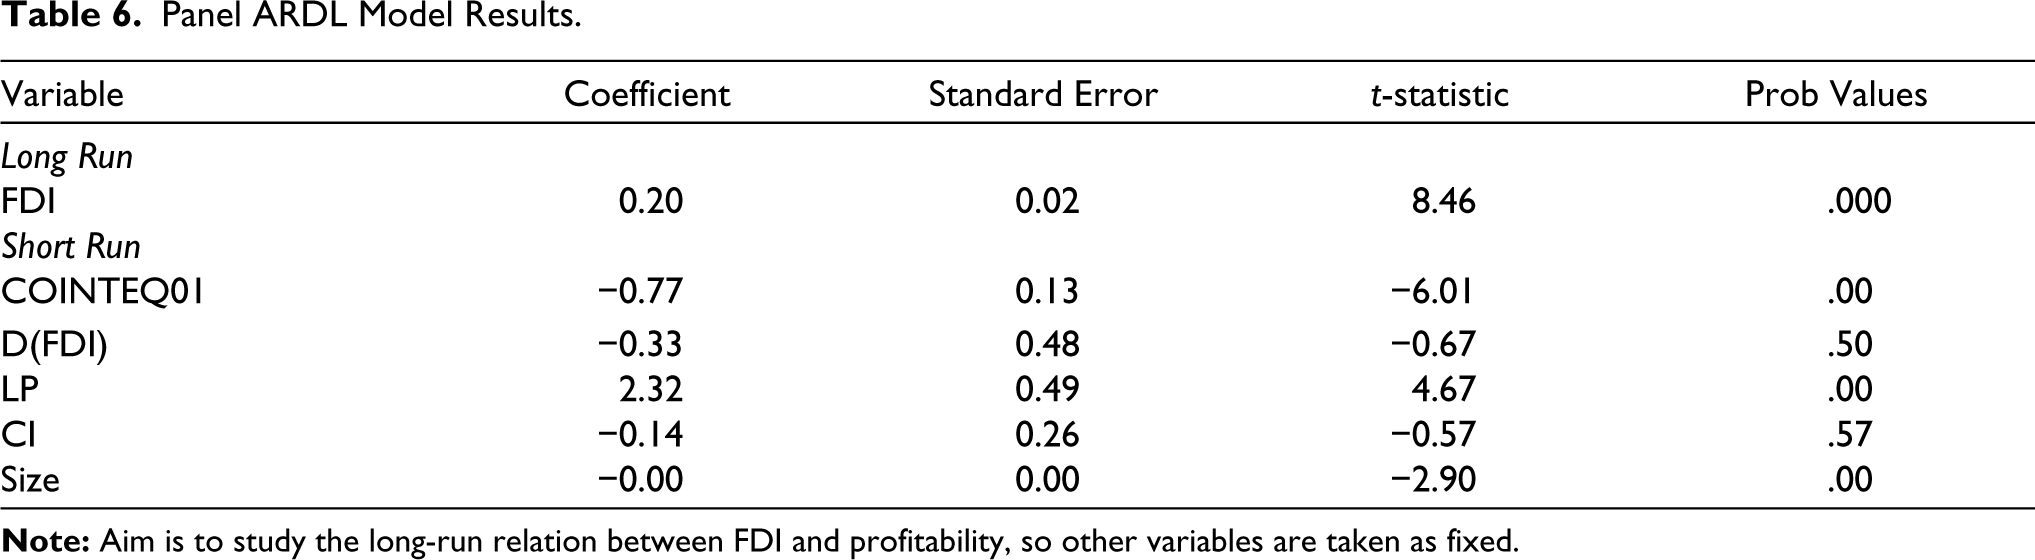
To understand the existence of long-run and short-run relationships between profitability and FDI, we further use panel ARDL (Table 6). The results show that a positive relationship exists between profitability and FDI in the long run. This coincides with the underlying fact that benefits from FDI take time to materialize. Under the diagnostics test, when this relationship was checked for the short run, we observed that the relationship was not significant. Typically, FDI inflows from foreign countries to domestic firms are mostly routed through technology transfer. Therefore, one would not expect the effect of FDI on profitability immediately in the short run. This could be a plausible explanation. Besides FDI, all other variables were fixed because we wanted to focus on the relationship between FDI and profitability.
Panel ARDL Model Results.
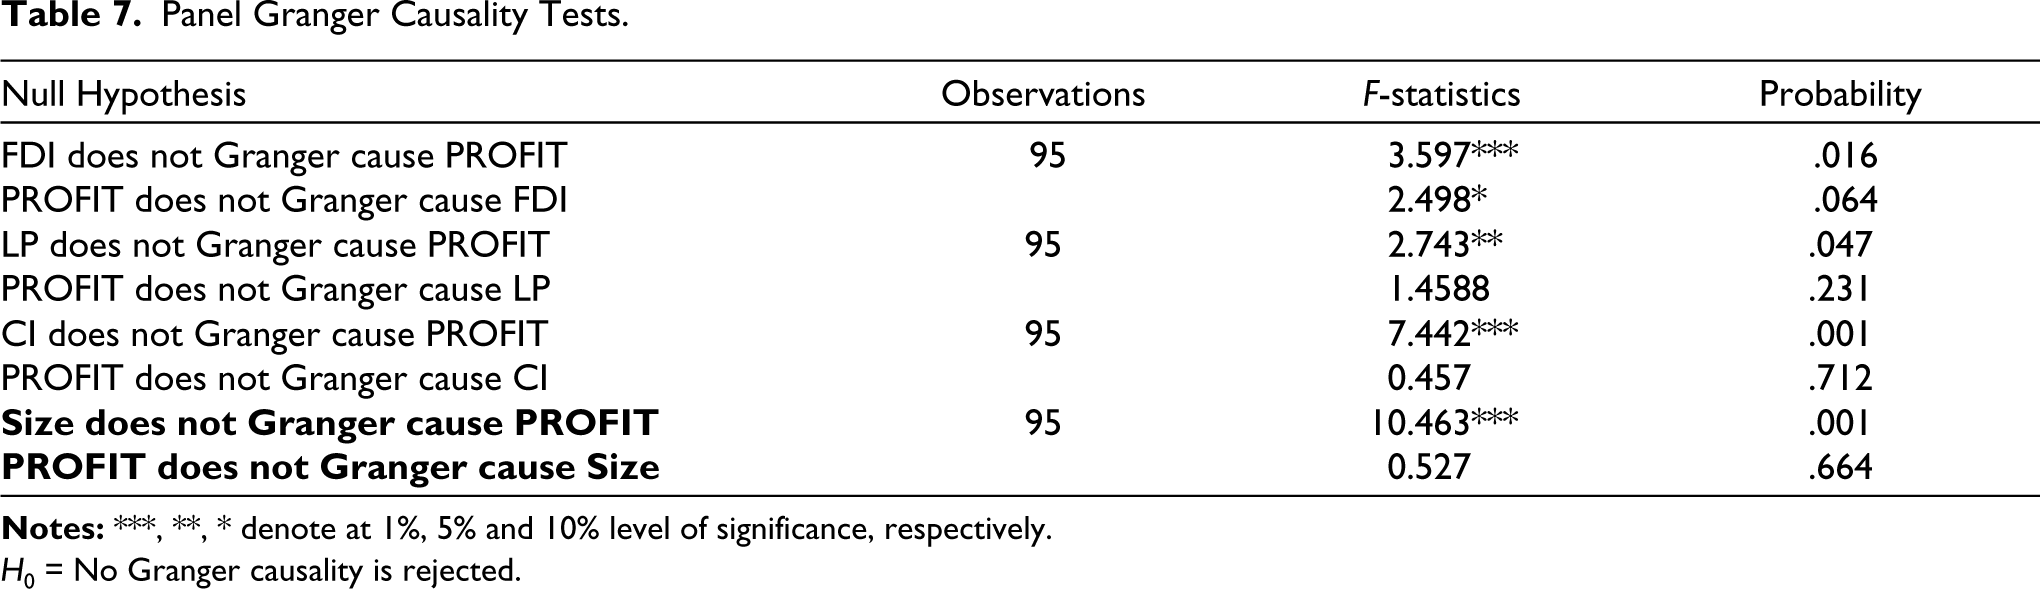
Panel Granger Causality Tests.
H0 = No Granger causality is rejected.
The study also aimed at studying whether the direction of impact is bi-directional or unidirectional between the variables. From Table 7, we can infer that FDI has an impact on profitability, but profitability does not have an impact on FDI. Hence, the causality is unidirectional. This finding is supported by the fact that between April 2000 and September 2022, the automobile sector received the maximum FDI, followed by the chemical manufacturing, drug and pharmaceutical manufacturing and food processing industries as per DPIIT, and Figure 3 shows that these very industries registered a significant increase in profits during the period 2012–2019. Labour productivity is seen to have an impact on profitability, but not the other way round. So, causality is unidirectional and runs from labour productivity to profitability. As pointed out by then ILO Viet Nam Director Gyorgy Sziraczki in 2015, for businesses in general, increased productivity leads to higher profit and greater opportunity for investment. For workers, increased productivity can translate to higher wages and better working conditions. This means that higher profits further lead to higher wages, which further increase labour productivity. However, the causality from profit to labour productivity in this study is not significant, probably because the causality from profits to productivity takes a longer time to materialize than the frame of data reviewed in this study.
We observed that capital intensity also had an impact on profitability, but profitability does not have an impact on capital intensity. Causality in this case is also unidirectional. Size has an impact on profitability, but profitability does not have an impact on industry size. Again, in this case also, causality is unidirectional. Given the complex labour regulations and tax burden, firms, and thereby the industries, have little incentive to expand in size. A smaller size results in fewer tax hassles. Hence, despite the impact of size on profits, profits do not have an impact on the size of the industry. Smaller industry size makes it difficult to exploit economies of scale for the industry as a whole (Joumard et al., 2015). This could also be one of the reasons why profits do not have an impact on capital intensity.
Conclusion
The Indian manufacturing sector has strong potential for expansion, both in terms of volume of output and competitiveness in the world market. Expansion, however, depends on the profitability and attractiveness of FDI in this sector. This article has analysed the effect of FDI on profitability in the case of Indian manufacturing. By employing a panel data model, the results showed that FDI had a strong and positive impact on profitability. Further, FDI is seen to have a long-run impact on profitability but not in the short run. Besides FDI, labour productivity also positively affected profitability. Productive labour means an increase in the quality and quantity of output with full utilization of resources. This study utilizes the latest data from ASI to obtain a focused picture of each two-digit industry on a year-on-year basis, irrespective of whether the old firms were shut down or new firms joined the industry. This centres on the industry and not on the firm’s composition. This analysis can be further updated from an industrial point of view, given the updating of ASI data beyond 2019.
From the standpoint of policymakers, it is imperative for the government to come up with a concrete plan to attract more FDI inflows to the Indian manufacturing sector. The increase in investment through the FDI route will not only increase profitability but also increase the capacity of these two-digit manufacturing industries to produce and export more output in the long run. The government can also target some labour-intensive industries and ensure that FDI inflows into these industries increase in the long-run. Since labour productivity positively affects the profitability of the manufacturing sector, higher inflows of FDI will enhance technology transfer from developed to developing economies such as India. As a result, it will increase the skill of these work forces.
Footnotes
Declaration of Conflicting Interests
The authors declared no potential conflicts of interest with respect to the research, authorship and/or publication of this article.
Funding
The authors received no financial support for the research, authorship and/or publication of this article.