



Abstract
Purpose:
This study aims to analyse the medical and non-medical respondents’ health literacy (HL) and eHealth literacy (eHL) across coastal Karnataka with a goal of improving health governance.
Methodology:
This research uses pieces of literature published on HL and eHL and sociodemographic factors to roll out a questionnaire survey for respondents from Karnataka, India. The primary study used the independent T-test to distinguish the 260 participants and Spearman’s correlation to determine HL–eHL association.
Findings:
Independent T-tests showed that medical respondents had a significant higher health literacy in only one scale and a higher mean score as well. The sociodemographic tests revealed that non-medical respondents showed differences based on gender, prescription use and chronic illness. Using Spearman’s correlation, HL and eHL were found to have a positive but weak correlation.
Practical Implications:
The participants’ varied eHL scores, coupled with their high HL scores, underscored a significant inconsistency in the economic strategies and the health governance in coastal regions.
Theoretical Implications:
Sustainable development framework followed in this study provides direct implications for multifaceted theories of UN Sustainable Development Goal 3: good health and well-being, Goal 4: quality education, Goal 5: gender equality, Goal 11: sustainable cities and communities and Goal 17: partnerships for the goals.
Research Limitations:
The study only covers Karnataka’s coastal region, which may differ from other regions in India’s coastal belt. However, the interoperability challenges identified through the differing HL and eHL parameters have broader implications.
Originality/Value:
Previous research found fewer sociodemographic differences in coastal HL and eHL proficiency. The relationship between HL and eHL on India’s coasts has rarely been studied.
Introduction
Health literacy (HL) is defined as individuals’ ‘competency to acquire, understand and apply basic health information to useful decisions’ (Kindig et al., 2004). The twenty-first century public health goal and 2030 UN Sustainable Development Goal 1 emphasize the requirement of participative decision-making among communities and health care providers. HL across communities is a key to advancing other SDGs, including poverty eradication, better education and reduced inequality. Maritime tourism affects the economy of countries like India, and thus coastal health governance requires adequate health and eHealth literature.
UN agencies, state and national governments, NGOs and grassroots organizations have collaborated to raise HL rates and improve health in poor countries (Murthy, 2021). A study conducted in Telangana (India) revealed uniform low digital HL among the urban and rural ageing population (Patel et al., 2023). eHealth literacy (eHL) or digital HL is important because many people are wary of long stays in coastal areas due to the lack of city amenities, sea disease concerns and land investment uncertainty. Digital health solutions like electronic patient and health records and interactive medical devices support sustainability’s health and well-being goal in this region. eHL had a positive association with personal health, quality of life and reduced risk of chronic diseases (Green, 2022).
eHL is the ‘use of electronic resources to acquire, understand and adopt basic health care requirements’ (Norman & Skinner, 2006b). Researchers have mostly speculated, either directly or indirectly, that eHL is based on HL, which in turn includes literacy (Monkman et al., 2017). So, in its way, eHL has much relevance in the new digital world. It has been critical particularly during the global epidemic (Norman et al., 2020) or in regions that lacking adequate physical infrastructure. eHL can be linked to determinant of health (van Kessel et al., 2022) and is essential particularly in the regions of low and low-middle income countries (Patel et al., 2023). By providing requisite microlevel data and statistical tests, this study aid bureaucrats for decision-making pertinent to coastal area health and tourism development.
India has over 1 billion population (Silver et al., 2023) with a literacy rate of 74.04% (KnowIndia, 2020). The doctor-to-population ratio is 1:1456 in the country which is far below WHO’s recommended 1:1000 (Goel, 2020). The mobile phone availability and internet usage are correlated (Iyer & Sethuraman, 2024; Social Media Matters, 2024). In India, 86% smartphone owners are youngsters and consequently could be the reason for inadequate dissemination of health information on internet platforms.
The eHL encompasses traditional literacy, HL, information literacy, scientific literacy, media literacy and computer literacy as the core skills, and is influenced by various factors including age, gender, education, income, availability and accessibility to the internet (Dashti et al., 2017; Meppelink et al., 2015). While HL is a concern to all stakeholders involved in health promotions and protection (Kindig et al., 2004), the abilities to use electronic sources for health information is beneficial, especially for adolescents, who often consider internet as their primary and most reliable resource (Manganello, 2008). Adolescents should know how to evaluate and utilize the internet for their medical and health inquiries, as per the guidelines published by the American Medical Association for patients (Hale et al., 2014). This will help them to manage their health remotely.
Prior literature has focused on HL concerning paper-based texts and resources, rather than literacy in electronic-based environments (Kindig et al., 2004). Only a few studies have explicitly looked at eHL, focusing on specific groups such as college/university respondents (Park & Lee, 2015), the elderly (Manafò & Wong, 2012) and caregivers (Knapp et al., 2011). The measurement of eHL among the younger population has been limited (Park, 2019), and this education should start from basic university level (Liu et al., 2015). Most of the studies in many regions of the world (Holt et al., 2020; Hsu et al., 2014) and Karnataka (Ogorchukwu et al., 2016; Rao et al., 2020) focus on health in generic.
The studies conducted in coastal regions of India also revealed the associations between the eHL and the HL. According to the research conducted at a tertiary hospital in coastal Karnataka using the REALMS questionnaire, patients had a very low level of HL (Kamath et al., 2013). A study in Udupi, India (Cuthino, 2018), found a significant difference in HL levels between health science and non-health science respondents and varying literacy levels based on sociodemographic factors. This research aims to analyse the HL and the eHL in less urbanized coastal regions of India. India’s increased mobile subscription (Statista, 2021) and vision Digital India Campaign give eHealth the utmost importance. It plays a crucial role in reaching out to the country’s remotest corners. Therefore, eHL plays an essential role in understanding and judging eHL in our society.
HL/eHL research challenges in coastal areas are aggravated as self-medication, and well-being practices in these tourist locations have seasonal variations. The adequacy level of HL and eHL among the coastal region respondents and how sociodemographic factors (such as gender, family involvement in health care, medication usage and presence of chronic conditions) influence these literacies in coastal regions are the scope of the current study. By conducting a tailored HL assessment in the coastal areas, the study focuses on the UN sustainability goals, including gender equality, good health and well-being. The current study about the HL gap between the non-medical and medical respondents emphasizes the importance of SDG-4 quality education that is ‘inclusive and equitable quality’ among the communities. It aims at bringing actionable insights from the data collected from the coastal area respondents. Data collected on sociodemographic factors address SDG-5 and SDG-10 regarding the possible gender disparities and inequality of health outcomes in coastal regions of India. The implications for SDG-11 and SDG-17 goals are significant in this study by addressing communities’ resilience against health challenges due to coastal and tourism activities and collaborative requirements to overcome those challenges.
This article identifies the health and eHL levels among the respondents through a cross-sectional survey. It examines the association between HL and eHL, and the sociodemographic characteristics then compare and contrast the degree of association between HL and eHL. Further, the implications for health governance of differing HL and eHL among the participants are discussed. The article is organized as follows: The first section discusses research importance, The second section gives the review of literature and the third section delineates the methodology. The fourth section analyses the results, followed by a section that discusses and implications, and finally, the last section gives the concluding remarks.
Theoretical Background
HL is one of the top priorities of public health for the twenty-first century (Nutbeam, 2000). People suffering from chronic illnesses may struggle to interpret health information and interact with healthcare practitioners (Friis et al., 2016). HL is associated with low preventive healthcare, poor medication adherence, late attendance at health facilities, poor self-management of chronic illnesses, communication gaps with healthcare providers, increased death rates and the medical system’s inability to meet patient needs (Osborne et al., 2013). HL has been studied for its potential to manage chronic and infectious diseases in low-income countries (Budhathoki et al., 2017; Castro-Sánchez et al., 2016). Creating HL profiles in different groups aids in identifying areas that require improvement and mapping the interventions to reduce health disparities and enhance health outcomes (Batterham et al., 2016; Muscat et al., 2016).
Several studies have examined how sociodemographic factors affect HL. Vamos et al. (2016) found that age, gender and parental education affect the US college respondents’ HL. Parental education was linked to higher Health Literacy Questionnaire (HLQ) scores in public health respondents (Elsborg et al., 2017). These trends were also confirmed by Turkish Adult HL research (Terzi & Alkaya-Ayaz, 2019). Gender, study year, subject, socio-economic status, urban or rural location and parental education affected college respondents’ HL (Zhang et al., 2016).
In Ghanaian study, gender differences in HL and education improvements suggests HL courses and awareness events in health and non-health science colleges (Evans et al., 2019). Rababah et al. (2019) found higher HL in female respondents, health-related course respondents and healthy lifestyle respondents. Rao et al. (2020) found that senior health science and allied health science respondents had higher HL than medical and dental juniors. Research indicates that despite the availability of health resources via mobile sources, most college respondents lack basic eHL skills for effective information seeking and evaluation. A study by Escoffery et al. (2005) found that only 11% of 743 college respondents consistently located the eHealth information they needed, while the majority struggled. Buhi et al. (2009) observed that most students found answers to sexual education questions using online information.
Despite being frequent internet users, university respondents’ perceived ability to assess eHL material differed (Ivanitskaya et al., 2006), which estimated the eHealth information competency of 308 college respondents using Readiness Self-Assessment Health Scale developed by Ivanitskaya et al. (2004). While 84% of respondents rated their searching skills as good or excellent, almost two-thirds could not search complex information tasks. Only 50% of participants could assess the credibility of other health and eHealth websites. Hanik and Stellefson (2011) examined 77 undergraduate college respondents’ perceived and actual eHL and found that actual mean eHL scores (39.3%–50.4%) were much lower than perceived eHL scores (75.3%–78.5%). Similar gaps existed between 75 occupational therapy respondents’ confidence in finding and applying internet material to clinical situations (Brown & Dickson, 2010).
The Lily model, developed by the authors of eHEALS, includes HL as one of the six skills required to optimize an individual’s experiences of eHealth sources. They defined HL as an external skill that assesses communication, health care system awareness and hospital health information comprehension (Norman & Skinner, 2006a). A study (n = 36) indicated a correlation between the health literacy measure and eHealth literacy skills and suggested the need for further research (Monkman et al., 2017). Another study found a statistically significant relationship between HL and internet health information use (Shabi & Oyewusi, 2018). HL and eHL were positively correlated and are considered to be important for patient education programmes (Stellefson et al., 2019). This study found moderate correlations between eHL and HL in terms of dimensionality (Neter et al., 2015). This suggests investigating HL and eHL’s possible relationship. Research on demographic characteristics and eHL showed statistically significant associations (Rezakhani Moghaddam et al., 2022), and a family in health care was used to select the sociodemographic factors (Holt et al., 2020).
Methodology
Questionnaire and Study Population
The constructs of questionnaire-based literature review, included dichotomous variables and questions derived from the HLQ and eHealth Literacy Questionnaire (eHLQ) (Holt et al. 2020; Kayser et al., 2018; Osborne et al., 2013). Its initial validation, involving a pilot study with 36 participants, confirmed that the 24 questions could be completed in about 5 minutes. The study focused on long-term tourists who stayed for 4 to 5 years in India’s coastal Karnataka region, specifically in Udupi and Dakshina Kannada districts, and selected them through convenience sampling. The questionnaire was distributed both online through Google Docs as well as offline, collecting a total of 260 responses.
Data Analysis Process
Data analysis for the pilot study was conducted using the SPSS software, assessing skewness, kurtosis and normality with various statistical tools like Q–Q plots and box plots (Kline, 1998). Descriptive statistics reported frequencies and means, while internal consistency was evaluated using the Cronbach Alpha test. Exploratory factor analysis (EFA) was performed using SPSS, with the Kaiser–Meyer–Olkin and Bartlett tests assessing data suitability (Dziuban & Shirkey, 1974). Confirmatory factor analysis (CFA) was conducted using Smart-PLS3 software, focusing on factor loadings, and convergent and discriminant validity measures. Finally, hypotheses were tested using independent T-tests and Spearman’s correlation tests.
Result Analysis
Pilot Study Results
Medical practitioners validated the questionnaire, providing feedback on its effectiveness and structure, leading to revisions for improved relevance. The questionnaire’s internal consistency was confirmed (Table 1) with Cronbach’s alpha values of 0.85 for eHLQ and 0.89 for HLQ, indicating acceptance as per Nunnally’s (1978) criteria.
Descriptive Stats of Pilot Stats.

Participants Descriptive Statistics and Literacy Levels
The participants’ descriptive statistics are given in Table 2 and mean values for each scale measured using SPSS have been provided in Table 3: Respondents, on average, agreed with statements HL1 to HL5 and found the tasks easy on HL6 and HL7, as indicated by the mean value above 4 (>4). HL7 had the lowest score, with a mean of 3.92 (SD 0.6).
Descriptive Stats of Sociodemographic Variables.

HL and eHL Levels Among the Respondents.

In the eHL scale, eHL1, eHL2 and eHL4 had an average close to 4, indicating general agreement with the statements. While eHL3 had a mean value nearer to 3 which indicates a bit of scepticism among the respondents on average about the safety of their health information on the internet.
Mean values of the scales for medical and non-medical respondents considered separately seem to have almost similar values for all the scales, except HL5, HL7 and eHL3, which have non-medical respondents score a lower mean, unlike in other scales.
Outliers
The outliers are displayed as small circles, suggesting moderate skewness and stars, and showing high skewness in the data points (Figure 1 and Figure 2). These skewed values were removed to give better and more precise data for further result analysis.
Box Plot of HL.

Box Plot eHL.

Normality
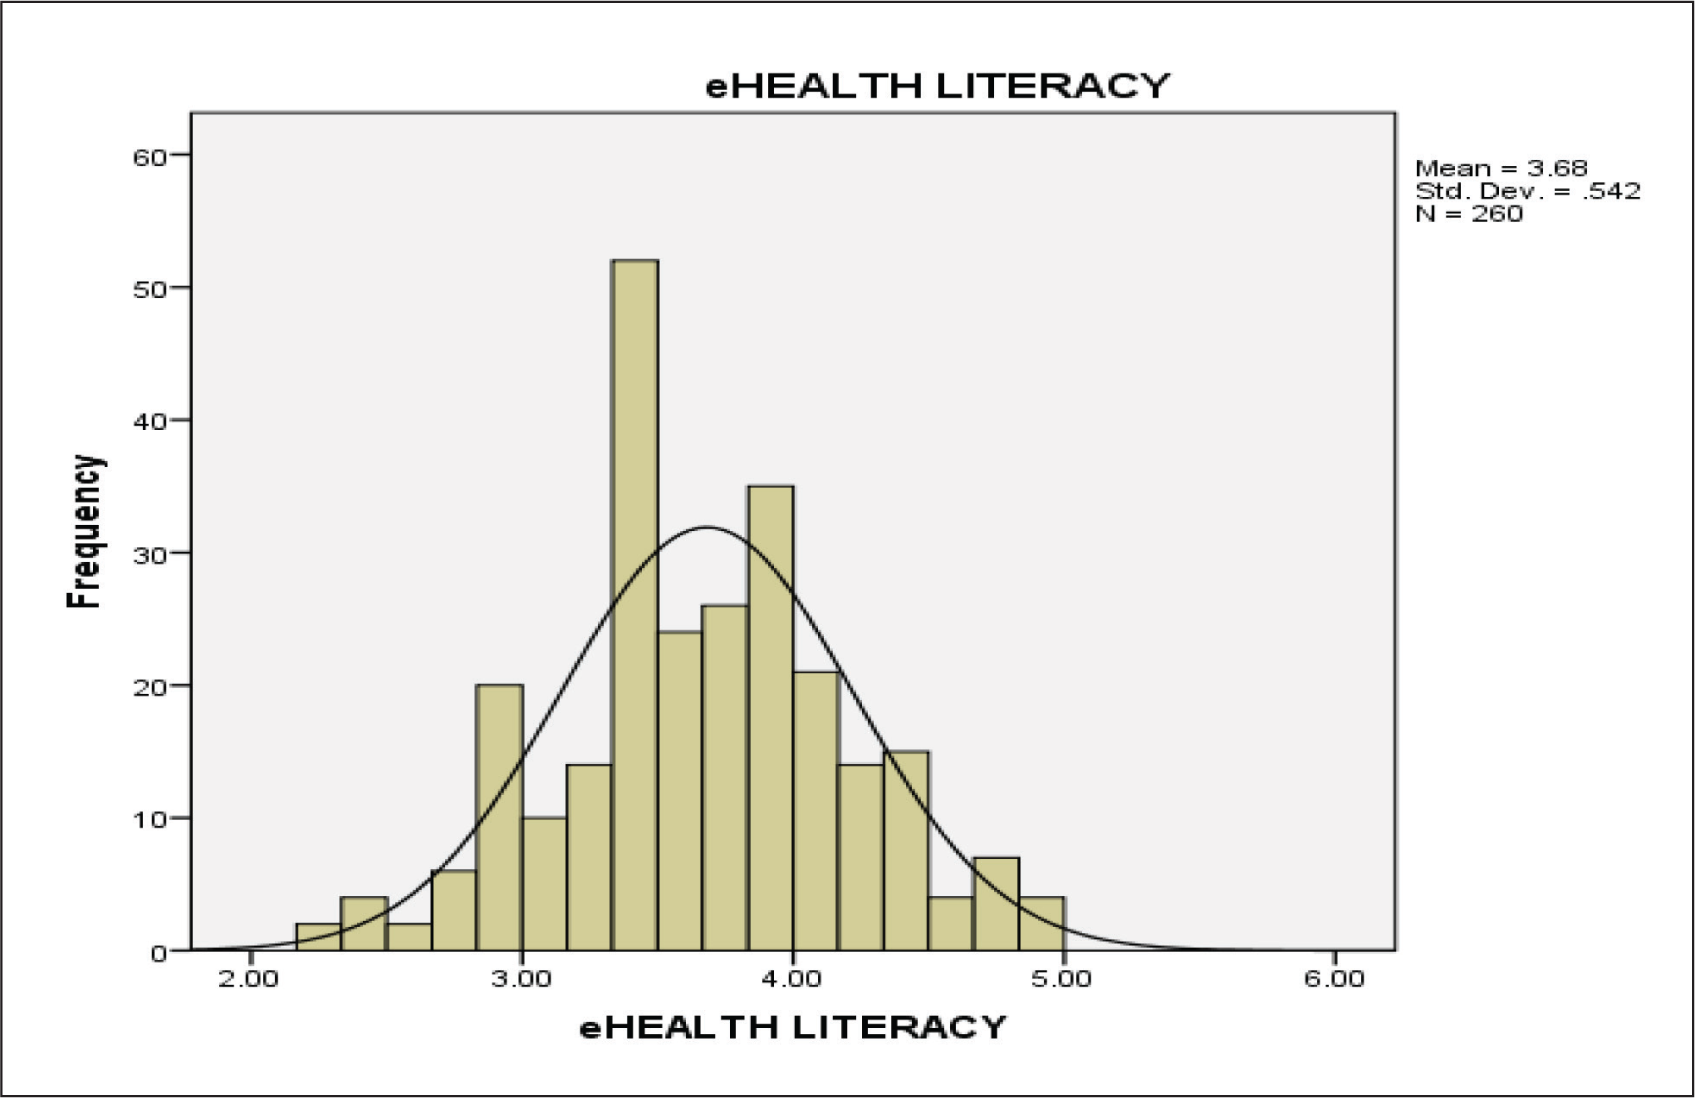
The eHL and HL scales’ values were obtained by taking the mean of all the responses under the questionnaire. Moreover, for the HL curve (Figure 3), the graph appears normal at a mean value of 4.08 (SD = 0.423) for the HL scale and a mean value of 3.68 (SD = 0.542) for the eHL scale.
HL Histogram with Normality Curve.
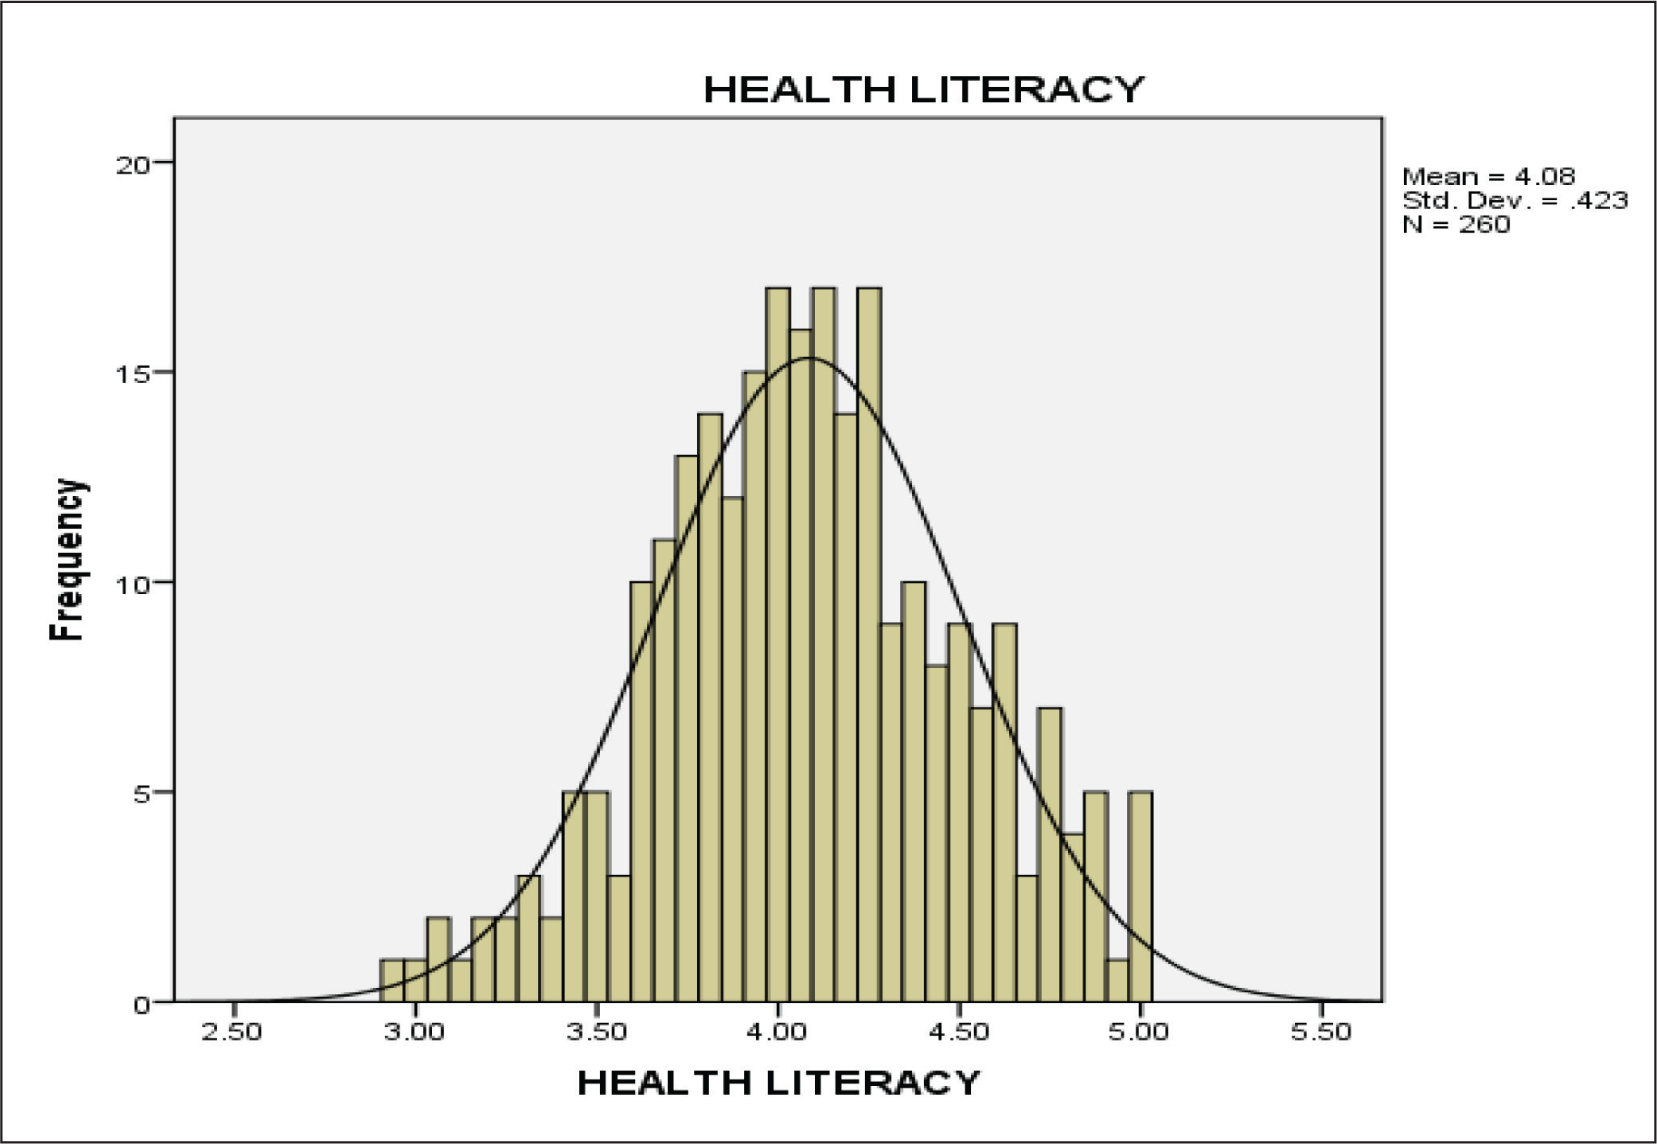
Skewness, kurtosis and z-values used to test normality (Kline, 1998; Lu et al., 2005; Nunnally, 1978) indicate that HL values (–0.45 and –0.172) align with the accepted norms (Lu et al., 2005; Nutbeam 2008). The standard error values for the skewness and kurtosis are 0.151 and 0.301 and z-values were calculated as suggested by Lu et al. (2005) and Hair et al. (2010). The resulting z-values are found to be –0.298 and –0.571 fall within the acceptable threshold value range of –1.96 to 1.96.
The eHL normality curve (Figure 4) appears normal by visual inspection. This graph’s skewness and kurtosis values were 0.35 and –0.111, the standard error values were 0.151 and 0.301, and z-values were 0.232 and –0.369, respectively, all within the acceptable range.
eHL Histogram with Normality Plot.
In the Q–Q plots for normality to be observed, the values on the graph must align at the central diagonal line, giving us a reasonable estimation of the normality of the responses (Figure 5 and Figure 6).
HL Q–Q Plot.
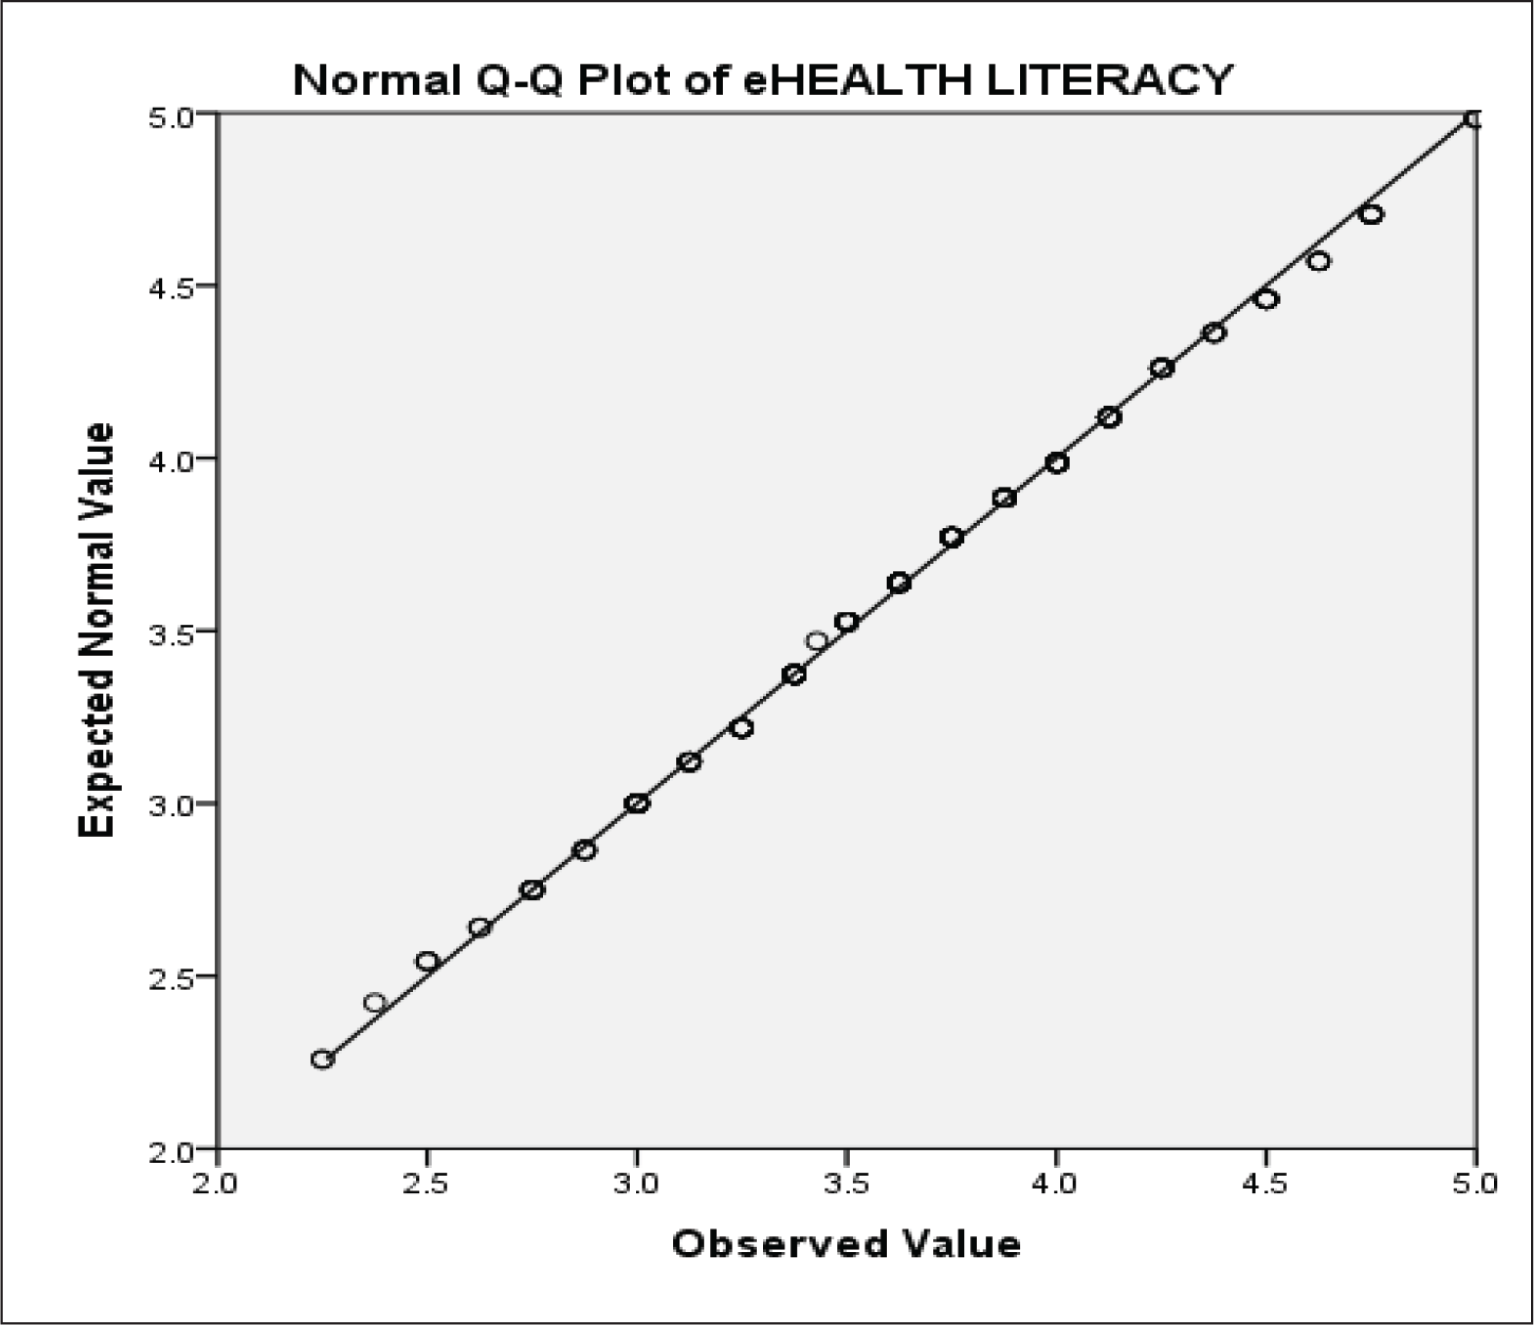
eHL Q–Q Plot.

Exploratory Factor Analysis (EFA)
EFA was carried out using principal component analysis and varimax rotation. The minimum factor loading criteria were fixated to a value of 0.40 (Dziuban & Shirkey, 1974; Howard, 2016). All the questions had factor loadings above the value of 0.4 except ‘Q9’, which was also considered a sufficient value as 0.374 is close to 0.4 cut-off value.
The study showed a significant chi-square value of 1737.455 (p < .001) for 260 responses indicating them to be significant. The Kaiser–Meyer–Olkin (KMO) test of sampling adequacy is 0.825 and is appropriate as it is above 0.800 (Dziuban & Shirkey, 1974).
The number of factors to be taken was calculated using Parallel analysis. This process gave us a total of two components to retain. Hence, the two factors derived for this questionnaire had eigenvalues of 3.691 and 1.491, which accounted for a combined variance percentage of 47.107%.
Confirmatory Factor Analysis (CFA)
Smart-PLS3 tested the confirmatory measurement model for convergent validity and discriminant validity (Fornell & Larker, 1981). In this study, all the variables were considered acceptable and used in the questionnaire as they gave acceptable average variance extracted (AVE) and composite reliability (CR) values.
Convergent Validity
Convergent validity can be measured using outer loadings of all items, which should be above 0.5 (Kline, 1998). Most of the values are above 0.5 except in Q1, Q2, Q8, Q9 and Q11, which were retained due to the adequate value of CR. The AVE is then calculated using a threshold value of 0.5 (Table 4). The AVE value of HL was 0.427, which was lower than 0.5 but was still retained, as the CR value was above 0.8. AVE of eHL is 0.512, which is above 0.5, therefore indicating acceptance (Fornell & Larker, 1981).
Fornell–Larker Criterion Table.

HL and eHL showed a CR value of 0.866 and 0.830, respectively. A cut-off value of 0.7 was taken as satisfactory and above 0.8 was taken as an excellent indicator for acceptance (Fornell & Larker, 1981). Hence, convergent validity was achieved.
Discriminant Validity
This validity test is proved when the correlation values are not greater than 0.85 or lesser than 0.15 (Lu et al., 2005). It is also achieved when diagonal values representing the square root of AVE are greater than the off-diagonal values (Hair et al., 2010). The Fornell–Larker criterion used to verify discriminant validity indicates that the components are unrelated. The heterotarit–monotrait ratio of correlations (Henseler et al., 2014) was also used by taking a threshold value of 0.9, with values less than 0.9 taken as acceptable. The HTMT ratio value obtained was 0.631, indicating acceptance and verifying discriminant validity (Table 5).
Independent T-Test Using the Field of Study.

HL and eHL Levels Among Medical and Non-Medical Respondents
The independent T-test was used to determine the differences between the mean values of the responses between medical and non-medical respondents for HL and eHL scales. Cohen’s d value was used as a measure of the effect size (ES) for this test. The ES is noted in the following manner and assigned a category for its value (small effect size, d > 0.2; medium, d > 0.5 and large, d > 0.8; Cohen, 1988). A significant difference between the means was found only in 1 of the 11 scales, HL7 (p = .034; Table 5).
Association Between Sociodemographic Characteristics and Literacy Among Medical Respondents
Independent T-test was used to compare the means of the responses between the categories of each sociodemographic variable. The demographic variables used were gender, using prescribed drugs, having a chronic condition and family working in healthcare.
Gender was not associated with any of the 11 scales of HL and eHL domains, as there were found to be no significant differences between the mean values of the male and female categories. Although there were no significant differences, the mean values indicated that male participants had largely higher mean scores than females in all the HL and eHL scales (Table 6).
Independent T-Test Using Medical Respondents Only.

The study found that participants using prescription-based drugs scored significantly higher than those who were not using any prescribed drugs in only 1 of the 11 scales on HL3. Similarly, higher values were seen in other scales, but none were significant.
Chronic conditions had no association with any of the HL or eHL scales among the medical respondents. However, surprisingly higher mean was seen in respondents who did not have a chronic condition.
Respondents who had family members in the healthcare sector scored a higher mean than the participants who had no one in the health sector in 3 of 11 scales, HL1, HL3 and HL6. None of the eHL scales showed any significant difference, but unlike HL scales which had mean scores higher for the respondents who had family in healthcare, all the eHL scales showed a higher mean for the respondents who had no family members in the healthcare sector.
Association Between Sociodemographic Characteristics and Literacy Among Medical Respondents
Gender was associated with 6 of the 11 scales, HL1, HL2, HL4, HL6, HL7 and eHL3. All the scales with significant differences had scores higher in females than in males. The others which did not show significant differences had females with higher mean scores.
Participants who answered that they have been using prescription-based medicines/drugs scored significantly higher than the ones who were not using any kind of prescribed drugs in only 1 of the 11 scales: eHL2. No other scales had any significant differences, but all the scales showed that respondents who used prescribed drugs scored higher (Table 7).
Chronic conditions were associated with literacy in 1 of the 11 scales which belonged to eHL domain ‘eHL1’. All the scale domains had respondents with chronic conditions score a higher mean.
Having a family member in the healthcare sector did not significantly influence the HL or eHL scales among non-medical respondents. However, some of them had an insignificant but considerable mean score difference between the ‘yes’ or ‘no’ answers, where surprisingly more scales had respondents who did not have any family member working in healthcare score higher (Table 7).
Independent T-test with Non-medical Respondents Only.

Association Between HL and eHL Levels Among the Respondents
Spearman’s rank correlation was used to determine the association observed between HL and eHL data and establish a relationship between them. The observed values were interpreted as weak correlation (0.1 to 0.39), moderate correlation (0.4 to 0.69) and strong correlation (0.7 to 0.89) to give us an idea of an association between the two different scales (Dancey & Reidy, 2007). There was a weak amount of correlation or marginally moderate correlation between the overall mean of HL and eHL values with a significant (p < .001) value of 0.388.
There is expectedly a moderate or weak correlation within HL and eHL scales, represented by a bold-italic font in Table 8. It also shows us values of correlation between HL and eHL, which seem to have a distribution of weakly correlated values of which some values are not significant enough to be correlated.
Spearman’s Correlation Between HL and eHL.

Discussion
This study examined HL and eHL in relation to sociodemographic factors among medical and non-medical respondents in coastal Karnataka, India, a topic previously less reported.
Hypothesis H1 could not be proven as acceptable because even though HL levels were higher among medical respondents, only one domain, HL7, was significantly higher among medical respondents compared to non-medical respondents. This might be because medical respondents are aware of the healthcare setting and are well equipped with the knowledge and terminologies and steps to be taken when visiting a healthcare setting. They are also sufficiently aware of the healthcare system around their region and know the fundamental processes and formalities in the system. Medical respondents scored higher in all the HL scales but the scores were approximately the same in eHL scales, which might tell us that using the internet for health and general perception on healthcare in digital means is similar among both sets of respondents.
Sociodemographic Findings
This study found that gender, family members being in healthcare and respondents’ health conditions influence their HL and eHL levels.
Gender
Among the medical respondents, gender influenced none of the scores as there were no significant differences between any of the scales. This was hypothesized, as both genders were enrolled in the same type of course, and there is hardly any literature reporting differences explicitly because of a person’s gender, which agreed with some previous studies (Holt et al., 2020; Terzi & Alkaya-Ayaz, 2019).
However, there was a surprising difference among non-medical respondents between female and male respondents. A significant difference was found in 6 of 11 HL and eHL scales, HL1, HL2, HL4, HL6, HL7, eHL3, showing a very high disparity between the two genders but with a small effect size. Hence, H4 hypothesis was rejected for the non-medical sector. Although it is hard to explain a difference, female respondents having a higher mean in all the scales might be because of an overwhelming number of them being from the biotechnology department, which is a more health science-oriented course than the technical courses, which constituted a significant number of boys who participated in this survey. The policymakers must address gender disparities in HL and eHL to ensure adequate access to healthcare information and services.
Using Prescribed Drugs
Respondents who took prescribed drugs scored a higher mean than those who did not take any drugs in the medical sector. Nevertheless, the differences were low, but HL3 was the only scale where those who took medications scored significantly higher. Medical respondents who are expected to have a higher HL and eHL showed little difference between the two demographics. So, the H3 hypothesis was not considered acceptable in this case.
Non-medical respondents similarly showed only one scale where the respondents who used prescribed drugs showed higher mean value than those who did not take prescribed drugs in eHL2, ‘motivated to engage with digital services’. This shows that respondents who often use medications usually search for either the medication or their underlying illness, use the internet to search for medicines and might also use it for consultation with healthcare providers, thereby displaying a significantly higher motivation to use digital media and scoring higher in all the eHL scales. The H3 hypotheses were hence acceptable in eHL but were not significant enough to be proven for HL. The policy makers can implement measures to improve patient safety, education and healthcare training, thus enhancing medication safety and health outcomes.
Chronic Condition
Respondents who reported on having a chronic illness were hypothesized to have a higher HL and eHL score, as they would be aware of the healthcare services and systems around their area. However, respondents without any chronic condition scored a lot higher in the medical and other sector, although lesser. This might be explained by medical respondents already being well equipped to handle their condition irrespective of their demographics or because of a meagre number of respondents having a chronic condition (19 out of the 260 respondents’ data was used). A total lesser than 10% should be interpreted with care. So, the H3 hypothesis was not proven acceptable.
Nevertheless, in the case of non-medical respondents, one of the eHL scales, eHL1 - the ability to process information, showed a high difference in mean with a large effect size. This shows that their chronic illness did not hinder respondents’ ability to deal with information on the internet. Sharing information about their condition, spreading literacy and getting educated about it could be considered a valid reason for this finding, hence proving the H3 hypotheses. These results can be utilized by the healthcare organizations to develop similar health portals for uploading educational materials, as suggested by Bhattacharya et al. (2020).
Family in Healthcare
Medical respondents who had a family member in the healthcare sector scored a significantly higher level of HL, therefore making the H2 hypotheses acceptable. They scored higher in HL1: feeling understood by doctors, HL3: social support from family and HL6: understanding health information, which clearly shows that having someone in healthcare would have encouraged them as they felt supported and made them a lot more understanding towards doctors. Their higher score on understanding health information shows the knowledge they would have received and the benefits of having a healthcare provider in the family. The policy makers can utilize this result to initiate mentorship programmes and family-centred care for medical students and their family members for effective decision-making and coordination.
Surprisingly, non-medical respondents displayed a higher score among the respondents who did not have a family member in healthcare, which might show a non-dependence on this demography among the non-medical respondents, hence rejecting the H2 hypothesis. The policy makers can focus on improving healthcare exposure, providing healthcare networks and education, and supporting interdisciplinary collaboration for comprehensive understanding of healthcare systems and practices, which may lead to improved healthcare outcomes.
Association/Correlation Between HL and eHL Scales
Going in line with hypotheses H5, HL and eHL were indeed positively yet weakly correlated overall. This finding is consistent with that of Neter et al. (2015), who found a moderate amount of correlation between HL and eHL, and with that of Del Giudice et al. (2018), who, although used real-life experiences in healthcare as a proxy to HL, had found a positive correlation with eHL. Other prevalent studies revealed no relation between HL and eHL. All the reviewed studies used eHEALS as the questionnaire to measure the eHL of the participants, which according to Monkman et al. (2017) had been challenged for its validity by multiple studies. HL was used as a subcategory in eHL in the Lily model proposed by Norman and Skinner (2006b). The eHEALS (Jones, 2013) and eHLQ (Kayser et al., 2019) have previously been combined with other questionnaires conducted among various populations.
Most of the scales showed weak correlations, and only one between eHL1 and HL2 showed moderate correlation, which might be because both the scales were about understanding health information. HL1, ‘feeling understood by doctors’, was the least correlated among the HL scales with eHL, which clearly indicates doctors being referred to a physical presence and the importance of having a good understanding of the patient’s problems. HL4, appraisal of information, and HL6, understanding health information, are weakly yet significantly correlated to eHL scales showing that the information the participant is subjected to or exposed to could be through any media platform, hence underlining the importance of verified health information to be promoted through the internet. Correlation within the HL scales and within the eHL scales was expectedly positive and most of them were moderately correlated.
Implications
The value of HL in low-literacy areas is well-documented (Bhattacharyya et al., 2010; ECOSOC, 2010), and it is a must to solve the problems these communities face. However, addressing concerns among respondents, adolescents and youth populations is critical, as they are the future of their families and the country. The respondents must be encouraged to live a healthier lifestyle, which requires a thorough understanding of their health needs to promote appropriate health promotion interventions. This underscores the importance of including HL-related courses and literacy events in every initiative. Notably, the study findings indicate that the respondents who have undergone HL initiatives showed a higher HL score indicating that tailored HL measures can be effective.
The findings of this study highlight the differences in HL and eHL among respondents by field of study and gender, as well as how using medications, having an illness or having healthcare workers in the family might encourage respondents to learn and become health literate. Designing HL initiatives with a focus on improving the individuals understanding of medications and prescription management could contribute to the overall health of these communities. Furthermore, this will encourage further research into the most effective strategies for improving respondents’ HL and eHL.
Although this study did not find a significant difference in literacy levels between non-medical and medical respondents, which might be due to the presence of more health-related topics in some courses, which has previously been observed as an indicator of higher HL (Sukys et al., 2017), there is still a certain amount of disparity in between the fields of study. So, the WHO’s publication Framework for Action on Interprofessional Education & Collaborative Practice (Kickbusch et al., 2013) has called for action to achieve better HL through investing in interprofessional education. Health educators should be encouraged to construct mandatory or optional tailored courses addressing HL and eHL by leveraging available tools.
Respondents can learn from one another and enhance health outcomes by combining evidence-based information with project-based and problem-solving strategic learning. It is critical to promote this in non-health respondents. This also addresses the necessity to introduce HL and eHL techniques to kids at a young age, ideally adolescents. Critical HL skills encourage young people to participate in extracurricular activities and cultivate their abilities to extract information and derive meaning from various forms of communication, which improves cognitive behaviour (Nutbeam, 2000).
The introduction of reputable internet sources and providing learning activities guided by experts or lecturers can help the respondents develop better knowledge and be more confident while using electronic health devices for information. Moreover, providing valuable feedback through activities requiring analysis can help improve the respondents’ confidence over that skill. Further research would be required to study the eHL among respondents and the factors facilitating these skills. The fact that HL and eHL have a positive correlation indicates that the two are connected. However, counterexamples found in the literature make us wonder if these notions should be examined and altered for greater clarity. The idea of educating respondents on both digital and real-life scenarios of health-related topics, emergency personnel, communication with healthcare organizations and doctors, and addressing the importance of verifying any information received could be promoted by the association being displayed on different scales, which could help educate respondents in different domains and facilitate both the topics together.
Conclusion
The goal of this study was to look at the HL and eHL levels of medical and non-medical respondents in coastal Karnataka and see if there was any correlation with sociodemographic factors. A convenience sampling method was used to obtain data from respondents who answered a self-administered questionnaire designed by combining elements from the HLQ and eHLQ.
The HL and eHL levels were found to be generally higher among medical respondents, the respondents who used prescribed medicines and female respondents in other fields. There was not enough conclusive evidence to state the same about respondents with families in healthcare or having some chronic illnesses. The research also explored the association between the HL and the eHL scales and found a weak positive correlation between them.
The results show that respondents’ backgrounds, the field of study and health conditions influence their HL and eHL levels. Educators need to be aware of the different variables that could be playing a role in influencing the respondents and accordingly assign courses and educate the individuals to help address the overall moderate level of literacy levels.
Limitation and Future Work
There are certain limitations to this research. The convenience sampling method was used to collect data for this study, which may have skewed the data towards certain groups where the data obtained was higher. Adopting a more uniform and unbiased approach to select participants for data collection in the future would help provide better-quality data. The data was collected by a self-reporting questionnaire, which means the HL and eHL were not objectively quantified, resulting in biases such as recall and information bias. In the future, having an objectively measured questionnaire might be more beneficial. It is possible that the two populations that were studied, medical and non-medical respondents, are not entirely equivalent. As a result, utilizing a longitudinal study to track changes in the same pupils over time can be a more reliable method. Because this study primarily involves literate medical and non-medical student groups, the findings may not be applicable to the broader public. Future research should focus on different demographics and ages of the people. The study is limited to students studying in the coastal areas of Karnataka, India, and the other coastal economic zones are not covered in the present study. Future studies can focus on HL and eHL among various medical courses, healthcare professionals located in the rural and urban areas of developing countries.
Footnotes
Declaration of Conflicting Interests
The authors declared no potential conflicts of interest with respect to the research, authorship and/or publication of this article.
Funding
The authors received no financial support for the research, authorship and/or publication of this article.