



Abstract
This research explores factors associated with the use of the Uber application, a successful sharing economy innovation, in South Africa. The exploratory research adapted a technology acceptance model with two other factors, perceived risks and company characteristics on behavioural intention to utilize Uber. Using a survey data of 396 respondents, this research empirically finds that ease of use, company characteristics, attitude, perceived usefulness, and level of education have significant positive impacts on behavioural intention to use Uber applications. Meanwhile, gender and age groups have negative impacts on behavioural intention. Furthermore, the study found that perceived risk has a negative impact on behavioural intention to use Uber. The research findings are of significance for management on how user insights can be applied to take advantage of new prospects to innovate and to expand their businesses and for policymakers on how to seize the opportunities presented by such innovation and develop appropriate policy frameworks.
Introduction
The notion of a sharing economy (SE1) has been in existence for centuries; in fact, it is claimed to be as old as human civilization. However, in the last decade (2010s), this phenomenon has been drawing a lot of attention and focus, particularly due to the way in which digital technologies have presented numerous opportunities for sharing and collaboration. The phenomenon has caused one of the biggest shifts since the industrial revolution, and it has become the biggest business trend to date. In many cities, predominantly metropolitan cities, digital technologies are revolutionizing many industries, such as mobility and short-term rentals as transport and housing are being monetized, used, and sold. This revolution, like many, is driven by economic and social factors. Two of the biggest and most noteworthy players in this field are Airbnb (house-sharing) and Uber (car-sharing). 1 Some of the ways in which the shared economy has revolutionized traditional industries include increased self-employment opportunities, higher savings while maintaining the same lifestyle, more commercial opportunities, and reduced ownership. 2 South Africa has accepted the international SE1 as one of the highly sophisticated economies on the subcontinent and has become the access point for many industry leaders such as Airbnb and Fon in the continent of Africa. Uber was generally accepted in South Africa, with establishment exceeding its expected growth rates in Johannesburg in Gauteng province and in the Western Cape province, in its first year, compared to other regions globally. 3
“Sharing economy” is a hypernym that is used when referring to a social and economic arrangement that is based on the splitting of resources, physical as well as human, demonstrating that this phenomenon has an impact on all aspects of our lives. The rise in the number of digital sharing platforms provides employment opportunities, encourages micro-entrepreneurship, and improves digital literacy. Technological innovations are fundamental to the SE1 growth, as they are the drivers of sharing, facilitate the sharing process, and address long-term societal connections between groups that may have not otherwise had the opportunity to interact across geographical boundaries. Technology has also enabled the identification of surplus and idle resources and has created the means to connect these assets to individuals and communities in need of these resources. People are, thus, figuring out how to contribute to and participate in the SE1, what it means to and in their lives, and how it can be used and its application in various contexts, such as communities and businesses. 4
The SE1 in South Africa is relatively new in comparison to developed countries. It therefore implies that it is limited in terms of representation in the different sectors, business models, and expansion to other countries—another potential research gap, thus illustrating the importance of this examination. EMIA 3 states that the concept of an SE1 has eased the lifestyle of Africans due to the reality of a sharing nation and is therefore not new. The main area of convergence with the global players is the formalization of this age-old culture through technology-based platforms. In an attempt to capitalize on opportunities and to develop strategies for management practice to deal with prevailing challenges in South Africa, Uber will need to consider factors which affect the use of their services. Considerations of factors affecting the use of Uber are generally understood in association with the following: flexibility, independence, sustainable use of resources, safety and security, and economic benefits. This understanding will assist in better positioning Uber to develop strategies for prospective and current users. The core aim of this research is to consider factors associated with the use of Uber by residents of Johannesburg, South Africa, from the perspective of the user/rider. Identifying and understanding these factors can be used for potential businesses looking into diversifying and revolutionizing their businesses.
This research examines the variables that are associated with the behavioural intention (BI) to utilize SE1 innovations, such as Uber in Johannesburg, South Africa, thereby generating data from the perspective of a Third-World country, as most of the available literature and research investigate this phenomenon from the viewpoint of First-World countries such as those of Great Britain and North America. In essence, this research attempts to establish which factors promote the adoption of the Uber SE1 technology innovation through the lens of Davis’s 5 technology acceptance model (TAM), a foundational theoretical model in technology adoption. According to Retamal and Dominish, 6 the application of the SE1 in Third-World countries has the potential to assist with economic development by enabling entrepreneurship and facilitating business formation and regulation. This is particularly important for South Africa, due to the high levels of unemployment which have been recorded at 27.6 per cent in May 2019. Furthermore, the fact that the cost of using these services may be manageable, unlike the cost of buying a car, highlights the benefits of the SE1 in the South African setting. Retamal and Dominish 6 argue that unlike in middle- to high-income countries, where there are broader options for the SE1, in low-income countries, key sectors in which SE1 businesses are emerging include transport, agricultural aids, and human resources. The authors argue that more potential exists to customize the SE1 to provide societal needs such as housing and health. However, documentation of the challenges, benefits, outcomes, and opportunities provided by the adoption of SE1 innovations about the South African context is limited.
This research contributes to the better appreciation of consumer behaviour as well as the adoption of SE1 innovations, with specific reference to services offered by Uber in respect to their ability to meet preconceptions based on the consumers’ perspective. This facilitates better and improved product and/or service design offerings to meet customer wants and needs. In addition, the practical value of this research will establish which factors greatly affect the BI to apply, and it can be used and manipulated for marketing purposes by management practice. Sharing innovations seem to be highly disruptive to traditional businesses, and a better understanding of what leads to customer intention to use a service is essential to businesses in the face of potential competition from these new entrants. 7 In addition, the study aims to produce insights for managerial practice for Uber and to produce more literature for this field, as there is limited literature available, particularly from the perspective of the Global South.
Literature Review
Defining the Sharing Economy
Many scholars and experts in the field have offered various definitions of this controversial concept which confirm that it is difficult to identify a definition as it encompasses many different ways in which it is operationalized. What complicates having a single definition of SE1 is compounded by the emergence of other related concepts that are oftentimes used interchangeably with SE1. Concepts which are not necessarily synonymous with SE1 but are somewhat used interchangeably are collaborative consumption, communal economy, collaborative economy, and peer consumption. However, Botsman and Rogers 8 distinguish the most commonly used phrases, that is, collaborative consumption and sharing economy. The main distinction proposed by the authors is based on the fact that with collaborative consumption, the transfer of ownership may be temporary or permanent, while with SE1, ownership is not negotiated and provides access to platforms. On the other hand, Zervas, Prospero, and Byers 9 refer to SE1 as an all-encompassing phrase that refers to peer-to-peer (P2P) platforms which enable people who collectively use underutilized inventory through pay-for-service sharing. Schor and Fitzmaurice 10 explain it as a range of digital platforms and offline activities. Frenken et al. 11 and Botsman 12 describe the concept as driven by connections between individuals who allow others to use their underutilized assets and resources on a short-term basis, with or without monetary exchange. Furthermore, Kenton 13 explains the idea as a money-making model related to P2P-oriented activities of providing, acquiring, and co-accessing goods and services, enabled by community-based online platforms. Davidson, Habibi and Laroche 14 emphasize that an SE1 is an economic system of sharing assets between individuals. Botsman 12 highlights the fact that the notion of SE1 lacking a shared definition is ironic. Despite the lack of a shared definition, one is able to deduce an understanding of the concept from a broader perspective, by piecing together the highlighted characteristics of this system. On the basis of the above definitions, one is able to gather that the SE1 entails P2P online-based interactions of leasing and sharing underutilized resources, either for a fee or free of charge.
Based on the literature review that provides understanding, clarification, and definitions, SE1 is operationalized as for this study as an open system that brings together all forms of goods and services from a wide range of industries, to share and exchange for financial or non-financial benefit. This research focuses on transportation SE1 innovation, where Uber as the business model based on an information technology (IT) platform provides access to sharing of services for a fee and does not focus on transfer of ownership.
Sharing Economy in South Africa
Naik 15 states that the notion of sharing is nothing new to South Africa, as South Africans have valued sharing models for many generations, from stokvels (an invitation-only club of 12 or more people serving as a rotating credit union or saving scheme) to funeral societies, which are communal SE1 examples, where services and/or goods are shared by all on a rotational or need basis. Although the traditional notion of sharing is not new to South Africa, the SE1 phenomenon as described above is a relatively new and not a well-recorded concept. As such, it is important to acknowledge that there is a lack of studies based on this subject as this is a newly emergent concept. One of the contributing factors may be the fact that e-commerce in South Africa lags behind First-World countries with only 1 per cent contribution to GDP expected from e-commerce in 2016, although the exponential growth is expected by 2021. 16
According to Figure 1, out of 57 million people in South Africa, over 54 per cent are active users of the internet, a 29 per cent increase from 2014. This shows the rapid growth of connectivity and access to the internet in the last few years. According to the Independent Communications Authority of South Africa, 17 South Africa has had a high level of adoption of mobile phones with at least 82 per cent of smartphone owners using these devices to access the internet compared to 43.5 per cent in 2016. The increasing adoption of the internet has implications for the South African economy, especially the adoption of technological innovations such as Uber, online shopping, and general transacting. However, it remains to be seen if the high adoption level of mobile phones in South Africa will result in a booming SE1.
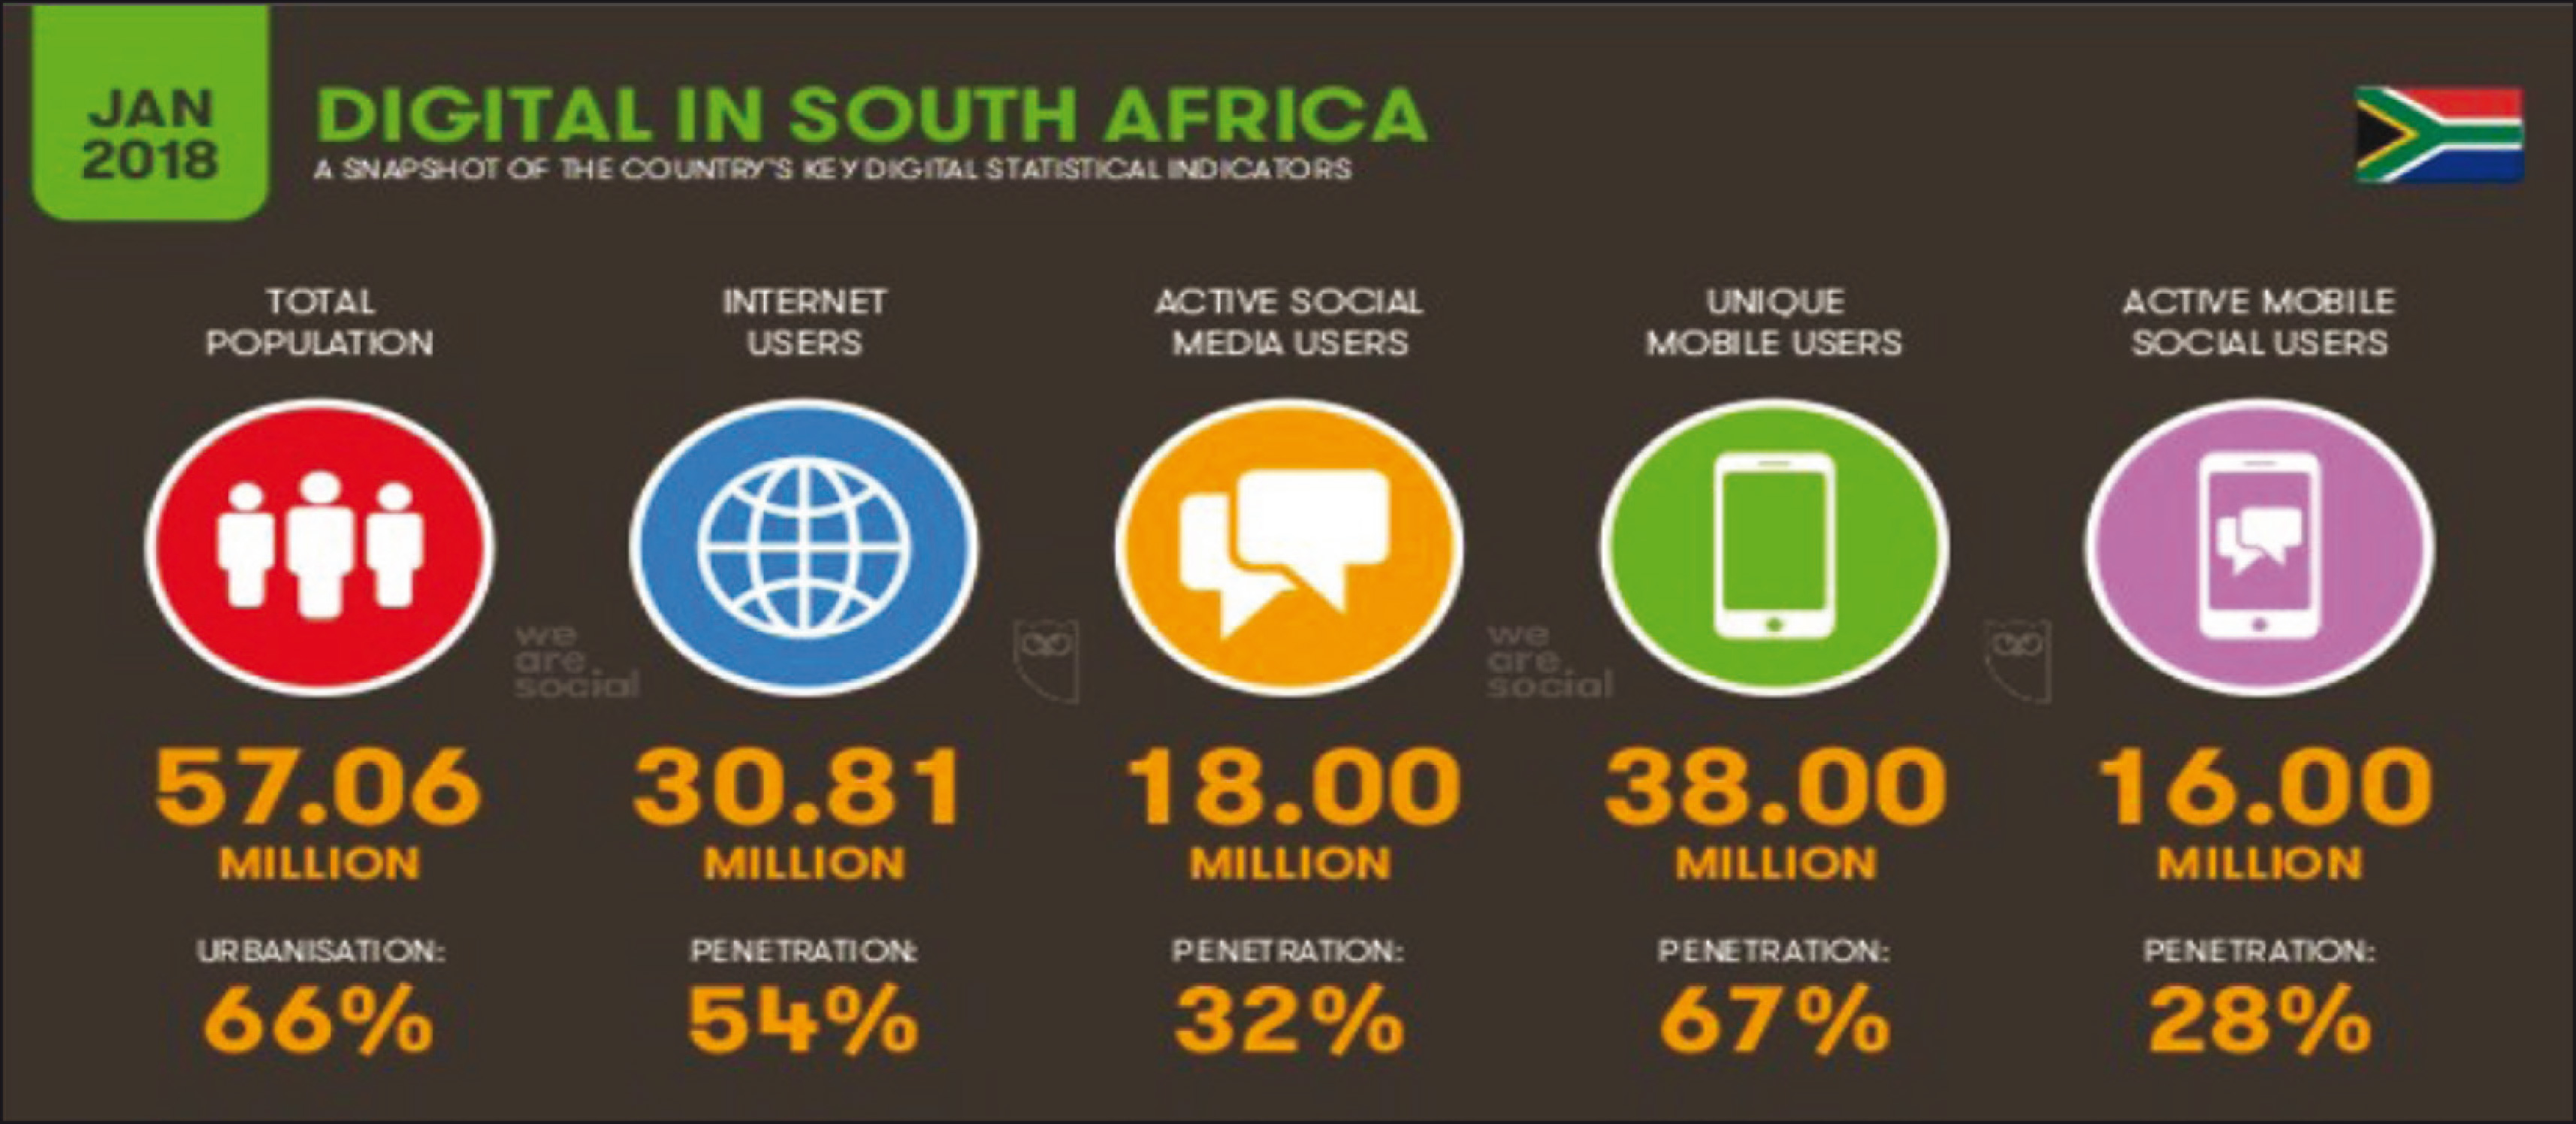
South Africa has at least 18.43 million online shoppers and this is projected to increase by 6.36 million shoppers by 2021, 16 with each spending at an average US$189.47. This is a clear indication that the country has an opportunity to grow a thriving digital economy of which the SE1 is a pillar. For this to succeed, it requires different approaches, a strong inclination to innovate, and a targeted approach to business, as well as taking advantage of the potential presented by technology to catalyse the South African economy, 18 as the disruption of the traditional business model is unlikely to abate. For example, the entrance of Uber in the transportation sector of the South African SE1 has caused a lot of uncertainty for current operators in the sector and has provided opportunities for both users and operators alike. Uber as one of the most established SE1 platforms in South Africa is the subject of this research.
Uber in South Africa
Uber was established in South Africa in 2012 in Johannesburg and has since extended to Cape Town, Pretoria, Durban, and other recognizable cities in South Africa. 19 However, Uber’s expansion to Africa was not exclusive to South Africa, as it is also available in major cities in Ghana, Kenya, and Nigeria. 20 South Africa is the entry point of many multinational companies into the African continent. As would be expected with disruptive technologies, the expansion has not been without controversy. In South Africa, the advent of Uber has disturbed the transport ecosystem, resulting in clashes between traditional taxi drivers/owners and Uber operators. 21 Irrespective of these clashes that have seen violence, South Africans continue to use these services, and the company seems to be growing in leaps and bounds. It is thus important to have an understanding of the influences that motivate South Africans to make use of these services.
The city of Johannesburg is South Africa’s main economic hub, while the city of Cape Town is the legislative hub. According to De Villiers, 22 Johannesburg was the most congested city with riders spending an equivalent of five days in traffic. Overall, the transport system has been characterized by unreliable, costly, and often unsafe systems. The transport system was a reflection of the spatial arrangements of the apartheid system—the previous political and social system of racial segregation and discrimination enforced by the white minority population. 23 As indicated earlier, the introduction of the application-based Uber service to the South African transport industry has had mixed reactions. The South African transport industry has been plagued by a number of problems, primarily as a result of the way urbanization was promoted, to only cater for the white minority race, while the majority black population struggled. In general, the public infrastructure is not user-friendly, and Uber has centred itself as a complementary service to the public transport system, reducing private car dependency. 21 The inefficient public transport system is an impediment to the country’s economic growth. The introduction of Uber has had a number of benefits for the users; both tourists and locals find the e-hailing service efficient, effective, and to some extent safe. For example, the night-time economy stated by Henama and Sifolo 21 is thriving, as individuals now have the opportunity of e-hailing a fast food restaurant, and those inclined towards entertainment can “take a glass or two” without the fear of driving intoxicated. As a result, Uber has increased rather than destroyed job opportunities. Although there are a number of benefits reaped by the respective cities since the introduction of Uber, challenges such as the legal framework and safety of drivers alike remain a challenge.
Theoretical Framework
Technology Acceptance Model
Davis 5 argues that TAM is brought forward to predict the elements that inspire the use of technology. This model is an expansion of the theory of reasoned action and theory of planned behaviour. 24 TAM’s expansion includes two constructs, perceived ease of use (PEOU) and perceived usefulness (PU). According to the model shown in Figure 2, the effortless utilization of IT is subjectively perceived by users, in that the easier it is to use, the more IT will be embraced, while the extent of IT usefulness is also subjectively perceived by users. Thus, the greater the extent of usefulness, the greater the adoption of IT. This acknowledgement influences attitudes (ATUs) and advanced particular behaviours. 5 Hussein 25 states that TAM has been shown to be valuable in understanding which factors predict acceptance of new innovations and provides a foundation for tracing how external variables impact the beliefs, ATUs, and intention to use them. Legris, Ingham, and Collerette 26 contend that TAM is a widely used framework to embrace and utilize technology. This is confirmed by King and He, 27 who state that in the past 10 years, this model has become a more robust, recognized, and parsimonious framework for forecasting user adoption. The authors highlight that the IT users’ behaviour can be projected and elucidated through TAM. 27 To determine the actual use of IT, the model has influenced BI and ATU of the user in either an indirect or a direct manner.

Research Hypotheses
External Variables
Age
Venkatesh et al. 28 indicate that age influences acceptance, adoption, and intention to use new technological innovation in a moderating and direct manner. The authors further suggest that age is a critical determinant in the use and acceptance of technology. Most studies reveal that the youth are likely to have higher rates of embracing new technological innovations than the elderly and are therefore a key demographic factor to be explored regarding intentional behaviour to use technology. 29 The younger the user, the stronger the levels of adoption of new technologies, as confirmed by Fleischer and Wahlin 30 in a study that looked at young people based on finding that they had affinity to embrace new technologies. Venkatesh et al. 28 argue that age does influence relationships among PEOU, PU, ATU, and BI. Therefore, age should be considered when examining factors that influence BI in regard to technology acceptance.
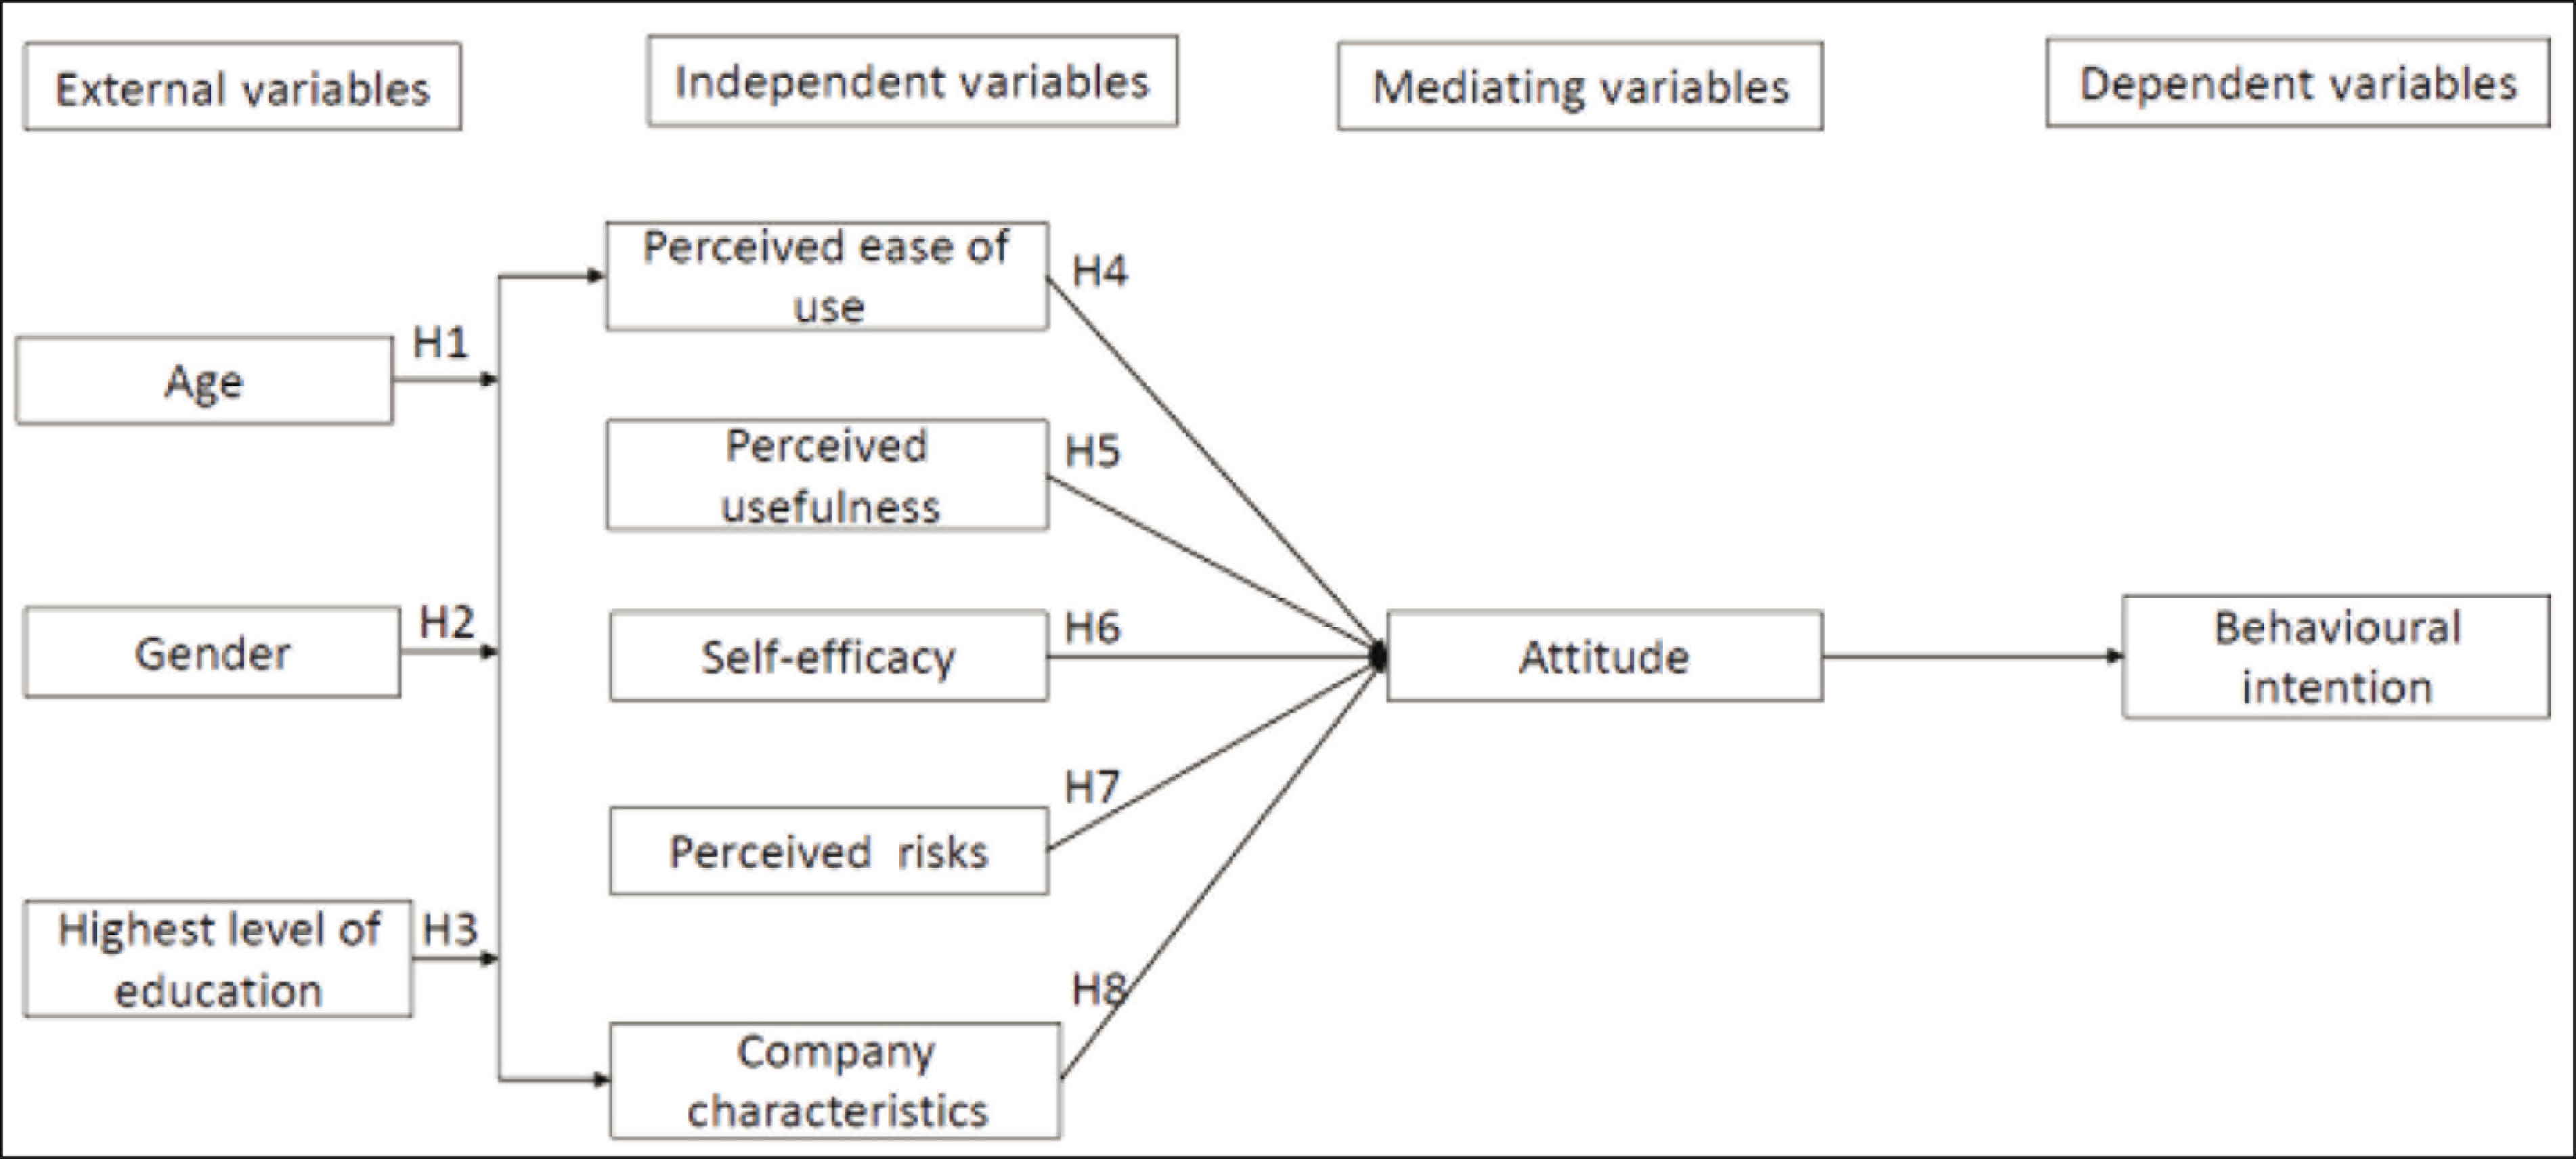
Hypothesis 1: There is a positive relationship between age and ATU, which influences the BI to use Uber.
Gender
Zhou and Xu 31 confirm that males are inclined to readily embrace technological innovations compared to females. This argument is confirmed by Heerink, 32 who states that gender differences do influence BI; moreover, he found that males have more computer experience and find technology easier to navigate than their female counterparts. This may be the case as argued by Hofstede et al. 33 and Venkatesh and Davis 34 primarily as men are seen to focus more on needs achievement, related to usefulness of the system. This presupposes that men place greater emphasis on system’s usefulness. Therefore, gender should be considered when examining factors that influence BI in regard to technology acceptance.
Hypothesis 2: There is a positive relationship between gender and ATU, which influences the BI to use Uber.
Level of education
In their studies, Burton-Jones and Hubona 35 determine that there is an optimistic association between the education and PU and further suggest that the higher the education level, the more positive the association is among PU and BI since users will be less risk-averse. On the other hand, the findings in a study by Chiliya, Chikandiwa, and Afolabi 36 indicate that educational level is not significant in the adoption and use of particular e-products.
Previous research indicates that education level is related to knowledge and skills, which in turn affect behavioural beliefs, that is, PU and PEOU, in relation to the acceptance and usage of new technologies. 37 In existing research, level of education has been investigated as an antecedent of PU and PEOU and is a key determinant of BI 38 ; thus, this research replicates that. Venkatesh and Morris 39 find that there is a positive correlation between the level of education and PU, while Burton-Jones and Hubona 38 reiterate that higher education levels lead to a positive association with PU. However, Agarwal and Prasad 37 find that there is no relationship between education and PU. Al-Gahtani 40 also finds that there is no relationship between education and PU on BI towards using computer systems in the context of Arab countries. Despite the mixed results of prior research, education plays a role in the adoption and acceptance of technology. 41 Therefore, education should be considered when examining factors that influence BI in regard to technology acceptance.
Hypothesis 3: There is a positive relationship between the level of education and ATU, which influences the BI to use Uber.
Independent Variables
Perceived Usefulness
According to Phua et al., 42 PU is one of the fundamental factors that impact BI directly. Davis et al. 43 explain PU as the extent to which a person believes that using an online system will improve performance. Venkatesh and Morris 39 argue that PU has a positive and significant influence on individual behaviour governing one’s intention to use a technology. This means that if the quality of performance increases due to a particular system, it will have a positive influence. Sun et al. 44 highlight that an individual’s acceptance and intent to use a system will most likely be increased when they perceive the system to be useful. The above studies demonstrate that PU is an important factor that influences the BI to use technological systems. Referencing from previous studies and practical scenarios, PU can be understood as an element that highlights an individual’s acceptance and intention to use a system such as Uber, as it is more likely to increase when the system is perceived to be useful. Thus, this article hypothesizes as follows.
Hypothesis 4: There is a positive relationship between PU and ATU, which influences the BI to use Uber.
Perceived Ease of Use
Davis 5 defined PEOU as the extent to which using a particular system would be free of effort. Users who perceive a system as easy to use expect the system to be simple; therefore, when the level of PEOU towards a system is high, then acceptance and usage of online systems will also be high. This is because when users perceive a technology as easy to use, it can be assumed that the system is simple and that users will be satisfied with the system. Sun et al. 44 elaborate that users ultimately sign up to join and use the system and remain on the system longer when PEOU is high. The system engineers therefore play a central role in developing suitable and accessible systems for users, as PEOU is important in influencing the user’s decision to accept or reject an online system. 42 Furthermore, a system which is perceived to include less effort is easily adaptable by users, and work performance goes up due to this. This implies that it will have a positive effect on the BI to use. For example, if the Uber service turns out to be an easy digital object (app-wise), then it decreases the effort of critical understanding for every type of end user. The above argument results in the following hypothesis.
Hypothesis 5: There is a positive relationship between PEOU and ATU, which influences the BI to use Uber.
Self-efficacy
Self-efficacy (SE) refers to the belief in the skills and abilities of an individual to initiate a task and lead it to success. 45 Research has demonstrated that expectations of personal success and mastery are strong predictors of whether or not one will engage in a particular behaviour. In general, an individual tends to be more attracted to tasks they are good at and avoid tasks at which they believe they would perform poorly. Bandura 45 states that confidence in successfully performing a behaviour, or SE, is instrumental in determining whether one will engage in particular behaviours. Based on existing theoretical and empirical support of IS literature, it can be concluded that the greater an individual’s SE beliefs, the more likely they are to make efforts to achieve required outcomes. 46 It is thus evident from prior research that SE has a predictive role in determining the BI of users. Intention is a function of salient beliefs about the probability that performing a particular behaviour will result in a specific outcome. In the above context, this research will hypothesize as follows.
Hypothesis 6: There is a positive relationship between SE and ATU, which influences the BI to use Uber.
Perceived Risks
Perceived risks (PR) refer to the combined effects of probabilities, the uncertainty involved in a purchase decision, and the ramifications of taking an undesirable action. Dowling and Staelin 47 argue that PR is about the consumer perception towards the uncertainty of buying a product which may result in consumer doubt. This two-dimensional view was refined to a verified and generalized multidimensional view, which assesses physical, psychological, social, financial, and performance risks. The manner in which risks are perceived is fundamental to understanding how individuals respond to possible hazards associated with their choices. Stone and Grønhaug 48 believe that PR is one of the most significant factors that influence purchase intention. This is due to the possibility of incurring loss by the time the purchased product or service arrives. In this study, PR is therefore conceptualized as the likelihood of positive and favourable consequences for online system users, caused by the BI to use Uber. Based on the dimension of PR, this research hypothesizes as follows.
Hypothesis 7: There is a positive relationship between PR and ATU, which influences the BI to use Uber.
Company Characteristics
In marketing research, corporate reputation, or company characteristics (CC) in this scenario, has often been evaluated by consumers’ perceptions of the quality of products and services offered by the company and brand awareness. In addition, consumers’ ATU towards a brand and purchase intention have been measured as outcome factors. Thus, this research aims to assess the impact of brand awareness and perceived product quality in the ATU towards BI to use Uber services, to determine the influence of the concept of CC on consumer behaviour.
Existing marketing literature focuses on the positive rather than the negative aspects of negative CC; this field has hence neglected the situation of a company confronted with negative CC. Researchers have noted that negative information has an influence on consumers’ overall evaluations of a product or company more than positive information. Researchers also discovered that negative information is more diagnostic and informative than positive information in the consumer decisionmaking process. As consumers tend to rely on company and product information in order to reduce their PRs when making purchasing decisions, negative CC can be a more noticeable characteristic than positive CC in the current business environment. This indicates that there could be a positive relationship between CC and BI to use, as argued by Yoon et al. 49 Good CC assists in increasing a company’s market share and sales performance and contributes to forging loyal and trustworthy relationships with consumers. Given the aforementioned, this article hypothesizes as follows.
Hypothesis 8: There is a positive relationship between CC and ATU, which influences the BI to use Uber.
Mediating Variable: Attitude
According to Hogg and Grieve, 50 ATU is “a relatively enduring organization of beliefs, feelings, and behavioural tendencies towards socially significant objects, groups, events or symbols”. Therefore, an individual develops an ATU about objects which in turn forms an intention of how one is to behave with regard to an object based on own belief. ATU is a complex factor but according to Ajzen 24 and Davis, 5 it is one of the main factors that influence customers’ BI to use. As such, ATU is how one reacts to their surroundings. Similarly, Jain 51 states that ATU can be negative, positive, or neutral; it is also not passive as it exerts dynamism in relation to behaviour. Scholars have proposed various models to describe what ATU is, such as the ABC model. The model indicates that there are three elements to ATU, namely affect/feeling, behaviour/intention, and cognition/belief. In essence, affective/liking denotes how an individual feels about an issue; intention/action refers to how an individual expects to behave towards an issue; and cognitive/knowledge indicates what an individual knows about an issue.
The concept of ATU has been the focal point of various research studies since the 1980s. Thus, ATU and related concepts have been mentioned in many research papers. In the context of the adoption of SE1 innovations, ATU is associated with BI to use technology. Although the focus of this research is on BI as a component of the ABC ATU model, the research framework used, the TAM model, incorporates all three elements of ATU as illustrated in Figure 4. According to Jain, 51 Davis’s TAM is an applied model of ATU, whereby BI to adopt technology is directly influenced by ATU towards that particular technology as well as perception of its usefulness. ATU, in turn, is influenced by a person’s beliefs in how useful the technology is and how easy it is to use. In this context, ATU is influenced by both ease of use and usefulness. The perception of ease of use is measured by the extent to which using a technology is effortless, while the perception of usefulness is measured by the degree to which the technology can help to improve the performance of the task. 5 Theoretically, ATU is a crucial predictor of consumer behaviour. This demonstrates that ATU is an important theme that has been studied over the years, although a research gap still exists on the topic in developing countries. Existing literature therefore serves as a foundation for the study on users’ BI to use Uber in Johannesburg, South Africa.
ATU is the mediating variable which signifies the direct association between two variables that produce the outcome/measured variables. The foundation of the model provides other determinants (independent variables) to have a relationship with ATU that influences BI to use. TAM influences the user’s BI and ATU, either directly or indirectly, in order to assess the user’s actual use. 25 In research, a mediating variable can be identified as variables that explain the kind of the relationship and the effects of the relationship between the independent variables and the dependent variable(s), in attempting to determine the nature of the study more accurately and functionally. A mediating variable may also be referred to as an “intervening or process variable” which plays the role of facilitating mediation in the relationship between the dependent variables and independent variable. In a mediational model, it is hypothesized that there is no direct relationship between the dependent and independent variables; instead, the independent variables first influence/come into contact with the mediating variable, and then the mediating variable influences the dependent variable(s). Therefore, there is a causal chain of effects which characterize the relationship between the dependent and independent variables. In this research, ATU plays the role of the mediating variable, as it facilitates the relationship between the independent variables (PU, PEOU, SE, PR, and CC) and the dependent variable (BI).
Dependent Variable
The dependent variable for this research investigation is BI, which is defined as the level to which a person has conscious framed plans to either execute or not execute some specified future behaviour. 5 Therefore, it is implied that this research is investigating what is critical in the conscious plans to carry out or not to carry out the specified impending action of participating in SE1 activities, such as Uber, giving the claim made by Hussein 25 that a user’s optimistic outlook will give rise to a higher intention to use.
Conceptual Framework
In attempting to demonstrate the relationship between the above-mentioned antecedents and the mediating factor underlying the BI to use Uber, a conceptual framework is illustrated in Figure 3.
Research Methodology
Study Setting
The study was conducted in Johannesburg, South Africa. The selected setting is significant since South Africa is the first African country to which Uber expanded in August 2013 with three cities (Johannesburg, Cape Town, and Durban) operating simultaneously. Areas within Johannesburg that were identified are areas in and around the University of Johannesburg (Auckland Park Campus), University of the Witwatersrand, Campus Square, Rosebank Mall (Gautrain station), and Sandton City (Gautrain station).
Population and Sample
The study consisted of a population of 396 respondents: 146 male and 250 female. The research respondents were based in Johannesburg and aged between 18 and 50 years, with access to the internet. This age group is deemed appropriate as anyone younger than 18 in South Africa is a minor, and the permission of a parent or guardian would be required to participate in the research. Undertaking the research under supervision would result in delays to the process. The sampling frame was limited to allow for data collection to be undertaken from 1 May to 30 May 2019.
Sampling Technique
This study used convenience sampling, a form of non-probability sampling technique, in which research participants are perceived as “convenient” sources of data to the researcher. The required participants provided the required information and were easily and readily available for this purpose. Furthermore, the technique allowed the researcher to complete a sizeable number of surveys in a cost-effective manner within a limited timeframe.
Survey Questionnaire
The preferred research measurement tool used for this research was a survey questionnaire. Following extensive literature review, a survey questionnaire with structured questions was developed for this study. The survey questionnaire from prior studies was authenticated as it had been adopted and modified for the purpose of this research. 5 A cross-sectional research strategy was used, where pre-designed questionnaires were administered to students and working professionals in the identified sites. The questionnaire consisted of three sections. Section A collected respondents’ demographic data such as age, qualification, gender, profession, and other elements. Section B was the general information, while Section C related to TAM constructs to determine factors that influence intention to use the e-hailing services. This section was adapted from existing TAM questionnaire survey samples. For example, the variables explored—PU, PEOU, ATU, PR, SE, CC, and BI—were derived from existing survey questionnaires of this nature. The factors examined were adapted to specifically suit this research on SE1 innovations and Uber in particular. The survey questionnaire had simple close-ended questions that were easy to answer. PEOU, PU, PR, CC, SE, ATU, and BI are assessed using Likert scale statements ranging from 1 to 5, where 1 denotes Strongly Disagree, 2 is for Disagree, 3 denotes Neutral, 4 represents Agree, and 5 denotes Strongly Agree.
Correlation Analysis
Gogtay and Thatte 52 define correlation analysis as a process of statistical assessment used to measure how strong the association is between two numerically measured continuous variables. According to Gogtay and Thatte, 52 correlation is often measured and explained as shown in Table 1.
Measure of Correlation

Multicollinearity
The assumption indicates the relationship among the independent variables. Multicollinearity occurs when independent variables are highly correlated (i.e., r = 0.8 and above). 53
Tolerance
Tolerance is coupled with each independent variable and ranges from 0 to 1. Allison 54 notes that there is no strict cut-off for tolerance but advises that a tolerance below 0.40 is a cause for concern. Weisburd and Britt 55 state that anything under 0.20 indicates serious multicollinearity in a model. High tolerance (i.e., 0.84) = low multicollinearity and low tolerance (i.e., 0.19) = high (serious) multicollinearity.
Variance Inflation Factor
The variance inflation factor (VIF) is a different manner that can be used to measure multicollinearity. 56 In this case, VIF measures how much the variance of an expected coefficient regression increases when the predictors are correlated. If the VIF is equal to 1, there is no multicollinearity between variables, but if the VIF is greater than 1, the predictors can be related moderately. 56
Exploratory Factor Analysis
Exploratory factor analysis (EFA) allows the researcher to decide on the number of factors by analysing the output from the analysis of the main components. EFA also allows all items to load on all factors. This process of analysis also allows the researcher to use the maximum likelihood to approximate factor loadings, as it is one of a variety of estimators that can be used. 57 In essence, EFA is used to determine how many factors there are, and what they are.
Validity
Validity means the extent to which a construct gauges what it was originally planned to gauge. To test the validity of the elements in a questionnaire survey, an EFA is performed to establish if the individual questions load onto the elements in the questionnaire. 58 Prior to performing factor analysis, there are two diagnostic measures that have been applied to evaluate the factorability of the data, namely the Kaiser-Meyer-Olkin (KMO) measure of sampling adequacy and the Bartlett’s test of sphericity.
Kaiser-Meyer-Olkin
The KMO sampling competence is a statistic that suggests the proportion of variance in the variables that might be caused by underlying factors. High values (close to 1.0) suggest that a factor analysis may be useful with the data, whereas a value less than 0.50 indicates that the results of the factor analysis will probably not be very useful, thus implying that a good measure, or the minimum for KMO, is 0.60. 58
Bartlett’s Test
Bartlett’s test of sphericity tests the hypothesis that the correlation matrix is an identity matrix, which suggests that the variables are unrelated and therefore unsuitable for structure detection. Small values, less than 0.05 (p < 0.05), of the significance level indicate that a factor analysis may be useful for the data. 59
Reliability Analysis
Reliability analysis suggests the degree to which a metric yields consistent outcomes if the measurements are repeated. The reliability was assessed using Cronbach’s alpha. Cronbach’s alpha tests determine whether the multiple-question Likert scale surveys are reliable, as the questions measure dormant variables. According to Deviant, 60 Table 2 explains internal consistency level at different values of Cronbach’s alpha and in general a score of more than 0.7 is regarded as being adequate.
Cronbach’s Alpha

Empirical Results and Analysis
Reliability Analysis
Reliability analysis of the variables used in the study was performed using Cronbach’s alpha. The results of the reliability analysis for the variables are presented in Table 3. The results reveal that the Cronbach’s alpha values range from just over 0.7 to just over 0.9, which ranges from acceptable to excellent, indicating that there is good internal consistency in the variables. Therefore, the multiple Likert scale surveys are reliable.
Reliability Analysis of the Variables

The findings from the results in Table 3 suggest that the statements used in the Likert scale are reliable and can produce consistent results if the measurements are repeated.
Descriptive Statistics Analysis
This section presents the descriptive statistics analysis results in the form of frequency tables. The descriptive statistics results for demographic (or external) variables used in the questionnaire are presented as follows.
The results in Table 4 reveal that 37 per cent of the participants in the study were male, while 63 per cent of the participants were female. That is, about two-thirds of the respondents in the study were female, while about one-third were male. The results in Table 4 show that only 5 per cent of the participants were teenagers, which is aged 19 or younger, while the majority of the respondents—54 per cent—were in the age group of 20–29 years old, followed by those in the age group of 30–39 years old, which constituted 28 per cent. Those over the age of 40 comprised 13 per cent which include 6 per cent who were over 50 years of age. This indicates that the majority of the participants in this study were in the economically active youth category who may demand Uber service for purposes of going to work or youth activities.
Demographic Details of the Respondents

The results in Table 4 also reveal that the majority of the participants in the study had attained high school/matric level of education (37%), followed by certificate/diploma (27%) and degree (23%). Only 13 per cent of the participants in the study had attained postgraduate level of education. This indicates that 63.6 per cent of the participants in the study were non-degreed. This is expected in a city like Johannesburg, where there are several private colleagues in the Central Business District that do not offer degree programmes.
Table 5 presents mean as the measure of central tendency and standard deviation as the measure of dispersion for the variables on the perception of the Uber users on the factors associated with the use of sharing economy innovations. The mean scores of all the variables range from just over 3.5 to about 4.2, which indicates that the mean location of the responses for all the six variables lies in the agreement zone. The standard deviation values, which are measures of dispersion, are reasonably small for each of the variables, indicating that there was consistency in the nature of responses from the participants. In general, the findings from Table 5 reveal that, on average, most of the participants affirm the statements (or items) of all the main variables of the study, namely BI, PU, PEOU-SE, ATU, PR, and CC. In conclusion, these findings reveal that the common perception of the Uber users on the factors associated with the use of sharing economy innovations lies in the agreement zone. In other words, the Uber users are in agreement with the statements.
Measures of Central Tendency and Dispersion of the Variables

Factor Analysis
The factor analysis technique used in this study is the principal component analysis method. Factor analysis helps in grouping or regrouping the statements of the six main factors used in the study. This helps to check whether all the statements used belong to the same variables or may form another latent variable.
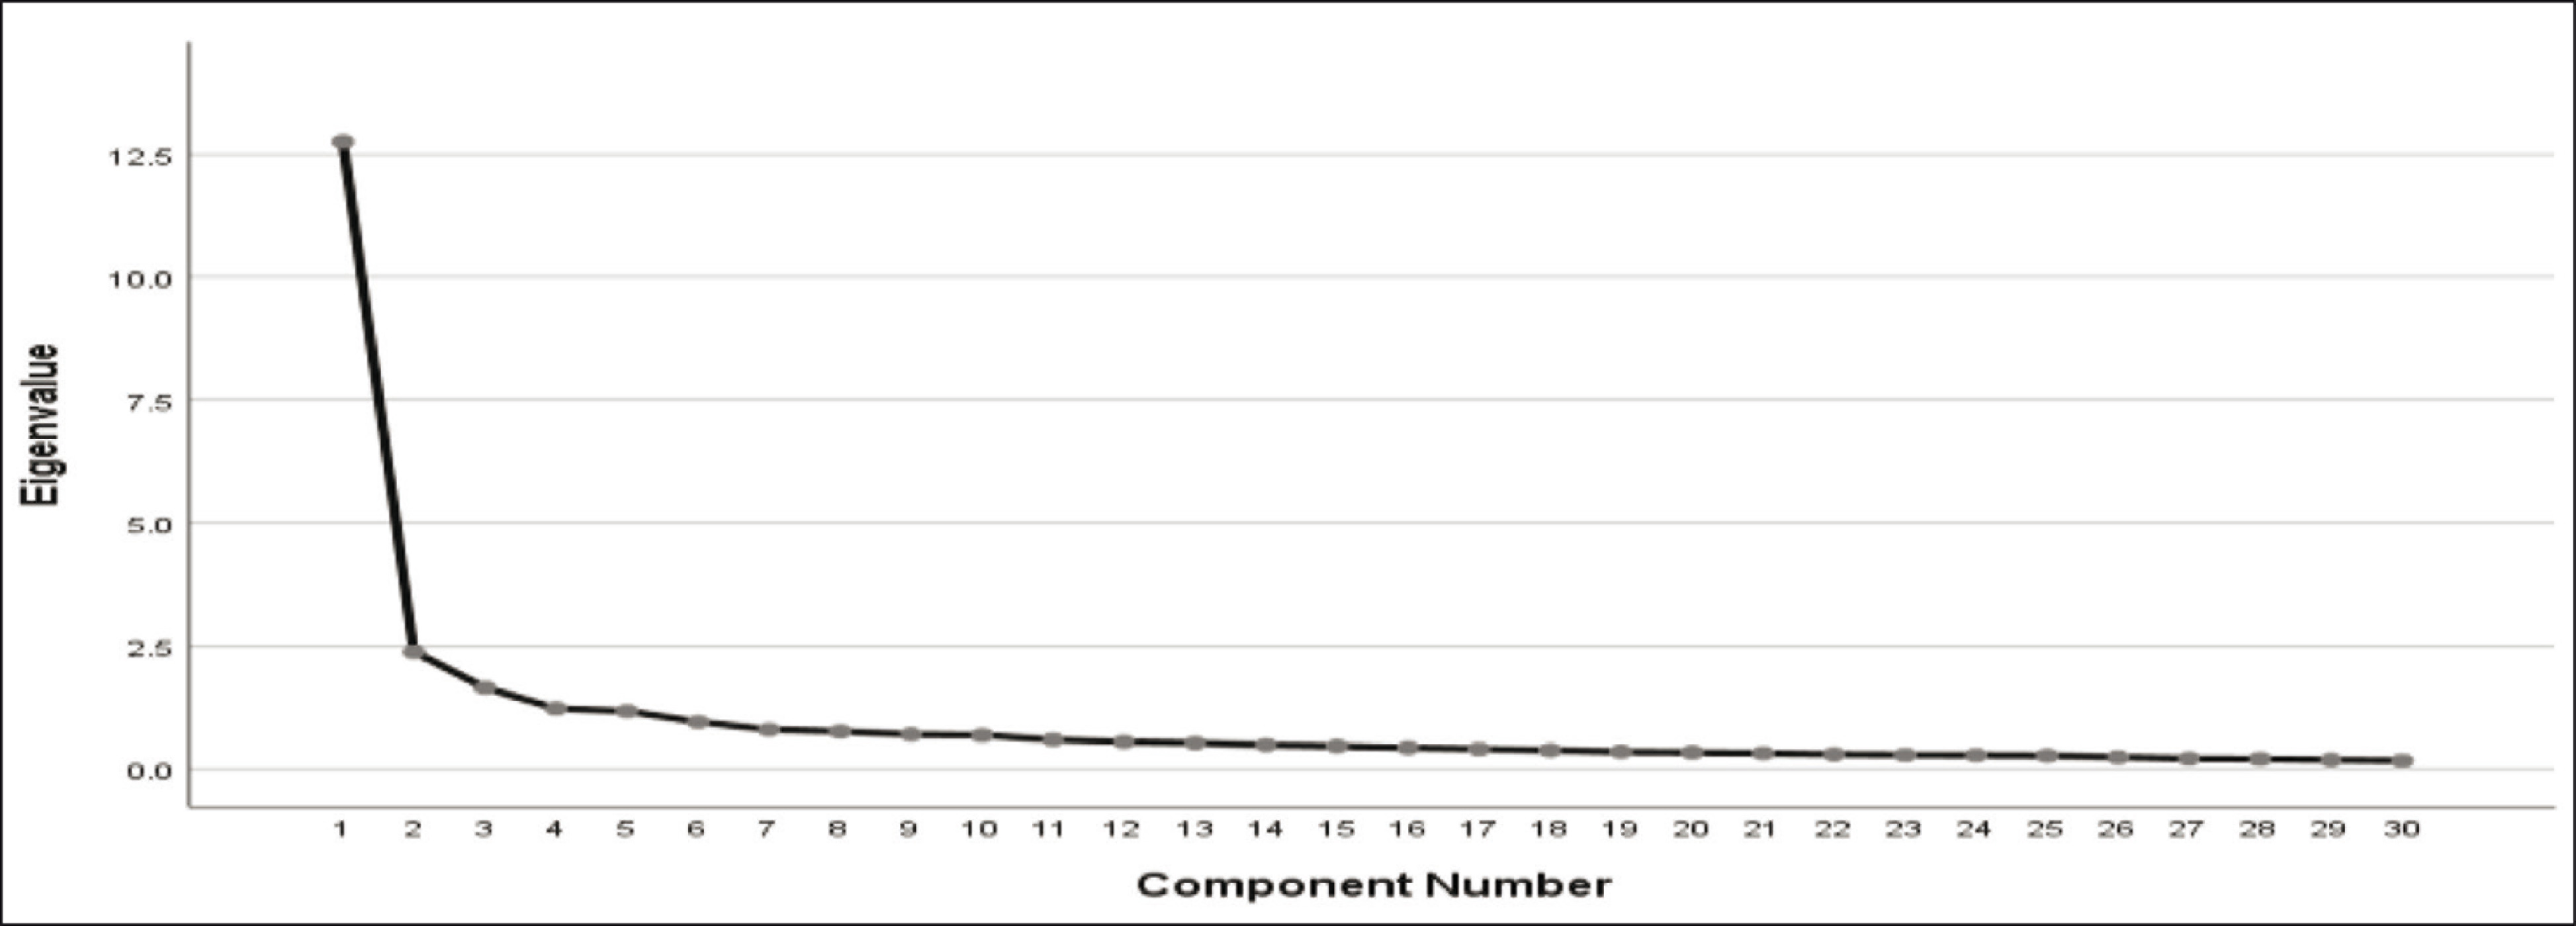
The results in Table 6 show that the maximum number of components or variables required for this study is six with a total explained variance of 67 per cent, which is reasonably good. These findings are also supported by the scree plot in Figure 4, which stabilizes after factor or component number 6, suggesting that at least six factors or variables are sufficient for the study.
Number of Factors and Total Variance Explained

The results in Table 7 further reveal that factor 1 or first latent variable consists of PEOU and SE, factor 2 is ATU, factor 3 is BI, factor 4 is CC, factor 5 is PR, and factor 6 is PU. The findings from factor analysis results have confirmed that all the statements belong to their original six variables—PEOU-SE, ATU, BI, CC, PR, and PR. Furthermore, it should be noted that factor 1 resulted in a combination of two factors which were initially separate, as the statements assessing PEOU and SE were very similar, thus forming one latent factor.
Rotated Component Matrix of the Latent Variables


Rotation method—Varimax with Kaiser normalization (rotation converged in seven iterations).
Correlation Analysis
This segment provides the overview of the analysis of the study’s six variables and clearly shows the direction of the relationship between two important variables. The results from Table 10 reveal that all the six main variables (or factors of a sharing economy) are pair-wise significantly correlated to each other at 1 per cent level of significance and therefore highly significant at 5 per cent level of significance. These findings suggest that the key factors of SE1 innovations are significantly and positively correlated to each other since all the correlations in Table 8 are positive. In other words, for instance, there is simultaneous increase between PU and BI, PEOU-SE and BI, ATU and BI, PR and BI, and CC and BI.
Pearson’s Correlation Matrix Table


Multicollinearity Test Results
Table 9 presents the tests for multicollinearity using tolerance and VIF. All the tolerance values are far removed from zero and all the VIF values are less than the value of 5, suggesting that multicollinearity is not a problem in the overall multiple linear regression model.
Findings of Multicollinearity Test

Normality test
Table 10 presents results for the normality assumption test using Kolmogorov-Smirnov and Shapiro-Wilk tests. The two tests are highly significant (p < 0.001), and this suggests that all the main variables satisfy the normality assumption.
Tests for the Assumption of Normality

In this study, the response variable, Y, for the multiple linear regression analysis is BI, while the independent or explanatory variables, Xs, are PU, PEOU-SE, PR, and CC. ATU is the mediating variable and the demographic variables are gender, age and education.
Multiple Linear Regression Analysis
The results in Table 11 present the model, the summary of which includes the coefficient of determination (R-square) and adjusted R-square. The R-square (58.7%) and adjusted R-square (57.9%) are very close to each other, which shows consistency in the model adequacy. The R-square value of 58.7 per cent suggests that the independent variables in the model account for about 59 per cent of the variability in the response variable BI, leaving about 41 per cent of the amount of variability to be accounted by other factors not included in the model. In general, the model is a moderately good fit, particularly with the inclusion of demographic variables.
Model Summary
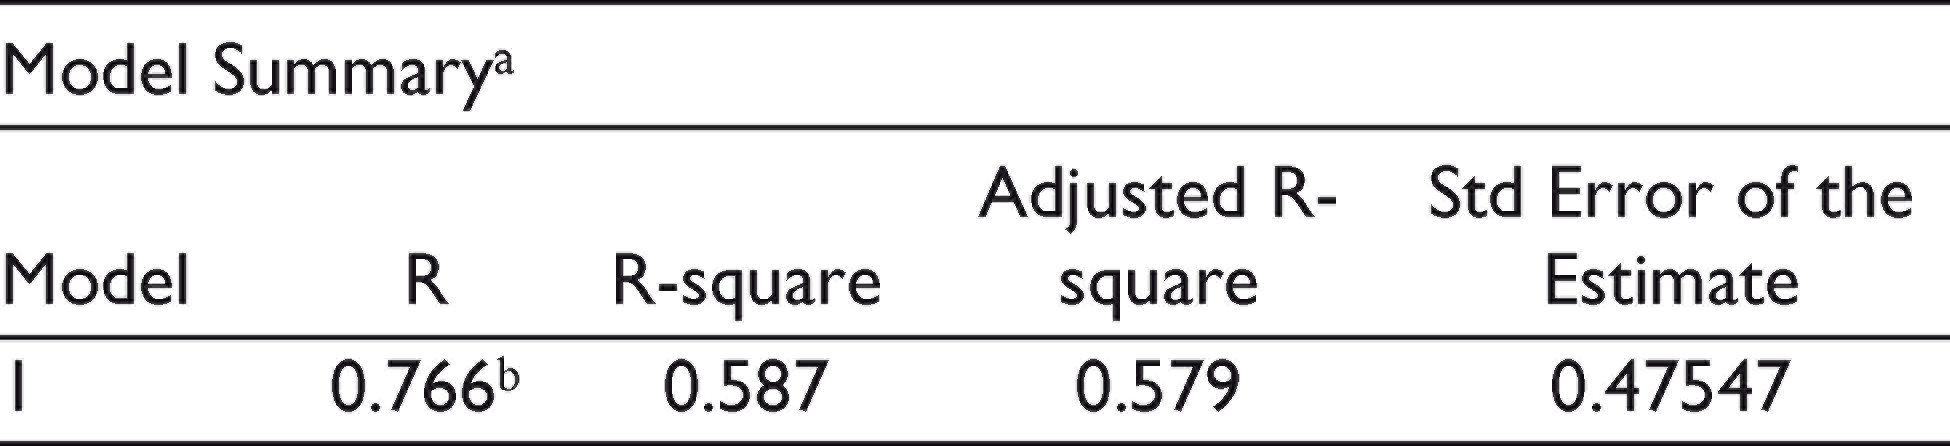
b Predictors: (Constant), CC, PU, PR, PEOU-SE, ATU, gender, age, education.
Results in Table 12 suggest that the general model of multiple linear regression is highly significant (p < 0.001), which shows that the combined contribution of the explanatory variables U, EOU-SE, R and CC, ATU, gender, age, and education have a significant impact on the BI to use Uber.
ANOVA Table for Overall Multiple Linear Regression Model

b Predictors: (Constant), CC, PU, PR, PEOU-SE, ATU, gender, age, education.
Table 13 depicts the individual contribution of the independent variables to the response variable Intention (I).
Beta coefficients of the Multiple Linear Regression Model
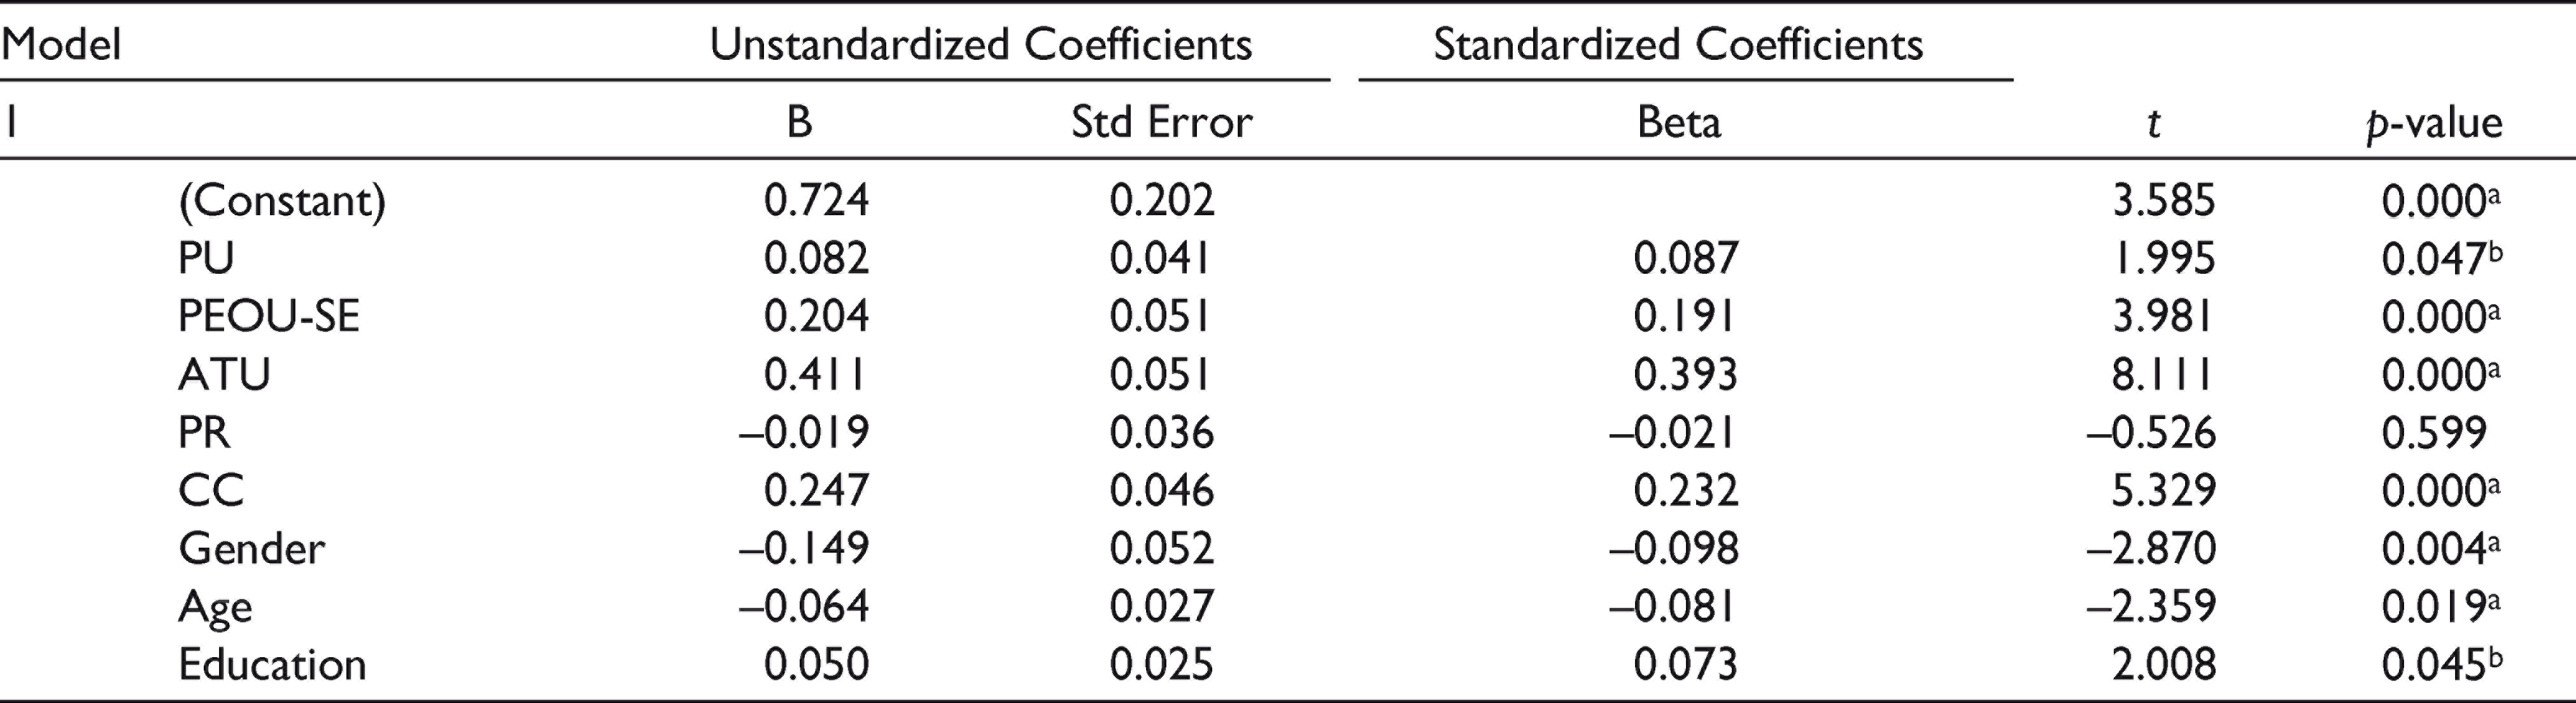
In line with the research hypotheses, the results in Table 13 reveal that independent variables PU, PEOU-SE, CC, ATU, gender, age, and education are significant. Similar to the results of Venkatesh and Morris, 39 this research found that PU has significant impact on individual behaviour, governing one’s intention to use a technology. Consistent with the findings of Sun et al., 44 the research further established that PEOU-SE is positively related with BI of individuals. Similar to the findings of Yoon et al., 49 it was found that CC has significant positive impacts on the dependent variable. Consistent with the findings of Davis, 5 it was observed that ATU has significant positive impacts on BI. The PR has negative but insignificant impacts on BI to use Uber. This may be due to the usefulness of Uber exceeding its opportunity costs in terms of risks in Africa. People are giving much importance to utilizing it. The inclusion of the demographic variables has enhanced the significance of U which was initially marginally insignificant. The multiple linear regression results also revealed that age is significantly negatively related to intention, holding other variables constant, which is similar to the findings of Venkatesh et al. 28
The explanatory variables gender and age have a combined negative impact on BI to use Uber, which suggests that females and the relatively younger age groups are more likely to use Uber. The beta coefficient of PR is negative and insignificant (p > 0.05), suggesting that PR has a negative impact on BI to use Uber. The latter finding is contrary to the findings from the correlation analysis in the previous section, where PU was found to have a positive correlation with intention. It can be concluded that the findings from multiple linear regression have provided further insight, which was not provided by the correlation analysis. This is expected since correlation analysis does not test on the cause–effect relationship. Although R is not significant in the multiple linear regression model, the overall model is important in that it gives further insight into the results. The inclusion of demographic variables improved the power of the model by increasing the R-square as well as improving the importance of the primary variables in the framework, including usefulness.
Conclusions
The investigation looked at factors associated with the intention to use Uber in light of the findings, where only five explanatory variables (PEOU-SE, CC, ATU, PU, and education) have a combined significant positive impact on the BI to use Uber. However, the explanatory variables gender and age have a combined negative impact on BI to use Uber. This means that BI to use e-hailing services is stronger for relatively younger people and females. While the results of PR are negative and insignificant, suggesting that PR has a negative impact on BI to use Uber, the latter finding is contrary to the findings from the correlation analysis in the previous section where PU was found to have a positive correlation with intention.
It can be further concluded that the findings from multiple linear regression have provided further insight, which was not provided by the correlation analysis. This is expected since correlation analysis does not test the cause–effect relationship. Although PR is not significant in the multiple linear regression model, the overall model is important in that it gives further insight into the results. The inclusion of demographic variables enhanced the importance of the framework by increasing the R-square as well as improving the centrality of key variables including PU. The results reveal that the ATU leading to utilization of Uber is the more robust predictor of BI to utilize the service. The demographic variables that are important in the use of Uber are age, gender, and level of education.
Implications of the Study
The findings of this empirical study provide various fruitful implications for academia, policymakers, and managerial practitioners of Uber. With regard to theoretical implications, this study makes significant contributions to consumer behaviour by exploring technology acceptance of sharing economy innovations, that is, Uber, and the intention to make use of such innovations in the context of Johannesburg, South Africa. This is one step closer to addressing the dearth of such studies in the Global South and contributing to knowledge production of the region. Not only is the contribution academically useful, but it also provides legislators as well as management, specifically marketers, with opportunities to improve their service offerings and thereby retain their current customers and secure new ones. Given that the sharing economy innovations are booming and are here to stay, it is clear that more has to be done to improve regulations, especially in the South African context.
Limitations of the Study
Although the outcome of this study is regarded as valid and reliable, it nonetheless had shortcomings. The study location of Johannesburg, South Africa, limits its scope and does not provide an opportunity to investigate country-specific factors. In addition, the location where research participants were was not recorded, and as a result, the study did not measure possible linkages relative to the residential places and intention to utilize the e-hailing services.
Future Studies
This is a quantitative study, which was conducted to determine the factors associated with the use of Uber in Johannesburg, South Africa, from the viewpoint of the users/riders. As such, the implementation of this study opens up various possible future research options. For instance, a qualitative study could provide an opportunity to undertake a deeper investigation into the factors that influence the intention to use the e-hailing services. Furthermore, based on the study limitations highlighted, future studies could focus on similar investigations in different settings. For example, the studies can include more provinces in South Africa and/or different countries on the African continent. Thus, a comparative study between such provinces and/or countries can offer valuable understanding on the influence of cultural and/or geographical differences. In addition, longitudinal studies to determine how the intention to use e-hailing services by users have changed over time could be undertaken.
Footnotes
Declaration of Conflicting Interests
The authors declared no potential conflicts of interest with respect to the research, authorship, and/or publication of this article.
Funding
The author received no financial support for the research, authorship, and/or publication of this article.