
Abstract
This article investigates the relationship between subscription rate and aftermarket volatility for IPOs issued in India during the period 2002–12. The empirical findings corroborate the evidence that subscription rate is a good indicator of aftermarket volatility for the IPO stocks. This study also finds that retail subscription rate is relatively more significant and powerful in predicting volatility than institutional investors. Surprisingly, offer size, investment bank prestige and debt–equity ratio is insignificant in explaining aftermarket volatility. The outcome can be used by the market participants to understand the potential fluctuations in the prices. This article also evaluates volatility of the IPO stocks on listing day.
Keywords
Introduction
Volatility refers to the variability of prices in the period immediately following the initial public offering (IPO), that is, listing day and post-listing period. Precisely it is the ex-post value uncertainty in the aftermarket for the IPO stocks. A few studies (Agarwal et al. 2008; Kenourgios et al. 2007) investigate the role of subscription rate in explaining underpricing (that is, a spike in the price of the IPO share relative to its offering price on listing day). Agarwal et al. (2008) find that investors demand for IPOs is positively related to underpricing, that is, highly demanded IPOs are more underpriced, while relatively low demand IPOs are presumed to be overpriced. In this context, they suggest that the investor’s demand for IPOs is partly driven by the investor’s overreactions to pre-offering information about the IPO prospects. Gleason et al. (2008) further extends this argument and find that aftermarket price risk is higher for firms that underpriced more. Studies (Beatty and Ritter 1986; Chen and Wilhelm 2008; Corwin and Harris 2001; Draho 2001; Falconieri et al. 2009; Ritter 1984) have tried to explain the relationship between underpricing and aftermarket volatility.
Ritter (1984) argues that ex-ante uncertainty measured as the standard deviation of daily aftermarket return is the main determinant of underpricing. Even Falconieri et al. (2009) examine the role of ex-post value uncertainty in determining the level of underpricing. However, underpricing is subject to market risk (also it is ex-post) and an endogenous construct with relation to aftermarket volatility. Owing to this a number of ex-ante signals (proxies) have been used in the literature, which proved to have significant impact on aftermarket volatility. These factors include underwriter prestige (Krinsky and Rotenberg 1989), audit quality (Feltham et al. 1991), venture capital affiliation (Barry et al. 1990; Bradely et al. 2001), and retained ownership (Leland and Pyle 1977). Besides, some financial characteristics of the IPO firm (that is, book value, earnings, P/E) at the time of issue are also explored to evaluate the pricing risk. These characteristics are purely pre-issue; therefore market reaction was not incorporated. Hence, the relative importance of oversubscription rate (which is the leading indicator of market reaction for the IPO), in explaining aftermarket price performance needs to be investigated. To my knowledge there is dearth of studies in evaluating the relationship between subscription rate and aftermarket volatility. Further, there is little evidence on the studies relating to volatility and the subscription structure and pattern across investor groups. This study is intended to bridge the gap in the literature on account of three points: that is, (a) impact of subscription rate on aftermarket pricing uncertainty (that is, volatility) including listing day volatility; (b) association between subscription pattern of different investor groups and aftermarket volatility; and (c) impact of issue mechanism on volatility of IPO prices. Finally, we also investigate determinants of listing day price volatility for the IPO stocks.
This study seeks to extend our understanding of aftermarket volatility of IPO stocks in India in a number of important ways: First, structural changes in pricing and allocation process of IPOs in India, in which book building appears to dominate the issue mechanism. 1 From 2005 onwards Indian regulatory authorities withdrawn the allocation discretion granted to underwriters, and in recent years it appears like a non-discriminatory or uniform type of auction mechanism (dirty Dutch auction), similar to the one used by WR Hambrecht in the US IPO market. Second, with respect to bidding, a separate quota of shares kept reserve for different categories of investors, that is, qualified institutional buyers (QIBs), non-institutional buyers (NIBs) and retail individual buyers (RIBs). Regulation requires that both QIBs and NIBs can submit only price-limit bids, where as RIBs have the option to bid at strike price (that is, cut-off or the upper end of the price range). Further, the institutional bidders are required to deposit only 10 per cent of the value of shares applied. However, it is stipulated that non-institutional investors can place orders by depositing the full value. Hence, the rate at which each category subscribes the issue indicates the genuine demand for the IPO. Third, unlike the US and other European countries, all valid bids are legally binding in India and all successful bidders are obligated to take the allocation of shares. Fourth, Indian regulation allows the issue manager to reallocate the unsubscribed portion of any category to the oversubscribed category. Fifth, Indian regulation allows the issuers to cap the price band at 20 per cent of the floor price, which is relatively wider than the practice followed in US IPO market. 2 Within the framework of a wider price band, Indian IPOs are found priced within the price range, a practice identical to the European IPO market. Sixth, an important aspect of the IPO process is that with effect from 1 May 2007 it was made mandatory for all IPOs in India to be rated by a professional rating agency, and the rating score to be assigned on a five-point scale. IPO rating is a one-time assessment of the fundamentals of the IPO firm at the time of issue and is intended to aid the prospective investors in their decision making. IPO grading sets an international precedent in primary market regulation (Jain and Sharma 2008). Finally, the Indian IPO market is passing through a transition phase, where a substantial number of IPOs get oversubscribed at a higher rate in comparison to developed economies.
The purpose of this study is to introduce the subscription rate as a signal of firm quality in evaluating aftermarket pricing performance for IPOs. To do that, we empirically investigate the association between oversubscription level and volatility of the IPO stock in both the listing and post-listing periods. Post-listing volatility of an IPO stock is estimated as the standard deviation of market-adjusted returns for the initial 20 trading days, including the listing day. Besides, subscription rate, the other explanatory variables including underpricing, book value, P/E of the firm, age, debt–equity ratio, offer size, investment bank prestige and post-issue promoter group holding, are used to explain volatility. We also introduce controlling variables, that is, issue mechanism, changes in book-building structure and pricing (from a listing viewpoint) to gain better insights regarding aftermarket volatility of IPO prices. Previous research indicates that different categories of investors (that is, institutional and non-institutional retail) have different perceptions regarding IPO pricing and performance. Even the accessibility of these investor groups to the information regarding the issuing firm and market are not uniform. This conjecture is based on the information asymmetry, which suggests that the response rate of each category of investor signals the potential price variation/performance in the market. To address this issue, we examine the relationship between subscription rate of different investors group (institutional and non-institutional) and the aftermarket volatility for 339 IPOs issued in India during 2002–12.
Using OLS regression, we corroborate the evidence of subscription rate as a good indicator of volatility for the IPO stocks. We find indeed that higher response rate for an IPO signals higher variability of IPOs prices both at listing and post-listing periods (up to the initial 20 trading days). Investigating the subscription rate for retail and intuitional investor groups, this study documents that retail subscription rate is relatively more significant and powerful in predicting aftermarket volatility. In other words, IPOs having larger retail subscription are more volatile than the IPOs are thinly subscribed by retail investors. This could be driven by the existence of large-scale information asymmetry between retail and institutional investors regarding quality of the issue in general and pricing performance in particular. In the line of existing international evidence, we find strong support for a positive relationship between initial day return and volatility. Our finding shows a strong and negative relation between age of the IPO firm and aftermarket volatility. That is, higher the maturity of the issuing firm, lower is the aftermarket price variability. On the issue mechanism side, evidence suggests that IPOs issued through a book-building mechanism are more volatile than IPOs floated through a fixed-price mechanism. Investigating the volatility of the IPO stocks on listing day, we find that besides subscription rate other variables including initial day return, price–earnings ratio (at the time of issue) and offer size are significant (positive) in explaining listing-day volatility. Our findings also show that larger issues are less volatile on listing day than smaller issues.
Broadly this work is of special interest for existing research on account of the following reasons. First, we extend the existing literature on IPO pricing volatility by investing the impact of subscription pattern across investors on volatility for the IPO stocks in the listing and post-listing periods. Evaluation of IPO price variability across the subscription rate for different investor groups is unique to this article. Second, limited research exists on the Indian capital market and is of mainly concentrated on value relevance of subscription rate for the IPOs, specifically in the context of underpricing. We never come across any paper in the Indian context that is investigating the role of subscription rate in explaining aftermarket volatility. Third, earlier studies limit the scope of the study by using aggregate rate of subscription (rather subscription level across investor groups) as signal of potential price variability. This article takes the lead in evaluating market-adjusted volatility for IPOs. Finally, this article also validates the outcome of existing studies, which establish a significant positive association between underpricing and aftermarket volatility.
The article proceeds as follows: Next section reviews the theoretical and empirical literature in order to establish the linkage between volatility and subscription rate. In the third section, we present the distribution of subscription rate for Indian IPOs across periods. The fourth section is devoted to explain the variables used in the study. In the fifth section, the article discusses the data and sample selection criterion including descriptive statistics. The basic model for determinants of volatility and estimation of underpricing are developed in the sixth section. The seventh section is devoted for analysis and interpretation of the empirical result. Concluding remarks are in the eighth section.
Extant Literature and Theoretical Framework
The empirical relationship between underpricing and aftermarket price volatility is widely documented in the existing literature. Previous studies, such as, Chishty et al. (1996), Ghosh (2005) and Johnson and Miller (1988), find significant positive correlation between underpricing and aftermarket volatility. These studies suggest that awareness of a deviation in relation to expected value is likely to create extra volatility in the prices of the stock. In the Indian context, Ghosh (2005) empirically investigates the influence of signalling variables for the estimation of IPO underpricing. By using a sample of 1,842 IPOs listed on the Bombay Stock Exchange (BSE), India, during the period of January 1993 to March, 2001 he finds that uncertainty surrounding the IPO played a pivotal role in explaining underpricing. He also documents more value for small-size stand-alone firms issued during a hot IPO market. However, lesser underpricing is reported for the IPOs issued by big business groups during high IPO activity periods. Another argument put forward by Ljungqvist and Wilhelm (2003) and Loughran and Ritter (2004) find that IPOs issued during high activity period are subject to a high level of risk, resulting in more variation in the aftermarket prices, which is indicated through more underpricing. Motivated by the above said empirical arguments, initial day investors presumed that IPOs are highly underpriced and hence quote higher prices at the listing day. In other words, post listing variability of IPO stock return outweighs signalling and financial fundamentals in explaining list price. Further, as expected in the literature on the uncertainty hypothesis (Beatty and Ritter 1986; Ritter 1984), IPOs with perceived high magnitude of aftermarket volatility exhibit higher underpricing, resulting in more return for initial day investors. Recently, Vong (2006) document that both subscription rate and initial day return are significantly correlated with ex-post volatility of returns. Similarly, Reber and Fong (2006) studied a sample of 100 IPOs issued in Singapore during the period 1998–2000 and find that subscription level has significant influence on underpricing.
In the Indian context Neupane and Poshakwale (2012) find that the transparency in the IPO mechanism created demand, which is concentrated at either one or two points of the offer price range. Using a sample of 306 IPOs issued in India during January 2001–December 2010, they evaluate the demand schedule during the subscription period, and document that retail investors follow the institutional investors while placing the bids for the IPOs. Analysing the subscription pattern of retail investors, their study evidenced that a favourable demand from retail significantly contributes to higher offer prices. Finally they conclude that, retail investors subscribing those IPOs which attract premium subscription from informed institutional investors can earn abnormal profits (returns). Bubna and Prabhala (2011) document that when underwriters control allocations, book-building IPOs are associated with lesser underpricing. Analysing the IPOs initial-day returns under two different book-building regimes (that is, prior to November 2005, underwriters have allocation discretion; while post-November 2005 the regulation changed and underwriters no longer control allocation), they suggest that giving underwriters control over allocation has a significant effect on pricing.
A key empirical implication being suggested by Beatty and Ritter (1986) and Ritter (1984) are that underpricing should increase the ex-ante uncertainty about the value of the firm. Ritter (1984) finds IPOs surrounded with higher risk and uncertainty show higher aftermarket price volatility (measured as standard deviation for post-listing market prices). Precisely, there are reasons to believe that information asymmetry contiguous to the IPO at the time of issue might continue in the aftermarket, resulting in more volatility in the prices. Studies including Cassia et al. (2004), find a positive relationship between ex-post price volatility and IPO underpricing. In other words, offerings which exhibit a high degree of variability in their aftermarket returns are more underpriced and hence lesser value at offer. In contrast to the popular line of thinking Levis and Thomas (1995) find no significant relationship between aftermarket volatility and underpricing.
Another explanation for the uncertainty and IPO value is explained through the ‘price stabilization’ argument suggested by Chowdhry and Nanda (1999). They find that higher is the uncertainty the higher is the marginal benefit of providing incremental support for price stabilisation in terms of higher loss capacity. However, higher uncertainty in pricing may also leads to higher value of the put option for uninformed investors. As a result, issuing firm charged higher prices to induce the uninformed investors to participate in the issue. Contrary to the above argument Chen and Wilhelm (2008) suggested that greater is the aftermarket pricing uncertainty, the more is the incentive needed to compensate institutions for facilitating the distribution of IPOs. Similar findings are also provided by Falconiery et al. (2009) and Lowry and Schwert (2004).
One of the most important variable concerns the aftermarket price volatility for the IPO stocks is the issue mechanism. Degeorge et al. (2010) argued that a high elasticity of demand curve is indicative of high information content in investor’s bids. Investigating the bid statistics for 19 auctioned IPOs issued in the US during 1999–2007, they document that in an auctioned mechanism, an underwriter does not control the amount of information production, which makes the outcome of the offering more uncertain. They also document that higher institutional demand elasticity is associated with lesser aftermarket variability in prices, because institutional investors are relatively more informative and their demand for IPOs contributes valuation information. By contrast, retail investors demand elasticity is positively associated with aftermarket price variability, as retail investors are lesser informative and add noise to the pricing process.
Pettway et al. (2008) made a comparative study of aftermarket variability in book-built and auctioned IPOs. They find that IPOs issued through a book-building mechanism exhibit greater underpricing and higher aftermarket volatility than the IPOs issued through price discriminatory auction mechanism. On making a comparison between book-building and fixed-price IPOs, Benveniste and Busaba (1997) find that book building generates more initial day return, but also exposes the issuing firm to a greater uncertainty, which leads to more price variability. By contrast, fixed price issues priced at the cascade price assured the issuer certain proceeds. They also document that firms with more price uncertainty and greater concern for risk prefer fixed-price offer, and firms with more capital needs in future prefer book building.
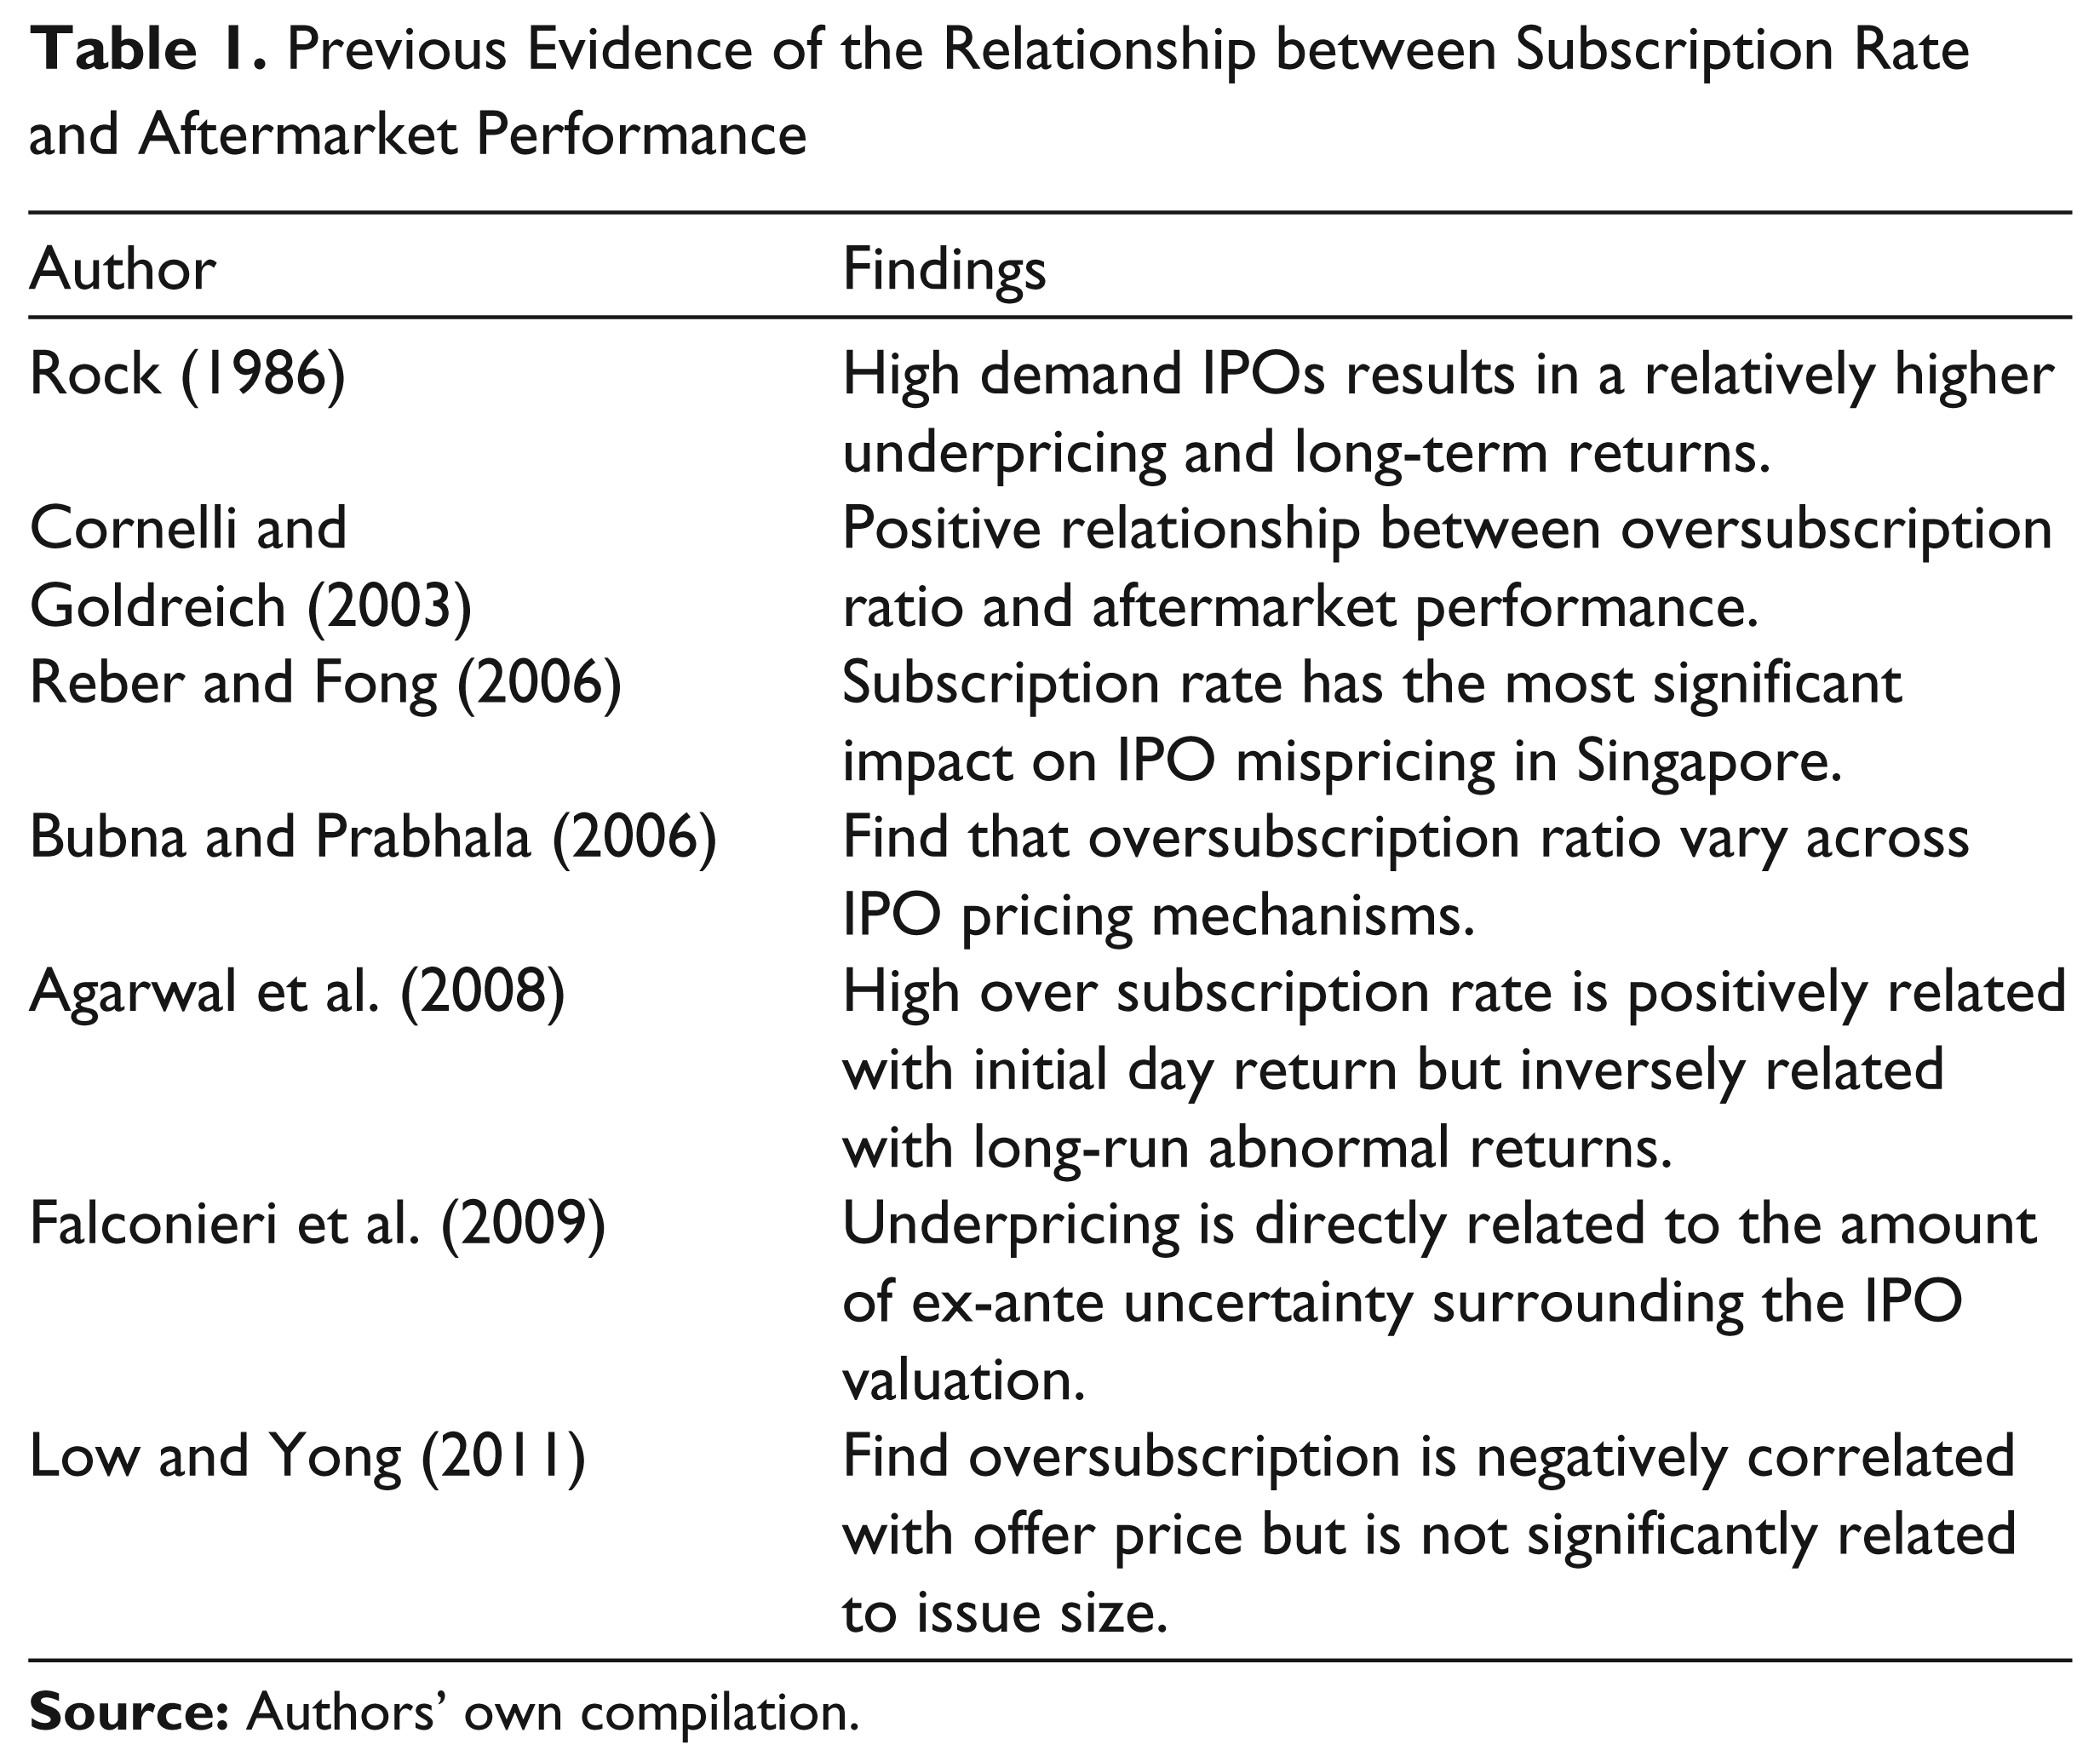
Ex-ante variable which measures the aftermarket volatility of IPO stocks shows positive regression coefficients with list price. In other words, perceived risk level for the IPO and its initial day list price move in the same direction, that is, higher the ex-post price volatility higher is the list price. This could be driven by the argument that underpricing serves as a proxy for ex-ante uncertainty surrounding IPOs. Contrary to the above Sherman (2005) suggests that greater underpricing is associated with lesser aftermarket volatility for the IPOs. The crux of the argument is that when investors incur more information production cost, pre-market uncertainty is reduced. Gleason et al. (2008) suggest that aftermarket price risk is higher for firms that experienced a higher level of underpricing. In other words, underpricing is used as a compensation for higher volatility in the aftermarket prices for IPO stocks. Thus, underpricing not only reflects the uncertainty at the time of the offering, but also is a useful indicator of aftermarket risk. Table 1 highlights the relationship between subscription rate and aftermarket performance of IPOs.
Previous Evidence of the Relationship between Subscription Rate and Aftermarket Performance
Theoretical Framework
Despite underwriter’s best efforts, the degree of uncertainty and informational asymmetry among investors is not fully resolved on the primary market, rather it continues in the aftermarket (Chen and Wilhelm 2008). In support their argument, they provide enough evidence that a series of price stabilisation measures are being taken by the issue managers to stabilise the prices. Accordingly, uncertainty and information asymmetry persists in the secondary market until stable trading conditions are reached. There has been increasing evidence that issuing firms deliberately underprice the IPOs to offset the effect of uncertainty in the secondary market. Existing studies, that is, Aggarwal (2002), Barry et al. (1991), Clarkson and Simunic (1994), Gleason et al. (2008), Hansen (2000), Loughran and Ritter (2004) and Ritter (1984), document a positive relationship between underpricing and aftermarket volatility. These studies argue that underpricing is used as one of the proxy for ex-ante uncertainty 3 for the IPO firm. However, underpricing of the IPO can only be observable at listing day. Hence, it creates more difficulty for the initial investors to evaluate the expected price volatility for the IPO at the time of issue. Contrasting with the above evidence, Clarkson (1994), Levis and Thomas (1995) and Vong (2006) found no significant relationship between aftermarket volatility and underpricing. Using a database of 251 IPOs issued in Hong Kong during 1998 and 1995, he finds that volatility of aftermarket returns fails to explain the underpricing, once it is controlled for subscription rate. In the same vein, this study argues that variability in the aftermarket prices for IPOs may not necessarily related to underpricing, rather it is the variability or unexpected response rate of the investors in the primary market might cause larger fluctuations in the prices. Saar (2001) also argues that uncertainty about investor demand leads to wider bid ask spread for IPO prices. Further, in the IPO setting the traditional measure of risk, that is, market risk or firm-specific risk for an IPO firm is difficult to measure, because of unavailability of historical price performance. Since aftermarket volatility for the IPO firm is closely related to the secondary market reaction, an increasing need is to use investors demand as a signalling variable to evaluate potential price variations. In short, there are reasons to believe that investors demand for IPO is the primary test for the IPO firm to appraise the mood and trend of the market for the issue. The information content of over subscription rate is unique and it contains the first-hand information on market response for the IPOs (Vong 2006).
Arguments in Favour of Using Subscription Rate
Investors demand is critical component for the success of an IPO. The implication is that the investors demand as measured by oversubscription rate is of greater importance in understanding the characteristics of the IPO, including aftermarket performance (Low and Yong 2011). Prior studies, that is, Agarwal et al. (2008), Ritter (1984) and Vong (2006) find the relevance of investors demand as a useful signal for aftermarket performance in general and initial day return in particular. The following are the arguments in favour of growing importance for the subscription rate as a signal for IPO performance.
Information content of IPO subscription rate is unique and it contains first-hand market response for the issue (Vong 2006). A highly oversubscribed IPO can be viewed as the reputation of the issue and indicate the perceived quality of the IPO firm. To increase oversubscription, firms generally time their IPOs to coincide with periods of larger underpricing and low IPO activity (Low and Yong 2011).
During subscription investors have paid in advance for getting an allocation in an IPO. Hence, oversubscription rate can be used as a useful indicator for the potential demand for IPO stocks once they are listed in the secondary market.
A larger body of work documents the importance of subscription rate in affecting the IPO activities in subsequent period. 4 Hence, the effect of subscription rate on volatility needs in-depth analysis.
Heavily oversubscribed IPOs ensure wider distribution and hence create more liquidity in the market (Loughran et al. 1994). Increasing liquidity helps in controlling volatility for the stocks.
Distribution of Frequency of Subscription Rate for Indian IPOs across Periods
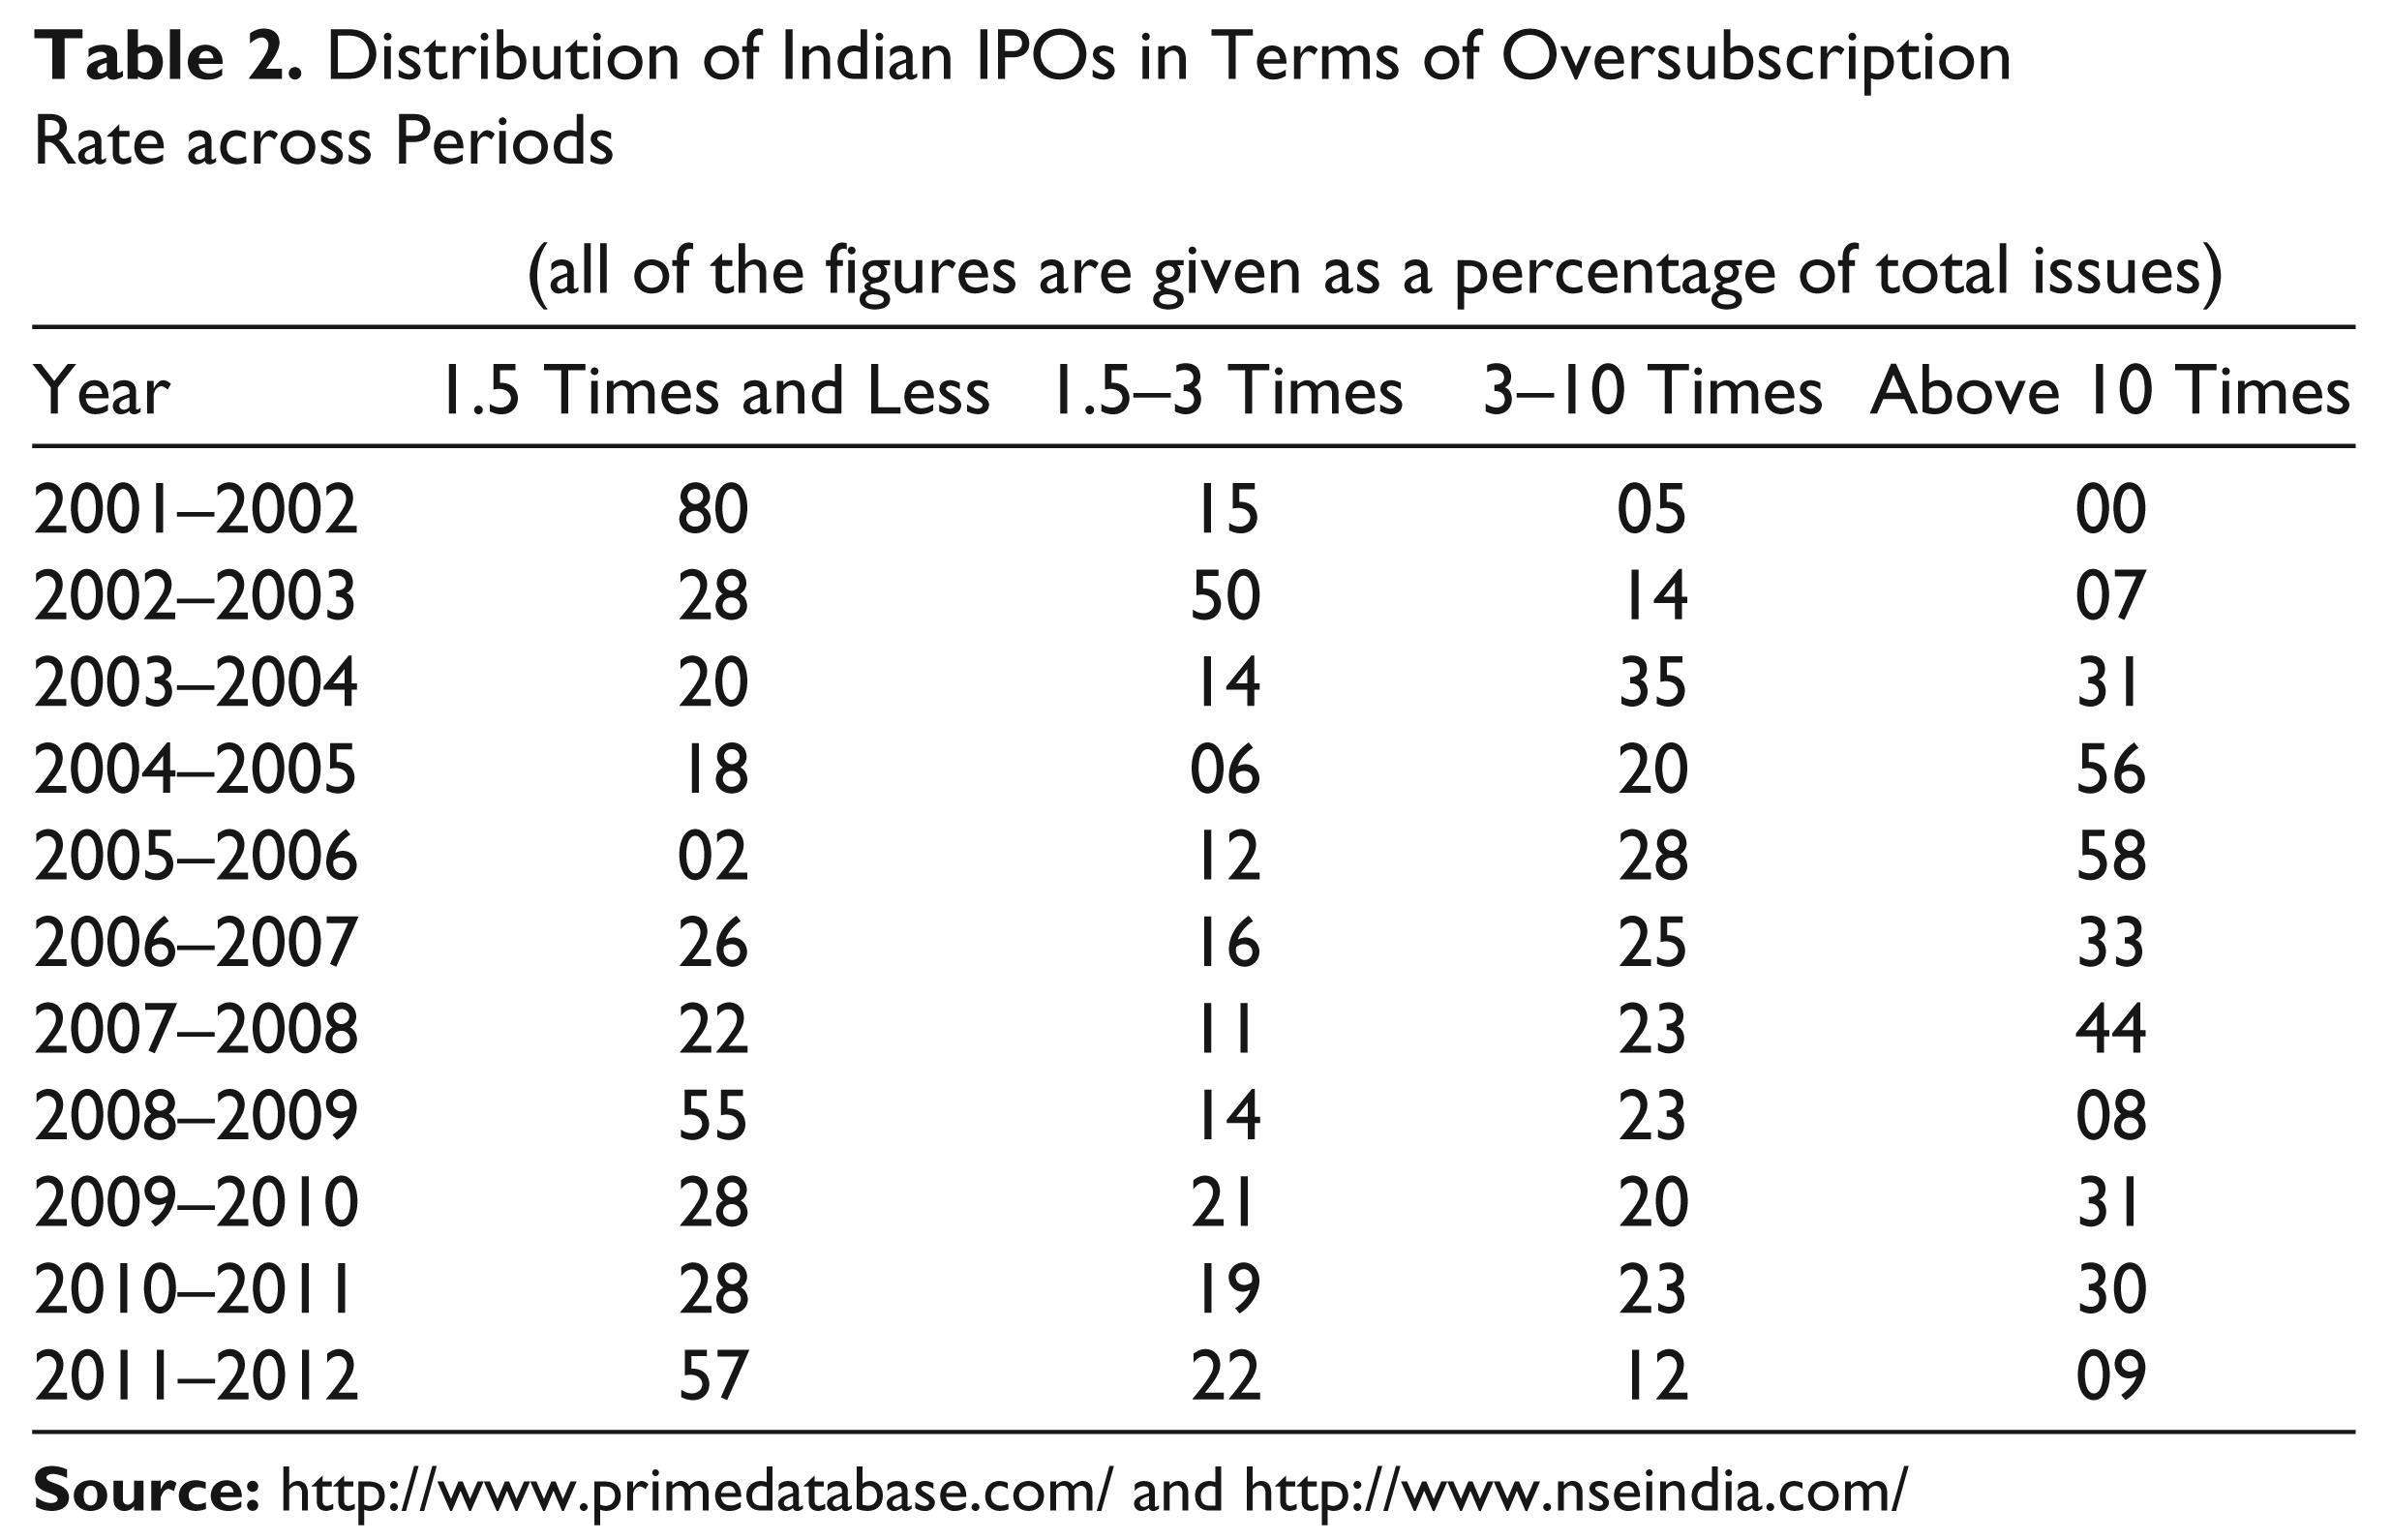
Table 2 shows data ensuring the investors’ confidence in the market, as measured by the frequency of oversubscription. Response to the IPOs in terms of frequency of oversubscription is increasing year by year. The data shows 58 per cent of the IPO got oversubscribed by more than 10 times in the year 2005–06, as compared to not a single IPO oversubscribed by above 10 times in the year 2001–02. Public issues during the period 2001 and 2002 failed to elicit good response, as 80 per cent of the issues are subscribed by 1.5 times and less than that. Only 5 per cent issues were oversubscribed within the range of 3 to 10 times, which can be interpreted that the post-dot com period is entangled with higher market risk. In recent years (up to 2007–08) more number of IPOs able to get favourable response from the investors. The overwhelming response to the IPOs in terms of subscription reflects the regain of confidence of the investors in the new issue market. However, due to the global turmoil, only 8 per cent of the public issues were subscribed more than 10 times in comparison to 44 per cent in the fiscal 2008–09. Similarly, IPOs witnessed lacklustre response from investors during 2011–12, owing to economic downturn. Only 9 per cent IPOs were oversubscribed by more than 10 times.
Distribution of Indian IPOs in Terms of Oversubscription Rate across Periods
(all of the figures are given as a percentage of total issues)
Definition and Estimation of Variables
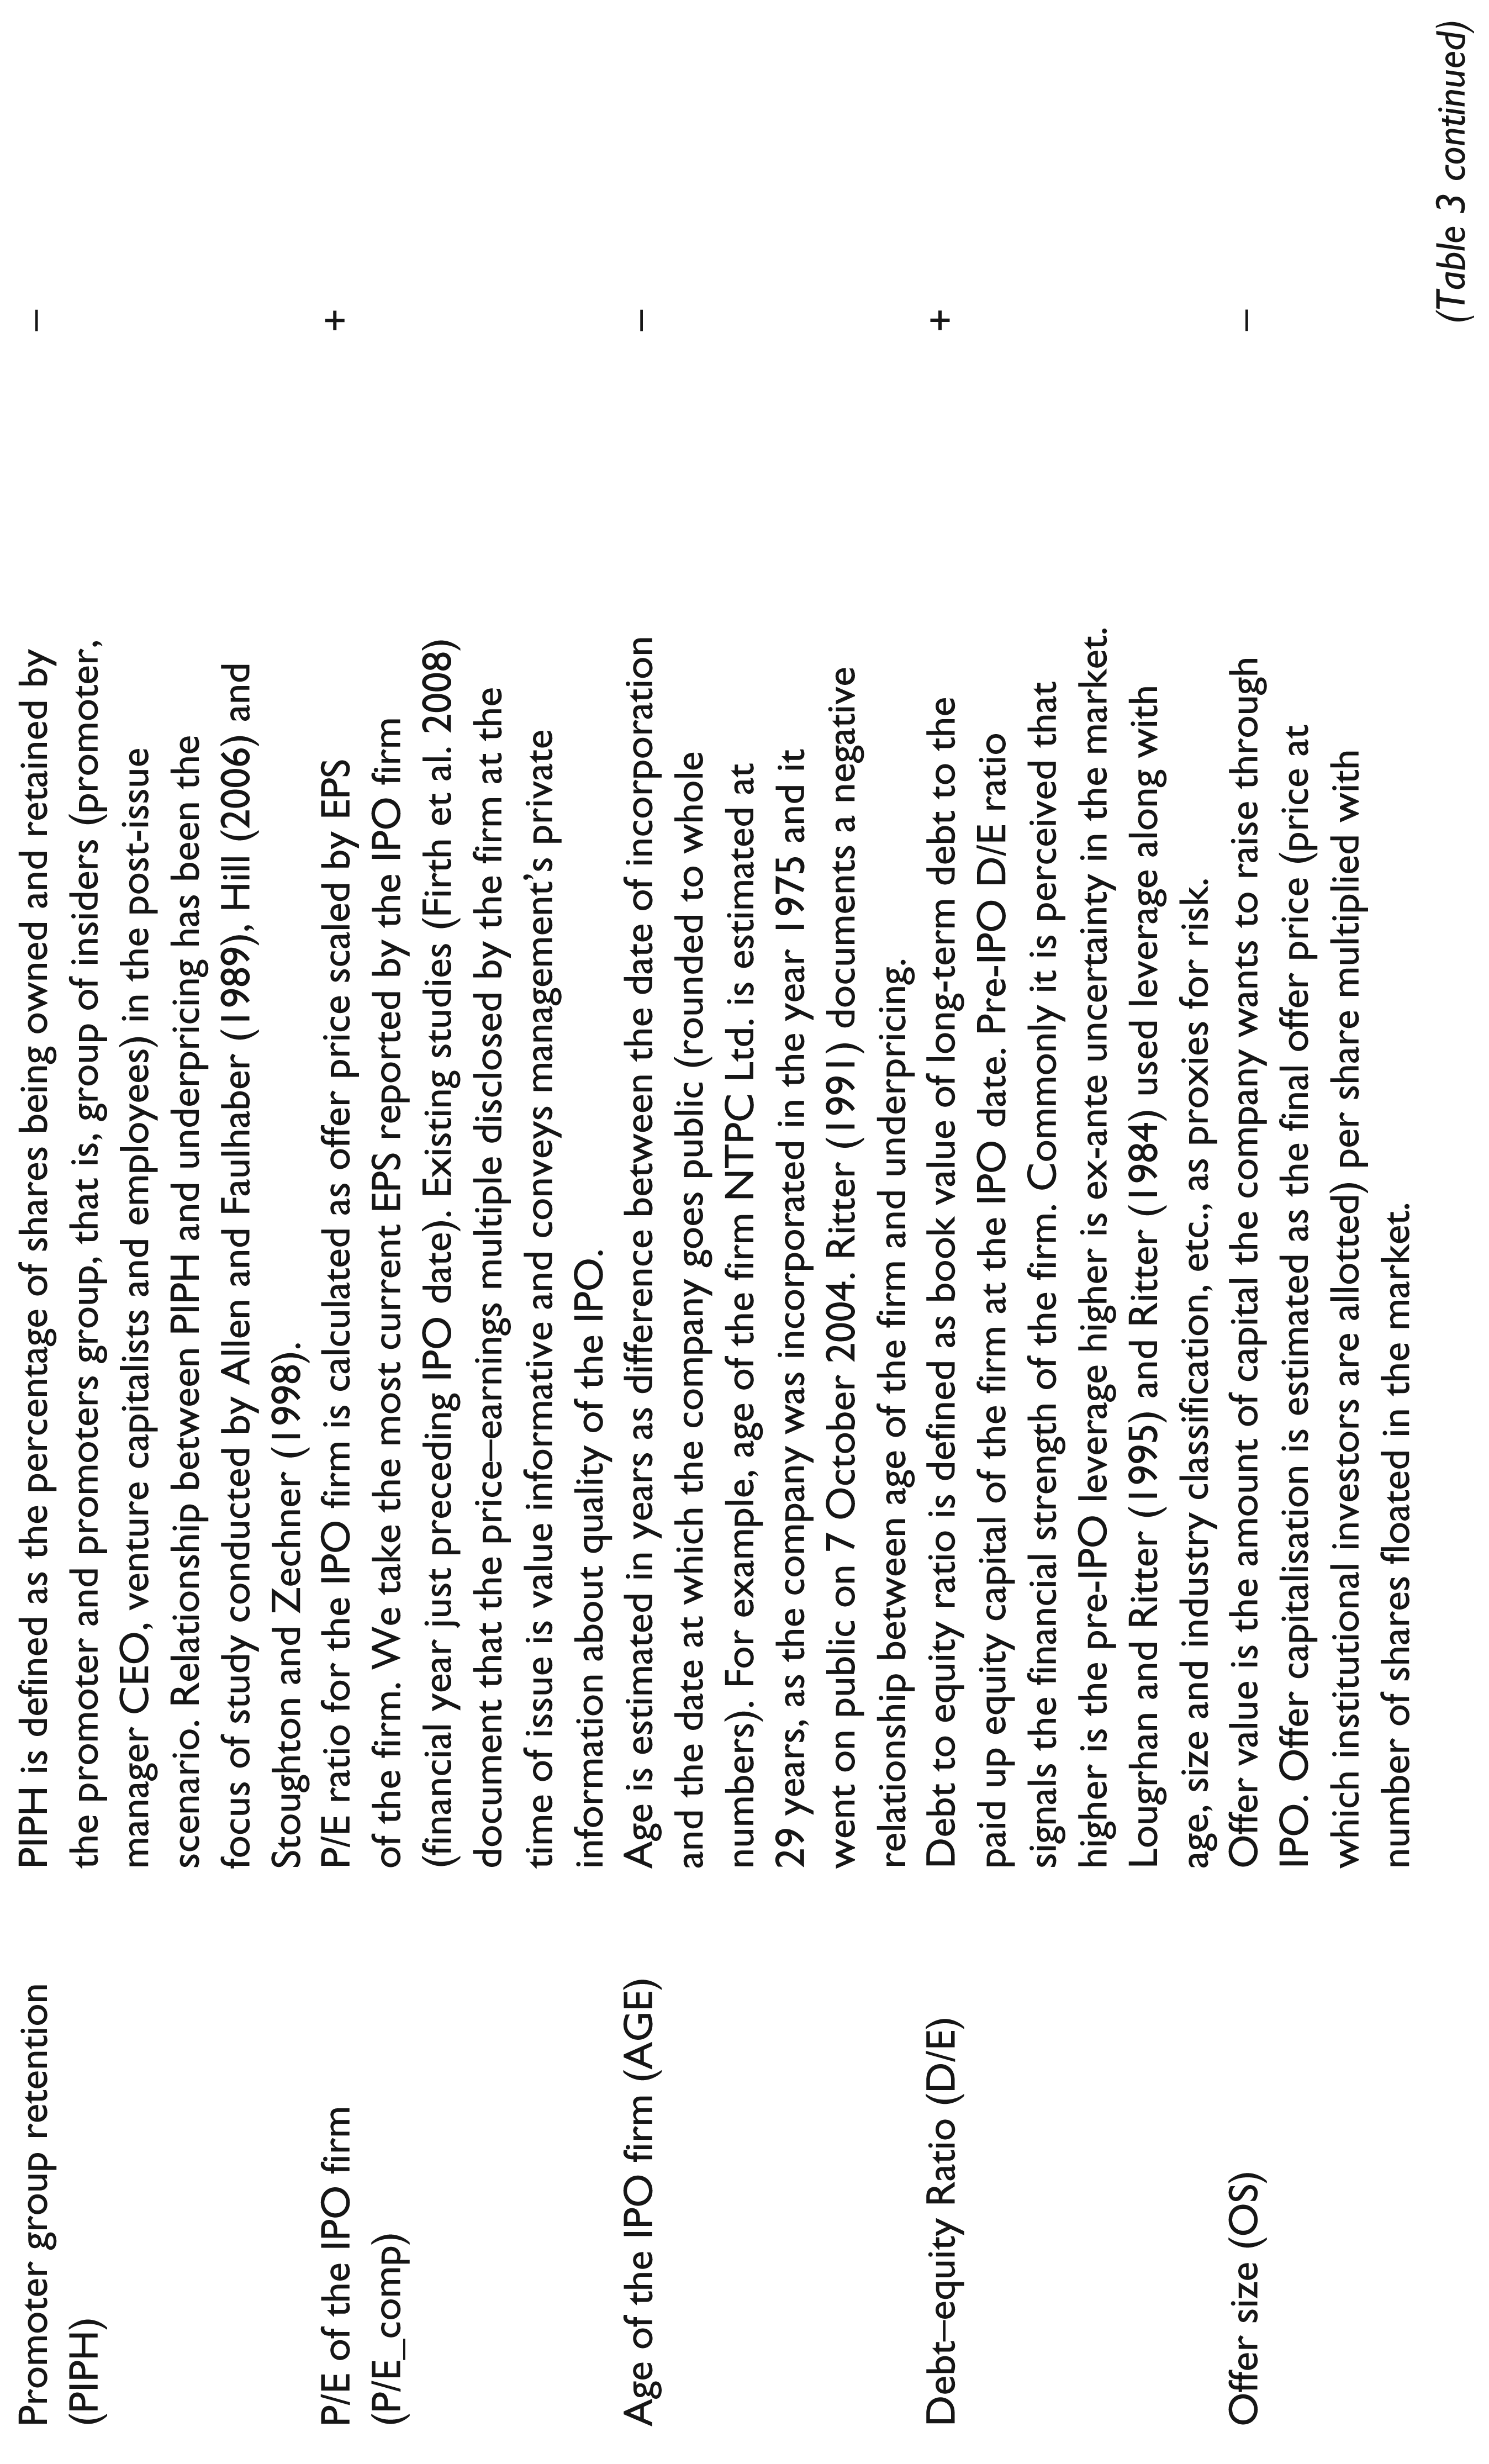
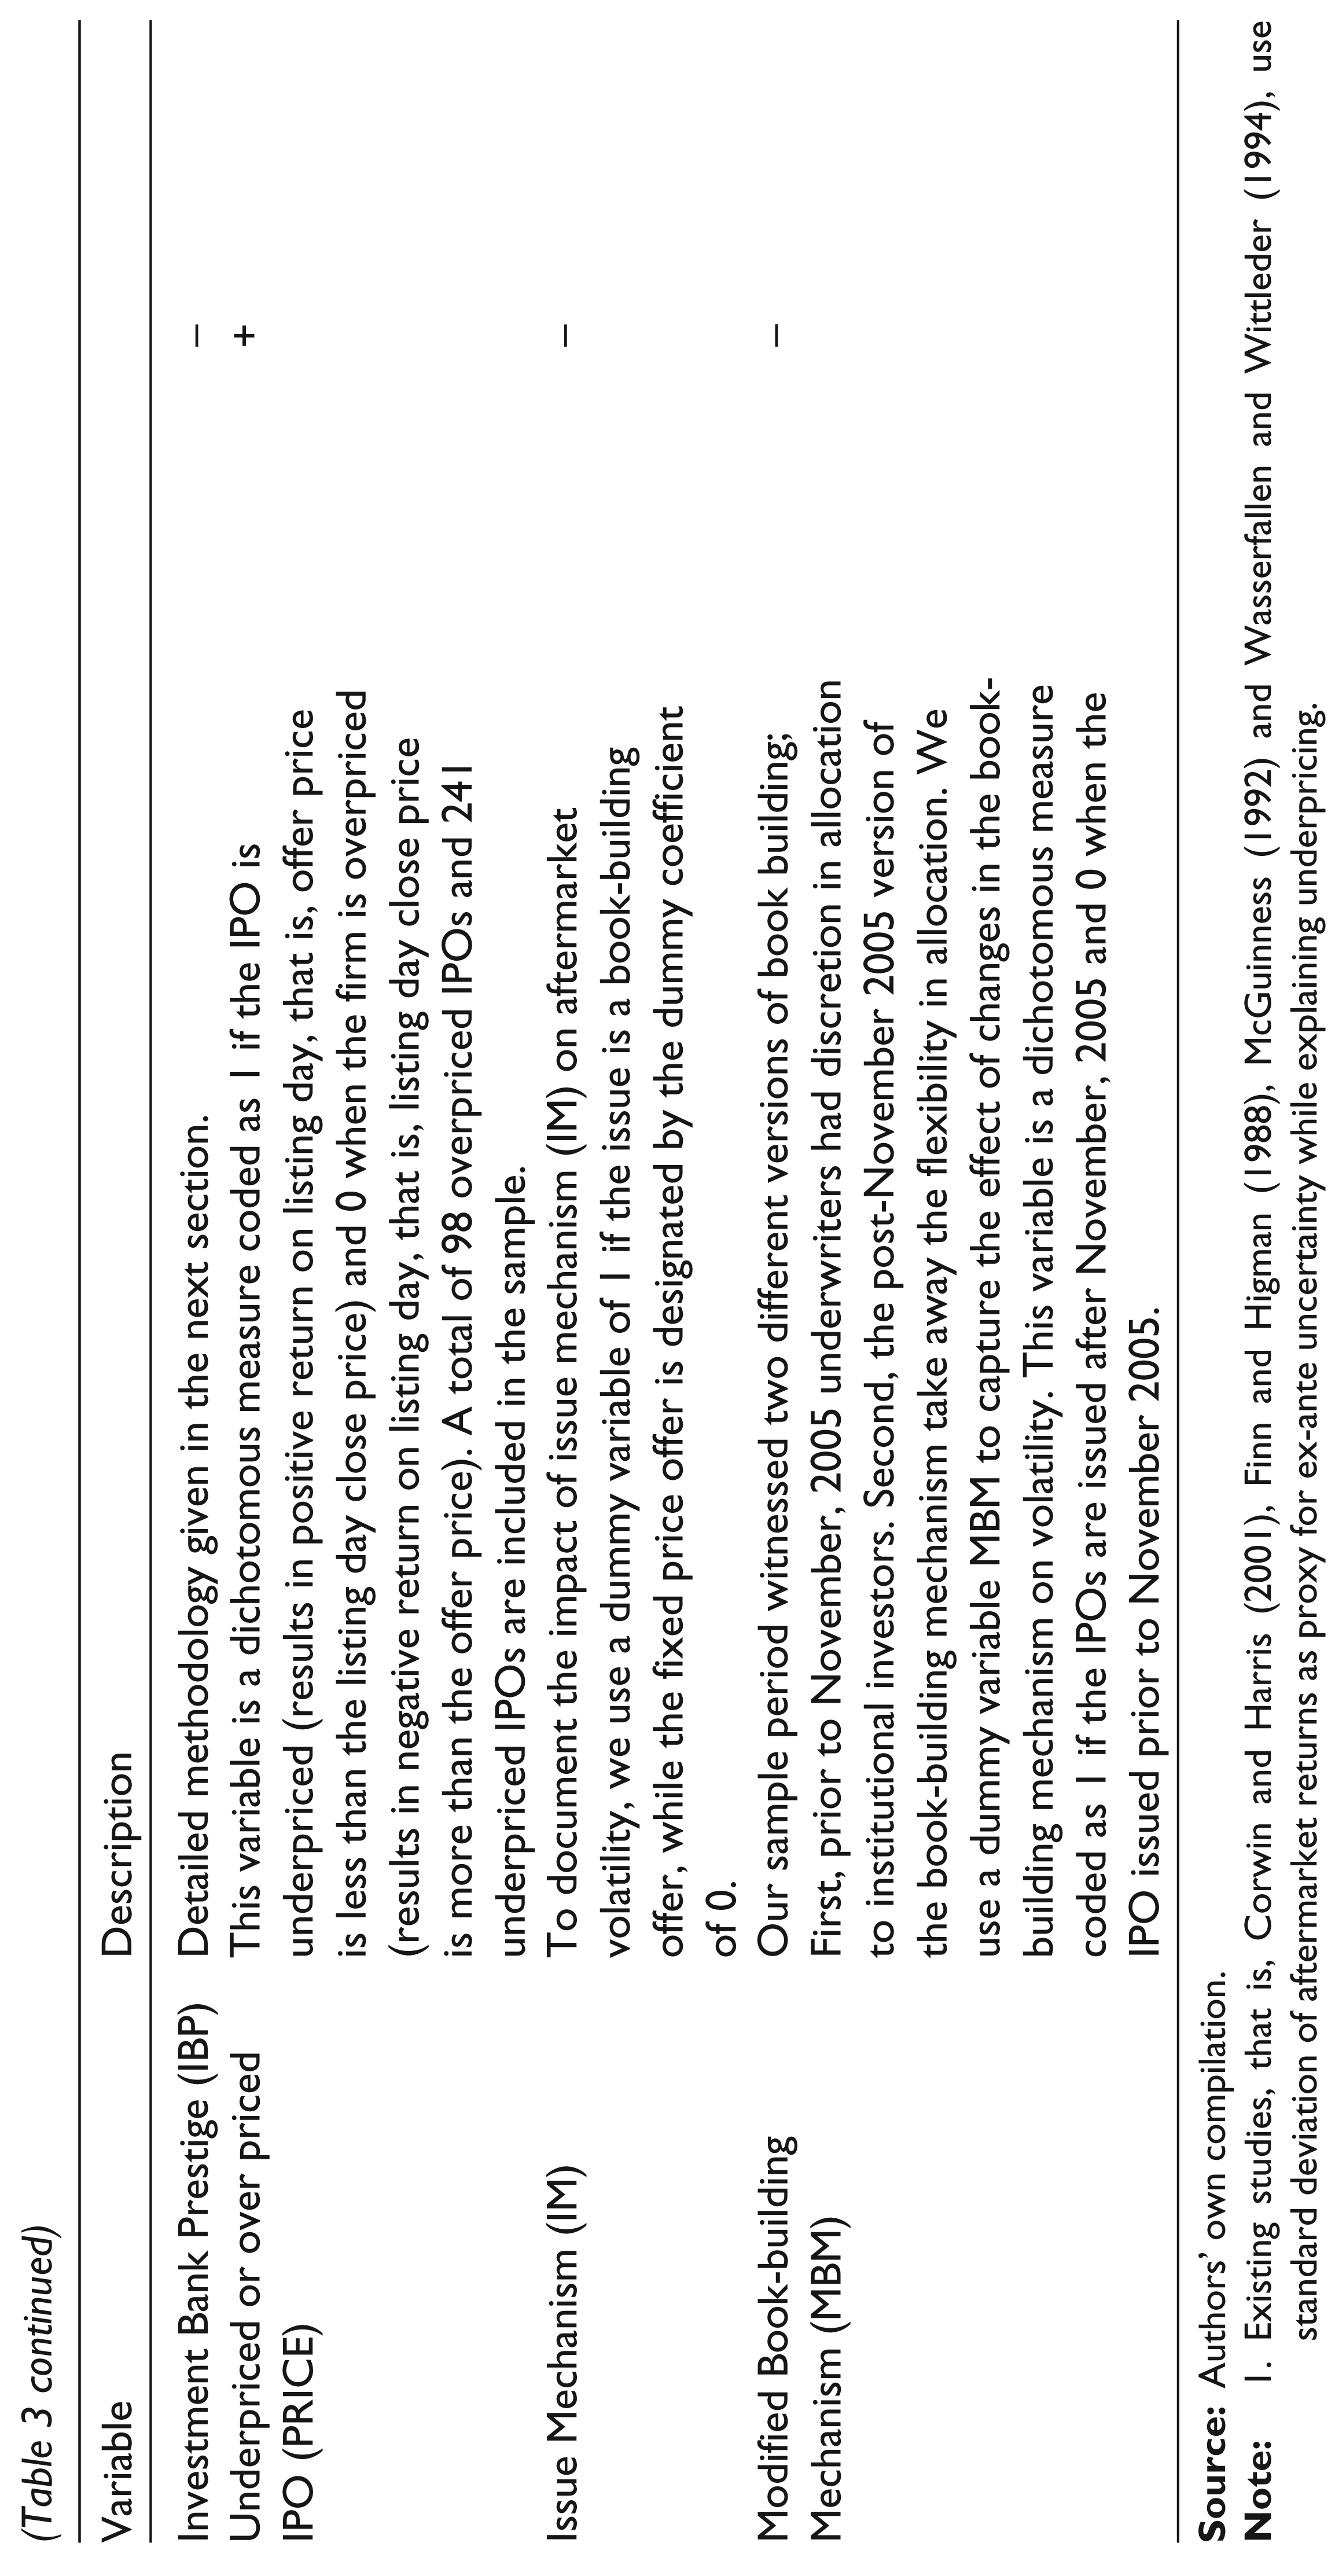
On the background of the literature the determinants for the volatility are identified. The whole set of explanatory variables include, underpricing, rate of subscription, post-issue promoter groups retention, book value per share, P/E ratio of the firm, age of the firm, debt–equity ratio and issue price. Table 3 outlines a detailed description of all variables along with their estimation procedure and expected impact on VOLATILITY.
Market-adjusted Abnormal Return (MAAR)
The magnitude of initial day’s return (Ri) for the security is estimated as the difference between individual security return and the market benchmark return. The return of stock ‘i’ at the end of the first trading day is calculated as:

where, LPi (List price) is listing day’s closing price for IPO stock and IPi is the final offer price at which shares were sold to institutional investors.
The market return is the return earned on the market portfolio over the same period is defined as follows:

where, Rm is the initial trading day’s equivalent market return. MIc: is the market index value at close of the first trading day, MIo: is the closing market index value at the date of opening of the issue.
Definition of Variables and Their Impact on VOLATILITY

Finally, we estimate the market-adjusted abnormal rate of return (hereafter, MAAR) for the IPO stock on the listing day in the following way:

The above formula conforms to Miller and Reilly (1987) for calculating the initial return. Market-adjusted return is calculated by taking S&P CNX Nifty (henceforth Nifty) index data for the period of study 2002–07. The bench mark Nifty is a well diversified 50 stock index accounting for 22 sectors of the economy. It is used in tandem with the Bombay Stock Exchange Sensitive Index (BSE Sensex) for a variety of purposes including bench mark fund portfolios, index based derivatives and index funds. The foregoing methodology also conforms to Aggarwal et al. (1993) and Sohail and Nasr (2007). A positive value for MAAR indicates that the IPOs are underpriced with reference to the listing day close price. Alternatively, an overpriced issue yields a negative MAAR value at the initial day. Initial day returns (MAAR) and underpricing are used interchangeably.
Measurement of Investment Bank Prestige (IBP)
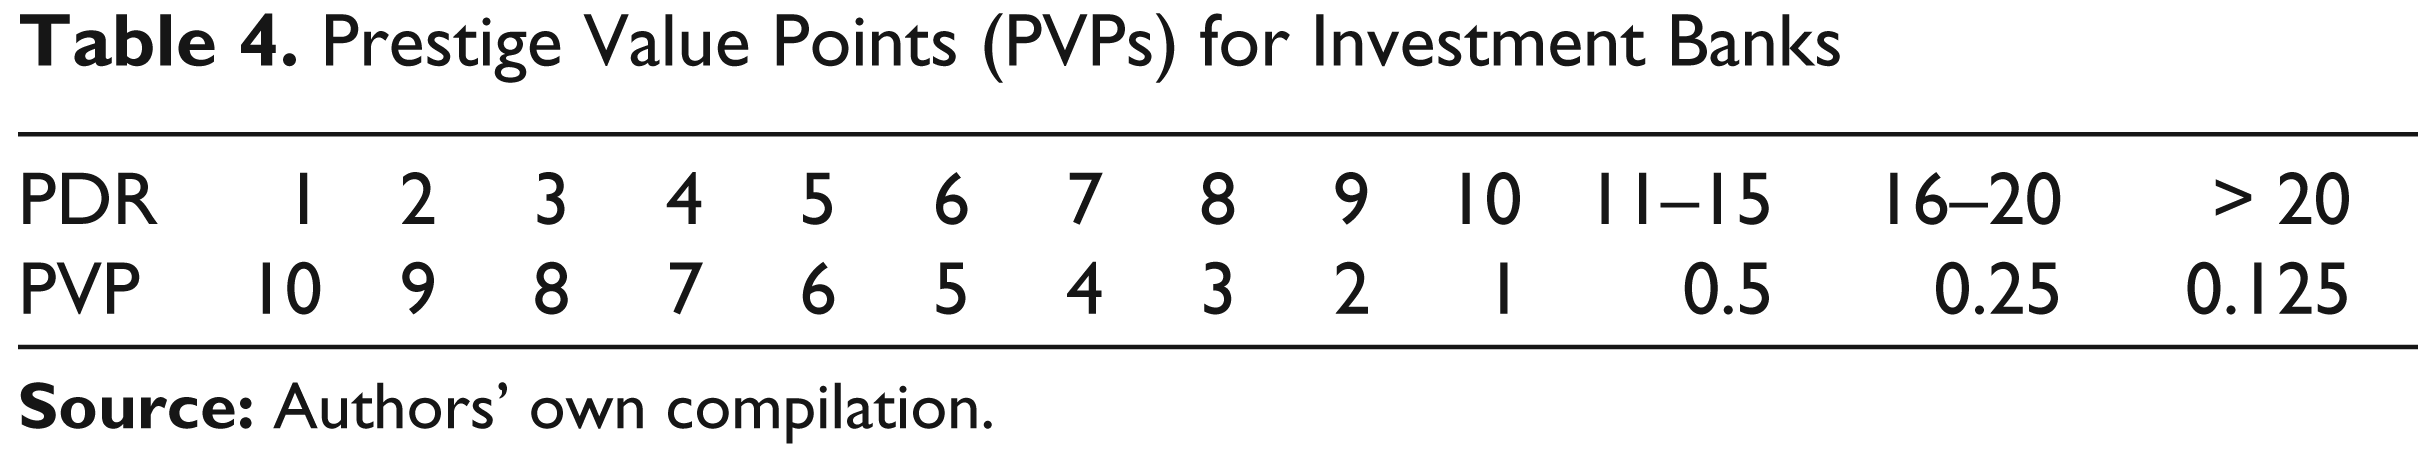
The prestige of investment banks has been quantified in two steps: first, ratings of investment banks from the Prime Database annual reports for the period 2007 to 2011 were collected. Prime Database assigns ranks to investment banks based on their annual market share in terms of total deal value. Investment banks having highest market share is assigned the rating of 1; while the next one is given the rating of ‘2’ and so on so forth, consistent with the Megginson–Weiss model (1991). This approach is superior, as it does not assume reputation of an investment bank to be constant over time. Additionally, the market share provides a cardinal value of reputation than ordinal value.
In the second step, each investment bank is assigned with some prestige value points (hereafter, PVP) in commensurate with the Prime Database rank (hereafter PDR). In this article we assign rank value points of 10 for an investment bank rated as 1. Further, the investment bank having rank of 2 is assigned with a PVP of 9 and the order continues. The PVP declines with decrease in rating value. An investment bank having a PDR range of 11–15 was given a PVP of 0.50. Similarly a PDR from 16 to 20 were given a PVP of 0.25 and ratings with >20 were given a PVP of 0.125. Table 4 lists the PDR and its corresponding PVP. All IPOs in this study were managed by a syndicate of investment banks. For the IPOs managed by more than one investment bank, we take the rank value of the book running lead manager (appearing on top of the list of book running lead managers) as prestige value for that IPO.
Prestige Value Points (PVPs) for Investment Banks
Data, Sample Selection and Methodology
In this section the sample selection methodology and data characteristics are discussed. The following sub-section outlines the sample selection methodology, while in the next sub-section the descriptive statistics are discussed.
Sample Selection Methodology
Our sample covers 10 years from 2002 to 2012. The underlying data source for the study are the Prime Database (hereafter, Prime) annual reports, which is the leading IPO market database in India. Prime publishes detailed information for all IPOs issued in India along with primary debt issues and seasoned equity offerings. Besides Prime, we use multiple online databases, such as,
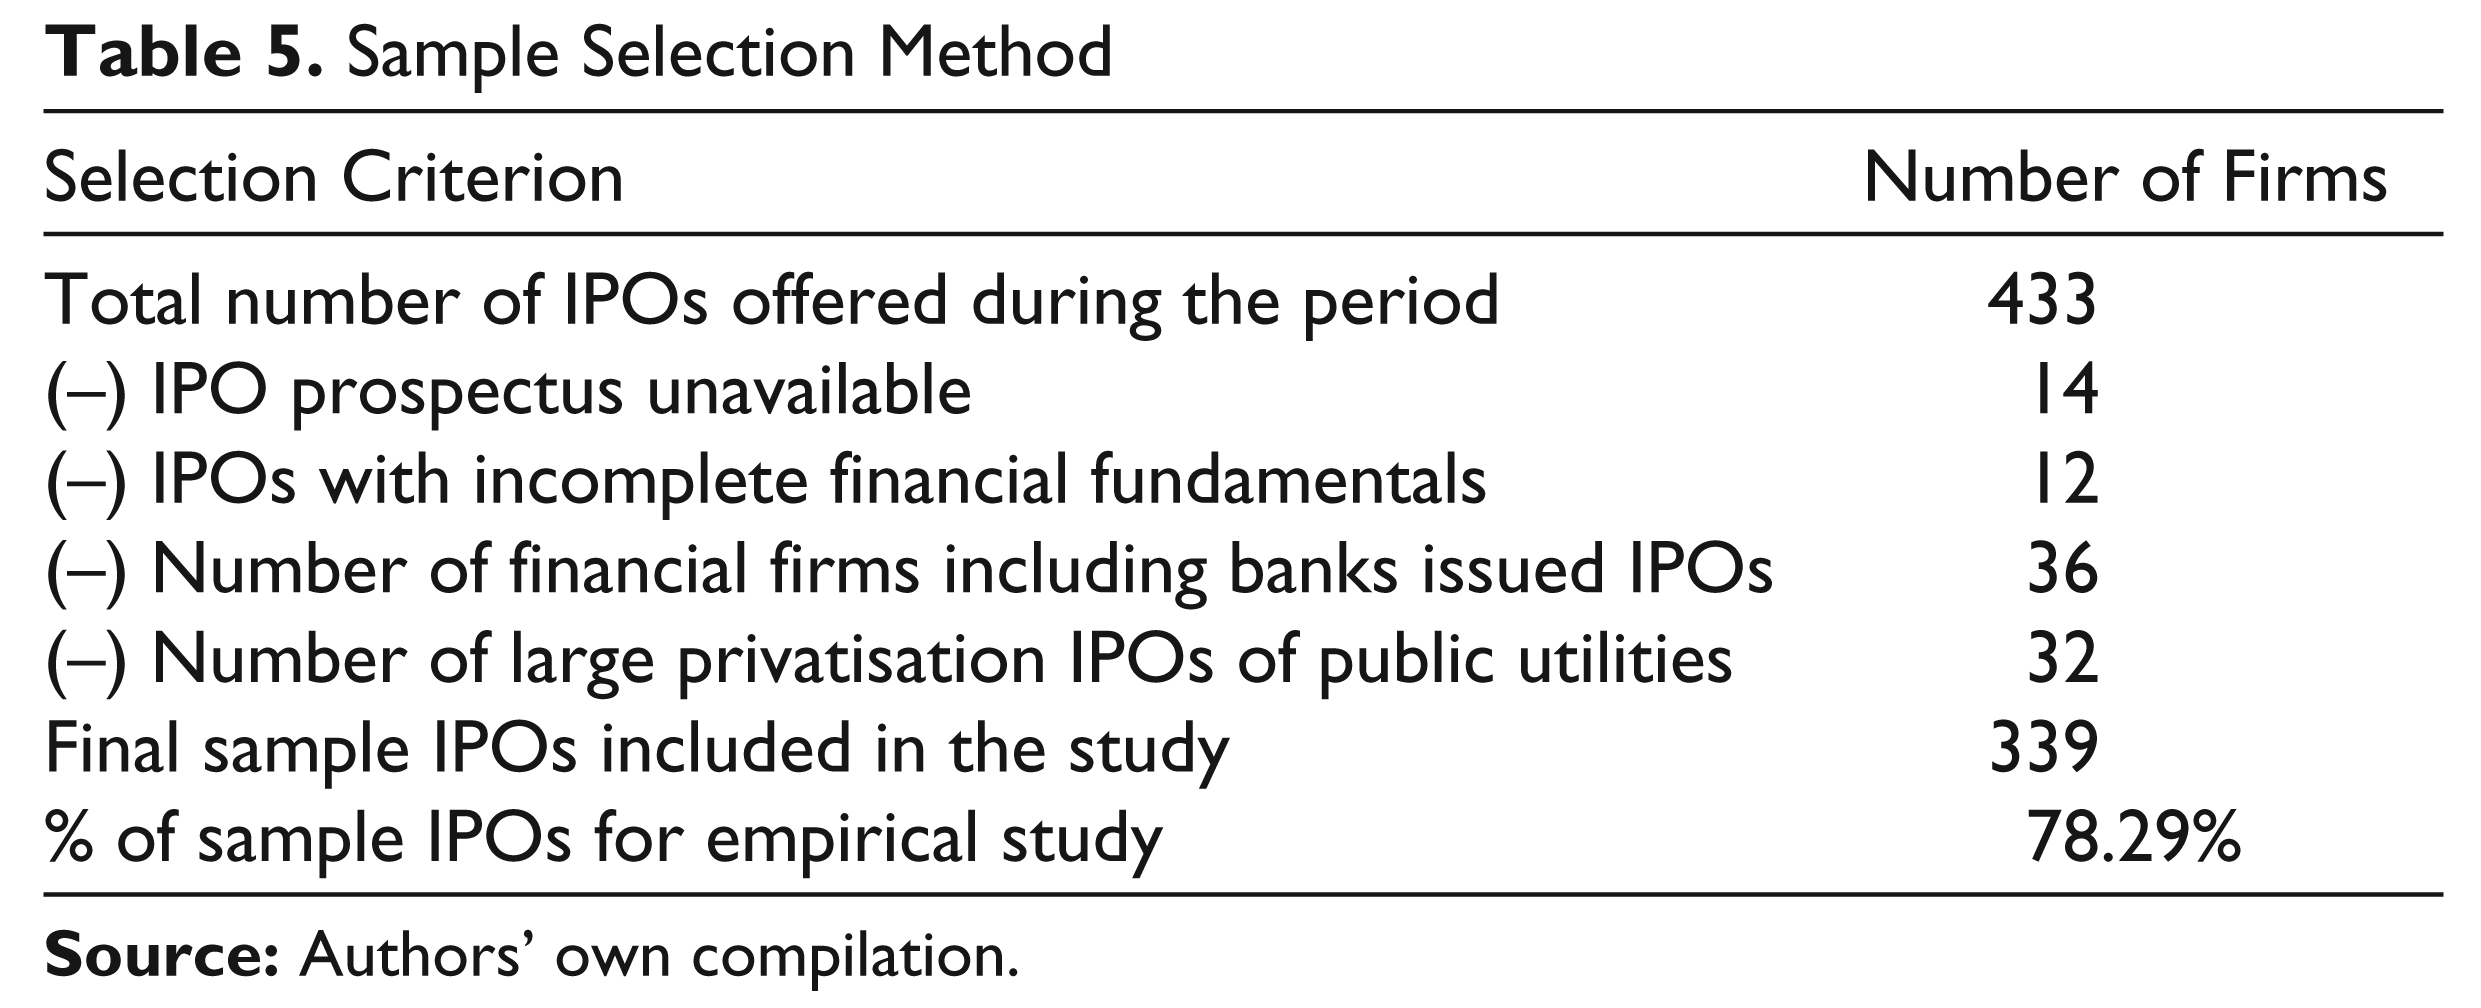
The initial sample taken from prime database covers all IPOs (equity only) issued during 2002–12 and listed on the National Stock Exchange (NSE), Mumbai, India. 6 On excluding the debt issues we come out with a population of 433 IPOs, which are issued during the period April 2002 to March, 2012. A total of seven IPOs could not be accommodated because of non-availability of a red herring prospectus needed for collecting issue-specific data. Further, four more IPOs were dropped due to non-availability of financial information. Fixed-priced offers are excluded from the study; because a fixed-price issue does not have that kind of market-assessment provision, resulting in more hardship for true valuation. Banks and financial institutions (including offer for sale from public utilities) issuing IPOs are also kept out of the sample, since the cash flows and operating characteristics of these firms are different from the average firms. The remaining 339 IPOs form the sample for this study, representing 78.29 per cent of the population. Table 5 outlines the sample selection methodology.
Sample Selection Method
Econometric Model
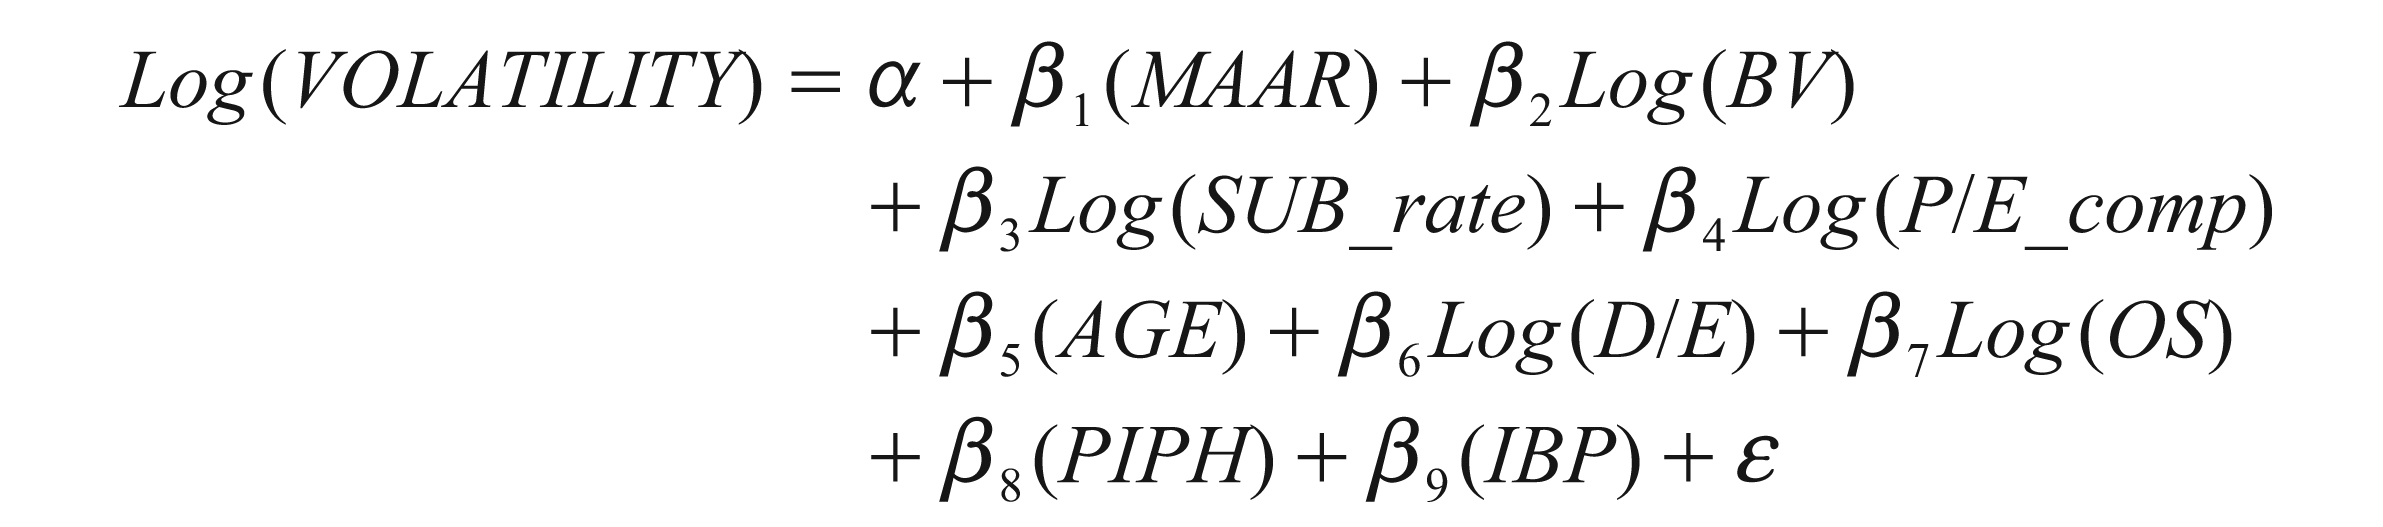
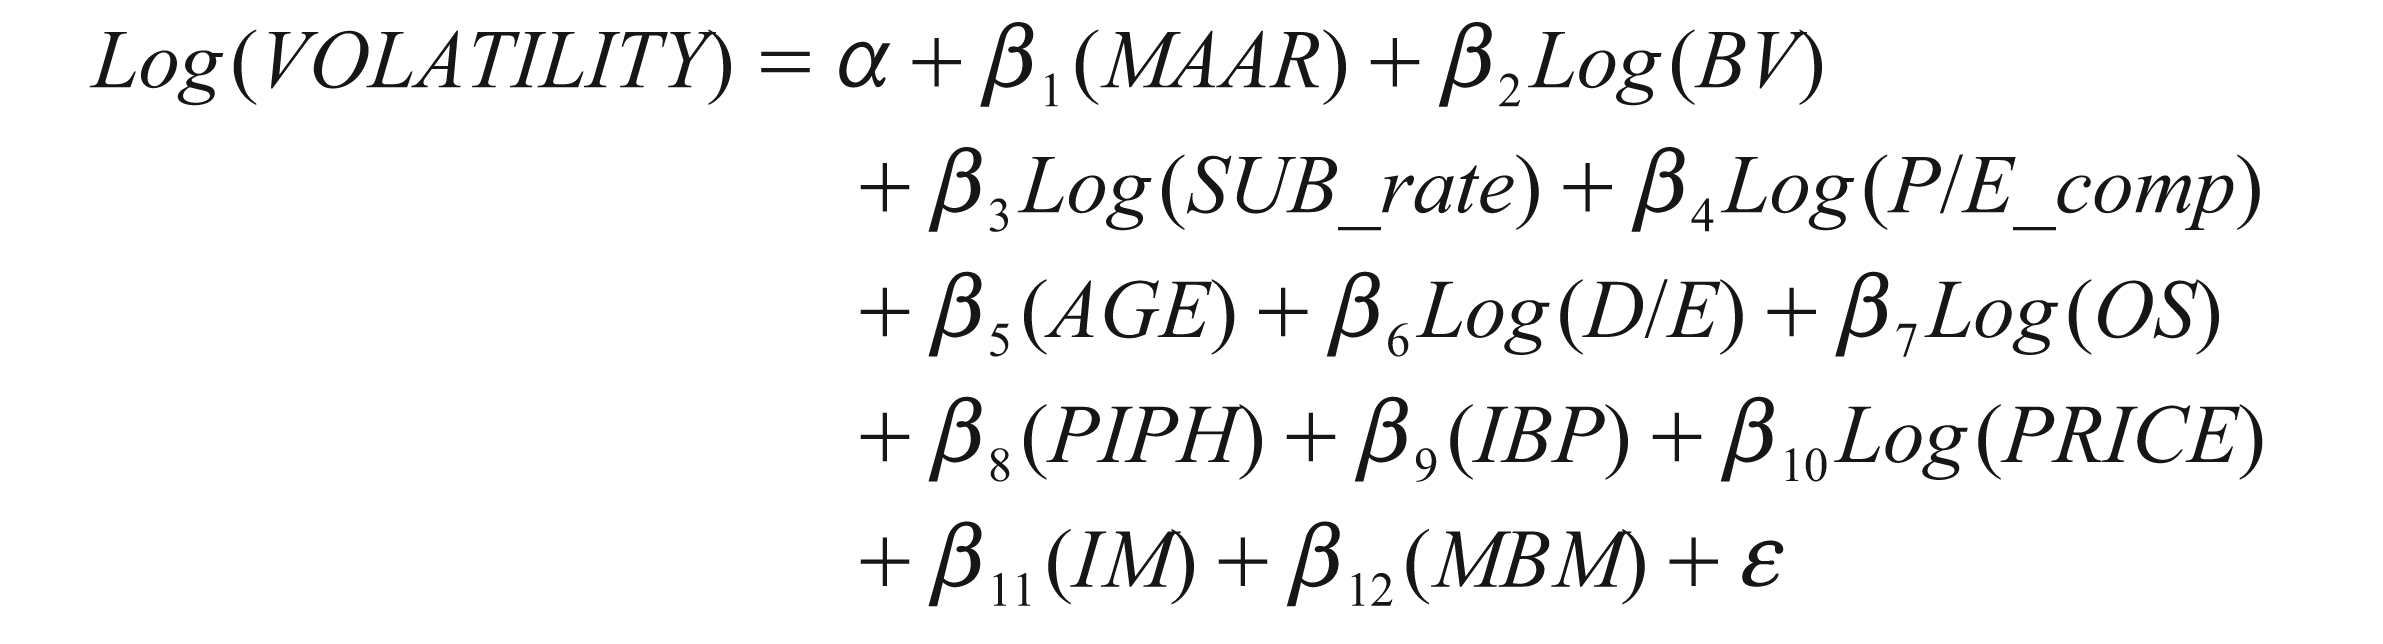
Based on the underlying concept of a relationship between subscription rate and volatility, we establish three ordinary least squares (OLS) regression equations, where volatility is the dependent variable and subscription rate is independent variable. Prior research reveals that there are certain issue characteristics that produce bearing on aftermarket pricing risk for the IPO firm. Besides, oversubscription variables, that is, post-issue promoter group retention, underpricing, P/E of the firm at offer, book value, age of the firm, debt–equity ratio, offer size and investment bank prestige are taken as independent variables. The following econometric model is used to evaluate the determinants of post listing price risk (VOLATILITY).
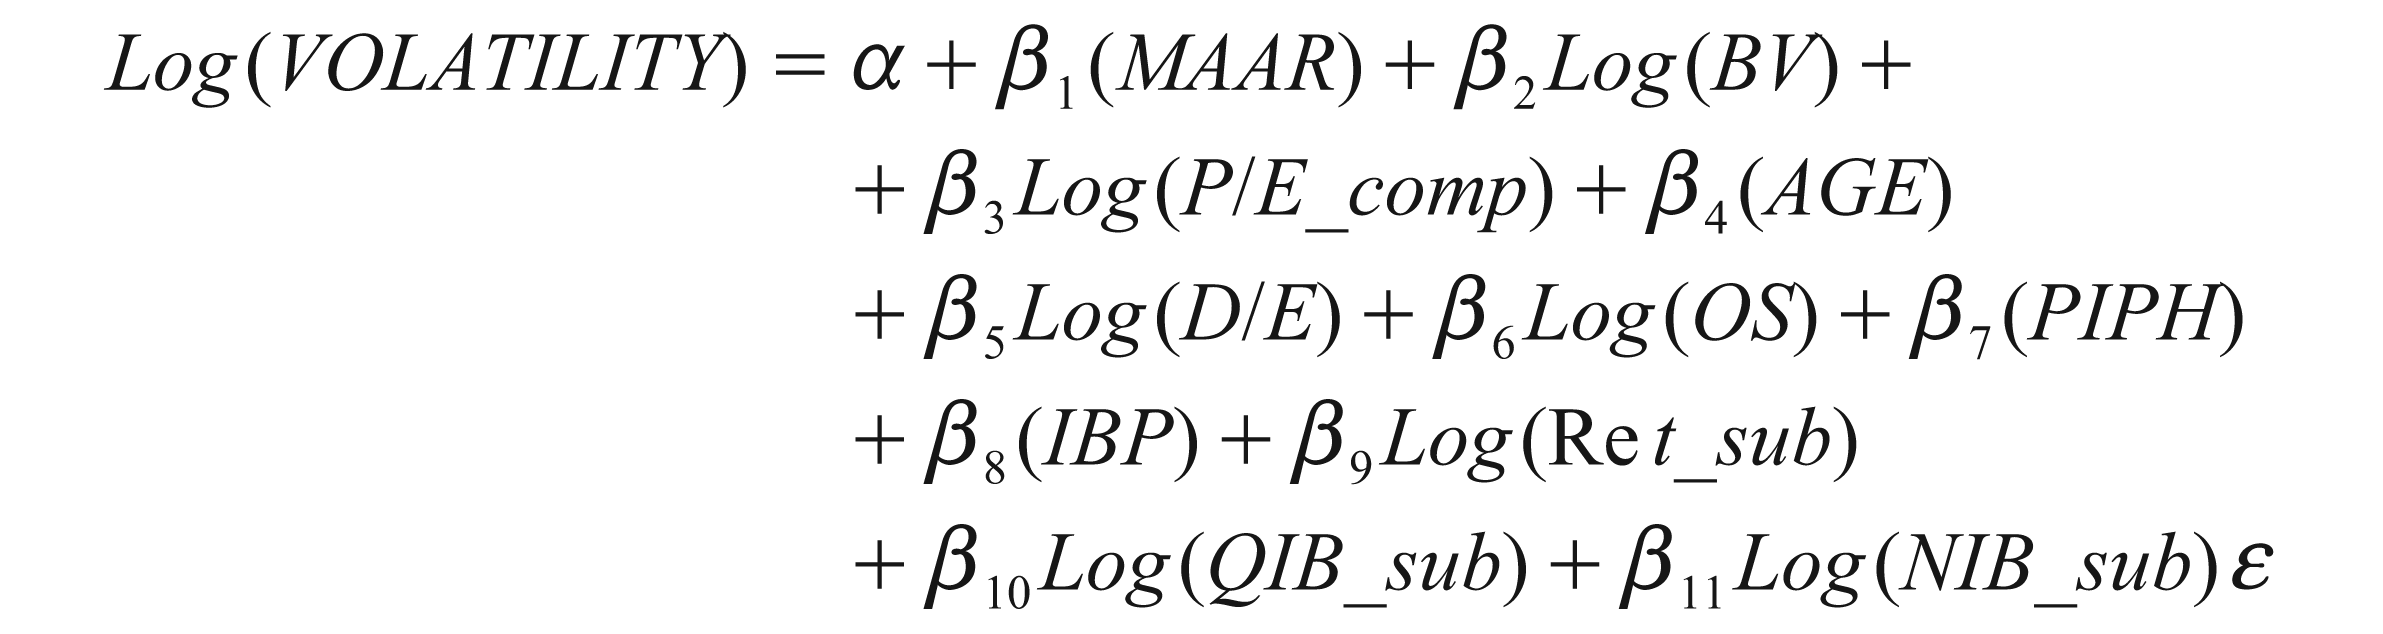
In explaining the aftermarket variability of prices, a regression (Equation 5) was specified using the subscription rate across different investor categories, that is, QIBs, NIBs and Retail individual investors. The underlying hypothesis is whether or not the subscription structure has any significant influence on aftermarket pricing volatility.
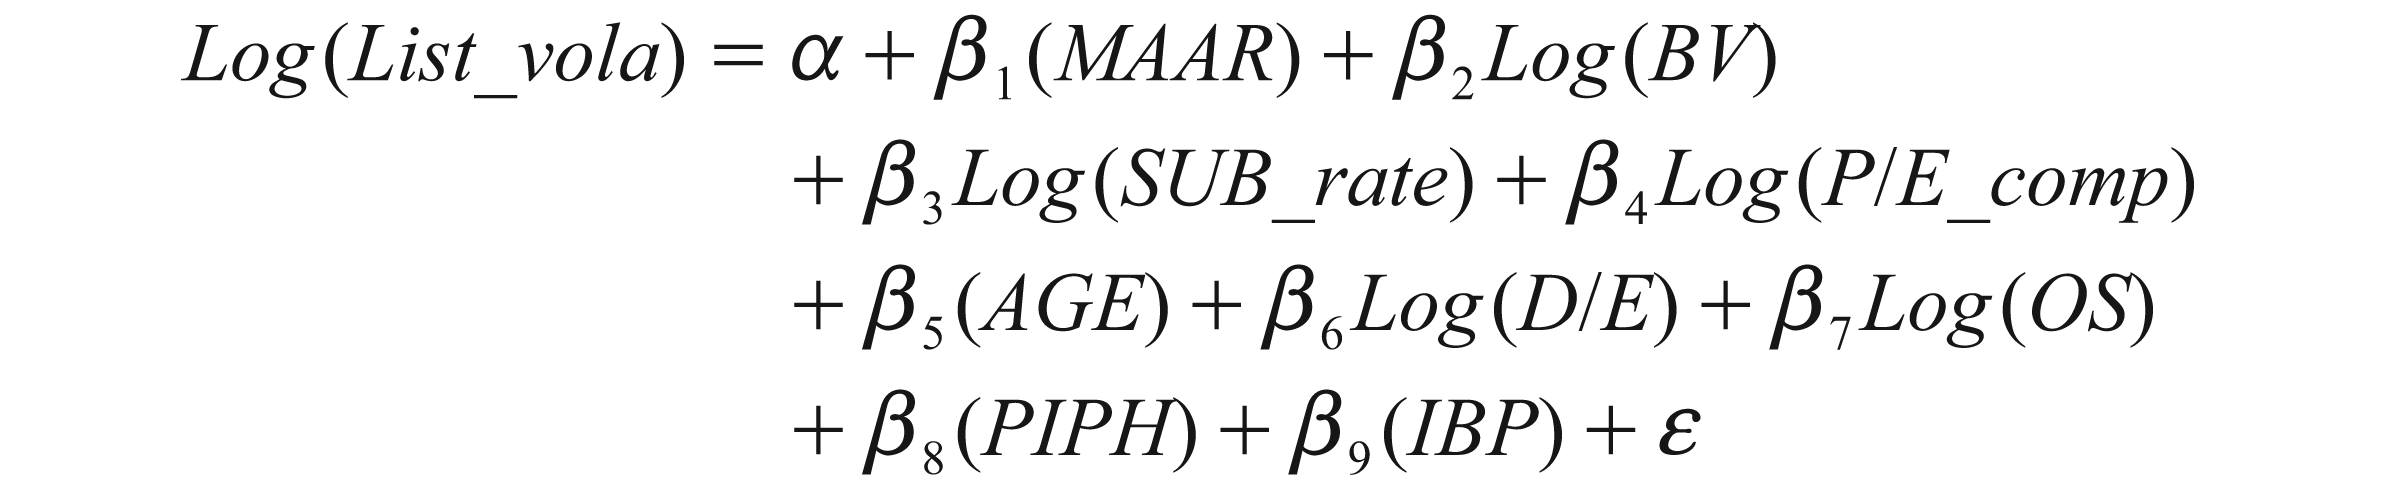
Pre-offering investors demand is related to aftermarket performance (both short run and long term) of the IPOs (Agarwal et al. 2008). High subscription rate for IPOs results in larger unmet demand, that is, more number of subscribers left unallocated. Within the framework of proportionate allotment, unsuccessful investors might create more rush in the initial day to purchase the share from the secondary market, causing larger variations in listing day prices. We perform the following regression to capture the impact of subscription rate on listing day volatility.
Descriptive Statistics
The variable VOLATILITY is used as measure for the variability of IPO stock returns (adjusted with market benchmark) just after the listing. The data for VOLATILITY in Table 6 report a mean value of 18.03 with standard deviation of 23.56. Post-listing variation in adjusted returns varies from 0.07 to 1161.64. The mean volatility for the IPOs on listing day (estimated as the ratio between the difference in high price, low price and the sum of high and low price) is 0.15, while the median List_vola is 0.13.
Descriptive Statistics
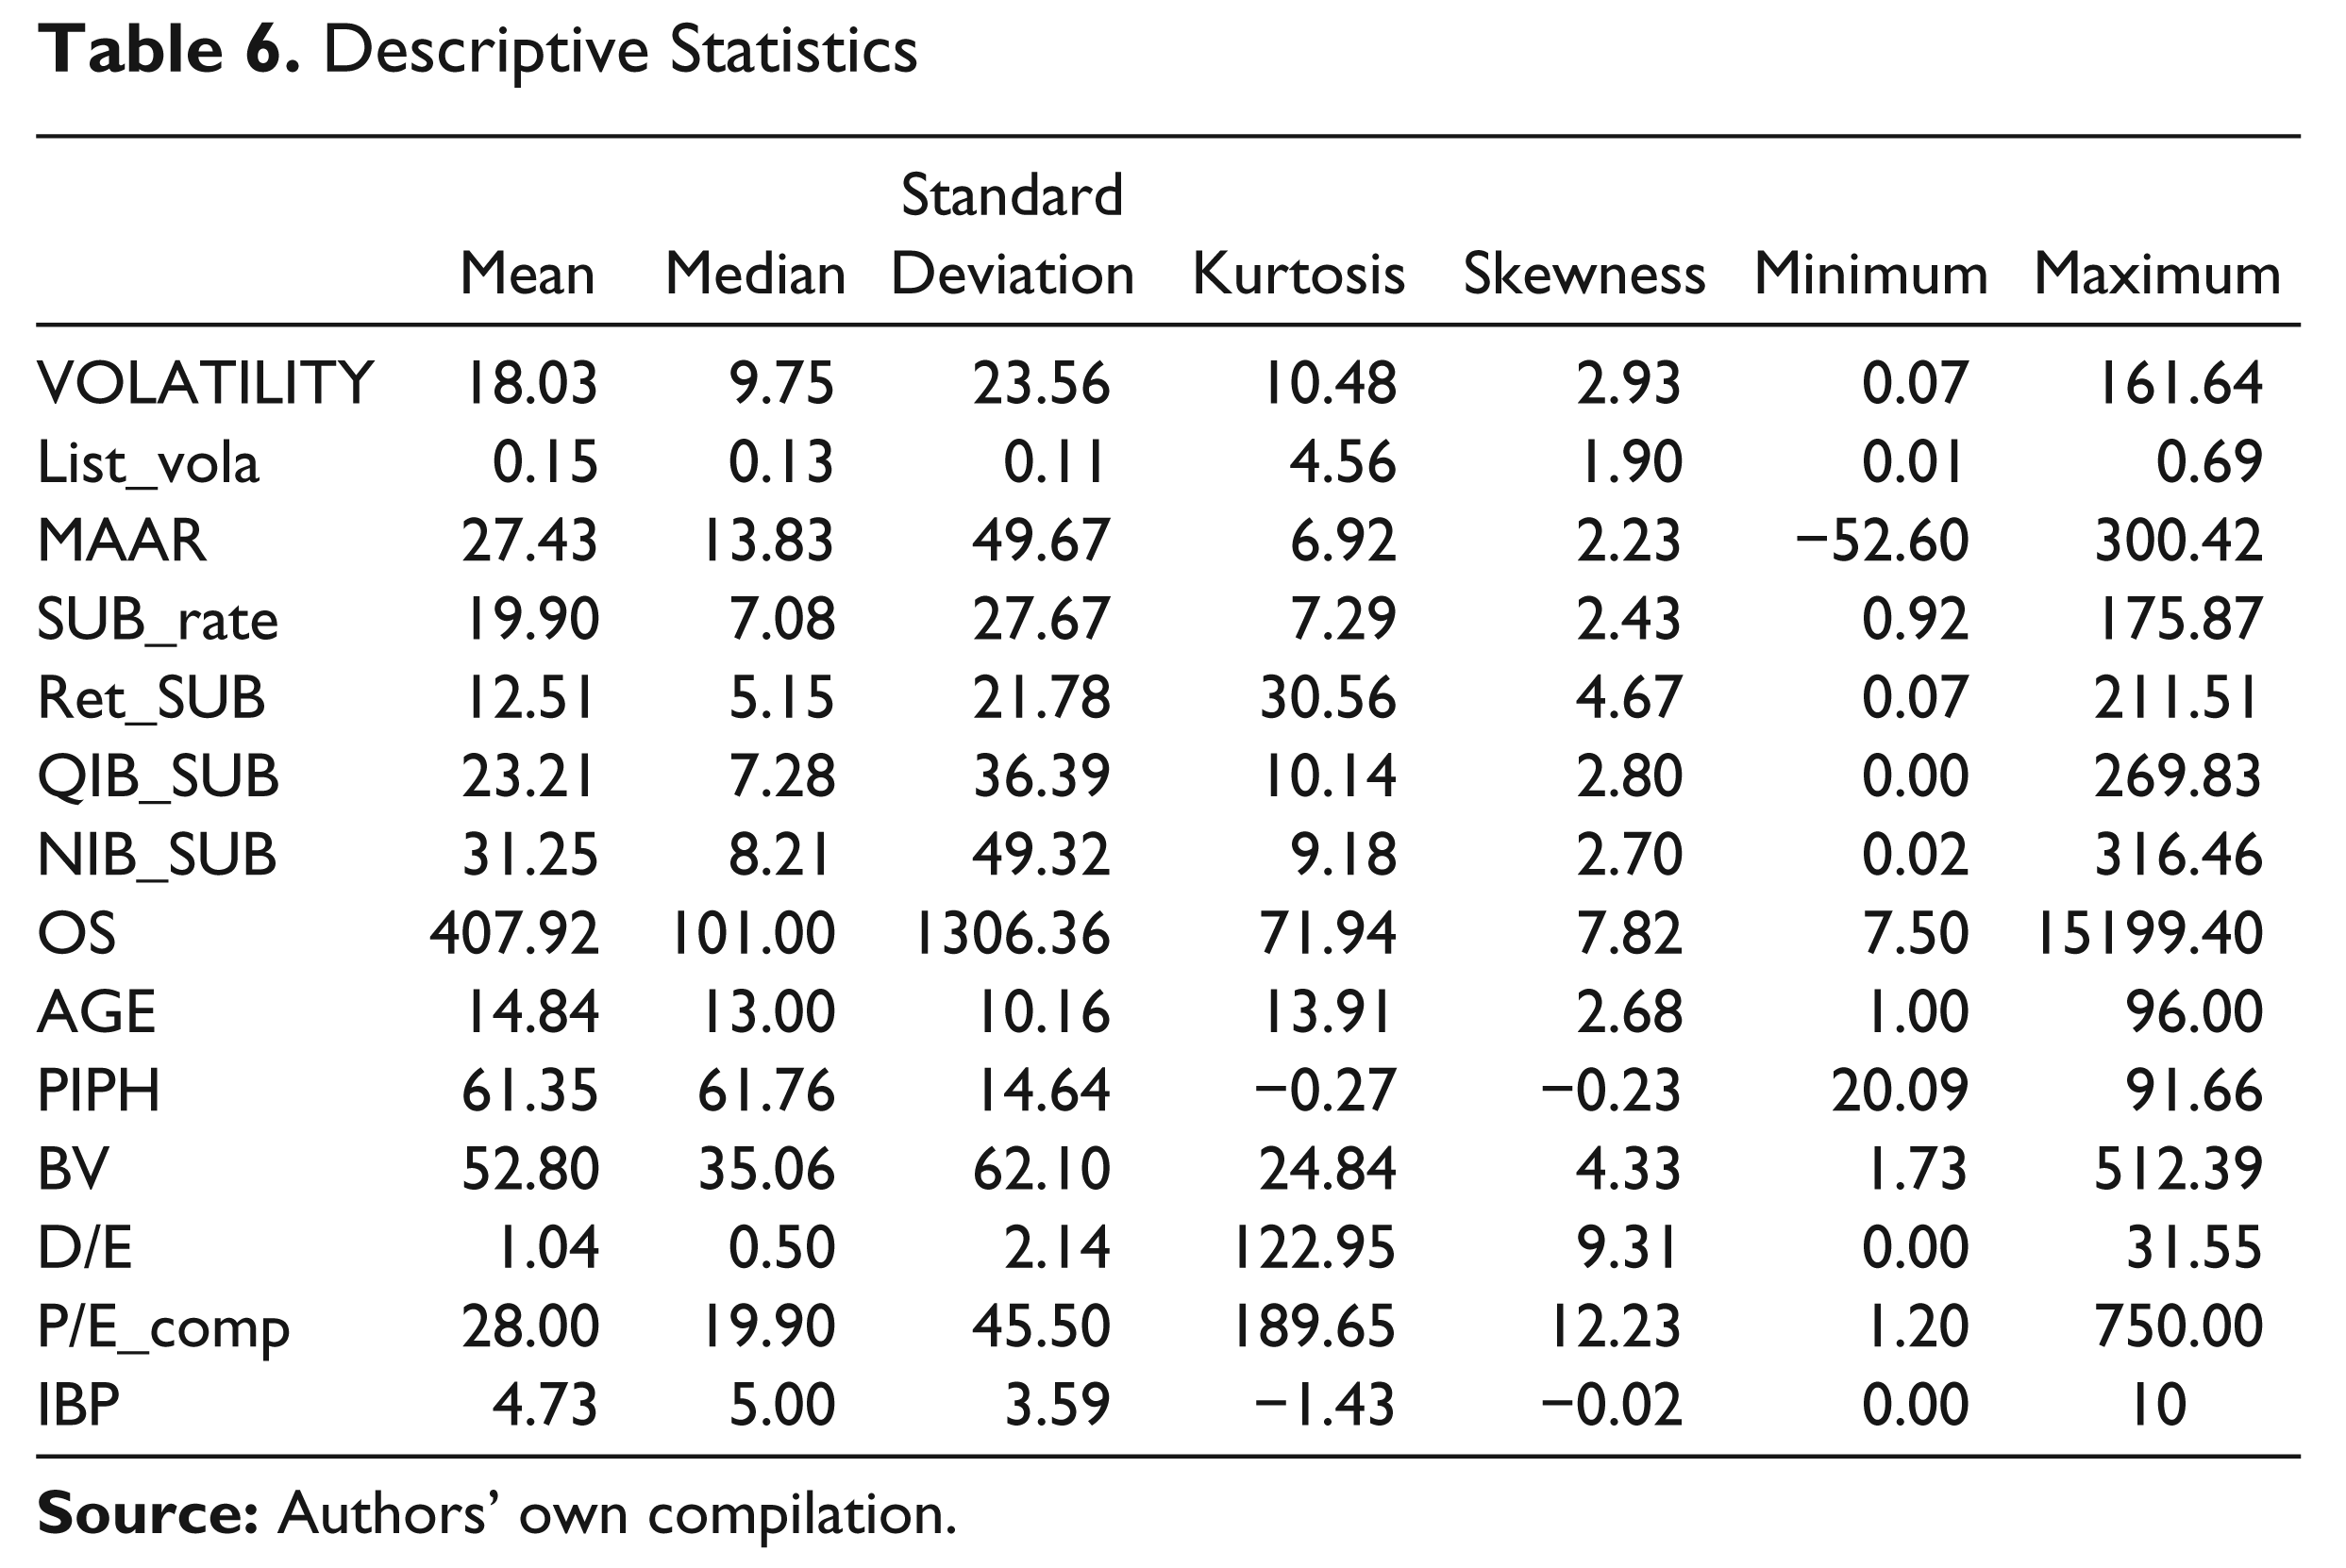
Table 6 summarises firm characteristics for 339 IPOs issued during the period 2002–12. Values for BV are estimated in Indian rupees (INR). VOLATILITY is estimated as standard deviation of excess return of IPO stocks for initial one month from date of listing. The variable List_vola is calculated as the difference between high price and low price scaled by the sum of high price and low price on the date of listing. Both PIPH and MAAR are expressed in percentages. MAAR is estimated by using the formulae at Equation (3). Volatility is evaluated with percentages. Variables including SUB_rate, P/E_comp, and D/E are measured in times. Age for the IPO firm is calculated as the difference between the date of incorporation and date of listing, and measured in years. Offer size (OS) is measured with INR crore, while IBP is estimated as points.
Collectively, sample IPOs generates a MAAR of 24.73 per cent at the listing day, indicating an investor can earn at a rate of 24.73 per cent while subscribing an IPO issue at offer price and sell at listing day close price. Table 6 results further show that IPOs are substantially underpriced during the period. However, underpricing rate is significantly reduced during the period of study than it was documented in the existing studies. Median underpricing value (13.83 per cent) is substantially lower, due to the existence of a sizeable number of overpriced IPOs. We find a total of 98 IPOs are overpriced, while as large as 241 IPOs are underpriced during 2002–12 on comparing the offer price with listing day close price. A larger spread between maximum and minimum values of MAAR confirms the wide spread of fluctuations in initial return. The median value for over subscription rate is 7.08 with a standard deviation of 27.67 times. Mean SUB_rate value is more than the median value indicating large number of issues is subscribed at higher rate. Further, a large difference between maximum and minimum value of SUB_rate along with large standard deviation suggests wide variation in response to the IPOs. A similar pattern for subscription rate is also observed across investor groups, that is, QIBS, NIBs and Retail investors.
The average and median offer size (OS) for IPOs are ₹ 407.92 crore and ₹ 101 crore respectively. It can be noted that the distribution for OS is heavily skewed, as indicated by large differences between mean and median including larger spread between maximum and minimum price. Mean age for Indian IPO firms is 14.74 years. There are 29 firms with an age of more than 30 years and if we exclude these firms from the sample then average age for the firms would be 12.75 years, which is virtually similar to the median age of 13 years. It indicates that the sample IPOs taken for study is uniformly distributed in terms of their operational history.
Average PIPH is 61.35 per cent with a median value of 61.76 per cent. Low values of standard deviation of 14.64 per cent indicate less variation in the dilution of stakes by promoter groups in the post IPO scenario. Pre-IPO promoter groups’ average holding in the firms stands at 82.36 per cent. 7 Hence on an average, the promoter groups dilute 21.01 per cent through IPO. The low percentages of dilution through IPO and holding high percentages of equity in the post-IPO scenario reflect promoter group’s confidence in the IPO firm. The median P/E_comp is 19.90 times (mean value of 28 times), indicating that on an average the issue price of the firm is 19.90 times of EPS that is reported at the time of IPO. The skewness and kurtosis values for the variable find that the variable does not conform to normal distribution. Hence, we use log transformed values in the econometric model.
The debt–equity (D/E) as the ratio of book value of long-term debt to paid-up equity capital of the firm has been used as proxy for financial risk of the firm going public. Pre-issue D/E ratio signals financial risk and hence affects the valuation. Higher is the leverage for the IPO firm; higher is the ex-ante uncertainty in the post listing market (Rasheed et al. 1997). Pre-issue average D/E ratio is 1.04. Book value reflects the fundamental values of the IPOs at the time of issue. Average book value per share is ₹ 52.80, while the median value is ₹ 35.06. Mean values are greater than the median values, suggesting that the book value variable is positively skewed. Investment bank prestige value (IBP) ranges from 0 points to as high as 10 points. The median is 5.00 with standard deviation of 3.59. Result suggests that some issues are sponsored by low profile investment banks; however their number is relatively very low.
Empirical Findings and Discussion
In this section, we present the OLS regression results for the Equations (4), (5), (6) and (7). The first sub-section discusses the regression results for the Equations (4), (5) and (6) indicating the impact of SUB_rate, P/E_comp, PIPH, BV, AGE, D/E, OS, IBP and MAAR on VOLATILITY. Subscription rate across investor categories and aftermarket volatility of IPO stocks is discussed in the next sub-section. The sub-section following that evaluates regression Equation (6), that is, the predictive relationship between subscription rate and volatility after controlling the effects for issue mechanism (IM), pricing and allocation flexibility. Results for subscription rate and listing day volatility are discussed in the fourth sub-section.
Subscription Rate and Aftermarket Volatility
Table 7 shows three sets of results based on regression Equations (4), (5) and (6). Table 7, Panel ‘A’ shows regression results for Equation (4). Panel B and C explain the results for regression Equations (5) and (6), respectively.
Panel ‘A’ (Table 7) results shows that VOLATILITY is significantly influenced by SUB-rate, MAAR, BV, P/E_comp, AGE and PIPH. Other variables like OS, D/E, and IBP do not show any significant relationship with VOLATILITY. Predictors, that is, MAAR, BV, SUB, P/E-comp, PIPH, D/E and IBP are positively associated VOLATILITY. Further, AGE and OS are inversely associated with volatility.
Table 7 reports coefficient estimates and t-values for OLS regressions for VOLATILITY of the IPO firm. The dependent variable, VOLATILITY, is estimated as the standard deviation of excess returns (adjusted with benchmark return) of IPO stocks for initial 20 trading days. Explanatory variables include MAAR, BV, SUB, P/E_comp, AGE, D/E, OS, IBP and PIPH. Sample data comprises of 339 IPO firms went on public during the period 2002–12. Statistical significance for the variables is adjudged on using a two-tailed test at the 1 per cent, 5 per cent and 10 per cent levels. The F-statistic is found significant at the 1 per cent level.
Table 7, Panel ‘A’ provides strong support for the hypothesised relationship between SUB-rate and VOLATILITY, indicating that the rate of demand proved to be relevant in explaining aftermarket price volatility for IPO stocks. Results found is consistent with Reber and Fong (2006) and Vong (2006), which suggests that the larger the subscription rate, larger would be the volatility of the aftermarket price. The rate of subscription as a predictor for volatility shows high level of significance at 5 per cent. A similar kind of association between SUB_rate and unadjusted volatility 8 is also documented, suggesting that the over subscription rate considerably influence aftermarket volatility. Such a high degree of positive association between SUB_rate and VOLATILITY ascribes to the following arguments: First, market reaction to a given IPO is first reflected in an offerings subscription rate and that subscription rate provides sufficient hints as to how the shares will perform in the aftermarket. Second, market feedback hypothesis (Benviste and Spindt 1989) suggests that underwriters deliberately underprice IPOs to induce informed investors to disclose the information. With the framework of a book-building mechanism (having pricing flexibility) an oversubscription rate is a pure signal to the investors that the share is underpriced. Alternatively, when inventors realise ex-ante that the offer price is too low, a large over-demand for the issue is observed. This further motivates the investors to put buy options in the initial days to earn abnormal returns, which creates higher volatility in the aftermarket. Third, heavily subscribed IPOs are generally considered as quality issues having attractive financial fundamentals, that is, good price–earnings ratio, high growth in sales and better potential opportunities. Initial subscribers have higher expectations in terms of better returns in the future. Once this information comes into the market (subscription rate as proxy for quality) in the form of subscription rate new investors also put buying pressure for the IPO stocks, resulting in larger volatility. Finally, a deviation in relation to expectations (that is, elasticity of demand) is likely to create extra volatility in the aftermarket for the IPOs.
OLS Regression for Adjusted Volatility (VOLATILITY)
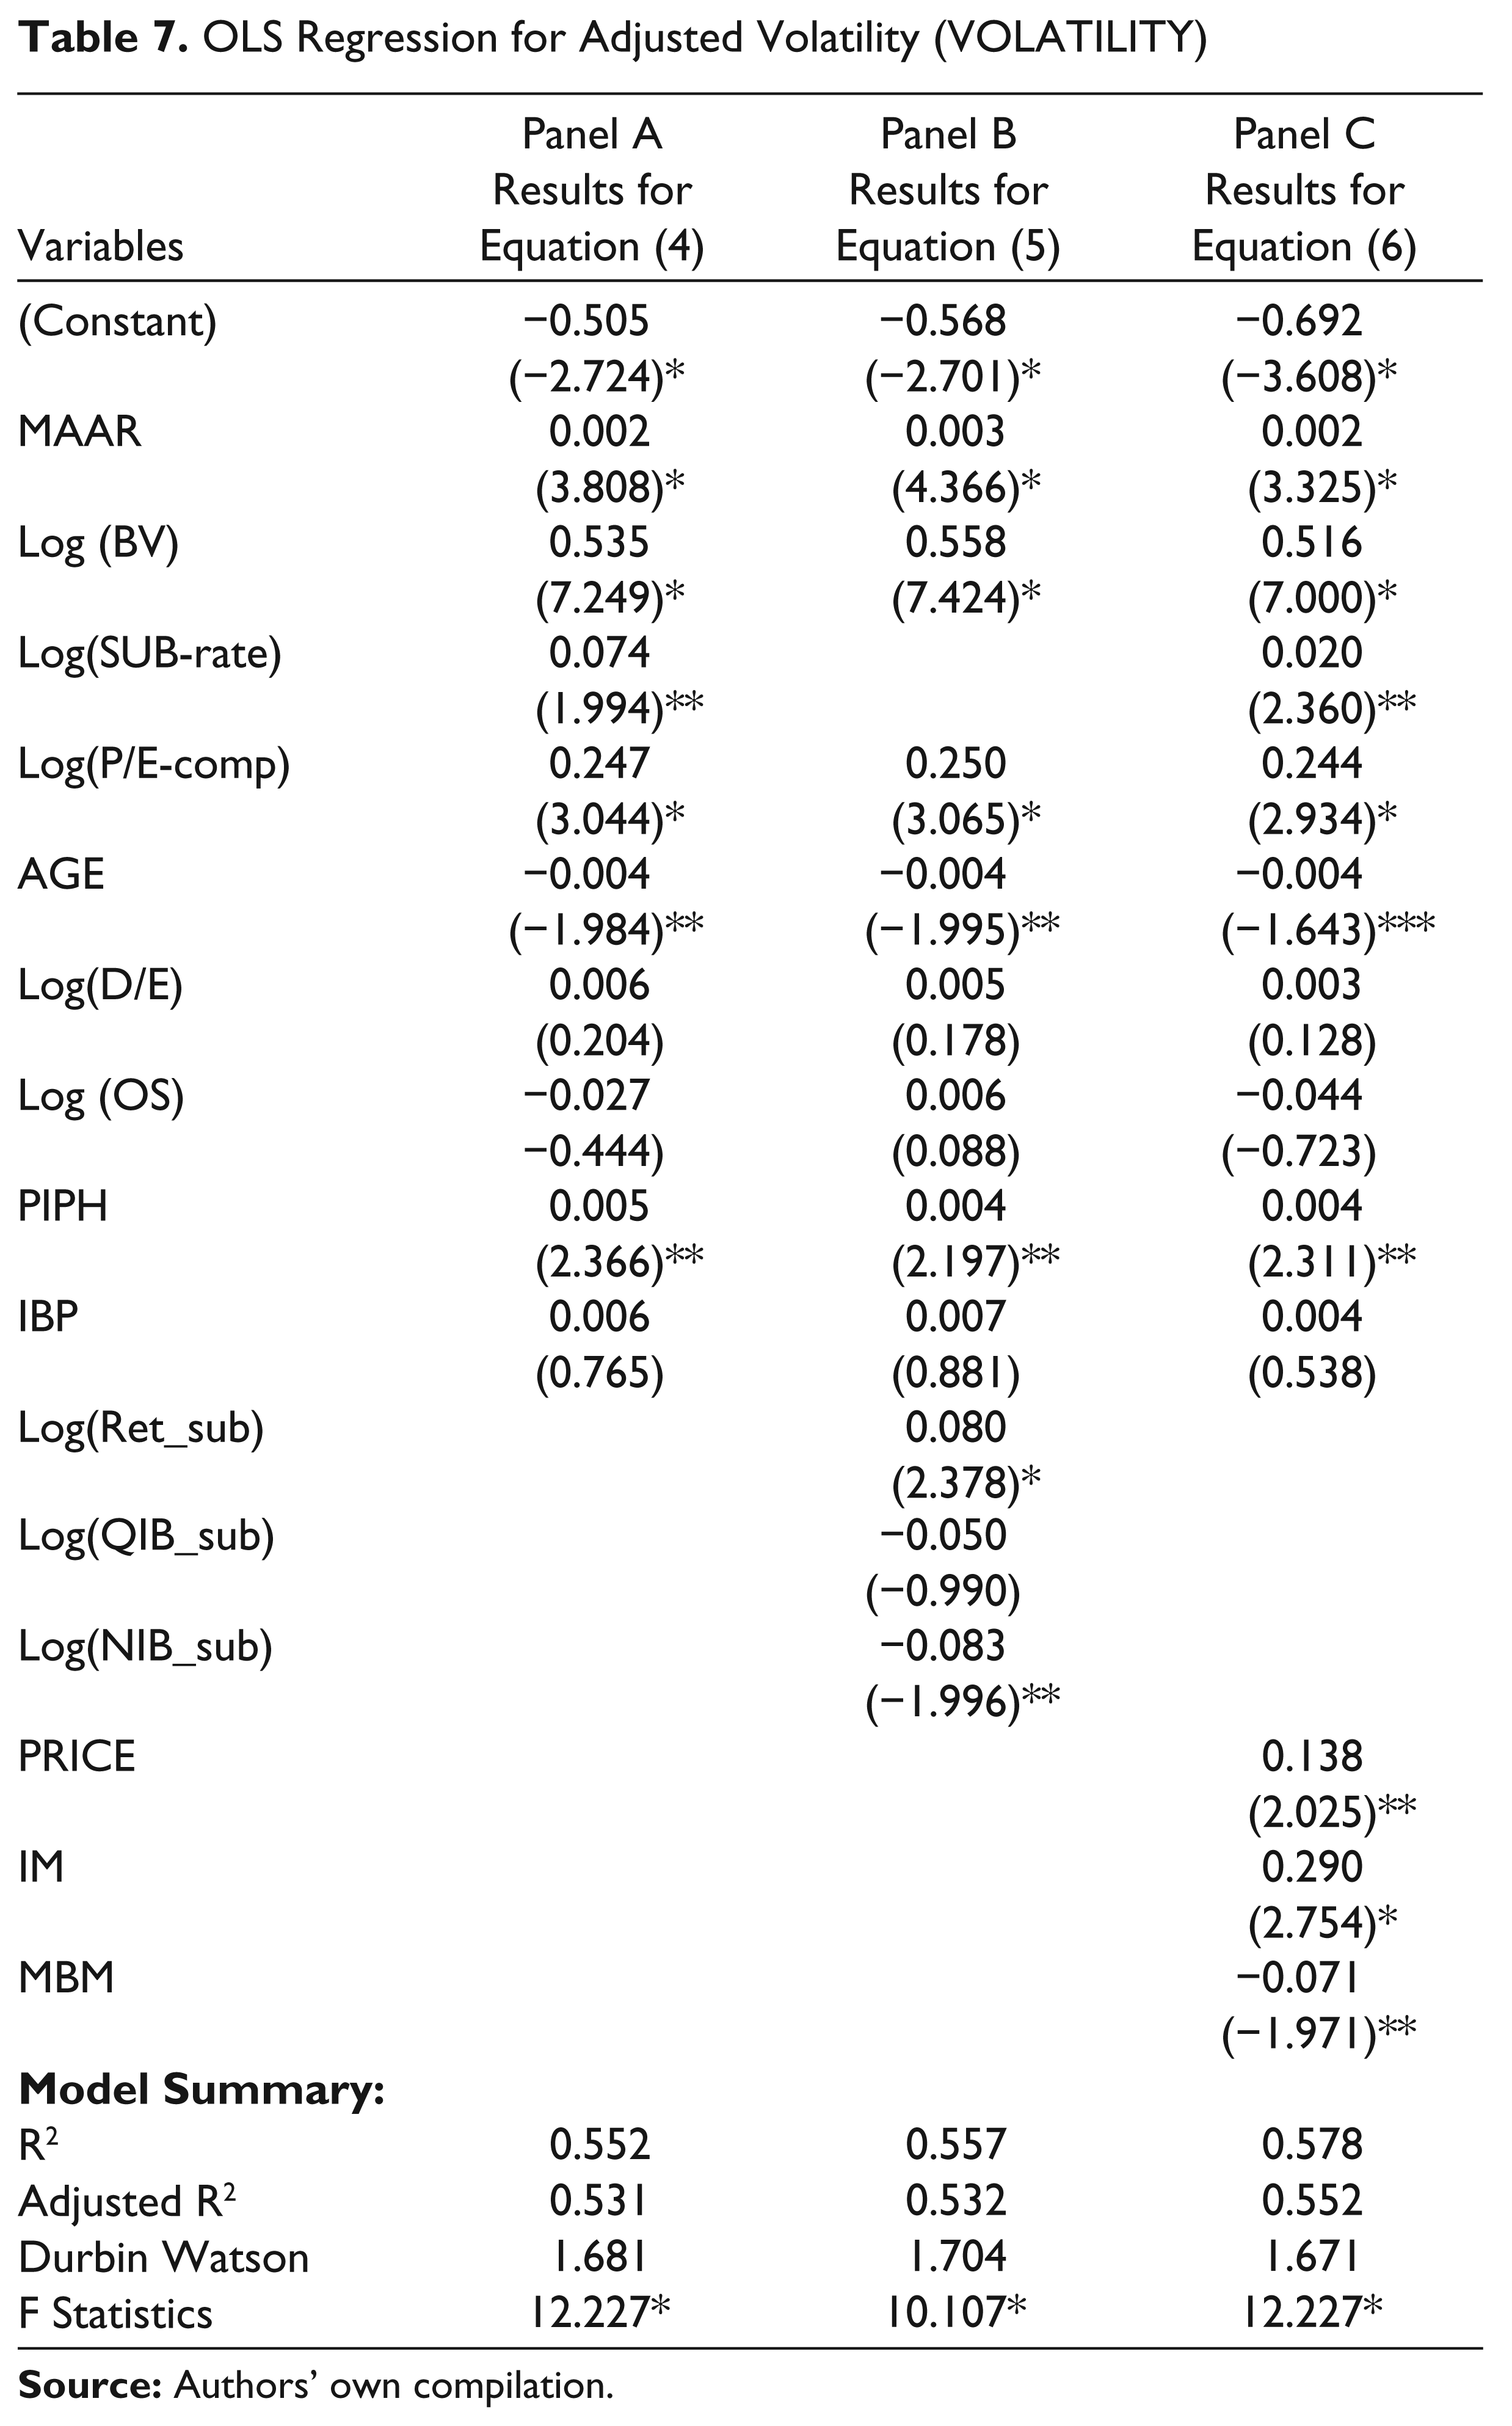
Other notable observation from Table 7, panel ‘A’ is the positive relationship between MAAR and VOLATILITY, consistent with Cassia et al. (2004), Ghosh (2005) and Vong (2006). 9 The underpricing (MAAR) also shows a strong significance at the 1 per cent level indicating a high explanatory power. Positive correlation coefficients for MAAR shows that underpricing and aftermarket volatility are moving in the same direction, that is, IPOs more underpriced report higher volatility. Our findings are in line of the arguments of ex-ante uncertainty hypothesis (Beatty and Ritter 1986; Ritter 1984), that is, underpricing should increase the ex-ante uncertainty about the value of the IPO firm. There are a couple of observations that can be made of this relationship. First, larger underpricing on the listing day results in larger windfall profits for the investors. Second, the observation is that taking advantage of larger underpricing a large number of investors subscribe the issue; therefore, the issue gets oversubscribed many times over. Unsuccessful applicants crowd the market by stepping up the demand and create more volatility. Heavily underpriced IPOs tend to generate more investor interest and so more aftermarket trading. Third, during the high-valued period the investors get over-optimistic about the prospects of the market and hence the market is overcrowded with increasing response from both new and existing investors. This observation seems to provide tremendous opportunity for the investors to earn better returns in the future, which could prompt them to pay more premiums. To further strengthen our argument, we use the PRICE dummy for the IPOs, indicating vertical classification for underpriced and overpriced issues (with reference to listing day). Table 7, Panel C results suggest that underpriced IPOs are more volatile than overpriced issues.
In Panel ‘A’ of Table 7, we find high positive (and significant) correlation between BV and VOLATILITY. Observed positive regression coefficient for BV suggests that the aftermarket volatility would be relatively more for issues having larger book value per share than the IPOs with lesser BV per share. This could be driven by the arguments that BV is used as the proxy for the assets in place by the firm (Aggarwal et al. 2009), and is used as the reference worth for the IPO shares. Consistent with Firth et al. (2008), I find a positive association between P/E_comp and the volatility of the IPO. This indicates that P/E-comp and adjusted volatility are moving in tandem, that is, higher the P/E ratio of the firm at the time of IPO higher is the post-listing price volatility. In other words, high valued IPOs are more volatile than the IPOs with lower P/E. The result can be interpreted that the IPO firms setting the offer price at higher multiple of EPS (reported at the time of IPO) are subsequently report larger pricing risk, because higher P/E multiple indicates higher growth potential in the future. Keeping these arguments both new and unsuccessful investors are motivated to trade these IPO stocks. Hence, larger price fluctuations are reported.
As expected the coefficient of AGE is negative, indicating that the volatility of post-listing prices are inversely associated the size and maturity of the IPO firm. The result is statistically significant at the 5 per cent level, and the sign of relationship is noteworthy. Because age of the firm in itself is showing the maturity of the firm and it might be true that the matured firms expose a lot of information at the time of IPO leaving no scope for any abnormal gain on account of information asymmetry. Further, aged firms are comparatively more stable and established in the market. In addition, OS is also inversely associated with VOLATILITY, indicating larger issues are lesser volatile. Though the result is statistically insignificant but the sign of relationship is noteworthy. Because, larger issues supply a large number of shares and hence creates more liquidity in the market.
In addition, we observe a reasonably strong positive relation between PIPH and VOLATILITY and the result is consistent with theoretical explanation of market microstructure theories (Sarin et al. 2000). That is, increasing the promoter’s retention (post-issue stake) results in more aftermarket volatility for the IPO stocks. The coefficient of relationship between PIPH and aftermarket volatility is highly significant at 5 per cent. A positive association between PIPH and VOLATILITY can be ascribed to the argument that by retaining more equity in the post-issue scenario the promoters group in one way signals quality of the issuing firm and in other way reduce numbers of shares to be floated in the aftermarket. This leads to a greater demand for shares in aftermarket (higher liquidity) and commands higher volatility.
As Table 7, Panel ‘A’ indicates, offer size (OS) does not show significant relationship with volatility of the issue. Though the result is consistent with general concepts but the relationship is statistically non-compelling. However, the sign of relationship supports the argument that larger issues are lesser volatile than the smaller issues, because larger offer offload a large volume of shares in the secondary market. The debt–equity ratio which is used as proxy for financial risk for the firm shows positive influence on the aftermarket price risk. However, the result is statistically insignificant. Finally, reputation effect of investment banks fails to control the volatility of IPO stocks in the secondary market (at least up to the initial one month from the listing day).
The overall model is highly significant with F-statistic 12.227. The adjusted R2 at 0.531 (53.1 per cent) implies that the model explains a large portion, that is, 53.1 per cent of the variability of volatility in the Indian IPO market during the period 2002–12. Variables, that is, MAAR, BV, SUB_rate, P/E_comp are better fit for the actual amount of aftermarket volatility. The collinearity statistics 10 comprising of Tolerance and variance inflation factor (VIF) values for all independent variables are within the acceptable limits, that is, tolerance values of more than 0.19, and VIF values of less than 5.3 are documented for each independent variable. Further the conditional index (CI) values are reported at less than 30, indicating the absence of multi-collinearity. The Durbin–Watson statistics value is estimated at 1.681, which is close to 2.0 (and substantially higher than 1.0), showing no evidence of autocorrelation. Homoskedasticity assumption is also tested through the Levene’s test using SPSS. The significance result for homogeneity of variance for the variables are greater than 0.05, which shows that the error variance of the dependent variable is equal across the groups. Hence, no heteroskedasticity is observed for the variables.
Subscription Rate across Investor Category and Aftermarket Volatility
Rock (1986) pioneered the concept of information asymmetry hypothesis and establishes the relationship between demand and aftermarket performance (initial day return). His model is based on the argument that the investors in the IPO market are horizontally split into two different categories, that is, informed (that is, institutional investors) and non-informed investors (that is, retail individual investors). Informed investors 11 generally subscribe for the quality IPOs only, while non informed investors apply indiscriminately. As a result, non-informed investors get punished by getting maximum allocation in bad-quality IPOs and get less allocation in qualitative issues, because of over-demand from informed investors. To ensure the participation of non-informed investors the issuer company underprices the IPOs, so that an assured return could be provisioned for them. Hence, it can be argued that rate of subscription can be used as a valuable signal for the investors regarding possible initial-day return. In principle, Rock’s winners curse assumes horizontal information asymmetry among the different groups of investors, which leads to IPO underpricing. More recently, Khurshed et al. (2008) document that the retail and non-institutional investors are learning from the lead of more sophisticated institutional investors (QIBs) while subscribing to the IPOs. On using regression model they find the predictors for retail subscription include QIBs demand, age of the firm, issue size, investment bank prestige and NIBs subscription rate. They also find that the transparency in the book-building process helps in resolving the information asymmetry between informed and uninformed investors. Further they argued that the unmet demands of the non-institutional investor groups are significantly influencing the IPO underpricing. Positive relationship between underpricing and subscription rate is also documented by Falconieri et al. (2009), Kenourgios et al. (2007) and Sohail and Nasr (2007).
Taking a cue from the above literature, we run the regression (Equation (5)) to evaluate volatility of IPO stocks across the oversubscription rate for different investor groups. Market adjusted volatility (VOLATILITY) is regressed with respect to subscription rate of retail individual investors (Retail), qualified institutional buyers (QIBs) and non-institutional buyers (NIBs) along with other controlling variables, that is, MAAR, BV, P/E_comp, AGE, D/E, OS, IBP and PIPH. Table 7, Panel ‘B’ shows the regression results (Equation (5)). A notable observation is that the variables, that is, MAAR, BV, P/E_comp, AGE, D/E, OS, IBP and PIPH witnessed identical relationships (also statistically significant) with VOLATILITY in line with the results as documented in Panel ‘A’. This indicates there is no significant departure in the results while using subscription rate of investor categories in place of total subscription rate.
As expected, both QIB-sub and NIB-sub rate bears a negative association with volatility, indicating IPOs subscribed more by informed investors (that is, QIBs and NIBS) are less volatile. Though the result is statistically insignificant (for QIB-sub) but the sign has interesting observation, suggesting that the wider participation of institutional investors in the primary market provide sufficient indication more stability in the aftermarket prices for the IPOs. There might be a couple of reasons behind this: First, due to superior knowledge institutional investors are associated with quality issues. Second, institutional investors are better equipped with analytical and pricing mechanism techniques, hence discount those IPOs having larger price differentials, that is, the difference between intrinsic value and offer price. In this way, institutional investor helps in reducing underpricing and subsequent price volatility.
Other notable observations from Table 7, Panel ‘B’ indicate that coefficient associated with Ret-sub has a positive sign. This indicates that the extent of VOLATILITY is directly related to the retail investor’s oversubscription rate, that is, higher aftermarket volatility for the IPOs getting more oversubscription from retail investors. Variable Ret_sub shows a strong significance at 1 per cent, indicating high explanatory power. There are a few observations that can be made of this relationship. First, retail investor has limited knowledge in understanding and predicting the potential market performance for the IPOs. Second, retail investors have lesser quota for allotment 12 in comparison with institutional investors, resulting in unsuccessful retail investors (those who failed to get an allotment) rushing to purchase shares from the secondary market. Third, generally retail investors are greedy for underpriced IPOs, and hence tempted to continue in creating more demand resulting in higher volatility.
Issue Mechanism and Aftermarket Volatility
Book building dominates most of the new issue markets into which it was introduced (Jagannathan et al. 2009). Indian regulation provides the liberty of issuing IPOs either through book building or fixed price mechanism. However, recent practice finds that in India fixed price offering seems to be less favourable method compared to book building. Several papers find that book building requires a lower discount than fixed offer (for example, Benveniste and Wilhelm 1990; Benveniste and Busaba 1997; Biais and Faugeron-Crouzet 2002). Contrary to the popular perception, Kucukkocaoglu (2008) studied 217 IPOs issued on the Istanbul Stock Exchange, Turkey (during 1993–2005) and finds that the first day underpricing for book-building IPOs are higher than the fixed-price offer. To document the impact of the issue mechanism (IM) on aftermarket volatility, we use a dummy variable of 1 if the offering is a book-building offer, and 0 for the fixed-price issues. Our sample comprises of 26 fixed price offers and 313 book-building offers.
Table 7, Panel C results appear to suggest that book-building offers are relatively more volatile than fixed price offers. IM shows a strong significance at 1 per cent indicating a high explanatory power. There are a couple of observations that can be made of this relationship. First, book building is more popular in India and due to higher transparency (than fixed-price offers) attract larger participation from the investors. Second, larger participation of investors create more liquidity in the market. Third, inconsistent with the international evidence (that is, Kucukkocaoglu 2008), we find book-building issues are lesser underpriced than fixed price-issues in India during the sample period (2002–12). 13 Anticipating higher returns, investors might crowd IPOs during subscription and even continued in the initial trading days.
Modified Book-building Mechanism and Aftermarket Volatility
The Indian IPO market currently (post-November 2005) practices a different version of book building, where the underwriters no more enjoy the discretion in allocation of shares. However, the earlier practice grants both pricing and allocation flexibility to the IPO managers. Our study draws IPOs from both periods, which motivate to understand the impact of the change in book-building methods on aftermarket volatility. Our sample consists of 138 IPOs, which are issued during April 2002 to November, 2005, and 201 IPOs issued during December 2005 to March 2012. Bubna and Prabhala (2011) compared the pricing performance of the IPOs across two different forms of book building (that is, one with allocation discretion and other without allocation discretion). However, their study is limited to initial-day performance only. For this part of the analysis, we follow Bubna and Prabhala (2011), and assume that IPOs are lesser volatile, when underwriters loses control over allocation, that is, IPOs issued in the recent format of book building are relatively more consistent in price performance than the IPOs issued before November 2005.
Table 7, Panel C shows that modified version of book building helps in controlling aftermarket volatility. The coefficient associated with MBM has a negative sign. This indicates that IPOs issued after November 2005 (through modified book building) are less volatile than the IPOs issued before November 2005. Variable MBM shows a strong significance at 5 per cent, indicating a high explanatory power. This could be attributed to the argument that book-built IPOs are less underpriced after the elimination of allocation powers. Our sample data estimate an average underpricing of 21.85 per cent for IPOs where issue managers have allocation control, which is significantly lower than the average underpricing of 35.55 per cent for IPOs issued before November 2005 (with underwriters have control on allocation).
Subscription Rate and Listing-day Volatility
Table 8 shows the regression results for Equation (7). Variables including MAAR, SUB_rate, P/E-comp and OS are significant in evaluating volatility of the IPO stocks on listing day. However, BV, AGE, D/E, PIPH and IBP are insignificant in explaining listing volatility. Further, variables AGE, D/E, OS, PIPH and IBP are inversely associated with listing-day volatility, while a positive correlation coefficient is observed for SUB-rate, MAAR, BV and P/E-comp.
OLS Regression for List_vola as Dependent Variable
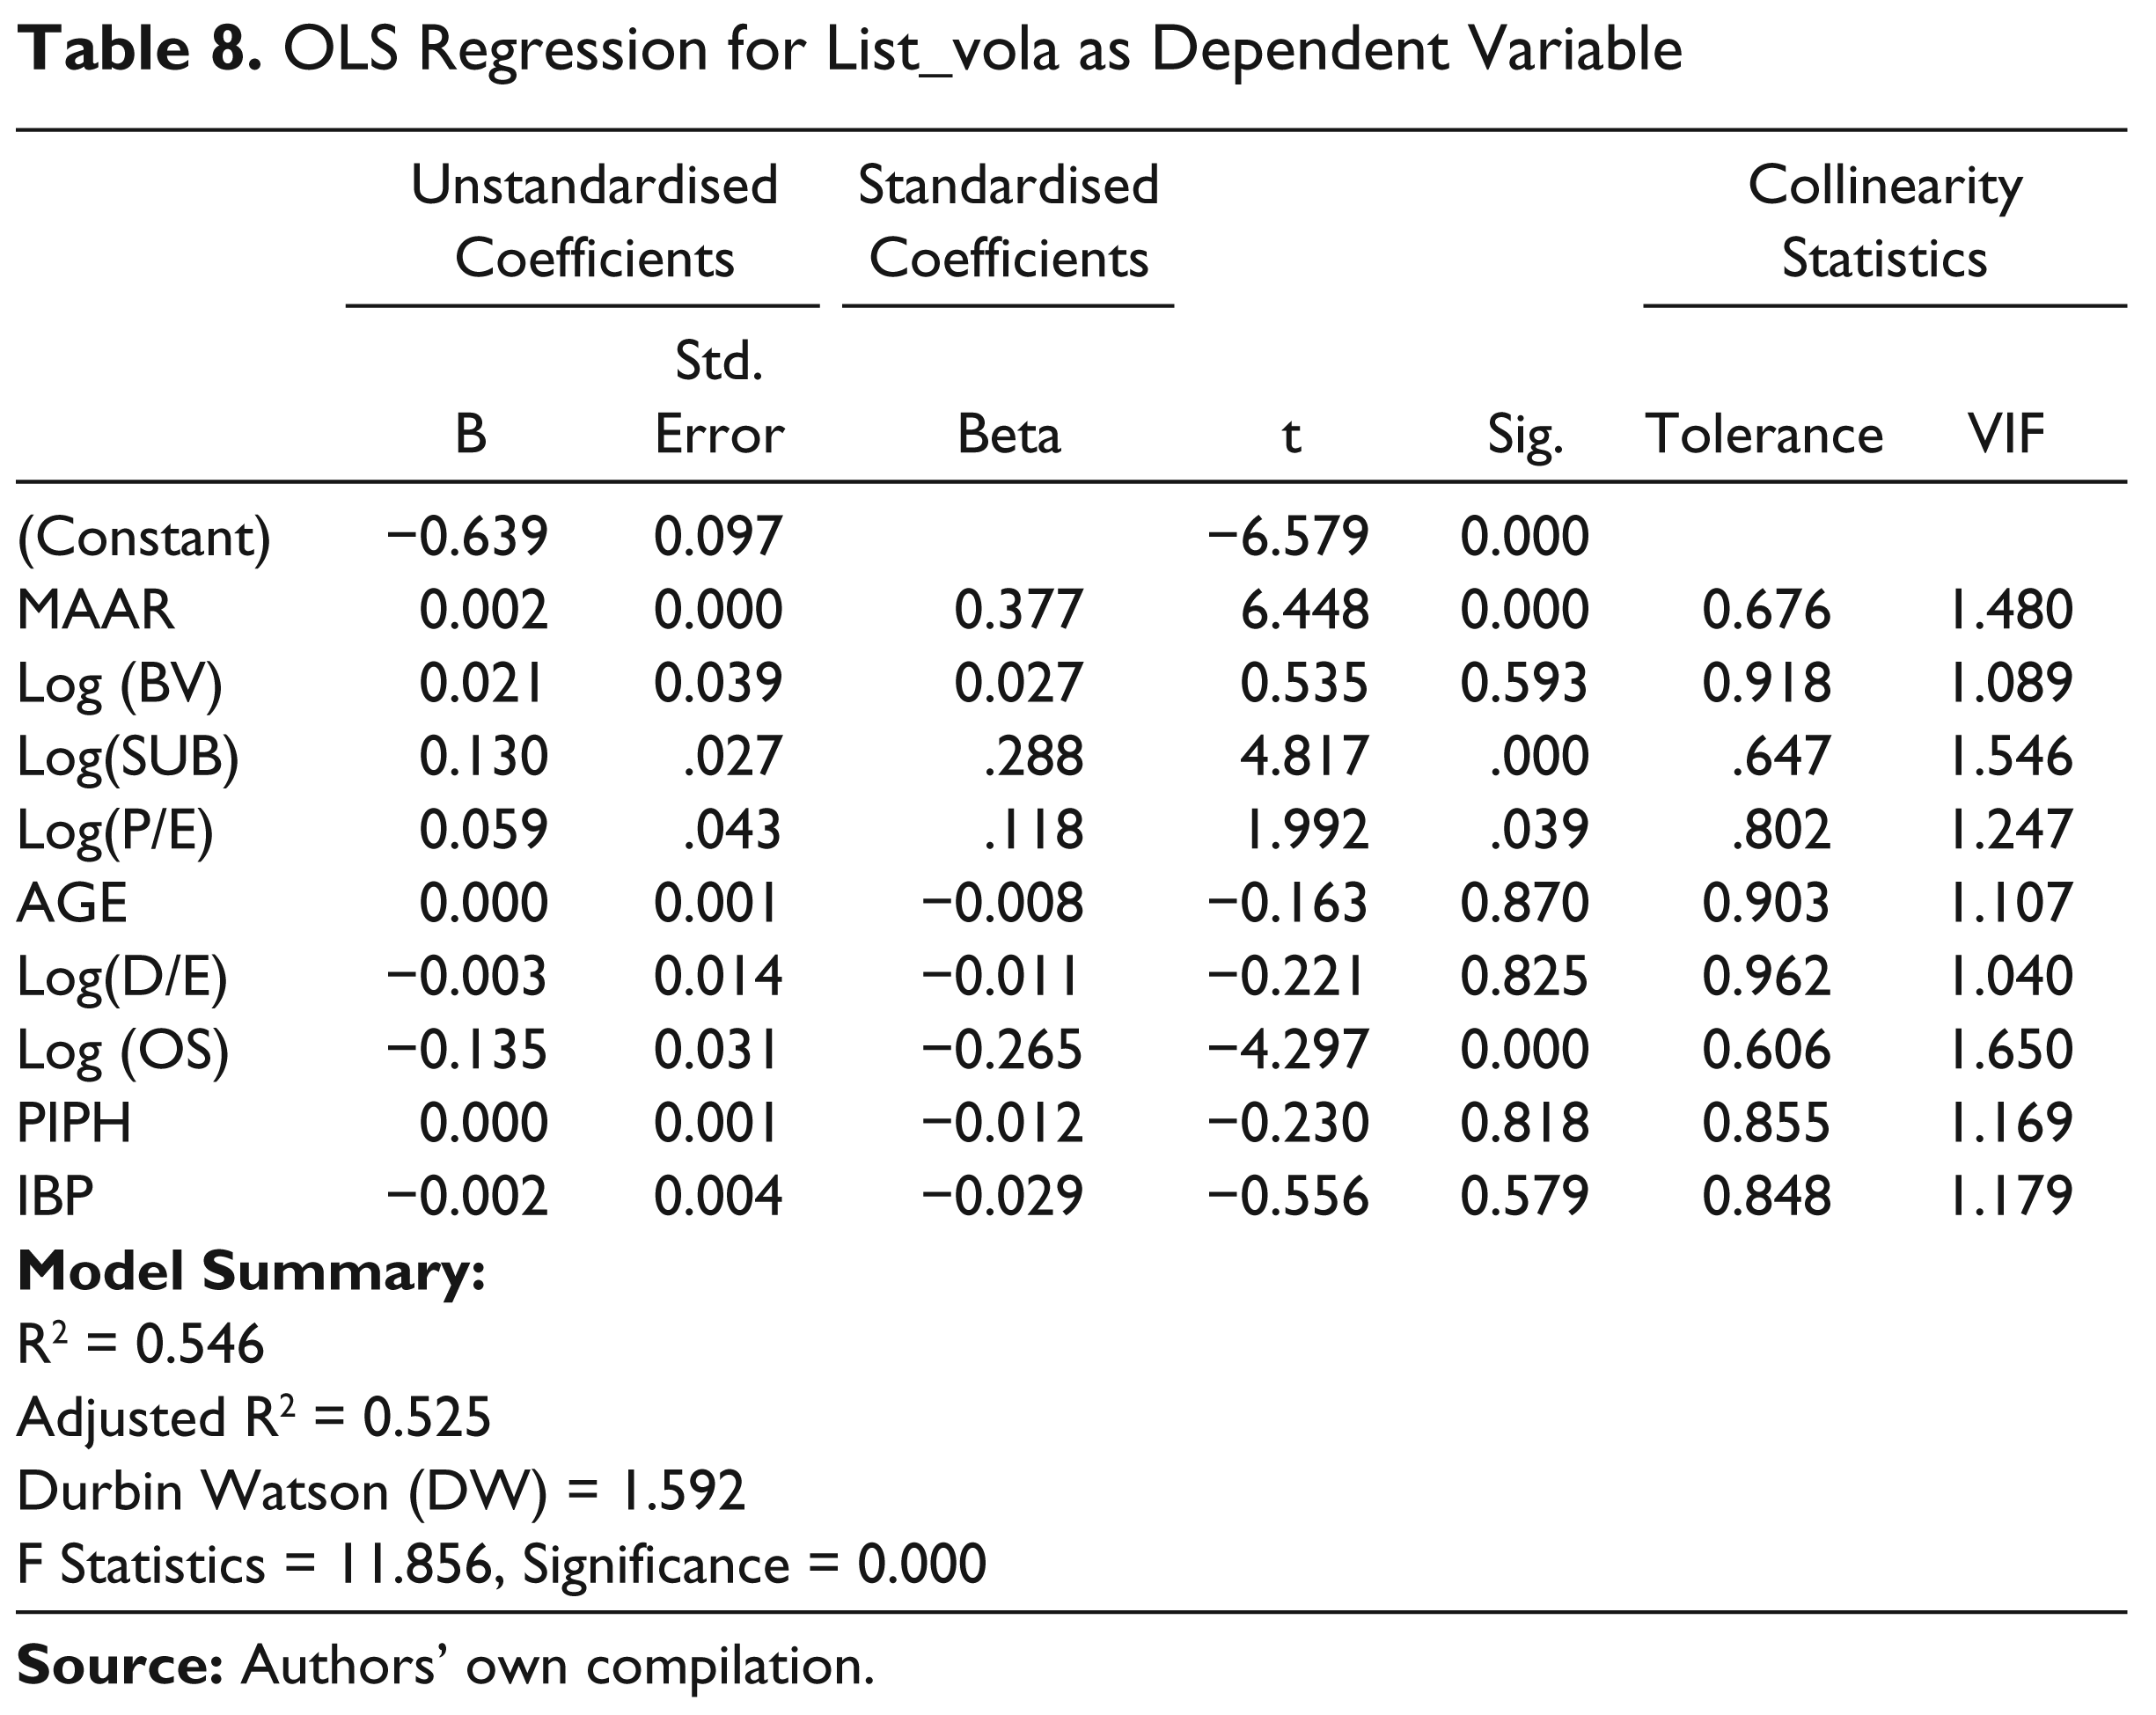
Table 8 reports coefficient estimates and t-values for OLS regressions for listing day volatility of the IPO stocks. The dependent variable list_vola is estimated as the difference between high price and low price scaled by the sum of high price and low price. Explanatory variables include MAAR, BV, SUB_rate, P/E_comp, AGE, D/E, OS, IBP and PIPH. Sample data comprises of 339 IPO firms went on public during the period 2002–2012. Statistical significance for the variable is adjudged on using a two-tailed test at the 1 per cent, 5 per cent and 10 per cent levels. The F statistic is found significant at 1 per cent level.
As expected, Table 8 indicates that the coefficient associated with subscription rate is positive. This indicates that higher the IPOs are subscribed the more is the listing day volatility. The SUB_rate shows a strong significance at 1 per cent indicating higher explanatory power. There are a couple of observations that can be made of this relationship. First, larger subscription rate for an IPO increasingly compete with a more number of unsuccessful applicants. These unsuccessful applicants rushed into the listing day for purchasing the shares. Second, high subscription rate is used as an indication of better quality for the issue. Third, a possible implication is that the more underpriced issues are subscribed more than the overpriced IPOs and hence have increasing profit potential. Similar to the volatility of the IPO price model as in Equation (4) in Table 7, Panel ‘A’, this model (Equation (7)) also shows a positive correlation between underpricing (MAAR) and listing-day volatility. Even in all forms of volatility (that is, market-adjusted), we find underpricing has a strong association with volatility, that is, significant at the 1 per cent level. Further in line with the results documented in Table 7, Panel A, we find P/E-comp is positively related with listing day volatility. IPO firms issued with higher P/E are more volatile than the IPOs issued with lower P/E. Surprisingly, as Table 8 indicates, BV does not show a significant correlation with listing-day volatility. The t statistics of 0.535, and the significance level of 0.593 associated to BV are both weak. However, even though insignificant, the result shows the sign of BV is positive, indicating larger volatility (on listing) for high net worth IPO stocks. It is to be noted that BV shows a strong significant (positive) association with aftermarket VOLATILITY (as shown in Table 7).
The other notable observation from Table 8 is the high negative correlation of listing day volatility to offer size. This indicates that larger issues are lesser volatile on listing day. In other words, lesser price variations on the initial day are documented for larger offerings. This is because small size issues are more speculative than large size issues (Beatty and Ritter 1986) and command more underpricing. Further, because of larger offer value, a large number of shares are floated, which helps in reducing unmet demand level and hence lesser trading activities might be observed on listing day. The t statistics (−4.297) and the significance level (0.000) associated with the variable OS is statistically compelling at 1 per cent. However, the strength of association between OS and aftermarket volatility is found weak (though negative) as noticed in Table 7, suggesting that offer size has a limited effect on the volatility of IPO prices. As expected, Table 8 indicates that the coefficient of the variables, that is, AGE, IBP, PIPH and D/E have negative signs. This suggests that matured firms (with higher D/E) sponsored by reputed investment banks are less volatile on listing day. Surprisingly, signalling variables, that is, AGE, IBP, D/E and PIPH bear a negative coefficient (with respect to listing-day volatility) but proved insignificant.
Conclusion
Book building is the predominant mechanism for issuing IPOs in India, though the issuing firm has the choice for selecting either a book-building or fixed-price mechanism. The book-building mechanism in India is relatively more transparent and informative than the practice being followed in USA and other developed economies. In particular, all bids are legally binding in India, while in USA and other European markets the bids are only an indication of interest. With such an environment, oversubscription rate plays a crucial role in indicating the potential listing gain and aftermarket price behaviour. Using a data base of 172 IPOs issued during 2002–12, we find that subscription rate is significant and positive in explaining post listing price volatility (both listing day and post-listing period up to initial one month of trading). In other words, highly subscribed IPOs are relatively more volatile than lesser subscribed issues. Further, market-adjusted volatility (that is, excess volatility) is significantly influenced by the rate at which IPOs are subscribed. More precisely, IPO prices (both listing and post listing) respond subscription rate in more aggressive way. Hence, subscription rate can be used as an effective signal of precariousness for the IPO price behaviour in the secondary market. Besides, this study also documents that underpricing cause aftermarket volatility in a positive way. Similarly, Book value per share, price–earning ratio at the time of issue, and post-issue porter retention are positively associated with volatility.
Analysis of the demand structure across investor categories reveals that larger retail subscription for an IPO cause more volatility for the aftermarket prices. We find that favourable demand from NIBs (other than retail) helps in reducing volatility for IPO stocks. In addition we suggest that book-building offers are relatively more volatile than fixed price offers. Finally, our examination on listing day volatility, we document that oversubscription rate is positively influencing the price variability on listing day. However, larger offers are less volatile than the smaller issues. Further, IPOs having more initial day return are likely to be more volatile in the listing day. Variables, that is, investment bank prestige, post issue promoter retention, age of the firm and debt–equity ratio at the time of issue proved insignificant in explaining volatility on initial day, though these variables show negative coefficients with volatility.
The relationship between subscription rate on IPO price volatility that we track in this study, have significant implications for all participants in the IPO market, that is, issuing firm, investment banks and investors. Extending the existing studies on signalling hypothesis, this article strongly advocates the usefulness of subscription rate as an effective signal for evaluating both listing and post-listing price variability for the IPO stocks. Further, the outcome can be used by the market participants in general and retail investors in particular to understand the potential fluctuations in the prices. More importantly, this research would helpful for the investment banks to comprehend that they are going to sponsor an IPO that have what kind of aftermarket price risk. Finally, the empirical relationship documented between subscription rate and listing day volatility would act as an important signal for the initial day traders regarding potential range of price variation on listing.