
Abstract
This article attempts to empirically investigate the relationship of social embeddedness and banking behaviour in India. Social embeddedness is a construct that in general refers to non-market societies or activities, such as customs, traditions and reciprocity, that dominate the conduct of societies. Using the India Human Development Survey (IHDS) 2005 household survey data, we construct a weighted average score of social embedding as captured by memberships in societies and network groups to estimate their impact on the likelihood of a household’s access to banking. Findings show that social embeddedness has a positive and substantial impact on improving a household’s access to banking. We argue that social embedding can serve as an effective means to enhance the reach and access of financial services if conventional inclusion programmes were to utilize and exploit such social channels.
Introduction
In this article, we empirically investigate the influence of social embeddedness on banking behaviour in rural India. Embeddedness is a social construct which in general refers to non-market-based societies, and also broadly to social and cultural obligations imposed by non-institutional factors on economic activities (Polanyi, 1944). Social embedding is also a peculiar feature of rural or even urban societies where associations and presence of customs, traditions and reciprocity dominate the structure and conduct of the economy. In contrast, contemporary modern societies operate at different levels of financial integration through various formal settings, such as banking channels, electronic transactions and numerous other financial products. Given a diverse societal structure, this presents a wide contrast in banking habits among people and arguably also leads to a different level of financial integration in the economy.
To bridge this gap, contemporary initiatives, such as financial inclusion, have been used as means to reach the underprivileged and excluded sections of the society. One of their central premises is to bring such societies into the mainstream world of financial and economic services. This is of major significance in countries such as India where financial inclusion has been a major concern in the recent years and also continues to be pursued as a policy agenda (see, for instance, Chakrabarty, 2011; Mohan, 2006). In pursuing such goals, several studies have argued that access to financial instruments, such as banking services and investment options, lead to a better quality of life, especially for the poor and disadvantaged (see Beck, Demirgüç-Kunt, & Honohan, 2009; Benhabib & Spiegel, 2000; Thorat, 2007). Although financial inclusion is a broader concept than simply having access to banking services, a precursor to extensive financial reach is to bring the unbanked population in the formal banking channel. Inclusion is often referred to as a primary requirement which enables access to banking and other services, such as savings, insurance, mortgages and pensions among others. Thus, even the absence of a primary service such as a bank account is considered as one of the major indicators of financial exclusion (Reynolds, 2003; Thorat, 2007).
In the ongoing process of financial inclusion, difficulties of reaching, convincing and delivering banking services continue to pose difficulties for policy makers (see, for instance, Collard, 2007; Dev, 2006; Germain, 2001, among others). With varying degrees of experience on successes and failures, financial exclusion in general can be classified in two broad categories: (i) exclusion due to unavailability, that is, access, and (ii) self-exclusion (Kempson, Atkinson, & Pilley, 2004). The latter is due to the lack of trust and understanding of the financial instruments and services. Conventionally, one of the means to overcome the lack of trust is through community networks and social circles. Acquaintances and network effects are believed to amplify the passing of information to peers and other connected people, thus potentially enhancing the chances of adopting or accepting newer practices (Granovetter, 2005). One may possibly argue that the deeper and more embedded a household is in social networks, greater are the chances of the household using financial services or for that matter any service as information and experience about them are transferred through interactions.
On this premise, we explore the relation of social embedding and banking habits in the Indian context. This relation pushes for a relook as several prevailing socio-economic conditions and levels of social embedding can be explored due to which people either are left out or are self-excluded from financial services. These conditions, in turn, relate fundamentally to their banking habits in the form of socio-economic status, access variables and information availability. This also suggests that contrary to universal financial inclusion programmes which are standardized in approach, a renewed approach may be better to reach people based on different forms of social embedding. In what follows, we build our analysis by investigating the probability that whether or not a household has banking access given the various settings of social embedding. In the second section, we review and describe the various contexts of social embedding and its constructs. Since social embedding is a latent construct, empirically isolating the effect of networks and group memberships remains a difficult task. As several factors operate at the household level, obtaining a measure of embedding and its overall unbiased impact poses considerable empirical limitations. In order to construct an aggregate measure of social embedding, we first develop a score for each household to ascertain how socially embedded a household is, and subsequently use that as a predictor for banking access. In the third section, we describe the data, method and the empirical strategy and in the fourth section, the results are presented. The fifth section concludes with a discussion on some policy implications.
Background and Reviews
Social embedding as a construct relates to the extent to which any economic activity is constrained by non-institutional activities. Polanyi (1944) is often credited to have advanced this concept where he argued that in non-market societies, there are no pure economic transactions or institutional mechanisms. Such societies are guided by mutual exchange, traditions and reciprocity of transactions. Thus, the impact of social relations, traditions and affiliations plays a significant role in determining the structure and conduct of the society. The extent of such relations is also directly and indirectly visible. In general, communities often form groups which enable people to collaborate, affiliate and participate in various activities ranging from religious, festivals to business connections. These groups and memberships provide a platform for exchange of information, experience and to connect to a wider audience with diverse socio-economic features. Such relations or memberships provide access to newer resources and avenues to adopt new practices in all aspects of life.
The extent and impact of social embedding have been matters of diverse research. Previous research has looked into the effect of social relations in financial transactions and information transfers. Research also supports the idea that there is an inevitable mixing of social and economic relations. Granovetter (1985), Portes and Sensenbrenner (1993), Fuller (1998) and Uzzi (1999) describe social embeddedness as a framework to show how social structure affects the financial markets. Adler and Kwon (2002) argue that it is one of the many similar constructs, such as social exchange, social support, relational contracts or even inter-firm networks. These can then be put under an umbrella concept of social capital. Moody and White (2003) describe embeddedness in relation to actors who are integrated in dense clusters or multiplex relations of social networks, who face different sets of resources and constraints than those without such linkages. Guiso, Sapienza and Zingales (2008) investigate the effect of social capital as measured by voting behaviour and blood donation on usage of financial instruments, such as cheques and investments in stocks.
The significance of social embeddedness in the process of financial inclusion has also been hinted by many studies. In the Indian context, despite several initiatives taken by the government and the Reserve Bank of India (RBI) (see Mohan, 2006), financial institutions have not been able to increase the access to a large segment of the population to its potential. Mahadeva (2008) suggests four possible reasons for this, namely: (i) limited number of players, (ii) the absence of well-defined goals and missions for financial institutions (iii) limiting the thrust to priority sectors, such as agriculture and allied activities and (iv) missing links and coordination between financial institutions and local bodies, including self-help groups (SHGs). These local bodies can work as a pressure group and help to form better linkages between people and financial institutions. In the process, they can also mobilise household resources and social capital and can equally help in providing other regulatory framework for financial institutions.
Based on the description of social embedding from diverse perspectives, the central theme of embedding is the linkage that emerges from being part of a community or group or in its different forms of associations. Such associations in particular can limit several economic or financial transactions to a considerable extent as customs or reciprocity dominate the structure and conduct of the society. Thus, many conventional financial products and services may remain unutilised as the occasion to use them hardly ever arises. This leads to a large section of self-excluded people who do not enter into the mainstream conventional financial system. Alongside this, constraints on access, lack of awareness and mistrust add to the difficulty of adopting these services. It thus points to a larger question of the impact of such social embedding on an individual’s or household’s access to and adoption of contemporary services. We can formally explore this linkage, provided one is able to contextualise social embedding and its constructs. Exploring this linkage can provide useful insights and an impact assessment based on different levels of social embedding can also be investigated. In doing so, it would also overcome an empirical challenge since most such linkages are unobservable and hence latent constructs.
To build on this proposition, in the next section, we first attempt to construct an aggregate score of social embedding at the household level and then use it as a predictor along with other relevant covariates to estimate the likelihood of access to banking. The model, empirical strategy and data are outlined as follows.
Model and Empirical Strategy
Description
As described earlier, we use social embeddedness as a variable to investigate how it may affect a household’s chances of having access to banking services. Since embeddedness is a latent construct, we use the number and type of social connections of the household to serve as proxy variables, which are observable. However, this proxy does not provide much information about the quality of the relation of the construct but only sufficiently serves the purpose by capturing the number of channels through which private resources and private information can be transferred. In the present context, it might mean the information and motivations transferred through linkages, such as acquaintances and memberships in social networks, which might make it easier and convincing for the households to avail banking services.
As a construct, the extent of social embeddedness is captured through (i) acquaintances in the medical and government community and (ii) membership in social networks such as women’s associations, trade unions, religious and festival groups, business/unions, caste associations, credit, SHGs, sports union, development or NGOs and voting behaviour. These are observable as participation or as membership in such groups and capture the extent to which a household may be connected. The data on these variables are described subsequently. Further, to determine the choice of the right covariates which may have an independent effect on household’s access to banking services, we sketch a simple model to link these other variables.
Specifically, let the probability Pi of the ith household availing banking services be represented by a set of variables, namely,

where φi captures a set of household characteristics, Bi captures access or an availability measure of banking resources to the household, Ii captures the access to information regarding banking resources and banking services and Mi captures other characteristics such as motivations or trust of the household towards banking.
Access to banking resources for the ith household can be modelled as a function of the distance to the nearest bank branch, di, and other village characteristics, for example, electrification or quality of roads (θi). Thus, Bi = g(di, θi). Access to information can come from media sources, such as newspapers, television, radio or the Internet. These can be taken as a measure or as a suitable proxy for media exposure, that is, MEi. Media as a source of information or its quality is more or less equally available to most households, once we control for household and environmental characteristics. However, the overall information (Ii) available or shared amongst acquaintances through social networks is dependent on the private information available (PIi) and the social embeddedness of the household (SEi). Thus, the information availability can be specified as Ii = h(MEi, PIi).
Similarly, the motivation and trust towards the financial system (Mi) can be modelled as a function of trust in banks (TBi) and motivations and coercions through linkages and social networks (MSi). Thus, Mi = n(TBi, MSi). Further, since most of these variables are directly unobservable or non-measurable, both personal information (PIi) and motivations through social networks (MSi) can be modelled as functions of suitable proxies for social embeddedness (SEi). Thus, PIi = n(SEi) and MSi = o(SEi). Finally, the above relations translate into the following functional relationships thereby giving a general framework for empirical modelling.
Combining the relations, we have

Making the substitutions for the other relations, we have

And further simplifying by making the last substitution, we obtain

Thus, the final expression which can be estimated using a suitable functional form F(.) can be written as

where N is the number of observations.
Social Embedding
The second issue is to provide a measure for the nature of social embedding. Among several constructs available for measuring social embedding, the requirement is to arrive at a measure that reflects an aggregate measure of a household’s association or embedding. Most other studies have considered determinants of such embedding, or in other words, the probability of an individual being embedded in various social settings. Therefore, for such studies, social embedding is a dependent variable, rather than an explanatory variable. Rooks et al. (2000) in their study capture social embedding through measures of repeated exchanges between partners (temporal embeddedness), and relations with third parties, such as firms and social institutions that allow for credible agreements and commitments (network embeddedness). Breton-Miller and Miller (2009) look at dimensions of social embeddedness such as networks of interpersonal relations within which exchanges take place, calling it as structural embeddedness. Another type of social embedding is of a psychological nature which captures the extent of similarities in representations, interpretations and meanings (cognitive embeddedness), while an alternate dimension looks at the distribution of power between actors (political embeddedness). Uzzi (1999) looks at embeddedness through the social capital between actors (relational embeddedness) and the ability of the network to synthesise synergies and benefits (structural embeddedness). Ethnographic studies such as the one by Uzzi and Gillespie (1999) categorised embeddedness as a ‘relationship duration’, its multiplicity and also the network size.
For our purpose, we use a variant of an aggregate measure of social embedding, since our primary objective is to construct it as an explanatory variable. We consider a finite number of social networks (Sj) of which a household can be a member. Thus, the response to each such network is a ‘no’ or ‘yes’ denoted by a binary relation [0, 1], respectively. Given the number of households, we then compute the frequency of each social network to find the number of households as members for that particular social network. Subsequently, we divide the frequency of each social network by the sum total of all social networks to get the relative ‘weight’ of each network in the overall available social network. Thus, the weight of the jth (j = 1,…, J) network, which is part of the total number of (J) networks, is given by

The next step is to use these weights to arrive at an aggregate measure of social embedding at the household level. Thus, for each household (i), we multiply each response [0 or 1] with the respective weight of the social network and sum to arrive at a final score of social embedding. This implies the final score for each household (i) on being member in (J) social networks is

where wj is the weight and Rj is the household’s response to the corresponding membership in the group. This construct of using weights allows us to have a different valuation or relative strength or depth of association for a social network. Analytically, embeddedness can be partitioned into a quality component, referring to the type and depth of relationship and a numerical component, referring to the number of linkages. This weighted average in a way captures both these aspects to signify the relative ‘depth’ of an individual household’s social embedding (see Appendices A–C for details).
Using our score on social embedding, in order to estimate its relation with banking access, we first use a linear probability model (LPM) to get a baseline result of how controlling for several individual household-level characteristics affects the probability of its banking access. We subsequently augment the model with more elaborate set-ups to check the consistency of the results. Before we proceed to the estimation, we describe our data and variables of interest below.
Data
The data set used for the empirical analysis is the unit-level data compiled by the Indian Human Development Survey (IHDS) 2005 round. This data set has a wide coverage of all Indian households with a variety of socio-economic indicators. From the data, the primary measures of social embeddedness are acquaintance measures (binary measures of each) with members of the (i) women’s association, (ii) sports union, (iii) SHGs, (iv) religious societies, (v) caste and cooperative societies, (vi) voting in elections and (vii) attending public meetings among others. Network and access to resources are captured by the presence of societies and organisations in the place of residence, such as medical, government services, cooperative societies, development groups or NGOs. Other variables of interest are whether or not the family has a bank account, household-level literacy, income, residential status and other general socio-economic characteristics. These are described in further detail subsequently.
Variables and Hypothesis
Table 1 presents the statistics of the main membership and network variables used in the analysis. This includes societies or membership groups on which responses were obtained from individuals. The responses were coded as binary, that is, ‘yes’ (1) or ‘no’ (0). We tabulate the average percentage of individuals in each group and network affiliations to denote the extent of participation in each group. The figures suggest a relatively high percentage of association with government and medical services as compared to a fairly low association in case of other societal groups.
Average Percentage Membership of Individuals in Social Groups
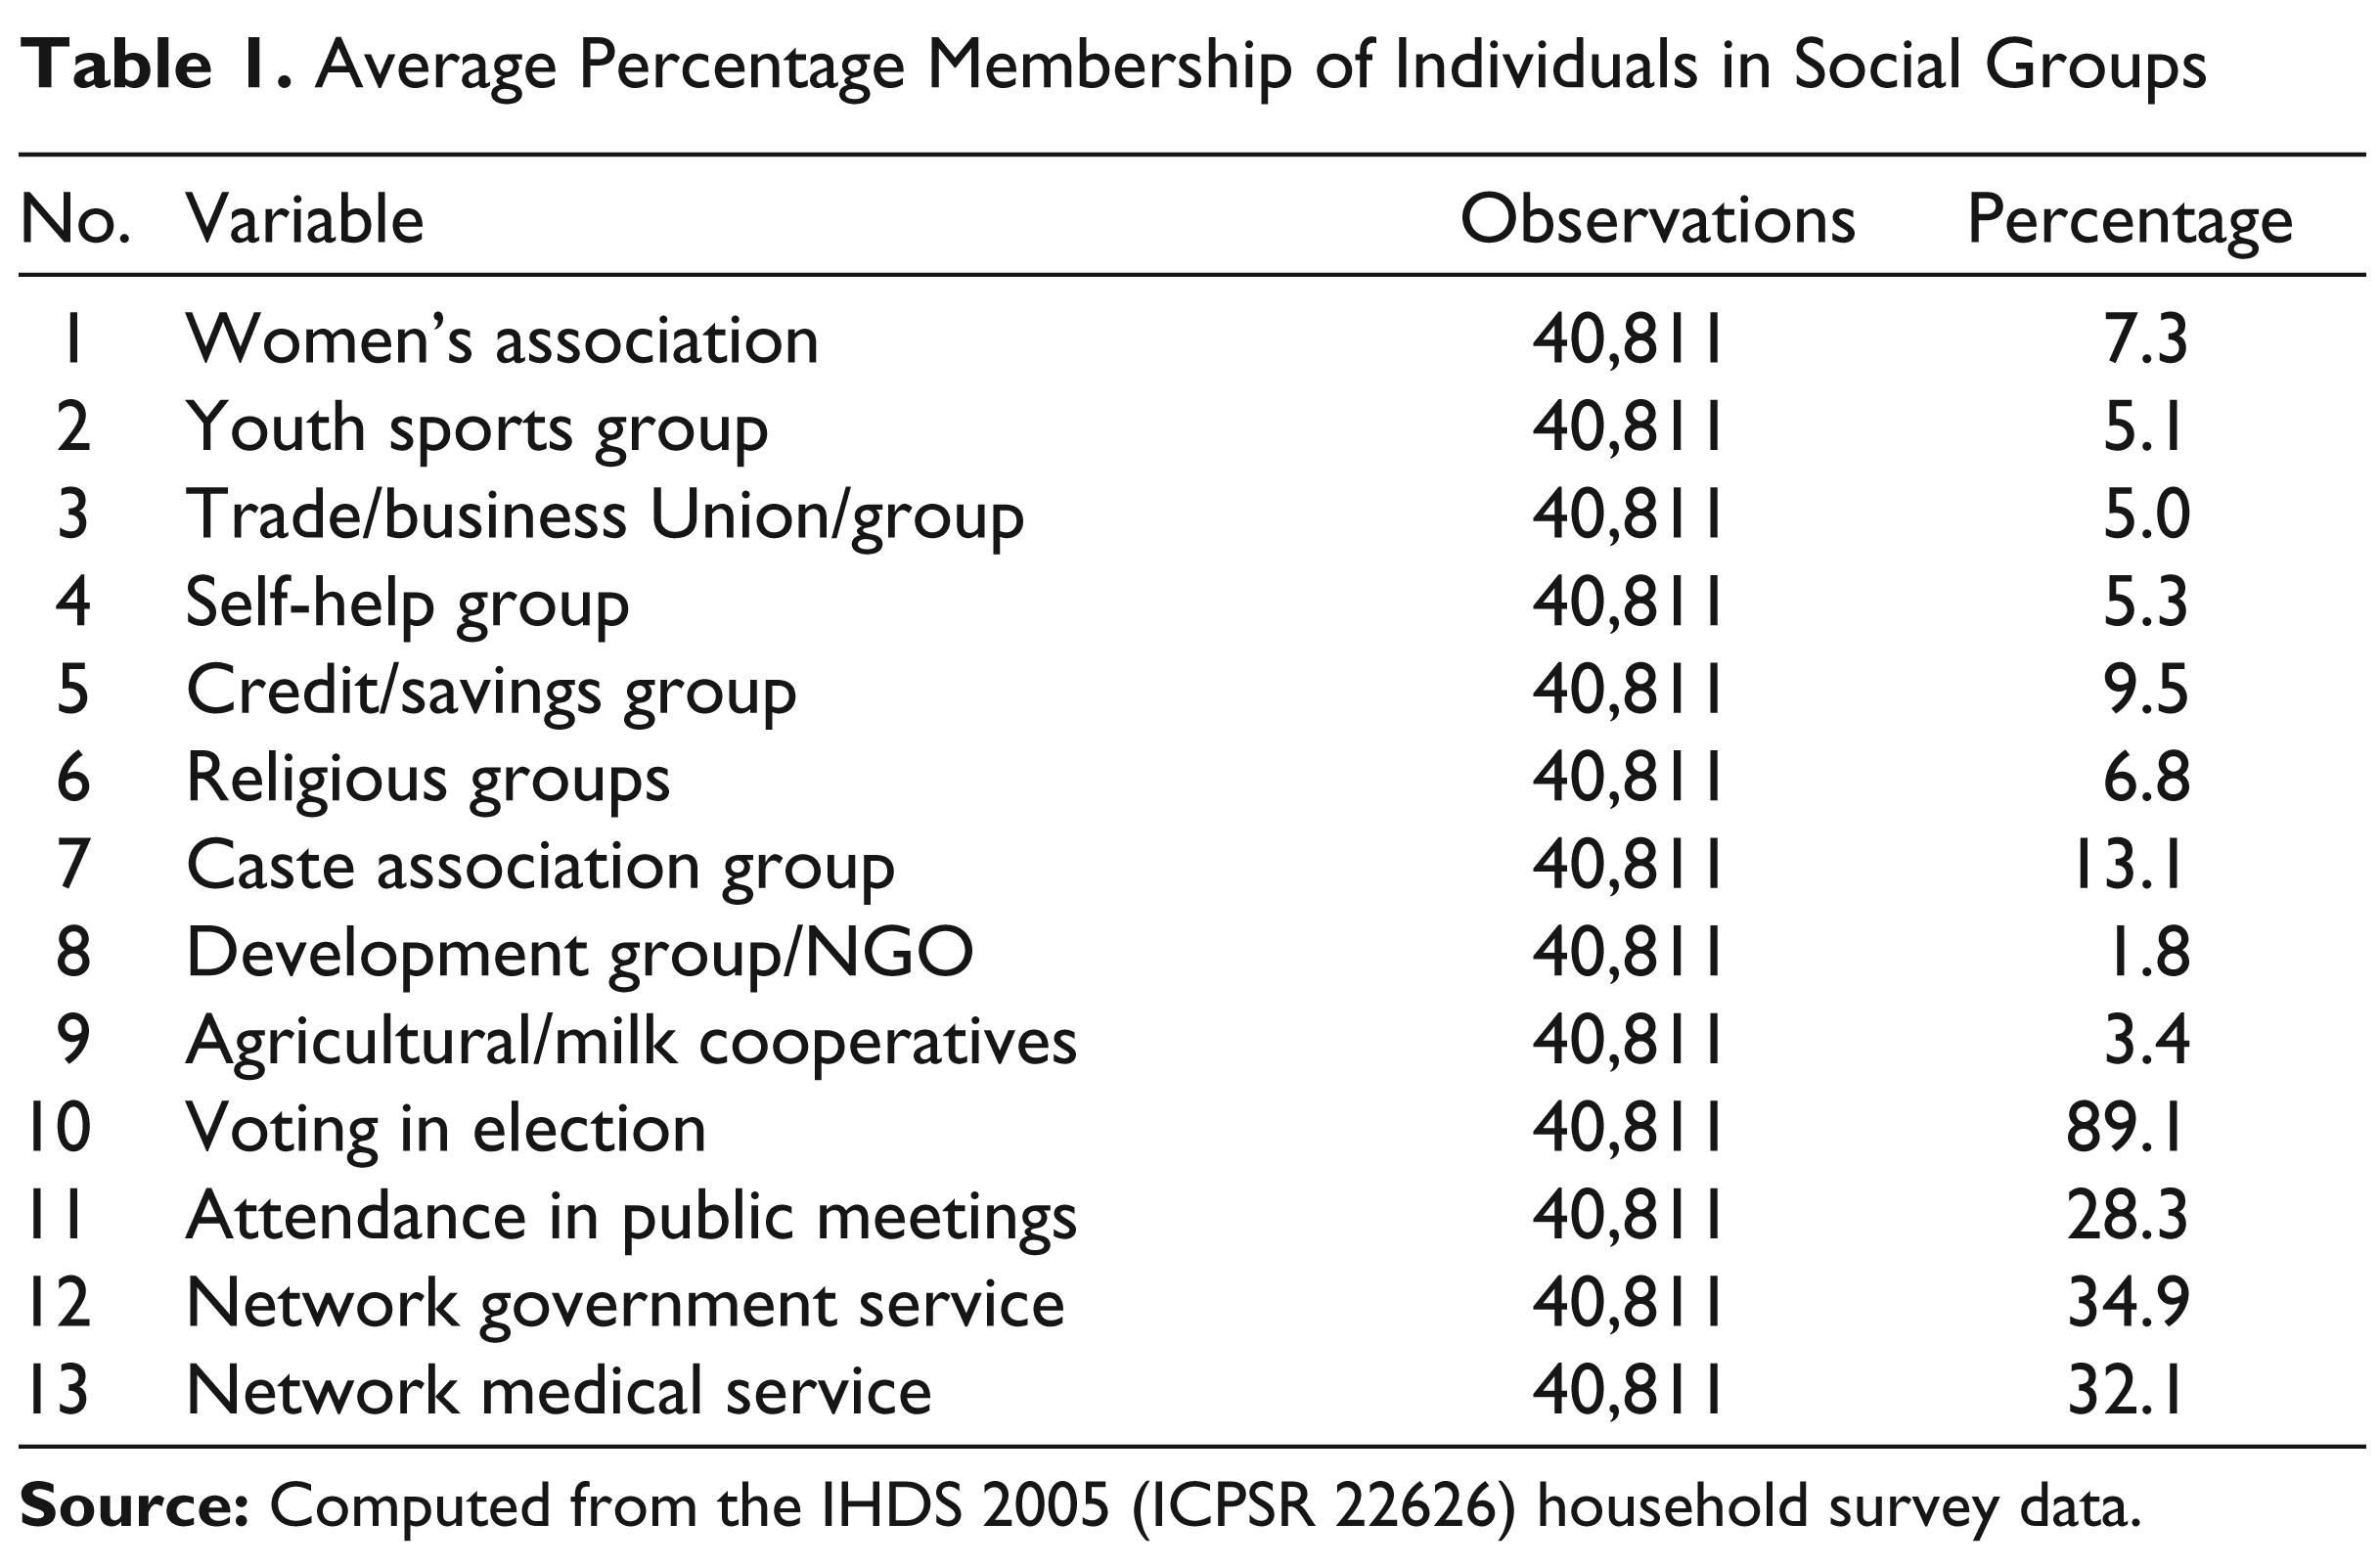
We also take voting and public meetings as a means to connect to a larger group of people as they enhance the possibility of developing further networks and receiving information. These two aspects have substantial participation and thus, in general, will most likely have an impact on the social embedding of the household. The aggregate measure as argued earlier gives us a consolidated measure of embedding with emphasis on the network which has more participation. We discuss the empirics of this in detail in the subsequent section. Table 2 shows the weights of each group as obtained by using the frequency of membership in each network (see Appendices A–C for details).
Constructed Weights for Membership of Individuals in Social Groups

Based on the frequency, each variable gets a weight which indicates its relative strength in the overall set of memberships. A higher weight, by construct, indicates more participation of households in that group and thus forms a deeper embedding when compared to others. Arguably, a member of such a group is assumed to benefit from broader linkages and flow of information. Furthermore, given the data and the constructs, we describe the other set of variables based on their characteristics and postulate our hypothesis.
Dependent Variable
We use the answer to the question “Does anyone in your family have a bank account?” The responses are coded in ‘yes’ and ‘no’ as 1 and 0, respectively. There are other measures of banking and financial instruments, such as Kisan Credit Cards (KCC), insurance, credit cards and loans, but the incidence of any of these is not enough to run an empirical test. A bank account serves as a suitable proxy for access and use of financial instruments because (i) it is basic in nature and is one of the first financial instruments for a household to use and (ii) the ownership of a bank account opens up means for the household to access other financial instruments as the documentation required for these instruments is almost the same as required for a bank account. One may argue that it is one of the prerequisites for all other financial instruments.
Independent/control Variables
Having accounted for the social embedding score, we introduce controls for household characteristics, exposure to media sources and environmental variables which might have an independent effect on the likelihood of the family having a bank account, and thus ought to form a part of the basic equation. Household characteristics, such as highest education by the head of the household, can determine how open the household is towards adopting banking services. Other characteristics such as net income of the household can also have a similar effect. We control for other alternate avenues of information such as access to media sources, namely: (i) radio, (ii) television and (iii) newspaper. Social embeddedness can possibly encourage the exchange of private information which increases the likelihood of a household to adopt financial or other services in general. A range of media sources can also give a similar form of exposure. We attempt to separate the quality or the differential motivation of the households towards the use of such information by controlling for media exposure of men and women of the household separately for these media sources.
The last set of control variables is of local or regional environmental variables. Generally, the likelihood of adopting banking services is also dependent on the availability and feasibility of banking services. This control helps to isolate such variations across states. We control for the rural–urban divide by incorporating a dummy to capture this effect. The underlying belief is that higher the distance, the less likely is the household to adopt banking services or rural households are less likely to have banking access. This effect in general is independent of whether or not a household is socially embedded. Also the location of the household, rural or urban, captures the feasibility of access of the household to the banking services. Urban households are likely to have better roads, electricity and other amenities which would make adopting banking services much easier when compared to rural households. To capture the state-level variation, we check for state effects by entering state dummies. This would capture a host of unobservable factors that are innate or specific to the state which could range from the effect of legislation, law enforcement, political environment, geography and others.
We begin with an LPM to obtain a baseline result of our construct. Our empirical premise is that controlling for all relevant socio-economic factors/determinants, a household that is more socially embedded will on an average have a higher probability of having access to banking services. Thus, our measure of social embedding ought to be positively correlated with the probability of having a bank account. We verify this and attempt to evaluate the following hypothesis: A household’s likelihood of having banking access when it has acquaintances with someone in the social networks through membership with social groups is higher when compared to when it is not, that is, higher social embedding increases the probability of having access to banking. We compare our results with some variations in models to capture the essential characteristics and further discuss the results. The next section describes the basic results.
Results
We begin by estimating the direct effect of an individual’s social embedding on the probability of having access to a banking channel. We estimate an LPM with a set of relevant control variables as described previously. The result is presented in Table 3.
Result of Linear Probability Model (LPM)

(ii) * and ** indicate value significant at 1 per cent and 5 per cent, respectively.
The results show a positive and significant impact of social embedding on the probability of having access to a banking channel. The magnitude after controlling for relevant factors is fairly large with approximately a 25 per cent increase on an average with a unit increase in social embedding. The other control variables have expected signs, with below poverty line households having a lower probability of access to banking and a higher education attainment of the household has a positive impact on access to banking. The rural–urban divide also has a bearing as it captures access to such facilities. The coefficient on the dummy is positive as expected, as urban households are likely to have higher chances of having access to banking resources. The income variable serves as a control for all other basic economic characteristics of the household. Thus, controlling this effect, the result clearly shows a significant impact of social embedding.
Exposure to media is another control variable which may have an independent effect on having information. Thus, controlling for female exposure to television (in hours) shows a positive and significant impact on increasing the chances of having access to banking resources. Our experiment with an alternative control for media exposure of men does not alter the result. This estimate provides a baseline result that can be used for comparative purposes. Since by definition the LPM is an unconstrained model, we further attempt to improve our results by incorporating other forms to restrict the predicted probabilities within the range [0, 1]. We use the same covariates and use a logistic regression structure to estimate the underlying relation. Table 4 presents the results.
Results of Logistic Regression

(ii) * and ** indicate value significant at 1 per cent and 5 per cent, respectively.
Before we discuss the results, the coefficients of both models are tabulated to get a comparison (Table 5).
The coefficients of logit can be interpreted as log of odds ratio, while the coefficients of LPM can be directly interpreted as marginal/partial impacts. In terms of predicting probabilities, the LPM predicts a negligible percentage of probabilities below zero (2.18 per cent) and above one (1.56 per cent). By construct, the averages of predicted probabilities and the actual variable would be same (38.9 per cent). In terms of signs of coefficients and magnitude, this strengthens our premise that controlling for socio-economic characteristics, social embedding alone has a significant impact on banking access. Positive coefficients in logit signify a higher odds ratio which implies that the impact of a unit change in the independent variable will increase the chances of success of the event. Formally, given our variable of interest and holding all other predictors constant, the intercept value indicates the log of odds of a household having banking account having a zero social embedding score. Thus, the odds of a household with no social embedding is [exp(–8.245) = 0.00026] which is extremely low. Alternatively, the constant in the LPM can be interpreted as the average probability of banking access which is [exp(–1.119) = 0.3266]. The estimates are closer to the sample average and thus provide us with reasonable explanation of the probability of a household’s access to banking.
Coefficients of Probability Models

Next, consider the coefficient on Score SE which is our variable of interest. This value in terms of odds ratio keeping all other values as fixed is [exp(1.242) = 3.465]. This suggests that holding all other predictors at a fixed value, a unit increase in social embedding increases the odds of having a banking access by nearly three times. This is a substantial increase in probability which signifies the extent of the impact of social embedding on such settings. These results in general validate our basic hypothesis that higher social embedding increases the probability of having banking access. However, one may further explore this relation under different empirical settings as certain underlying characteristics of the relation could still be unexploited.
Since the data cover statewide observations, we may have similar or different conditions prevailing in states, as such, effects could also have an unobservable impact on this relation. We bridge this by estimating a fixed-effect (or within group) model to capture the level effect and the unobserved heterogeneity across states. Empirically, in contrast to assuming random effects in coefficients, the fixed-effect model in levels essentially captures the unobserved time-invariant factors for each entity that could possibly be correlated with the explanatory variables. Empirically, this effect is isolated as an intercept for each entity. The choice of the model is also prompted by conducting a Hausman test to check for systematic variation across the entities. The test result rejects the null hypothesis and hence we consider that a fixed-effect model is both consistent and efficient. We also incorporate a dummy variable for each state to get a differential impact of heterogeneity across states. This model enables us to re-estimate the basic relationship using the same set of covariates in the Ordinary Least Square (OLS) form, such that the coefficients are directly interpretable. The equation specified is of the type:

where βj is the coefficient, Xj is the covariate, γk is the coefficient on the dummy variables, Dk is dummy variable for each state, ρi is a fixed-effect term and vi is an error term. In estimating this, we retain the earlier independent variables as they adequately isolate the effect of social embedding. Table 6 presents the results of the fixed-effect regression.
Fixed-effects (within group) Regression
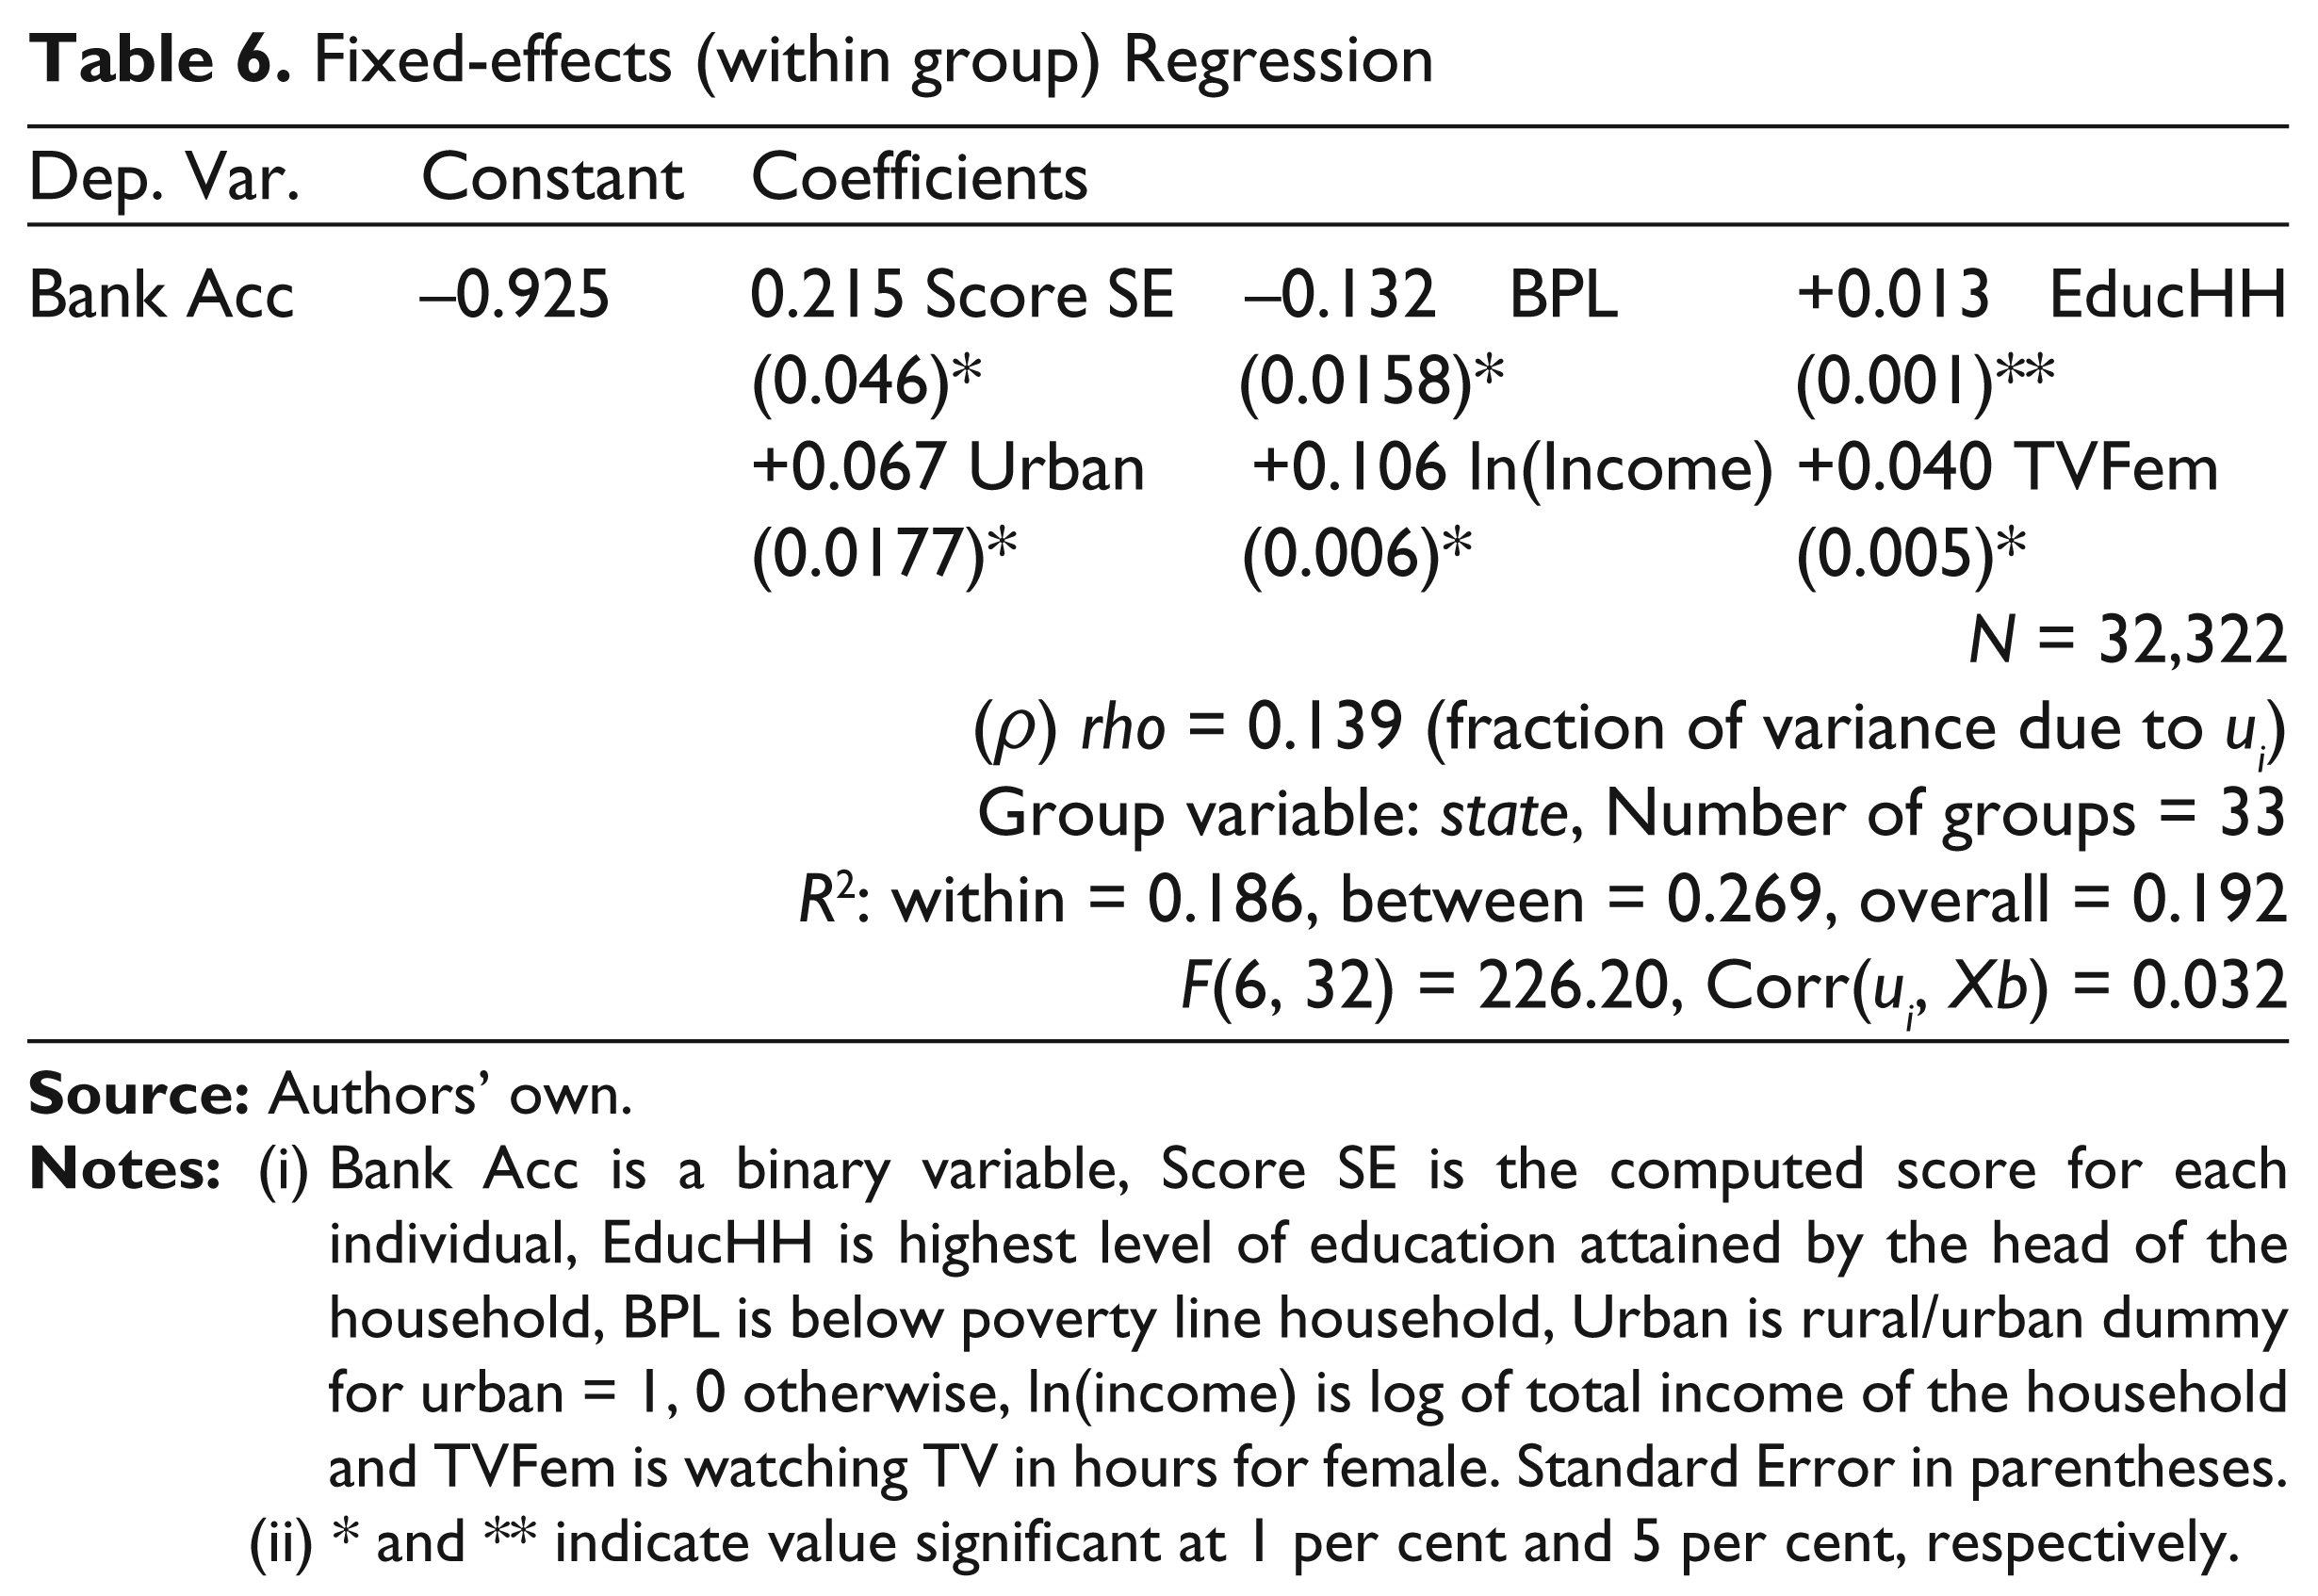
(ii) * and ** indicate value significant at 1 per cent and 5 per cent, respectively.
The result on the coefficient on Score SE confirms our earlier hypothesis that social embedding has a positive and significant impact on having access to banking. The signs of all other variables are also in the right direction and are statistically significant. The coefficients on the state dummies for different intercepts have not been reported here. The coefficient on social embedding score is close to our earlier estimate of 0.248 in the simple LPM. As expected, the coefficient on urban dummy is positive and statistically significant thereby confirming the belief that with lower constraints on access, the probability of having access to banking resources increases on an average. The base probability given by the intercept is nearly close to the average of the sample (exp(–0.925) = 0.3965), thereby improving our earlier estimate.
Lastly, to verify whether the impact is an unbiased estimate, we test by including holding of credit card as an additional covariate to control for the fact that other financial channels may also influence banking access. We find our estimate of social embedding improves marginally to 0.2201 (SE: 0.015) along with a lower standard error. This retains our basic result and the similarity of the coefficients from the models gives a comprehensive estimate of the impact of social embedding on the probability of having banking access. Variations in the models provide us with a clear direction and magnitude of the coefficients thereby strengthening the basic result. Within the overall score, one may also be interested in identifying the singular impact of any of the groups or networks. This can be estimated by using the coefficient on Score SE and the corresponding weight of the membership group, that is, (β1.wi). Thus, for example, the impact of a membership in government medical network has a weight of 0.127 which gives an impact of (0.215 × 0.127 = 0.0273) which is approximately 2.7 per cent. Individually, it would be conventional to find a marginal contribution of one component but to isolate a singular impact and the overall impact gives a considerable insight into how a particular network or membership might contribute. One may also argue that the quality of the membership is also reflected by the number of households subscribing to it. Thus, based on our construct, more number of households in a group would give it a higher weight thereby directly increasing the probability of banking access.
Overall, the results establish that controlling for relevant economic, socio-economic and state-specific characteristics, a household with higher social embedding has a greater chance of having banking access. The magnitude of this impact is substantial with approximately a 25 per cent increase in probability. Based on these results, we discuss some of the implications of social embedding and draw the essential conclusion.
Implications and Conclusion
One of the major implications of this result is that access to banking resources can be influenced and enhanced through networking. Although this may appear to be conventional, identifying the isolated impact of social networks and membership can be difficult. As several forces operate at the individual or household level, the singular impact of social embedding can have large effects on the overall access to banking and financial resources. Despite low access to banking resources, particularly in the rural areas, higher social embedding can eventually lead to adoption of such services through spread of information, trust and experience. Thus, the channels through which social embedding takes place have important considerations for policy and financial inclusion drives. Previous research has established the benefits and reach of financial inclusion. In the Indian context, given that financial inclusion is being pursued as a policy agenda, a renewed approach in this direction can potentially yield favourable results.
Such embedding can prove to be complimentary to existing contemporary financial inclusion drives if such social channels are used for spreading and disseminating information and building confidence among people for adoption. This can possibly be achieved by increasing the role of technology in areas such as (i) mass exposure to electronic media in rural areas, (ii) digitisation and online platforms for memberships and associations, (iii) increased Internet access through mobile or other means and (iv) integrating online payment systems with other membership or association platforms. The places where such embedding can work most towards financial integration are with trader/business associations, dairy associations and savings groups where households interact on regular intervals.
Our findings also suggest that quality and other dimensions could also play a significant role in enhancing its effect. Thus, one can consider expanding the scope of social embedding to include aspects such as personal or public relationships, peer-to-peer networks and users of information technology/information technology-enabled services (IT/ITES), among others, to see their effects. At the same time, extending the measure of social embedding to include time-varying effects could equally provide deeper insights into the effect of social embedding on various aspects of financial integration.
To conclude, our primary aim in this article has been to investigate the relation and impact of social embedding on access to banking. Social embedding is a construct that captures the peculiar features of societies where customs, traditions, affiliations, reciprocity, etc., dominate the structure and conduct of the society. In contrast to contemporary financial inclusion drives, such social embedding is often thought as a barrier as individuals or groups either self-exclude themselves from participating in such initiatives or are left out simply due to policy or coordination failure. We empirically investigate this by constructing a social embedding score by taking a weighted average of participation in the membership and networks of households. The weighted average captures the relative strength of the memberships and networks and provides an aggregate measure of social embedding at the household level. We show that controlling for relevant socio-economic and household-level characteristics, higher social embedding substantially increases the probability of a household having banking access. The results are corroborated by using variations in the models, and the predicted probabilities using binary choice models are close to the actual outcomes. The singular impact of social embedding is sizable (25 per cent) and clearly shows that social channels can serve as a means to enhance banking reach and access if financial inclusion or other programmes exploit such relationships.
Footnotes
Appendix A
Descriptive Statistics of memberships (binary variables)
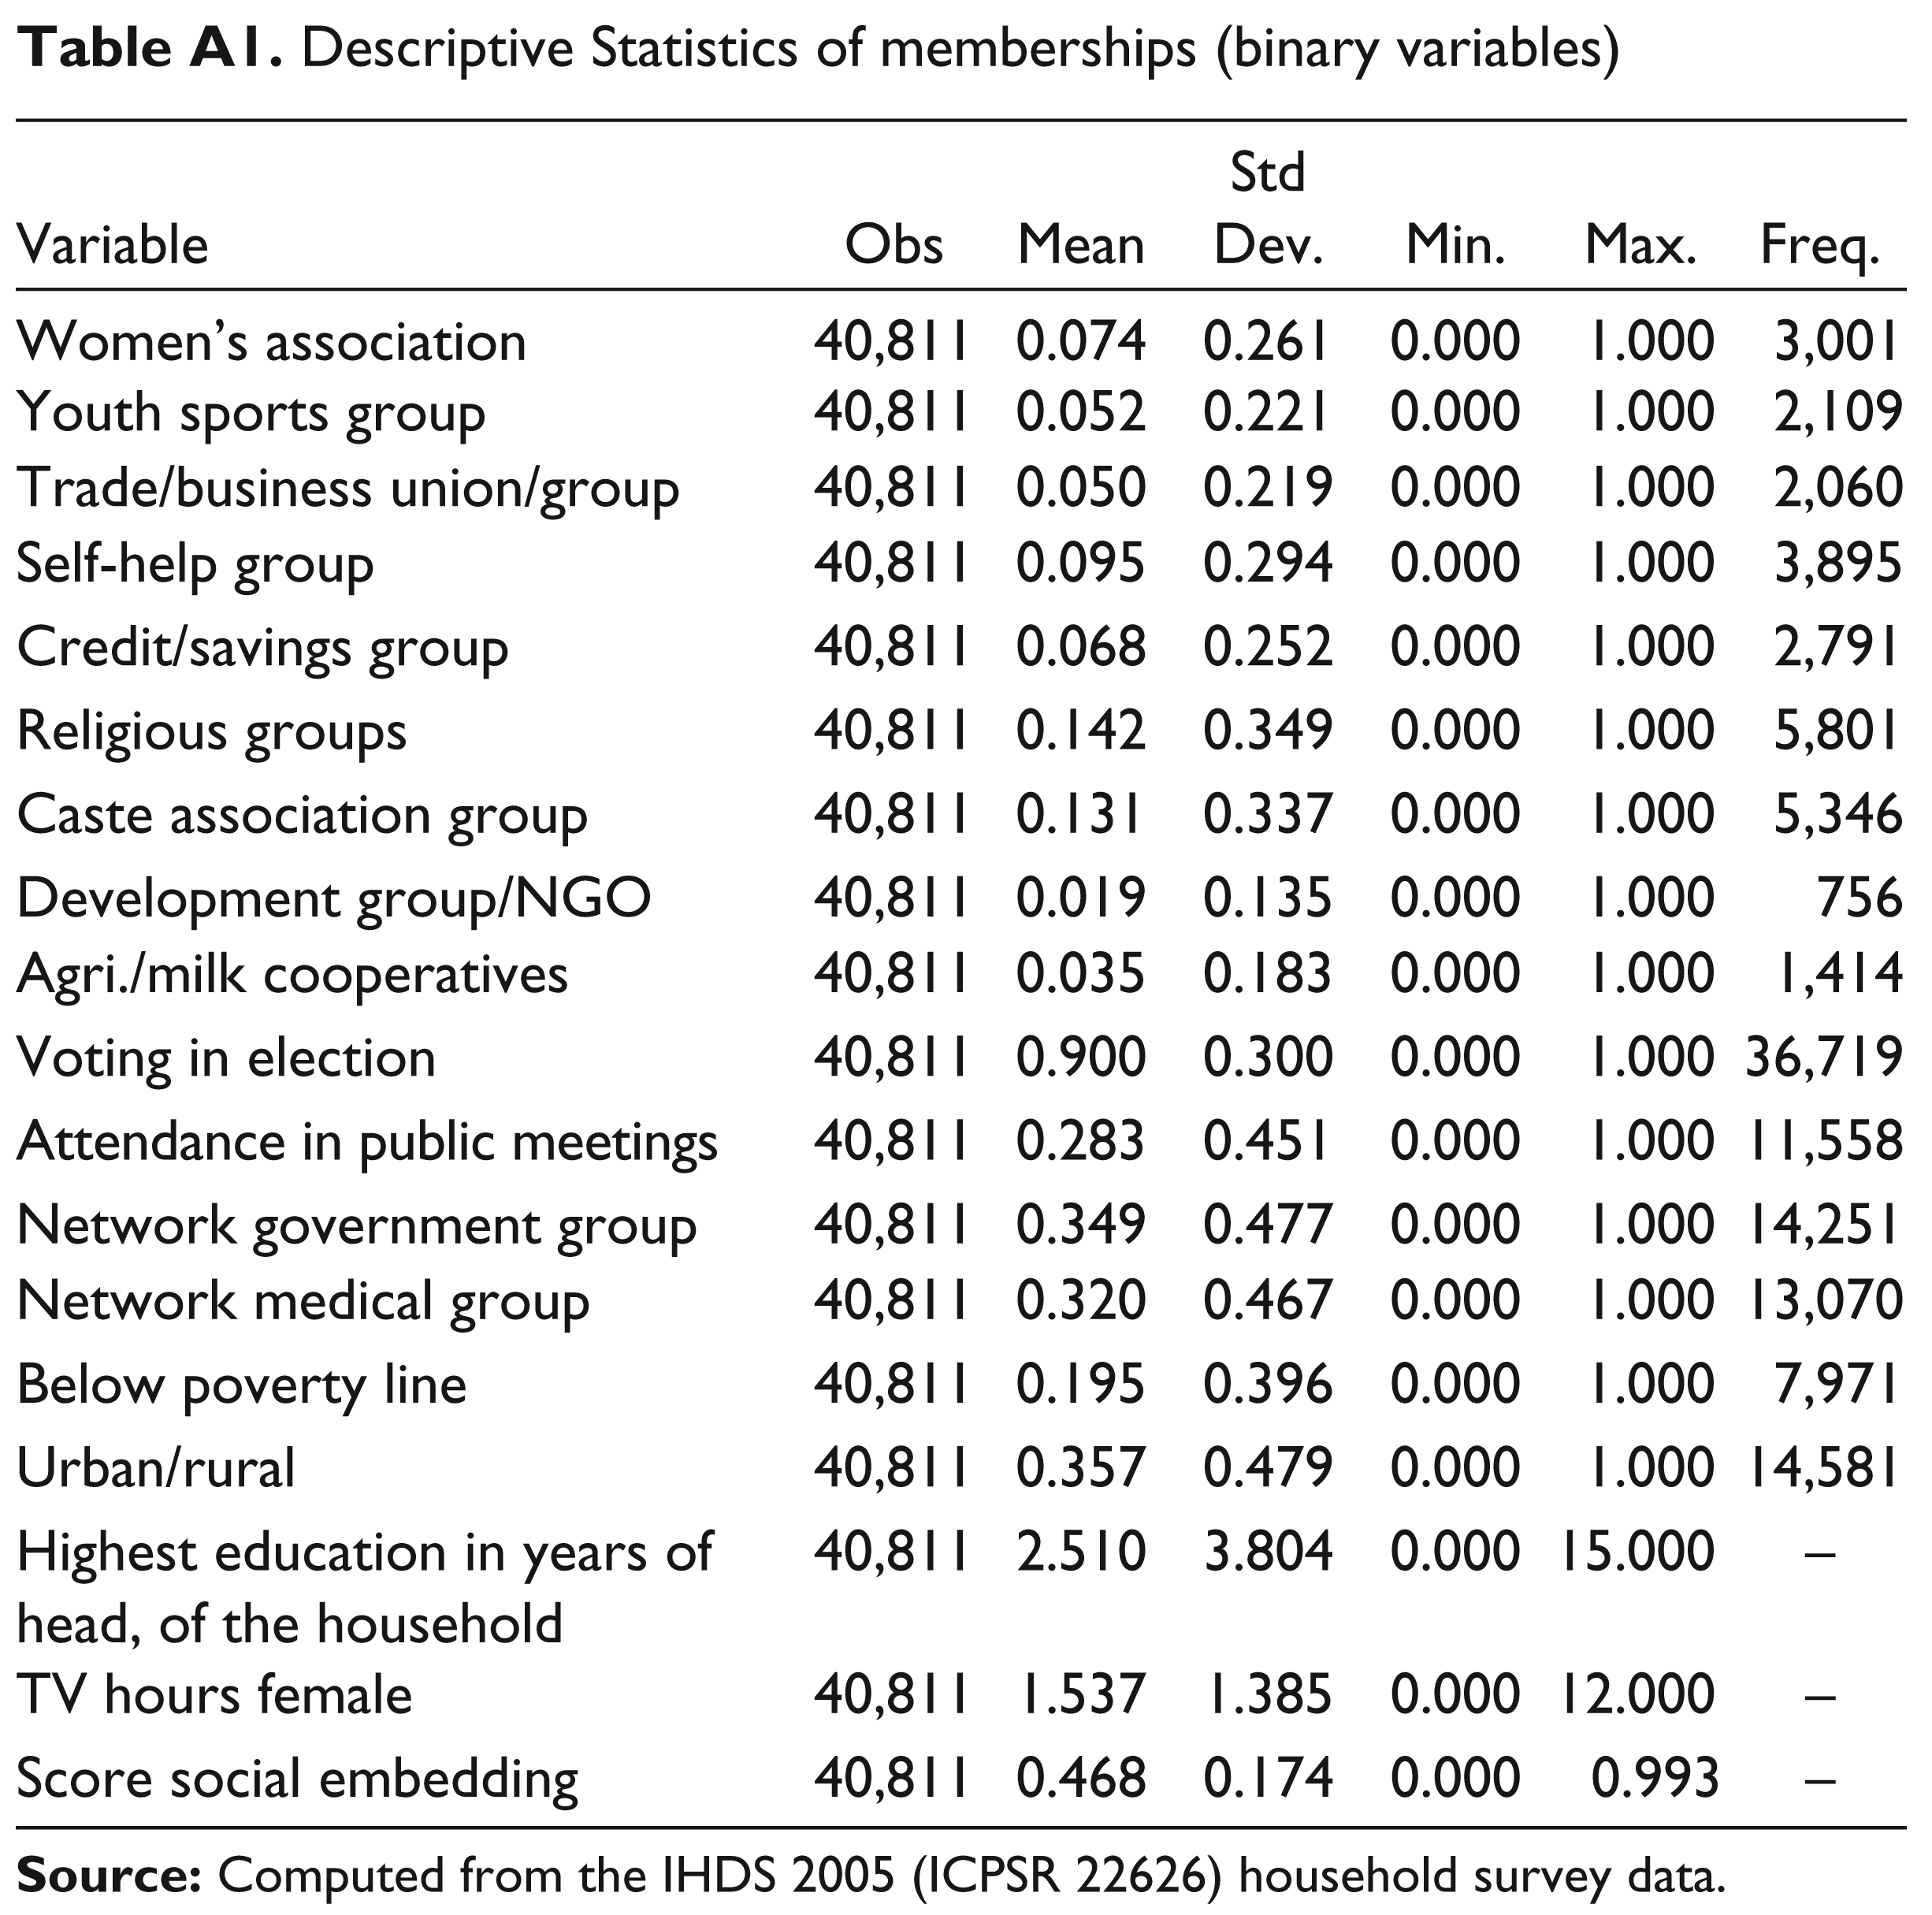
| Variable | Obs | Mean | Std Dev. | Min. | Max. | Freq. |
| Women’s association | 40,811 | 0.074 | 0.261 | 0.000 | 1.000 | 3,001 |
| Youth sports group | 40,811 | 0.052 | 0.221 | 0.000 | 1.000 | 2,109 |
| Trade/business union/group | 40,811 | 0.050 | 0.219 | 0.000 | 1.000 | 2,060 |
| Self-help group | 40,811 | 0.095 | 0.294 | 0.000 | 1.000 | 3,895 |
| Credit/savings group | 40,811 | 0.068 | 0.252 | 0.000 | 1.000 | 2,791 |
| Religious groups | 40,811 | 0.142 | 0.349 | 0.000 | 1.000 | 5,801 |
| Caste association group | 40,811 | 0.131 | 0.337 | 0.000 | 1.000 | 5,346 |
| Development group/NGO | 40,811 | 0.019 | 0.135 | 0.000 | 1.000 | 756 |
| Agri./milk cooperatives | 40,811 | 0.035 | 0.183 | 0.000 | 1.000 | 1,414 |
| Voting in election | 40,811 | 0.900 | 0.300 | 0.000 | 1.000 | 36,719 |
| Attendance in public meetings | 40,811 | 0.283 | 0.451 | 0.000 | 1.000 | 11,558 |
| Network government group | 40,811 | 0.349 | 0.477 | 0.000 | 1.000 | 14,251 |
| Network medical group | 40,811 | 0.320 | 0.467 | 0.000 | 1.000 | 13,070 |
| Below poverty line | 40,811 | 0.195 | 0.396 | 0.000 | 1.000 | 7,971 |
| Urban/rural | 40,811 | 0.357 | 0.479 | 0.000 | 1.000 | 14,581 |
| Highest education in years of head, of the household | 40,811 | 2.510 | 3.804 | 0.000 | 15.000 | – |
| TV hours female | 40,811 | 1.537 | 1.385 | 0.000 | 12.000 | – |
| Score social embedding | 40,811 | 0.468 | 0.174 | 0.000 | 0.993 | – |
Social Embedding Score
Let the weight of each network for any j = 1 ... J be given by
Since the responses are either 0 or 1, the frequency can be equivalently written as
Appendix C
Hausman Test for Fixed and Random Effects
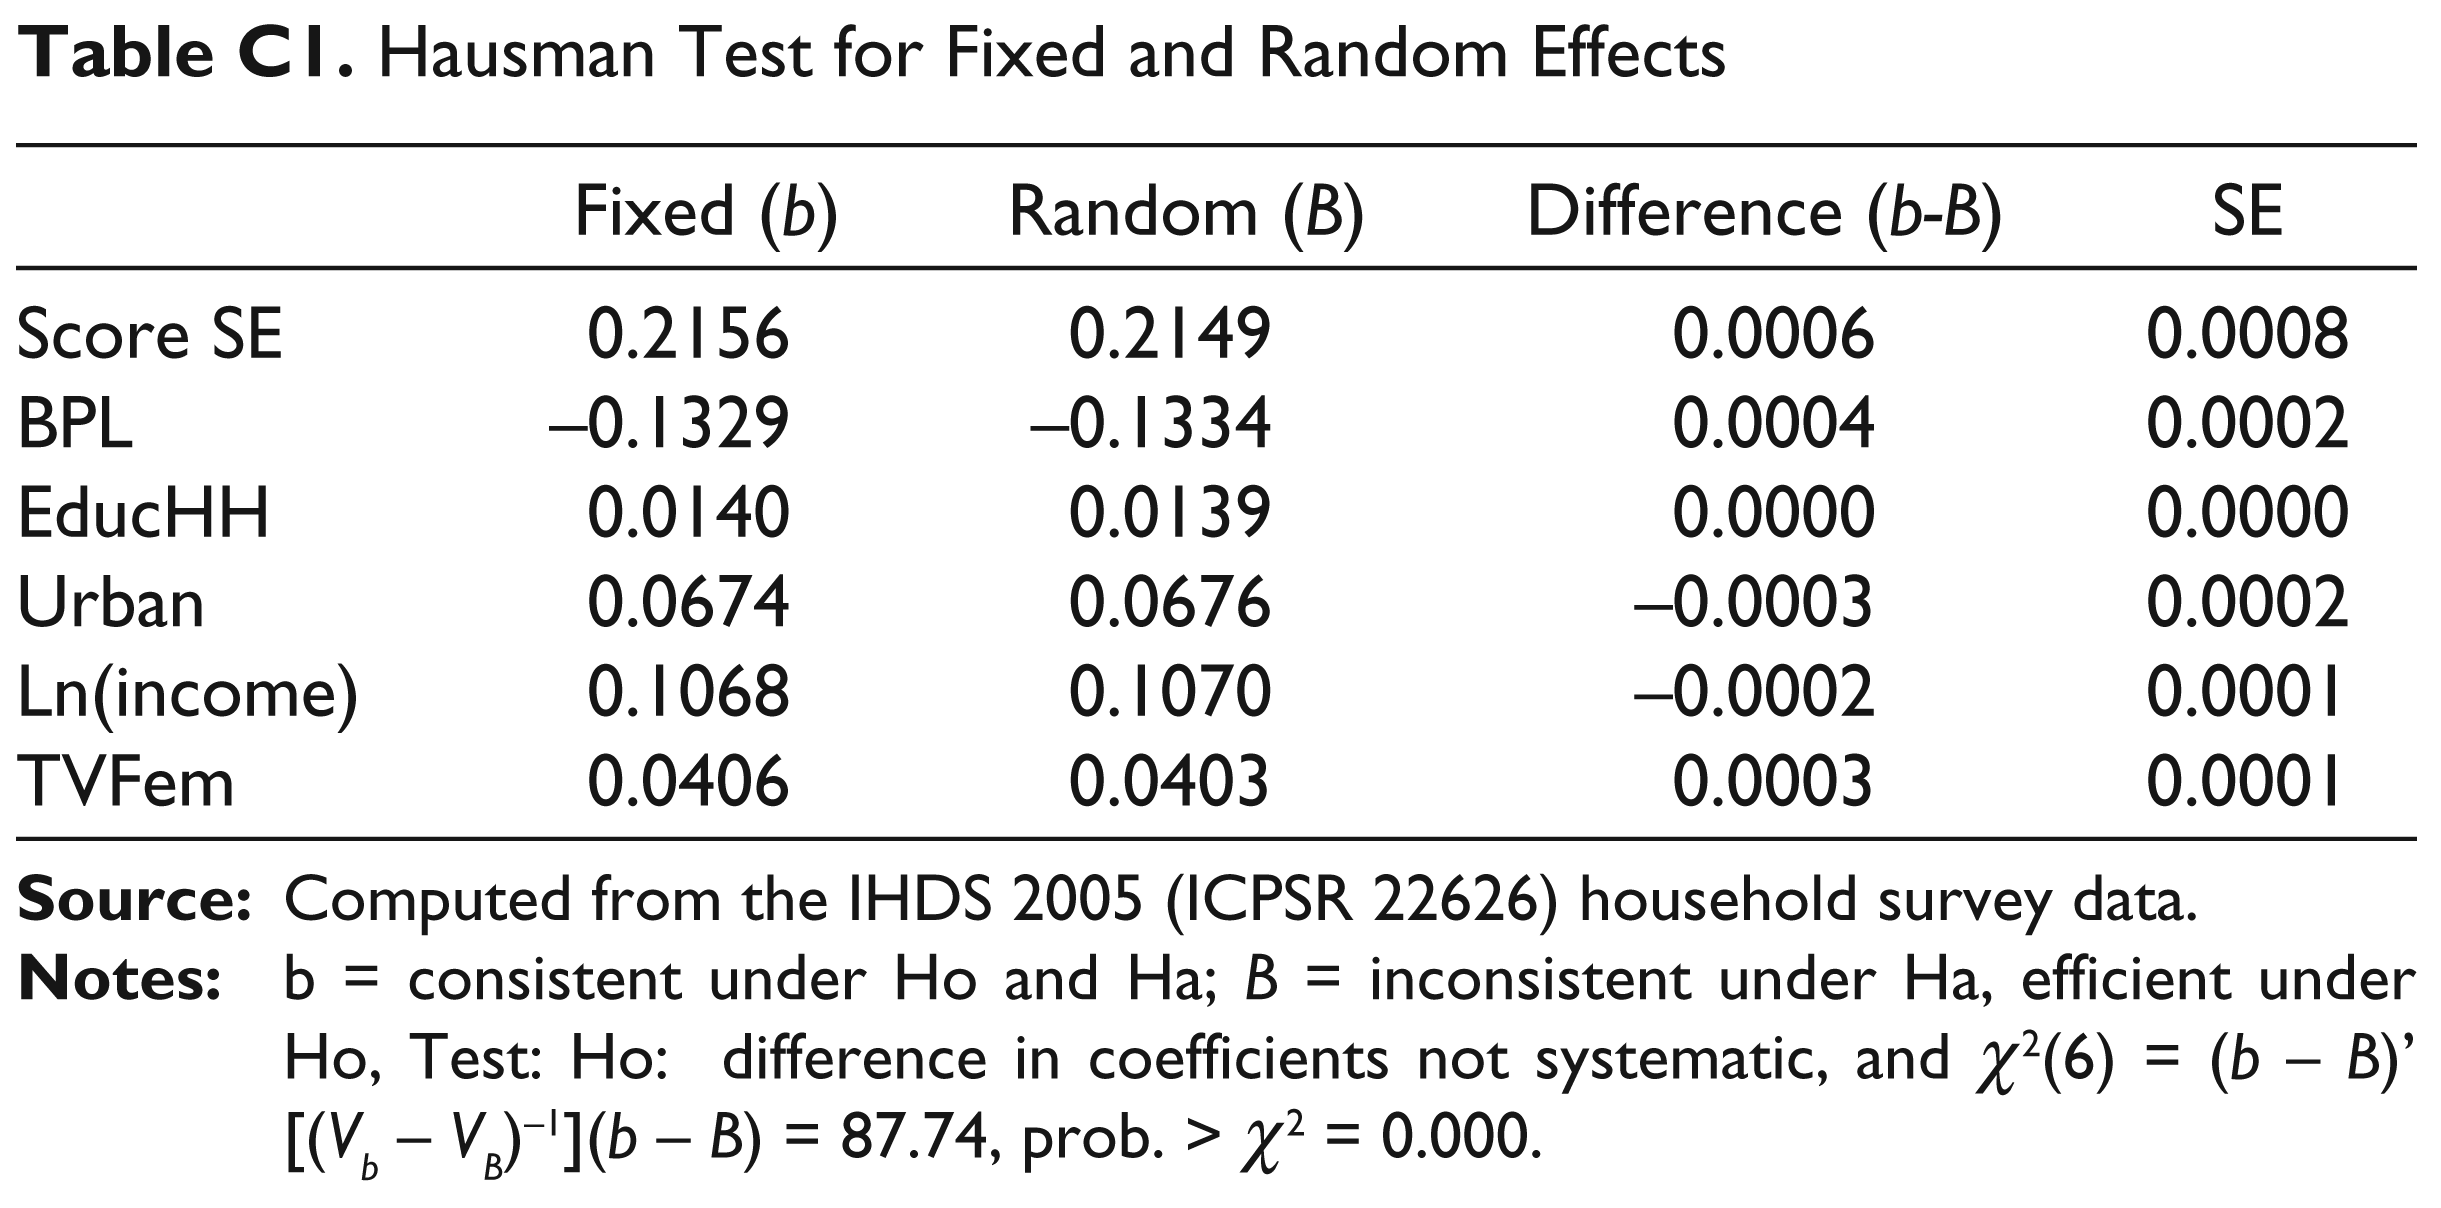
| Fixed (b) | Random (B) | Difference (b-B) | SE | |
| Score SE | 0.2156 | 0.2149 | 0.0006 | 0.0008 |
| BPL | –0.1329 | –0.1334 | 0.0004 | 0.0002 |
| EducHH | 0.0140 | 0.0139 | 0.0000 | 0.0000 |
| Urban | 0.0674 | 0.0676 | –0.0003 | 0.0002 |
| Ln(income) | 0.1068 | 0.1070 | –0.0002 | 0.0001 |
| TVFem | 0.0406 | 0.0403 | 0.0003 | 0.0001 |
Acknowledgements
We are thankful to Professor Ankur Sarin of IIM Ahmedabad for his helpful comments and suggestions on an earlier draft. We also thank an anonymous referee of the journal for comments and suggestions.