
Abstract
This article investigates the weak form of the efficient market hypothesis (EMH) for the Kuwait Stock Exchange (KSE). In particular, it tests whether share returns on the KSE exhibit patterns which may be used to predict future share price changes. Ten filter rules are tested on weekly data for 42 firms over the period 1998–2011. The results suggest that the KSE was not weak-form efficient because patterns and trends were present in security prices. In addition, the results are consistent with the substantive literature which has argued that emerging stock markets are informationally inefficient, such as Fifield, Power and Sinclair (2005, 2008) and Xu (2010) and particularly those early studies of Al-Shamali (1989) and Al-Loughani and Moosa (1999) that looked at trading rules for the KSE.
Keywords
Introduction
This article examines the weak form of the efficient market hypothesis (EMH) for the Kuwait Stock Exchange (KSE). According to this hypothesis, a market is efficient ‘if it fully and correctly reflects all relevant information in determining security prices’ (Malkiel, 1992). The weak form of this hypothesis focuses on historic information and suggests that no trends or patterns are present in share return data. An investor, therefore, cannot achieve abnormal returns by trading on past information since the historical news is already impounded into share returns, and price changes follow a random walk process.
When investigating the weak form of the EMH, studies have typically concentrated on statistical tests by looking at the correlation between current and historic returns and conducting runs tests which examine for patterns in the sign of share price changes. In addition, another strand of the literature has focused on the performance of trading strategies; studies in this area normally investigate whether an investor who trades on the basis of trends in past security prices can outperform a passive investment approach. One of the most common strategies which have been studied in the literature is filter rates. The filter rule recommends the purchase (sale) of a share if its price has risen (falls) by a certain percentage from a previous low (high) value.
To date, a lot of studies which have tested the weak form of the EMH have concentrated on developed markets such as the USA and the UK (Fama, 1965; Fama & Blume, 1966; Hudson, Dempsey, & Keasey, 1996; Sweeney, 1988). In general, the findings from such studies suggest that markets are efficient with respect to historic information. 1
Correlation coefficients between current and past returns are typically close to zero (Fama, 1965), the sign of price changes exhibit no specific patterns (Fama, 1965) and trading strategies cannot outperform a passive investment approach where an investor buys a portfolio of diversified securities and holds them over a specific time horizon (Fama & Blume, 1966; Sweeney, 1988). However, a growing number of investigations indicate that stock exchanges in emerging market countries may not be weak-form efficient. The current study adds to research in this area.
Specifically, the current article tests a comprehensive set of filter rule strategies on weekly data for a sample of 42 Kuwaiti shares to examine whether the KSE is weak-form efficient. A number of previous studies have examined this issue (Abraham, Seyyed, & Alsakran, 2002; Al-Khazali, Ding, & Pyun, 2007; Al-Loughani, 1995; Al-Loughani & Moosa, 1999; Al-Mudhaf, 1983; Al-Shamali, 1989; Butler & Malaikah, 1992; Elango & Hussein, 2008; Gandhi, Saunders, & Woodward, 1980; Hassan, Al-Sultan, & Al-Saleem, 2003; Smith, 2007). However, a majority of these concentrate on statistical tests, analyse relatively old data and focus on indices rather than on individual security returns. The current article, therefore, contributes to the literature in this area by examining the weak form of the EMH for the KSE using individual company share price information over a recent period to test the profitability of a large number of filter rule trading strategies.
There are a number of reasons why the weak form of the EMH should be reconsidered for the KSE. First, a lot of the existing literature has arrived at mixed conclusions about whether or not the KSE is weak-form efficient; a comprehensive study using data for a relatively large sample of securities might help to clarify any confusion in the literature. Second, the KSE has changed since the early 1990s when data for a number of previous studies were used. For instance, several regulations were introduced 2 in order to improve the transparency and disclosure levels of companies listed on the KSE (Al-Yaqout, 2006). In addition, restrictions were lifted on the ownership of shares in Kuwaiti companies by non-nationals; since 2000, foreign investors are allowed to own up to 100 per cent of the equity of Kuwaiti firms listed on the KSE. The influx of foreign investors may have altered the analysis of Kuwaiti equities undertaken and improved the efficiency of the KSE. Further, the trading system of the KSE has been updated in recent years while a privatisation programme by the Kuwaiti government has more than doubled the number of companies listed over the period 1998–2011. As the supply of shares has increased, the appetite of investors for purchasing equities has grown (Almujamed, 2011) and the liquidity of the market may have improved.
Currently, the KSE has 230 listed companies from eight sectors with a market capitalisation of around $169 billion (Central Bank of Kuwait, 2011). It provides an interesting research site for examining the weak form of the EMH since it is a liquid market with a T+1 settlement system where the value of shares transacted and trading volume have grown by 971.0 per cent since 2000 (Central Bank of Kuwait, 2011). Further, it is a well-regulated market where transaction costs (at 0.1%) are minimal. Thus, unlike a lot of other emerging markets, any excess returns from following a filter rule investment strategy that are documented for the KSE may be achievable by practitioners.
Literature Review
Empirical studies from stock markets of the Gulf Cooperation Council (GCC) countries are relatively sparse when compared with investigations from other regions in the world. 3 Investigations about the stock market of Kuwait are even less common; to date, only 11 investigations about the efficiency of the KSE have been published. Within these published articles, there is a lack of consensus about the efficiency of the KSE. For example, three of the studies have suggested that the KSE is weak-form efficient (Al-Khazali et al., 2007; Al-Mudhaf, 1983; Butler & Malaikah, 1992) while another eight papers have argued that returns in the market are predictable (Abraham et al., 2002; Al-Loughani, 1995; Al-Loughani & Moosa, 1999; Elango & Hussein, 2008; Gandhi et al., 1980; Hassan et al., 2003; Smith, 2007). A majority of the empirical studies that have been conducted over the last three decades, therefore, have suggested that the KSE is inefficient.
A number of reasons may explain why some studies of the KSE reject the weak form of the EMH while others do not. A detailed investigation of the literature reveals that there have been variations in the time periods studied and the datasets used to examine the efficiency of the KSE. For example, 8 out of the 11 papers’ datasets were relatively old (Abraham et al., 2002; Al-Loughani, 1995; Al-Loughani & Moosa, 1999; Al-Mudhaf, 1983; Al-Shamali, 1989; Butler & Malaikah, 1992; Gandhi et al., 1980; Hassan et al., 2003) with share price information being studied from 1975 to 1999. In addition, only a minority (3 out of 11) used data for individual shares to test the weak form of the EMH for the KSE (Al-Mudhaf, 1983; Al-Shamali, 1989; Butler & Malaikah, 1992); eight focused on index values when conducting their tests. Further, a majority of studies about the KSE have concentrated on statistical tests to investigate the weak form of the EMH; most have employed the serial correlation test, runs test and/or the variance ratio test (10 out of 11 papers). By contrast, only two studies have investigated the performance of trading rules such as filter and moving averages rules (Al-Loughani & Moosa, 1999; Al-Shamali, 1989).
Studies by Al-Mudhaf (1983) and Butler and Malaikah (1992) have documented that the KSE is weak-form efficient. Both used data for individual shares and employed statistical tests such as serial correlation analysis and runs tests. For example, Butler and Malaikah (1992) used daily data for the most liquid shares listed on the KSE and the SSM (36 shares for the KSE and 25 for the SSM). 4 The results indicated that the returns for 60.0 per cent of the sample of the most liquid Kuwaiti shares followed a random walk process. Other papers have documented similar results but employed different methods (Al-Khazali et al., 2007); they used a non-parametric version of the variance ratio test and the runs test after correcting for infrequent trading. 5
By contrast, several investigations have used statistical analysis and found that KSE is not weak-form efficient. One of the early studies was conducted by Gandhi et al. (1980). They used serial correlation and run tests with monthly data for the All Share and Industrial indices from December 1975 to May 1978. They found that simple linear regressions of current returns on lagged returns suggested that significant patterns were present in the data. Al-Loughani (1995) also investigated the weak form of the EMH using a variance ration test but a different time period and an alternative market index called the Al-Shals Composite Index; he rejected the null hypothesis that share price changes followed a random walk.
The most relevant investigations for the current article are those that studied the performance of trading rules; a detailed review of the literature shows that only Al-Shamali (1989) and Al-Loughani and Moosa (1999) investigated the weak form of the EMH using such trading rules. Al-Shamali (1989) investigated the predictability of filter rules using daily and weekly share prices for 42 securities listed on the KSE over a 5-year period from January 1983 to December 1987. By contrast, Al-Loughani and Moosa (1999) examined the performance of moving average rules using weekly data for the KSE index over two sample periods from 27 August 1986 to 12 March 1997. Both studies suggested that the KSE was not weak-form efficient. For example, Al-Shamali (1989) used four filter rules (4%, 6%, 8% and 10%) and discovered patterns were present in the returns of most shares analysed; 6 the returns from most of the filter rules outperformed a buy-and-hold strategy. For instance, an analysis of daily prices revealed that the 10.0 per cent filter rule outperformed the buy-and-hold strategy by 0.066 per cent (0.140 versus 0.074), while for the weekly data the naïve strategy underperformed by 0.037 per cent (0.098 versus 0.061). Further, he noted that the returns generated from filter rules appeared to decrease as the filter size increased suggesting that only small filter sizes should be employed.
A decade after the Al-Shamali (1989) study, Al-Loughani and Moosa (1999) analysed the performance of eight long-run moving average periods (5, 10, 15, 20, 25, 30, 35 and 40 weeks) compared to a buy-and-hold strategy. According to their investigation, a buy (sell) signal occurred when the current price was higher (lower) than a moving average of path prices; thus, their short-run moving average period was only one week. They assumed that KD1000 was invested to make the trade realistic. In addition, transaction costs of 0.1 per cent were taken into account. Further, the findings from their first sub-period indicated that trading rules outperformed the buy-and-hold strategy significantly when 5 and 10 week moving average periods were used; the buy-and-hold strategy only outperformed the trading rules when moving average periods of 35 and 40 weeks were employed. Moreover, the findings from the second sub-period were consistent with the results of the first sub-period; for instance, the 5-week moving average rule outperformed the naïve strategy by 0.0519 per cent (93.09% versus 87.9%). The researchers concluded that any developments which had occurred in Kuwait during its recent post-liberation period had not improved the efficiency of the KSE.
Data and Method
The empirical work in this article is based on weekly closing share prices of 42 companies from 5 January 1998 to 10 January 2011. The start date was selected because a sizeable number of firms were listed in 1997; 7 an earlier start date would have reduced the sample size by a significant amount. 8 The data were obtained from both KSE and Datastream; one source was used to check on the information supplied by the other. 9 Both datasets were not adjusted for distributions such as cash dividends, share issues and capital reductions. Further, the KSE did not have information about any share distributions prior to 2001; information for the years 1997–2000 was obtained from two organisations: the Orient Consulting Center and the Gulf Investment House. Datastream only stored share price information from April 2001; thus, the data prior to 2001 were collected from the KSE on an Excel work sheet.
Table 1 reports details about the final sample of 42 firms that was used for this research. A visual inspection of the table reveals that the sample firms were drawn from seven different industries and ranged in size from a high of KD 429.7 m (TEL) to a low of KD 8.5 m (RRI). 10 Thus, a good mix of firms were included in the analysis, although a majority were drawn from the banking, investment and industrial sectors; only two companies from the food industry were included in the final sample and none from the insurance sector were included. 11 Further analysis shows that banks are all classified among those large capitalisations. An analysis of the final column of Table 1 indicates that most of the firms were profitable in 2011. Only five firms made losses in that year.
Samples


The tests in the current research are based on both the share prices as well as the natural logarithms of the security returns which were calculated according to the following equation:
where Ri,t is the return for share i in week t, Pi,t is the price of share i in week t, Di,t is the dividend for share i and Pi,t–1 is the price of the share in the previous week.
Table 2 highlights the descriptive statistics for the weekly returns of the sample companies. An analysis of the table highlights a number of points. First, the means of the average weekly returns among the sample firms were very small; they varied from a low of –0.36 per cent for PEA to a high of 0.31 per cent for NBK. Second, a majority (76.2%) of the average returns for the sample firms were positive which implies an upward trend in the share prices of most firms during the 13-year period studied. The standard deviation figures associated with these returns were relatively large; they varied from a high of 7.54 per cent for AGH to a low of 3.34 per cent for Commercial Bank of Kuwait (CBK). Also, it appears that there is no strong link between the mean and the standard deviation of returns for the firms. For example, the second best performing share (WAR) and the worst performing security (PEA) had standard deviations of 6.21 and 6.95 per cent, respectively. This image of volatile returns among the different shares is corroborated by an analysis of minimum and maximum values. The gap between the figures is sizeable for most firms; for instance, PEA recorded a drop of –51.38 per cent in one week and an increase of 37.20 per cent in another week during the 13-year period studied. Such a finding is not surprising since returns for emerging market securities typically exhibit a high level of volatility (Harvey, 1995). In addition, Table 2 highlights that sector influences affect the return series for the firms in the sample. For example, the banking shares, on average, were among the best performing firms with relatively low standard deviation values being recorded. By contrast, real estate shares were more volatile and had a higher risk on average.
Third, a visual inspection of the skewness and kurtosis for the firms being investigated reveals that, in most cases, the distributions of share returns were not normal; 33 of the 42 firms had skewness statistics that were statistically different from 0. Of these significant skewness statistics, 14 were negative and 19 were positive, suggesting that most of the firms’ returns series had a large tail of positive values. The kurtosis values are even more emphatic in confirming that the distribution of the returns series are non-normal; the values of this statistic for all the shares in the sample were more than twice their standard errors. This finding suggests that statistical tests, which are based upon the assumption of normally distributed data, may not be appropriate. Thus, care must be exercised when examining the outcomes of parametric tests and greater emphasis given to the trading rules results.
Descriptive Statistics


This research investigates the profitability of filter rules and compares the trading rule profits relative to a buy-and-hold strategy. The tests attempt to discover whether various filter rules can outperform a buy-and-hold strategy. If any filter strategy based on past information can generate excess returns relative to the naive buy-and-hold strategy then the weak form of the EMH is rejected and the market is inefficient. However, the weak form of the EMH is accepted if the returns from filter strategies are equal, or less than, those of the buy-and-hold strategy.
Ten different filter rules were investigated to test the weak form of the EMH for the KSE. These include filter sizes of 1.0, 2.0, 4.0, 6.0, 8.0, 10.0, 12.0, 14.0, 16.0 and 18.0 per cent. The filter sizes were chosen because (a) they have been used by other researchers who have investigated this topic in different countries (Fama & Blume, 1966; Fifield et al., 2005; Xu, 2010), (b) the small increments of either 1.0 or 2.0 per cent will be able to detect whether any patterns exist based on the magnitude of previous price changes in the data and (c) relatively few trades might be generated for filter sizes that are larger than 18.0 per cent. 12 The filter rule strategy suggests that a buy signal emerges when a share’s price increases by X per cent from the previous low. It recommends that the share is held until its price declines by X per cent from a subsequent high. Any price changes of less than X per cent are ignored (Fifield et al., 2005).
In implementing the filter rules, the assumptions proposed in Fifield et al. (2005, 2008) are followed. First, it is assumed that an investor always begins with a buy position; after a buy signal, the investor holds the security until a sell signal is generated. Following the sell signal, the investor sells the share and remains out of the market until a subsequent buy signal emerges. This process is repeated over the 13-year period analysed. Thus, the returns generated are calculated for all buy–sell transactions and compared with the profits from a corresponding buy-and-hold strategy which assumes that the investor buys the security on the first day and holds it in their portfolio until the last day when the investor sells the share. The returns from both filter rules and buy-and-hold strategies are calculated taking into consideration transaction costs of 0.1 per cent in the KSE. Second, each investor has a limited amount of funds so that all cash is invested at each buy transaction. Thus, no borrowing is allowed to purchase or sell securities. Third, profits generated from the rules are not assumed to be reinvested. Fourth, no short selling is allowed since this is not permitted in the KSE. In addition, multiple buys (sells) are not permitted; the purchase of security has to be followed by a sale before another purchase can be made. 13 Finally, any interest earned, when an investor is out of the market, is not considered in the analysis. Such assumptions make the study more realistic and bias the results against finding evidence of trading rule profitability.
Results of Filter Rules
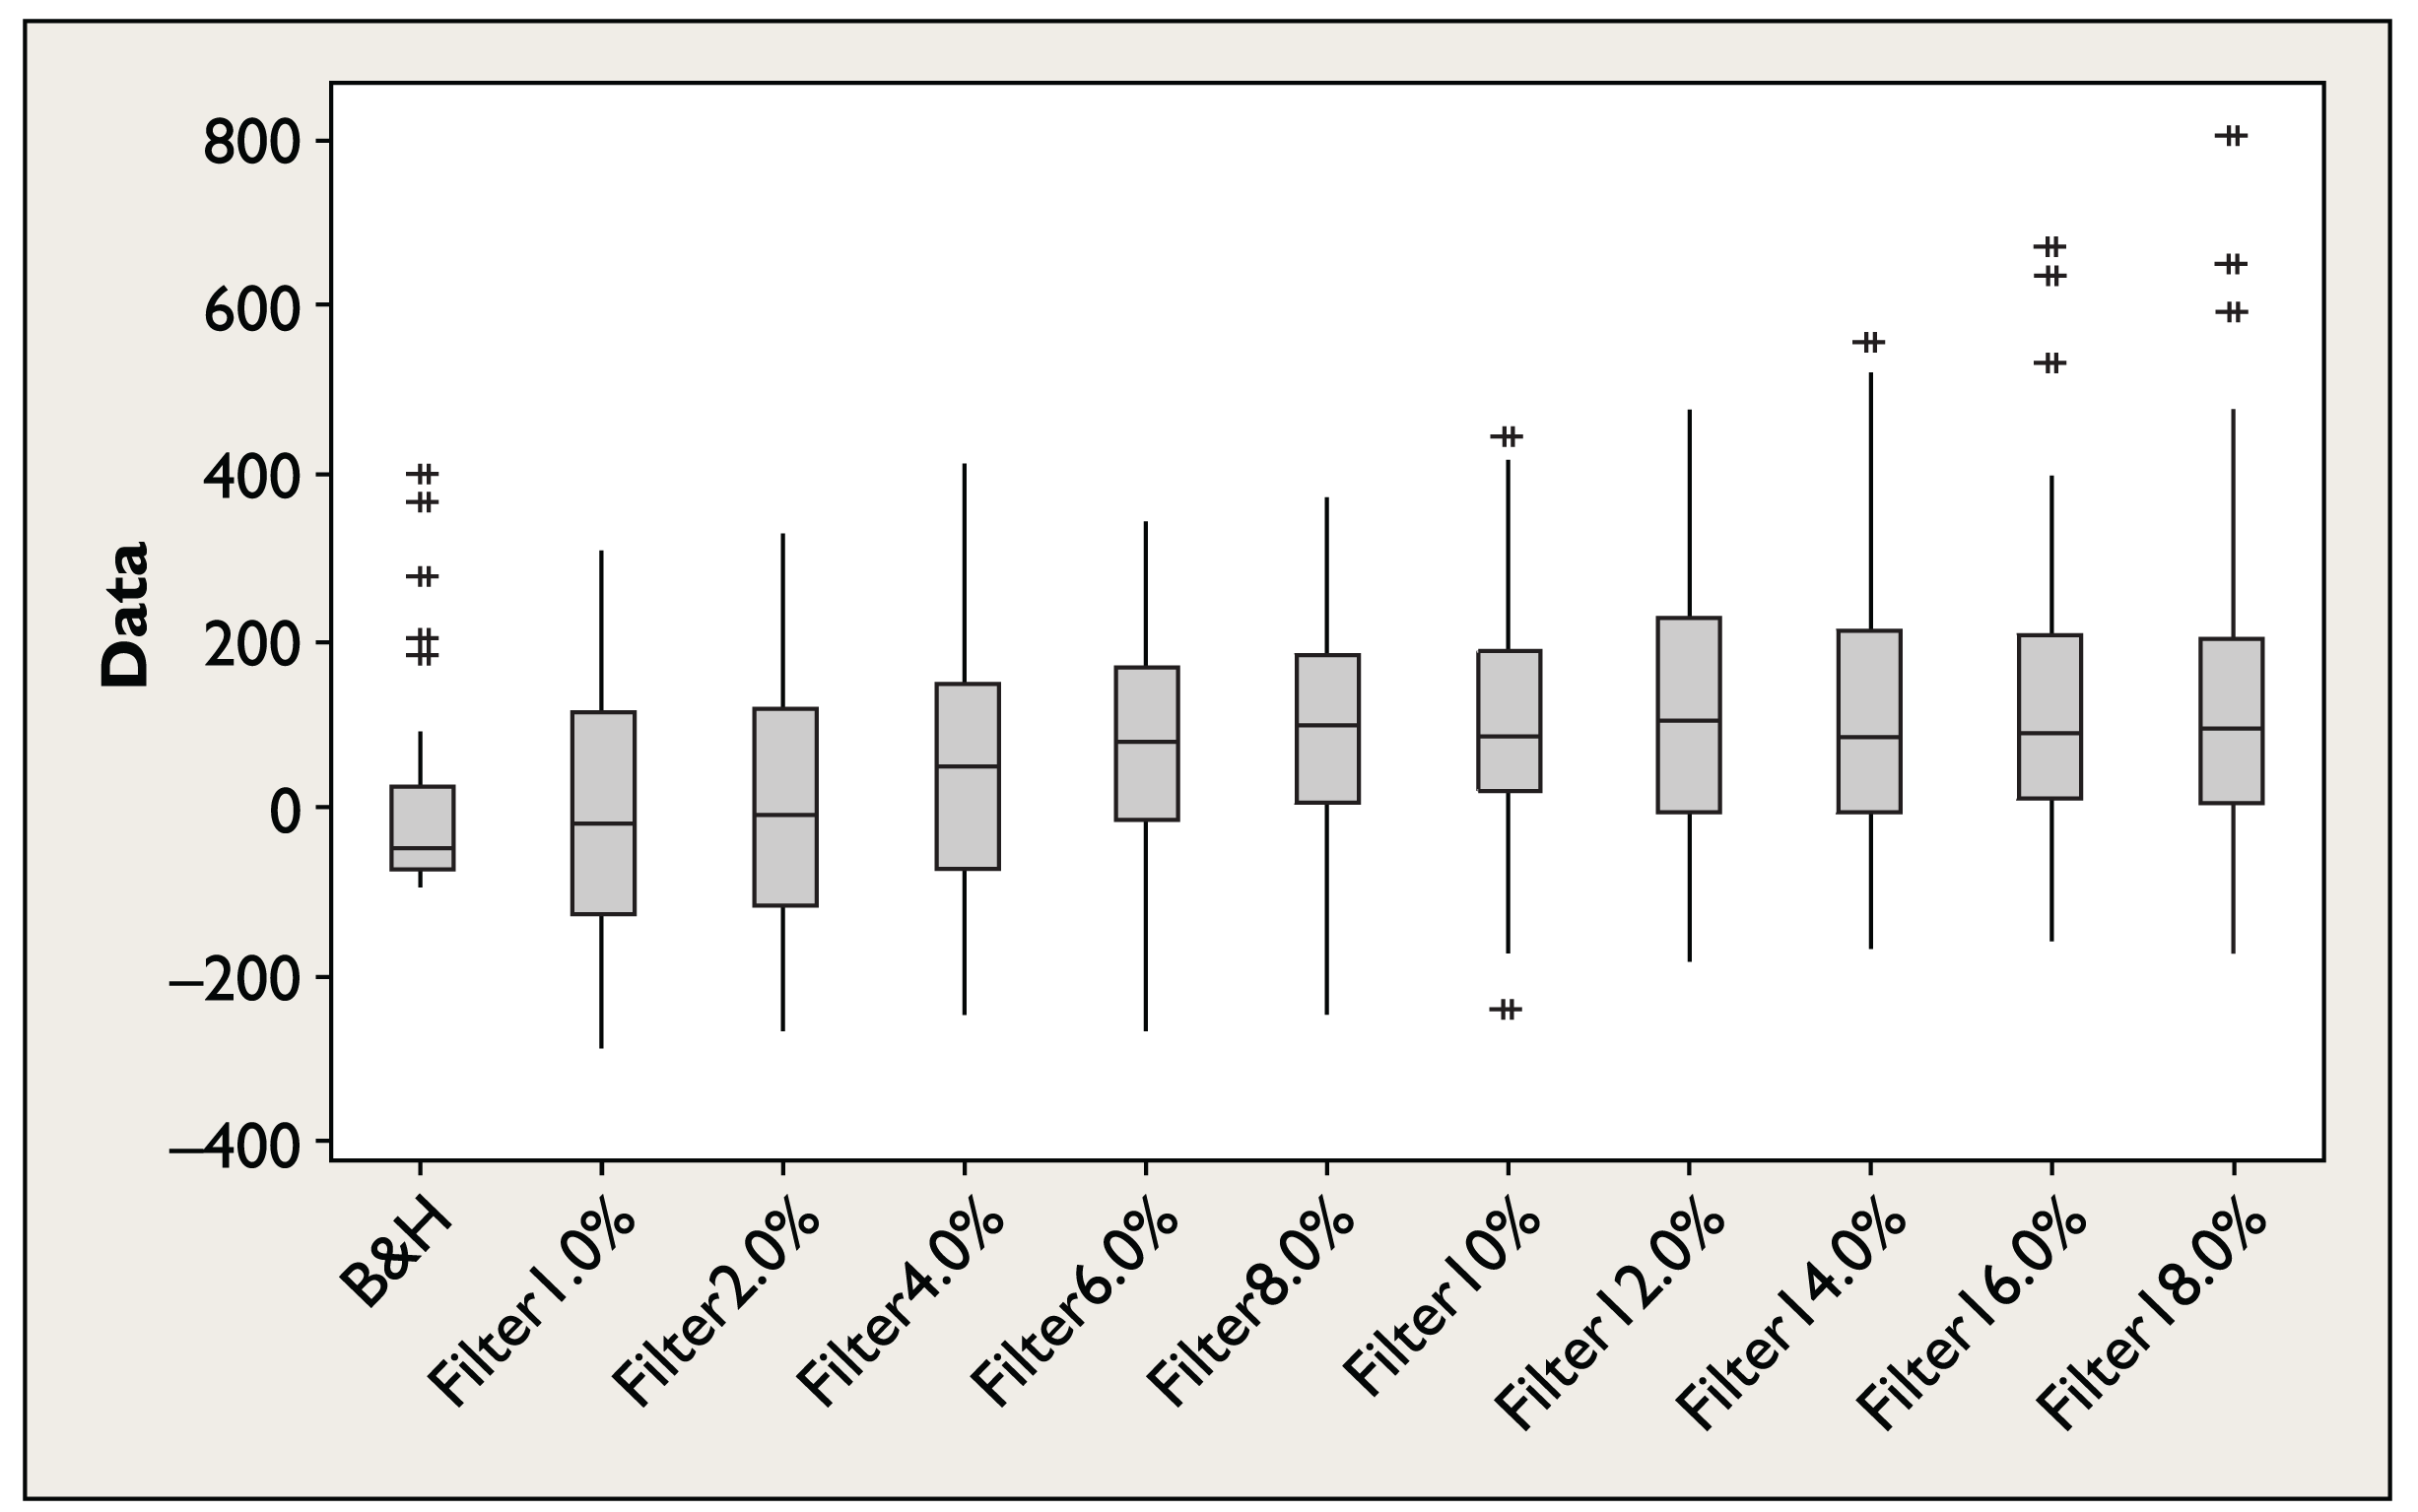
Table 3 and Figure 1 present the performances of the 10 filter rules and compare these with the profitability of the buy-and-hold strategy. 14 The profit figures for each filter rule and buy-and-hold strategy are reported after transaction costs of 0.1 per cent have been deducted. This commission fee was added to inject a measure of realism into the analysis and to overcome any criticisms of other studies in the substantive literature which have ignored the impact of transaction costs (Huang, 1995; Sweeney, 1988).
From Table 3, it appears that the buy-and-hold strategy achieved an average return of 0.20 per cent for all 42 firms in the sample; only 13 of the 42 shares achieved positive returns although the market witnessed an upward rise over the 13-year period studied. The findings from the buy-and-hold strategy reveal that large-size firms outperformed small- and mid-sized companies. For example, a passive investment in large firms such as NBK, CBK, ABK, KFI and TEL generated returns of over 180.0 per cent while small- and mid-sized companies reported gains which ranged from 3.5 per cent for SGC to 46.2 per cent for FAC; the majority (80.0%) of the large profitable firms were in the banking sector (NBK, CBK, ABK and KFI), which confirms the finding from the descriptive statistics that the banking industry was the most profitable among the various sectors in the KSE over the period investigated. Indeed, the vast majority of Kuwaiti banks (six out of the seven) achieved returns which ranged from a high of 398.3 per cent for the CBK to a low of 19.3 per cent for Gulf Bank of Kuwait (GBK). Moreover, an analysis of the results for other sectors shows that all firms in the real estate, the food and non-Kuwaiti sectors as well as most of the industrial and service sector companies recorded losses for the buy-and-hold strategy.
An analysis of the number of trades in Table 3 shows that, on average, the number of trades declines significantly as the filter size increases. For example, as the filter size rises from 1.0 to 18.0 per cent, the average number of trades generated by the filter rules decreases from 223.7 to 23.9. Therefore, an investor who followed the 18.0 per cent filter rule over the 11-year period studied would only have transacted about 24 times for each share. A more detailed investigation of the number of trades for the individual firms in the sample reveals that the 1.0 per cent filter for three firms (TEL, IPG and AGH) generated the largest number of transactions (262), while GBK was associated with the smallest number of transactions (4) when the 18.0 per cent filter rule was tested.
Filter Rule Results


A visual inspection of Table 3 shows that, when the difference between the rule profits and the buy-and-hold gains are compared, the differences are positive for 9 of the 10 filter rules. Indeed, all filter strategies except the small filter sizes (1.0%) outperformed their buy-and-hold counterparts in the KSE. 15 Such findings were different from the results reported by Al-Shamali (1989) and Fama and Blume (1966). Al-Shamali documented that profits from filter rules for Kuwaiti firms declined as the filter size increased. In the USA, Fama and Blume suggested that only small filters of 0.5 per cent outperformed their corresponding buy-and-hold strategies; possible reasons for this difference between the results of previous papers and the findings of the current study could be: (a) the market witnessed an upward trend over the 13-year period investigated and (b) large-sized filters generated higher returns relative to small-sized filters over the bullish market for the time period analysed.
Figure 1 provides a complete picture of the profitability of filter rules and the buy-and-hold strategy; the box plots of this figure show the distribution of profits (losses) of all filter rule sizes and the buy-and-hold strategy; it summarises the results of the filter rules. Overall, the results are similar to those in Table 3. However, a visual inspection of Figure 1 shows that none of the medians across the filter rules underperformed the buy-and-hold strategy which suggests that filter rules are more profitable than their buy-and-hold alternatives. Moreover, it appears that some outliers are present in the results which suggests that some shares generate enormous profits for most of the filter rules. For example, when the 18.0 per cent is employed, a firm such as IFI achieves profit of 801.7 per cent. Therefore, investors could have achieved incredible profits over the period 1998–2011, if they had implemented this filter rule.
A more detailed analysis of Table 3 shows that, on average, larger sized filters (12.0%, 14.0%, 16.0% and 18.0%) outperformed both medium-sized filters (6.0%, 8.0% and 10.0%) and small-sized filters (1.0%, 2.0% and 4.0%). Indeed, on average, the 18.0 per cent filter rule achieved the largest mean profit of 136.3 per cent while the 1.0 per cent filter recorded the largest loss of –7.0 per cent. In addition, the analysis illustrates that the number of firms that outperformed the buy-and-hold strategy increased significantly as the filter size rose except in the case of the 2.0, 8.0, 16.0 and 18.0 per cent filters. For instance, in the case of 22 firms, the 1.0 per cent filter outperformed the buy-and-hold strategy, in the case of 29 firms the 6.0 per cent filter was more profitable and for 36 of the 42 firms studied the 14.0 per cent filter outperformed the buy-and-hold alternative. Overall, in 68.3 per cent (287 out of 420 instances) 16 of the cases investigated, the filter rules outperformed the buy-and-hold approach, which suggests that patterns exist in the KSE. As a result, the filter tests indicate that the KSE may not be weak-form efficient since a trading strategy based on historic data outperformed the corresponding naïve trading tactic.
It is apparent from Table 3 that when the 1.0, 2.0, 4.0, 6.0, 8.0, 10.0 and 12.0 per cent filters are tested on bank shares, the buy-and-hold strategy dominates; this suggests that the banking sector is more efficient than other industries in the sample. For example, when the 1.0 per cent filter rule was tested for the CBK, it underperformed the buy-and-hold strategy by −435.1 per cent. The results of filter rules from other sectors appear to be successful in most cases. Finally, Table 3 highlights that some shares such as IFI, GCE and WAR achieved incredible returns for most of the filters investigated. For instance, when the 18.0 per cent filter rule was implemented for IFI, GCE and WAR, the buy-and-hold strategy underperformed by 880.3, 605.5 and 557.5 per cent, respectively. Thus, sizeable profits were available to investors who followed this technical approach over the period 1998–2011.
Analysis of Variance
A general linear model (GLM) was fitted to the data in order to explain any variance between those profits earned by filter rules and the returns achieved by the corresponding buy-and-hold strategy (Diffs). The purpose of this testing is to investigate whether any difference in profits (Rule-B&H) varied systematically from one sector to another of across different filter sizes or levels. The GLM also seeks to uncover whether any difference in profits is related to the size of the firms (the market capitalisation) analysed in the sample. In explaining the variance of any difference between those profits earned by filter rules and the returns achieved by the corresponding buy-and-hold strategy, the model took the form:
where Diffs j(s, r, m) is the difference between the returns generated by filter rules and the profits earned by the corresponding buy-and-hold strategy for company j in sector s for market capitalisation m; µ is the overall mean for the difference between the filter rule profits and the buy-and-hold strategy for all firms across the rules, αs is the main effect for sector and βr is the main effect for the filter’s size. (αβ) sr is the interaction effect for sectors and the rule’s size; this allows for the possibility that the profitability of rules may vary across sectors for different rule characteristics. Finally, αm is the regression coefficient for the market capitalisation.
Table 4 shows that the model was capable of explaining approximately 22.08 per cent (R2) of the variation in profit differences. A visual inspection of Table 4 shows that there is very strong evidence of differences in profitability between rules (F = 3.35, p = 0.001) and between sectors (F = 6.02, p < 0.0005); these main factors are statistically significant since the F-ratios are large and the p-values are less than 0.05. However, there is no evidence that the rules behave differently in different sectors; the interaction term had an F-ratio of only 0.26 with a p-value of 1.000. Thus, no single filter consistently outperformed the buy-and-hold strategy in different sectors. 17
Analysis of Variance (ANOVA) of the Difference Between Filter Rule Returns and the Profits of the Buy-and-hold Strategy

The analysis suggests that selecting the filter size is extremely important for determining the overall profitability of the trading strategy. Not surprisingly, this result is consistent with the substantive literature which argues that the selection of an appropriate filter size influences the success of the filter strategy (Huang, 1995). For example, Huang found that, of the 24 filters tested, filters sizes, ranging from 4.5 to 18.0 per cent, outperformed the buy-and-hold strategy once transaction costs were considered, whereas filters below 4.5 per cent did not. Such a finding is consistent with the results in the fourth section which indicated that larger sized filters (12.0%, 14.0%, 16.0% and 18.0%) outperformed both medium- (6.0%, 8.0% and 10.0%) and small-sized filters (1.0%, 2.0% and 4.0%). Table 3 shows that the difference in profits achieved by the filter rules increased as the filter size rose. Further, all filters, except the 1.0 filter size, outperformed their buy-and-hold counterparts. 18 Indeed, on average, the small-sized filters (1.0%, 2.0% and 4.0%) recorded the lowest returns of 11.7 per cent; medium-sized filters (6.0%, 8.0% and 10.0%) achieved returns of 79.6 per cent while the larger sized filters (12.0%, 14.0%, 16.0% and 18.0%) recorded the largest returns of 121.88 per cent. In addition, an inspection of the results shows that the banking industry is the only sector which consistently achieves losses when filter trading strategies are implemented. For example, this sector achieved large losses, on average, of approximately –15.6 per cent from the various filters tested. Such a conclusion corroborates the findings in the fourth section which suggested that shares in the banking sector were the most efficiently priced amongst the securities traded on the KSE. Finally, the investigation shows that there was no significant association between differences in filter rule profitability and firm size as measured by market capitalisation (F = 2.06, p = 0.152).
Conclusion
This study employs 10 filter rules to test the weak form of the EMH for the KSE over the 13-year period (1998–2011) for 42 firms listed in the KSE. The analysis showed that the KSE was not weak-form efficient because patterns and trends were present in the share prices; individuals who had followed filter strategies based on past price information could have made profits.
Further, the profitability of the technical trading rules shows that transaction costs of 0.1 per cent in Kuwait have no impact on the performance of filter rules. This finding is very different from the conclusion reached by studies such as Fama and Blume (1966) and Tijjani (2008) who believed that transaction costs eliminated a lot of gains achieved by trading rules. One explanation for this difference is that the level of transaction costs imposed by the KSE is very small. The findings from the sectoral analysis suggest that securities in the banking industry are the most efficiently priced amongst the shares traded on the KSE. One possible justification for this finding is that the level of transparency and disclosure is much higher for banks relative to other industries analysed in the sample.
Therefore, the results are consistent with the substantive literature which has argued that emerging stock markets are informationally inefficient, such as Fifield et al. (2005, 2008) and Xu (2010). In particular, the current findings also confirm the results from the early studies of Al-Shamali (1989) and Al-Loughani and Moosa (1999) that looked at trading rules for the KSE and found that trading strategies could exhibit patterns in share price changes. This study might assist policymakers in the state of Kuwait with understanding the context of the KSE; it might, therefore, lead them to introduce regulatory changes which could improve the level of the efficiency of the KSE.
Future research of the KSE could use new listed companies, focus on daily data and investigate the performance of a wider range of statistical and non-statistical tests. In order to facilitate future research in this area, a comprehensive database of high-frequency share price information is needed so that future researchers do not have to spend time gathering information about stock splits and share dividends before manually adjusting the returns earned by firms. Further, a methodical data capture system is needed which records the closing price of every share each day so that the academics might have confidence in the dataset being analysed.
Footnotes
Acknowledgements
This study was funded by the Public Authority for Applied Education & Training—Kuwait/Research Grant No. BS-12-07.