



Abstract
We provide a unique longitudinal analysis into firm-level multinationality of Chinese firms between 2002 and 2012 using two measures of multinationality—the Aggarwal, Berrill, Hutson and Kearney (2011, International Business Review, 20, 557–577) system and foreign sales as a percentage of total sales. We find that Chinese firms have low levels of multinationality with most foreign sales in the triad regions of Asia, Europe and North America. We use mean variance spanning tests to investigate the benefits from investing in Chinese multinational corporations (MNCs). We find that Chinese MNCs offer little diversification benefits to domestic investors and firms with greater multinationality levels do not result in greater benefits.
Introduction
The literature defines internationalisation as a process through which a firm increases its level of involvement in foreign markets (Welch & Luostarinen, 1988), and traditionally considers it as a series of events that take place over time (Johanson & Vahlne, 1990; Leonidou & Katsikeas, 1996). The existing theories of firm-level internationalisation, together with the many patterns of internationalisation that are traced by firms of different age, size, industry and home country, suggest that there is no standard or optimal path of international expansion (Buckley & Chapman, 1997; Fillis, 2001).Whether firms internationalise slowly accor-ding to one or more of the stages theories of internationalisation, or rapidly according to International New Venture Theory, the common dimension is time. It seems surprising, therefore, that there have been so few longitudinal studies of firm-level internationalisation. Contractor (2007) and Hennart (2007) suggest that international business researchers should diversify away from an almost exclusive reliance on cross-sectional data and embrace longitudinal studies as the best approach to achieve a more complete understanding of the evolution of the multinational corporation (MNC). Glaum and Oesterle (2007) advocate the benefits of a longitudinal approach on the relation between firm-level multinationality and performance, and Brouthers and Hennart (2007) and Canabal and White (2008) suggest that longitudinal data should be used in studies of entry mode. More recently, Casillas and Acedo (2013) call for the introduction of time into studies of the internationalisation process.
We conduct a unique longitudinal analysis on the patterns of internationalisation for 300 Chinese firms over an 11-year period from 2002 (when China joined the World Trade Organisation [WTO]) to 2012. We use two measures of internationalisation—the classification scheme for firm-level multinationality introduced by Aggarwal et al. (2011) (hereafter ABHK) and foreign sales as a percentage of total sales. In ABHK’s model, firms are classified on the basis of the breadth of international engagement across six regions that encompass all countries of the world: Africa, Asia, Europe, North America, Oceania and South America. We classify firms into seven categories ranging from domestic to global, according to the location of their sales. We test the robustness of this technique using foreign sales as a percentage of total sales. We find that the two measures of internationalisation are not always consistent with each other, and capture different aspects of the degree of internationalisation of a firm. A high level of foreign sales, for example, does not necessarily mean that firms are operating across a wide geographic scope. We categorise firms using each measure in each year and examine how they change over the 11-year sample period. This gives us a unique perspective on changing patterns of internationalisation over time.
The benefits of international portfolio diversification have long been highlighted throughout the literature (Driessen & Laeven, 2007; Levy & Sarnat, 1970; Solnik, 1974). Despite these benefits, a home-biased attitude to international portfolio investment continues to exist (Ahearne, Griever, & Warnock, 2004; Suh, 2005). Possible explanations include transaction costs, taxes, information asymmetries, currency risk, legal restrictions, political risk and other controls. One explanation is that investors may be able to indirectly gain foreign exposure by investing in domestically traded products (Antoniou, Louse, & Paudyal, 2010; Errunza, Hogan, & Hung, 1999). A subset of this literature investigates the role that MNCs have to play in this regard. We investigate the international portfolio diversification benefits from investing in various categories of Chinese firms, using weekly data and mean variance spanning (MVS) tests. We also break our sample into three sub-periods—pre-crisis period, crisis period and post-crisis period.
We make several contributions to the literature. First, we provide a unique longitudinal analysis into firm-level multinationality in China. This is of particular relevance as most studies on firm-level multinationality focus on developed markets, mainly the USA, at one point in time. To date, comparatively less work has been done for emerging markets such as China. China represents an interesting market for analysis given its transfer from an autarkic economy to an advocate of globalisation and its well-documented economic growth. Second, we analyse the home-based diversification effect of MNCs from an emerging market perspective and test to what extent Chinese investors can reap the benefits of internationalisation by investing in home-based MNCs in comparison with direct international portfolio diversification. Institutional investors in countries such as China are often restricted by their governments to invest only in domestic markets (Driessen & Laeven, 2007) and can only access limited benefits by direct investment in foreign stock markets. China’s regulations allow only Qualified Domestic Institutional Investors (QDII) to invest directly in foreign markets. Therefore, this issue is of particular importance to China.
Our main findings are as follows. We find that Chinese firms tend to have low levels of multinationality using both of our measures and we find little evidence of increasing levels of multinationality over time. We find that the USA and EU are the largest exporting targets of Chinese firms, but sales to these two regions declined in recent years. In contrast, domestic sales and sales to developing regions such as Asia and Africa increased. Our MVS tests show that there are benefits to international portfolio diversification for Chinese investors, but Chinese MNCs do not yield significant benefits. Firms with lower levels of multinationality provide greater diversification benefits, which seems counter-intuitive. The best performing groups of firms are those with sales in two geographical regions (classified as T2) and foreign sales less than 5 per cent. These small benefits are reduced during the crisis period. Other categories of firms yield little diversification benefits.
The remainder of this article is structured as follows. The second section provides a review of the literature. The third section presents the data and methodology. The fourth section reports the empirical results. Finally, the fifth section concludes.
Literature Review
Our analysis contributes to two literatures—the regionalisation versus globalisation debate on firm-level activities and the topic on whether MNCs provide international portfolio diversification benefits. The extent to which firms are regional or global in their activities is a source of much debate within the literature. Although many international business scholars such as Yip (2002) and Govindarajan and Gupta (2008) argue that global business strategy is paramount, others such as Ghemawat (2001, 2003) argue the case for semi-global strategy, pointing to escalating costs of internationalising over greater geographical and cultural distances. Doremus, Keller, Pauly and Reich (1998) argue that we have not achieved anything remotely close to full globalisation, that state sovereignty remains strong and that the world’s largest MNCs retain a national and regional focus.
Rugman (2000, 2003, 2005), Rugman and Brain (2003), Rugman and Girod (2003), Rugman and Hodgetts (2001), Rugman and Verbeke (2003, 2004, 2007, 2008), Collinson and Rugman (2008) and Rugman and Oh (2010) argue the case for the regional dimension in international business and strategy. Rugman and his co-authors base their analysis on the triad regions of North America, Europe and Asia-Pacific (Ohmae, 1985; Rugman, 2003). They conclude that most of the world’s largest MNCs are regional rather than global, that globalisation is a myth and that regional rather than global strategy is paramount in international business. The evidence assembled by Rugman and his co-authors in favour of regionalisation rather than globalisation of the world’s largest firms has been scrutinised by Aharoni (2006), Osegowitsch and Sammartino (2007, 2008), Dunning, Fujita and Yakova (2007), Asmussen (2008) and Berrill (2015). These researchers have introduced refinements to the data analysis to show that the evidence in favour of regionalisation is not overwhelming, and they have questioned the extent to which it implies that global strategy is a myth.
Furthermore, the issue on whether MNCs indirectly provide the benefits from portfolio diversification remains unresolved in the literature. Early research by Hughes, Logue and Sweeney (1975), Agmon and Lessard (1977), Mikhail and Shawky (1979) and Logue (1982) concluded that investing in MNCs does indeed yield international diversification benefits, and more recent work by Errunza et al. (1999), Cai and Warnock (2004), Antoniou et al. (2010) and Berrill and Kearney (2010) supports these earlier findings. Errunza et al. (1999), for example, find that MNCs can be a part of domestic portfolio that is able to mimic foreign index returns for US investors. Berrill and Kearney (2010) conclude that MNCs can provide diversification benefits for all G7 countries. The issue is far from settled, however, because work by Jacquillat and Solnik (1978), Senchack and Beedles (1980), Brewer (1981), Fatemi (1984), Michel and Shaked (1986), Kim and Lyn (1990), Mathur, Singh and Gleason (2001), Wright and McCarthy (2002), Salehizadeh (2003) and Rowland and Tesar (2004) has all found that investing in MNCs does not yield significant international diversification benefits. Wright and McCarthy (2002) argue no benefits are available for Australian investors. Rowland and Tesar (2004) show the result differs in G7 countries and only Germany and the USA see substantial diversification benefits provided by MNCs. Thus, the issue is far from being settled.
This lack of agreement may be due to the different methods used to create MNC samples in the literature. For example, Michel and Shaked (1986) categorise MNCs as foreign sales above 20 per cent of revenue and direct capital investment at least six countries outside the USA. Mathur et al. (2001) define MNCs as companies that have foreign assets and sales. Errunza et al. (1999) use the 30 largest US companies in the Fortune 100 list, making the implicit assumption that large firms must be multinational. Aggarwal et al. (2011) highlight this issue and propose a classification system for firms which we apply in our analysis.
Data and Methodology
Data
Our sample data contain the 300 constituent firms from the China Shanghai Shenzhen 300 Index (Hushen 300 Index). This index includes stocks listed in China’s two main exchanges, Shanghai and Shenzhen. We gather data on the geographical breakdown of each constituent firm’s sales in this index for each year between 2002 and 2012 (11 years) from Datastream. We also obtain the percentage of foreign sales of each firm in each year and weekly closing share price data from 4 January 2002 to 28 December 2012. We use the 3-month deposit rate as the risk-free rate of return 1 . Weekly data on the MSCI World Index, the S&P500 Index and the Chinese Hushen 300 Index are also used.
We first categorise each firm in terms of its internationalisation using the Aggarwal et al. (2011) (ABHK) classification system. Following ABHK, we divide the world into six regions: Africa, Asia, Europe, North America, Oceania and South America. We give each firm a score in each year based on the location of its sales. If a firm has no foreign sales, it is given a score of 0 (domestic); if it has sales outside China but only in Asia, it is given a score of 1 which we classify as being regional; if it has sales in Asia plus one other of our six regions, it receives a score of 2 (T2, trans-regional 2); if it has sales in Asia plus two other continents, it receives a score of 3 (T3, trans-regional 3) and so on for T4 and T5 to a maximum score of 6 (global), which indicates that a firm has sales in all six regions. A more detailed description of this classification system is contained in Aggarwal et al. (2011). In addition to the ABHK model, we use foreign sales as a percentage of total sales as an alternative measure of internationalisation.
We believe that the use of these two measures of internationalisation provides a robust approach to capturing the various divergent aspects of firm-level internationalisation. Our first measure, the ABHK model, captures the breadth of internationalisation but takes no account of the level of internationalisation. A firm is classified as T5 if it has sales in five regions of the world, but the percentage of foreign sales may differ significantly between firms. For example, in 2011, CSG Holding is classified as T5 using the ABHK model but has only 23 per cent foreign sales. China CSSC Holding is also classified as T5 and has 80 per cent foreign sales. The use of an additional measure will help to distinguish between these two firms. The percentage of foreign sales gives an accurate measure of the total level of multinationality but does not give any information about where those sales occur. A Chinese firm, for example, may have a high percentage of foreign sales but those sales may be spread across many countries or all occur in a neighbouring country. For example, in 2011, Yanzhou Coal Mining has 19 per cent foreign sales spread across Australia, Canada and ‘rest of the world’. Huaneng Power has 16 per cent foreign sales but they all occur in Singapore. The use of two measures of internationalisation helps distinguish between these two firms and provide measures of both the breadth and total level of multinationality.
Mean Variance Spanning Tests
Several methods are available to measure the extent to which MNCs provide international portfolio diversification benefits. These include using the international market model to investigate the influence of domestic and foreign market indexes on individual shares (Agmon & Lessard, 1977; Brewer, 1981; Hughes et al., 1975); comparing the risk-adjusted performance of MNCs and domestic firms; comparing firms on the basis of returns, standard deviations, betas, coefficient of variation and performance measures, such as the Sharpe, Treynor and Jensen measures (Fatemi, 1984; Jacquillat & Solnik, 1978; Michel & Shaked, 1986; Mikhail & Shawky, 1979; Senchack & Beedles, 1980); and more recently, MVS tests (Berrill & Kearney, 2010; Errunza et al., 1999; Rowland & Tesar, 2004).
Following the MVS methodology of Huberman and Kandel (1987), De Roon and Nijman (2001) and Kan and Zhou (2012), we consider a set of K benchmark assets and N test assets, and we investigate whether, conditional on the K benchmark assets, the addition of the N test assets can shift the mean variance efficient frontier. Alternatively, conditional on the K+N benchmark and test assets, can the subset of K benchmark assets yield the same diversification benefits? In other words, we are interested in whether the K benchmark assets ‘span’ the extended set of K+N assets. To do this, we define R1,t as the K×1 vector of returns on the K benchmark assets and R2,t as the N×1 returns on the N test assets at time t, and we combine R1,t and R2,t in the K+N vector
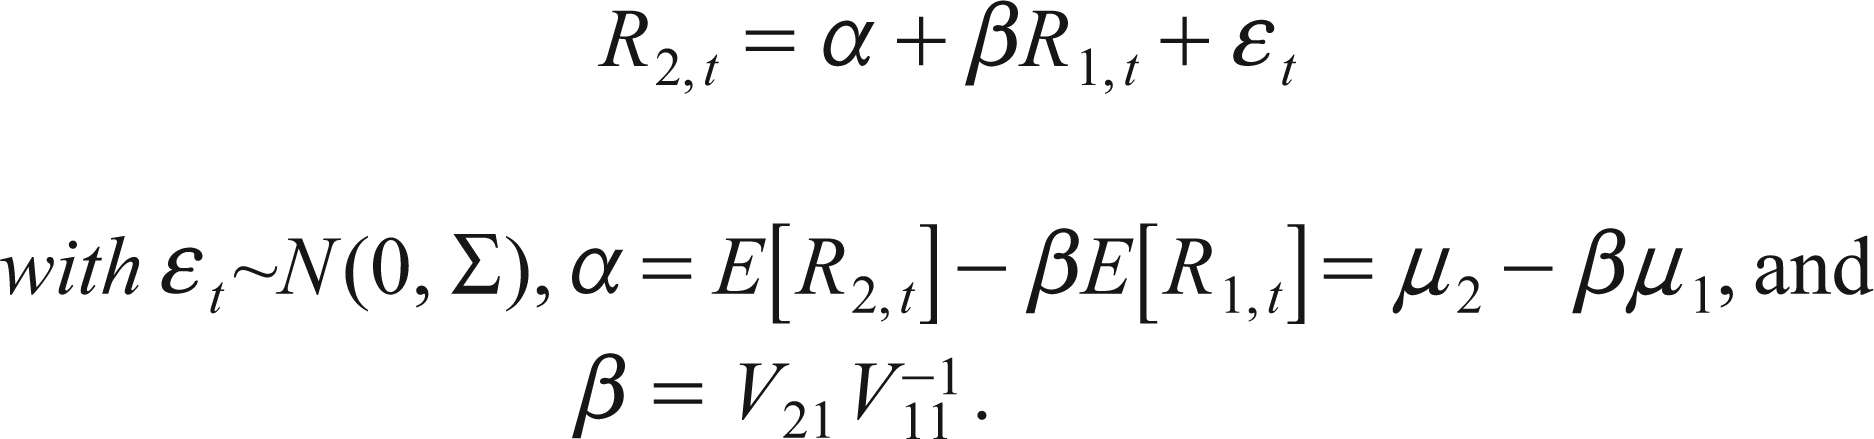
We estimate Equation (1) using ordinary least squares. The null hypothesis is that the benchmark portfolio spans the extended portfolio comprising the benchmark assets and the test assets, implying that the mean variance frontiers coincide at all points. Testing whether the K benchmark assets span the broader set of K+N assets amounts to testing the joint hypothesis that α = 0 and β = 1. If this hypothesis is upheld, it implies that for every test asset, we can obtain a portfolio of the K benchmark assets that has the same expected return (because α = 0 and β = 1) and a lower variance (because R1,t and εt are uncorrelated while Var(εt) is positive definite).
We also perform a two-step Wald test (Kan & Zhou, 2012), whereby we first test whether α = 0, and we then test whether β = 1 conditional on α = 0. If we reject the null hypothesis of spanning due to the first test, the tangency portfolios are different, and if we reject due to the second test, the global minimum variance portfolios are different. If the null hypothesis of spanning is rejected, we measure the economic significance of the diversification benefits by changes in the Sharpe ratios between the K benchmark assets and the K + N assets. Different Sharpe ratios indicate that investors can improve their risk-return trade-offs by investing in the additional assets.
In order to test the robustness of our results to the financial crises, we divide our sample period into three sub-periods. 2 We use two methods to establish sub-periods for our analysis—the Chow (1960) test and the Bai–Perron (1998) test. Both tests confirm a break point in the data on 19 October 2007. The Chow test further indicates a break point on 7 August 2009. Therefore, we divide our sample period into the following three subsamples—pre-crisis (4 January 2002 to 19 October 2007), crisis (19 October 2007 to 7 August 2009) and post-crisis (7 August 2009 to 31 December 2012) and repeat our analysis for each sub-period.
Longitudinal Analysis of Firm-level Multinationality
We begin by analysing changing patterns of multinationality for our sample firms between 2002 and 2012. We use two measures of multinationality—the multinational classification system proposed by Aggarwal et al. (2011) and foreign sales as a per cent of total sales. Table 1 shows that the average foreign sales for the 11-year sample period were 11.98 per cent. It is more than quadrupled from 4.67 per cent in 2002 to 18.32 per cent in 2012, with the largest increases in 2003 (from 4.67% to 12.83%) and 2012 (from 11.40% to 18.32%). These increases are likely the result of China’s decision to join the WTO in 2002 and measures introduced to stimulate foreign trade in 2012. 3 The percentage of foreign sales fell in 2007 and 2008, likely as a result of the financial crisis. However, despite the overall increase in average foreign sales percentages, the majority of sales continue to lie in the domestic market, with domestic sales percentages ranging from 96.37 per cent in 2002 to 83.14 per cent in 2012.
Foreign Sales Analysis

Foreign Sales Analysis
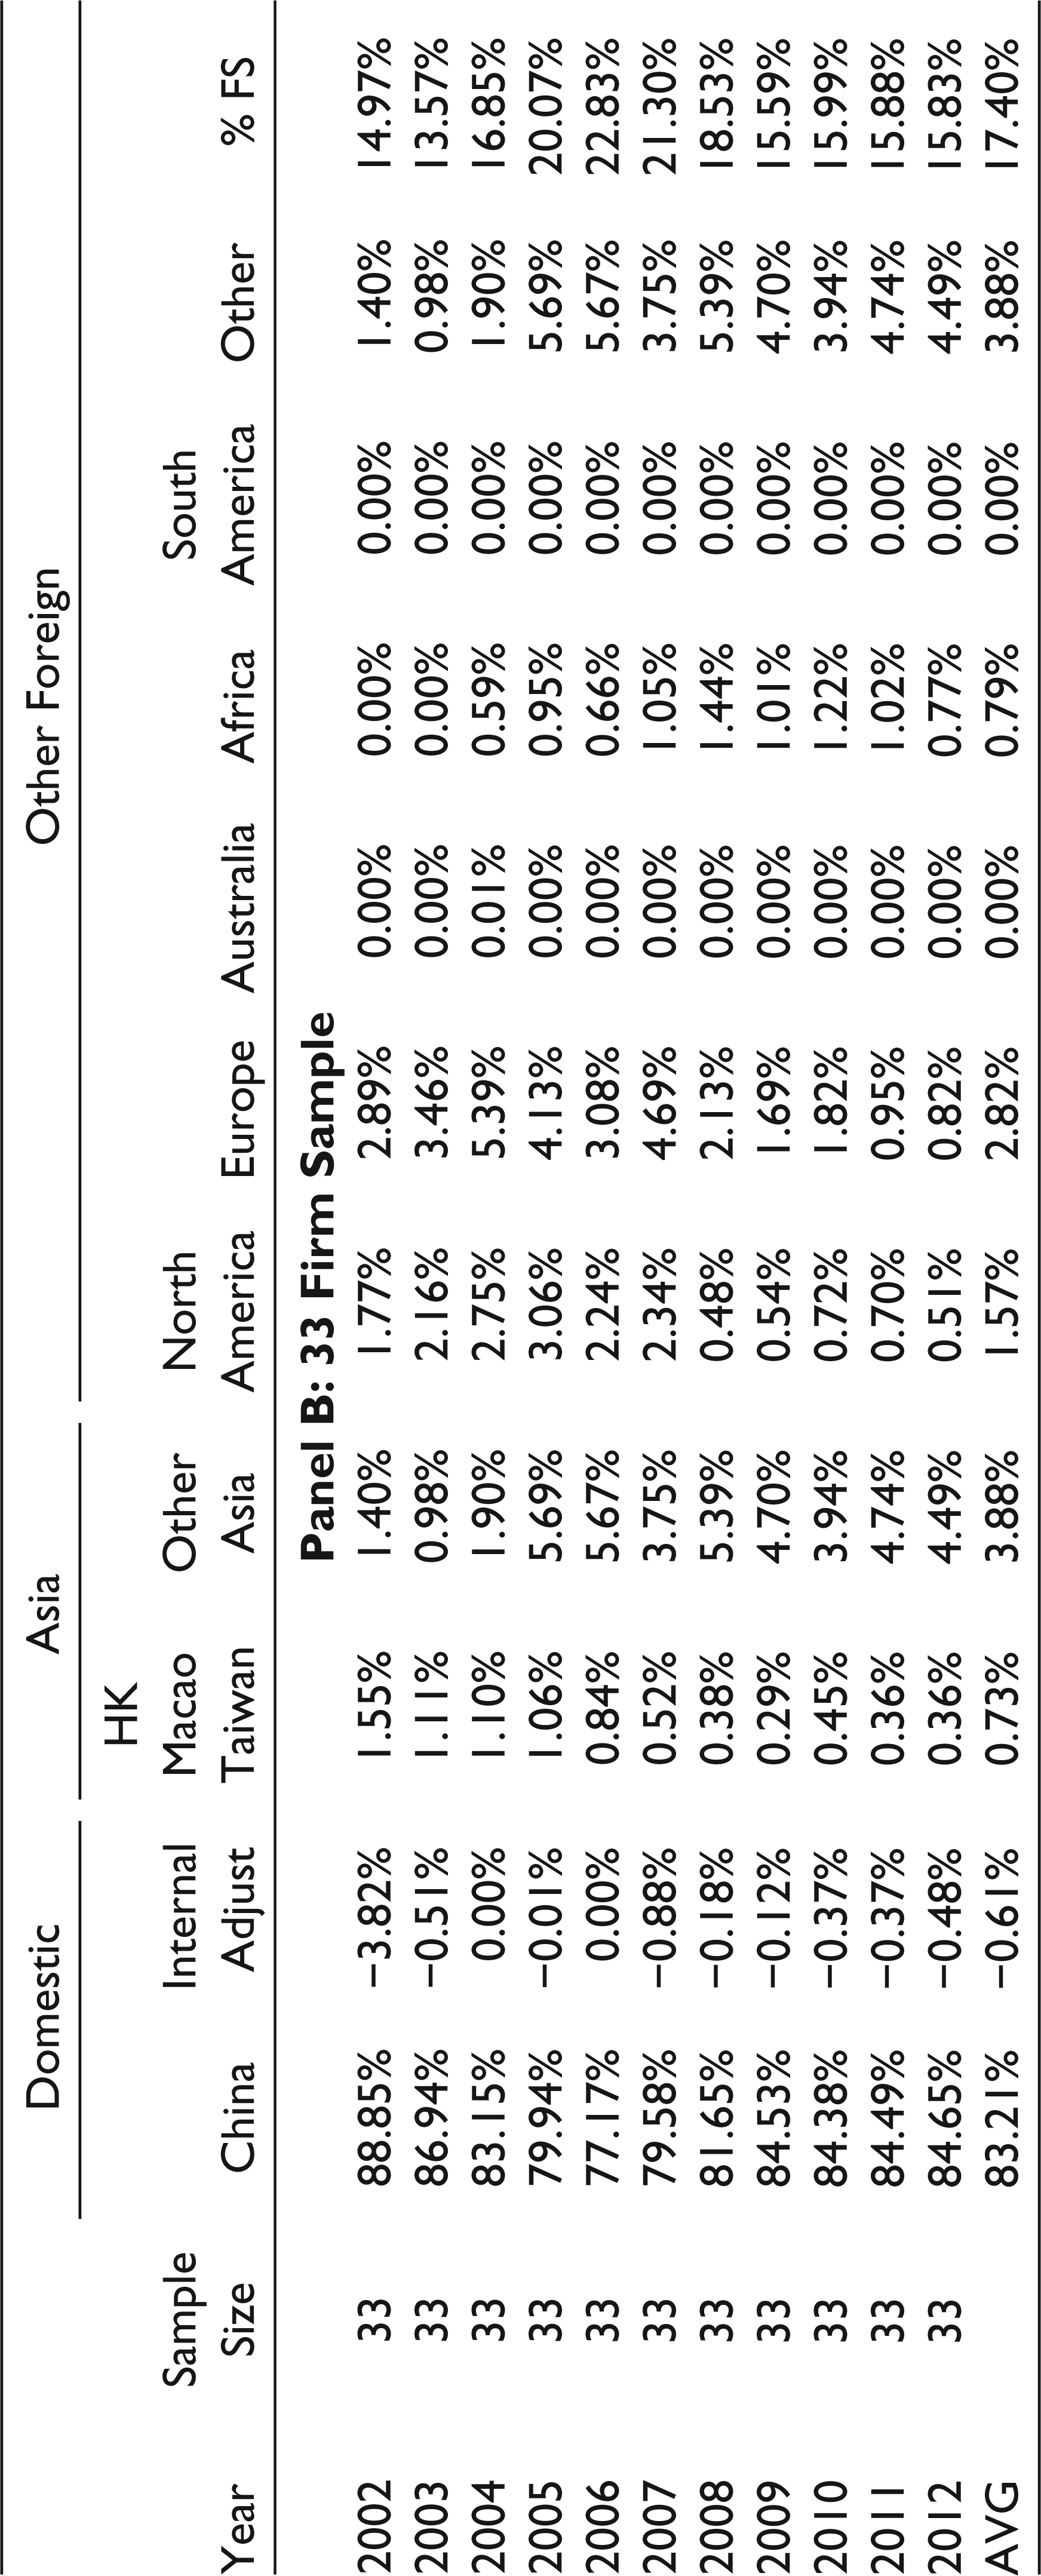
The geographical breakdown of foreign sales in Table 1 shows that Asia accounts for the largest proportion of foreign sales (2.49% on average), followed by Europe (1.10%) and North America (0.68%). Africa accounts for 0.15 per cent of foreign sales on average, Australia for just 0.01 per cent while no foreign sales are reported in South America in any year. The proportion of foreign sales categorised as ‘Other’ increased dramatically from 2.08 per cent in 2002 to 16.97 per cent in 2012 4 . Foreign sales to Europe and North America show similar trends with both increasing between 2002 and 2004, and hitting a maximum value in 2004 (3.20% for Europe and 2.23% for North America) but sales to both regions have fallen since then and in 2012 stand at 0.21 per cent for Europe and 0.10 per cent for North America.
In order to test the robustness of our results, we create a second sample of firms including only those that report a geographical sales breakdown in each year of our sample—33 firms. Results are presented in Panel B of Table 1. For these 33 firms, the average foreign sales figure is 17.40 per cent. The average percentage of domestic sales is 83.21 per cent. Both samples show that the subprime crisis had a negative effect on China’s foreign sales levels. The two sample groups show similar trends until 2012, where sample 1 shows a dramatic increase that is not matched in sample 2. This may indicate that the increase in China’s foreign sales largely results from the rising number of MNCs rather than deepening in foreign sales of existing MNCs. The results from sample 2 again show that most foreign sales lie in Asia, Europe and North America. The last decade witnessed a stable increase in sales to Africa each year. Moreover, the results from this smaller sample also show that sales to Europe are higher than those to North America in each year, and sales to both regions increased rapidly at the start of the sample period but later slowed down and fell in more recent years.
We next use the Aggarwal et al. (2011) system to categorise all firms into seven categories in Table 2, ranging from domestic to global. The number of domestic firms doubled from 30 in 2002 to 60 in 2005 but fell to 52 in 2012. The percentage of domestic firms increased in 2004 and 2005 but fell in every other year. The percentage of domestic firms almost halved over the sample period from 61.22 per cent in 2002 to 32.91 per cent in 2012. No firms were categorised as regional until 2006. In 2006, two firms were classified as regional and this figure increased to five (3.16%) in 2012. This finding is in line with previous research which finds little evidence in favour of the regionalisation of firms (refer, e.g., Rugman & Verbeke, 2004, 2008).
ABHK Classification of Firms


Most firms in our sample are classified as T2, with the number and percentage of firms in this category increasing each year. However, for all other categories (R, T3, T4, T5, G), the figures and percentages are extremely low with no obvious increase during the sample period. This suggests a pattern of internationalisation whereby Chinese firms tend to expand into one other geographical region but tend not to expand any further. It may suggest that Chinese firms are at an early stage of international expansion. The classification shows a lack of multinationality of China’s firms. According to Xing (2003), this is likely because of high state involvement in many firms and the fact that many macro-management regulations hinder the progress of globalisation. Firms face strict controls in raising funds for foreign investing, which requires layers of approval. We conclude that the increase in China’s foreign sales level is mostly ascribed to the rising number of low-level MNCs (T2) rather than increasing foreign sales for existing firms. Results from our smaller 33 firm samples support this hypothesis.
We use several MVS tests to investigate the extent to which Chinese investors can gain the benefits of internationalisation via investing in Chinese firms. We first test the benefits of international diversification using the Hushen 300 Index as the benchmark portfolio and the MSCI World Index as the extended set. The MVS tests confirm that benefits exist at the 5 per cent significance level, although adding the MSCI World Index into Chinese assets does not yield a higher Sharpe ratio. When the sample period is broken down into our three subsamples, results show that there are benefits to international diversification in the pre- and post-crisis period (Sharpe ratio increases of 5.38% and 143.35%, respectively), but no benefits during the crisis period.
We focus our analysis on an investigation into the extent that Chinese investors can gain international diversification benefits by investing in home-based MNCs. In our tests, Chinese domestic firms form the benchmark portfolio with various categories of multinational firms (regional, trans-regional and global) forming the extended sets. We estimate Equation (1) and test the robustness of our results using both market value and equally weighted indices. We do not allow short sales in our analysis given that China’s Law of Securities Regulation does not allow the short selling of shares 5 . Results in Panel A of Table 3 show that Chinese MNCs yield almost no additional benefits to domestic investors. For the market value weighted regressions, the null hypothesis of spanning is rejected for all time periods, indicating that portfolios of MNCs shift the efficient frontier of domestic firms. However, there is almost no improvement in the Sharpe ratios with the exception of a 0.57 per cent increase in the pre-crisis period. Using the equally weighted data, we fail to reject the hypothesis of spanning for all periods. Thus, there is no benefit to adding MNCs to a portfolio of purely domestic firms for Chinese investors. These results support the findings of Wright and McCarthy (2002), Salehizadeh (2003) and Rowland and Tesar (2004) who all find that investing in MNCs does not yield diversification benefits albeit in developed markets.
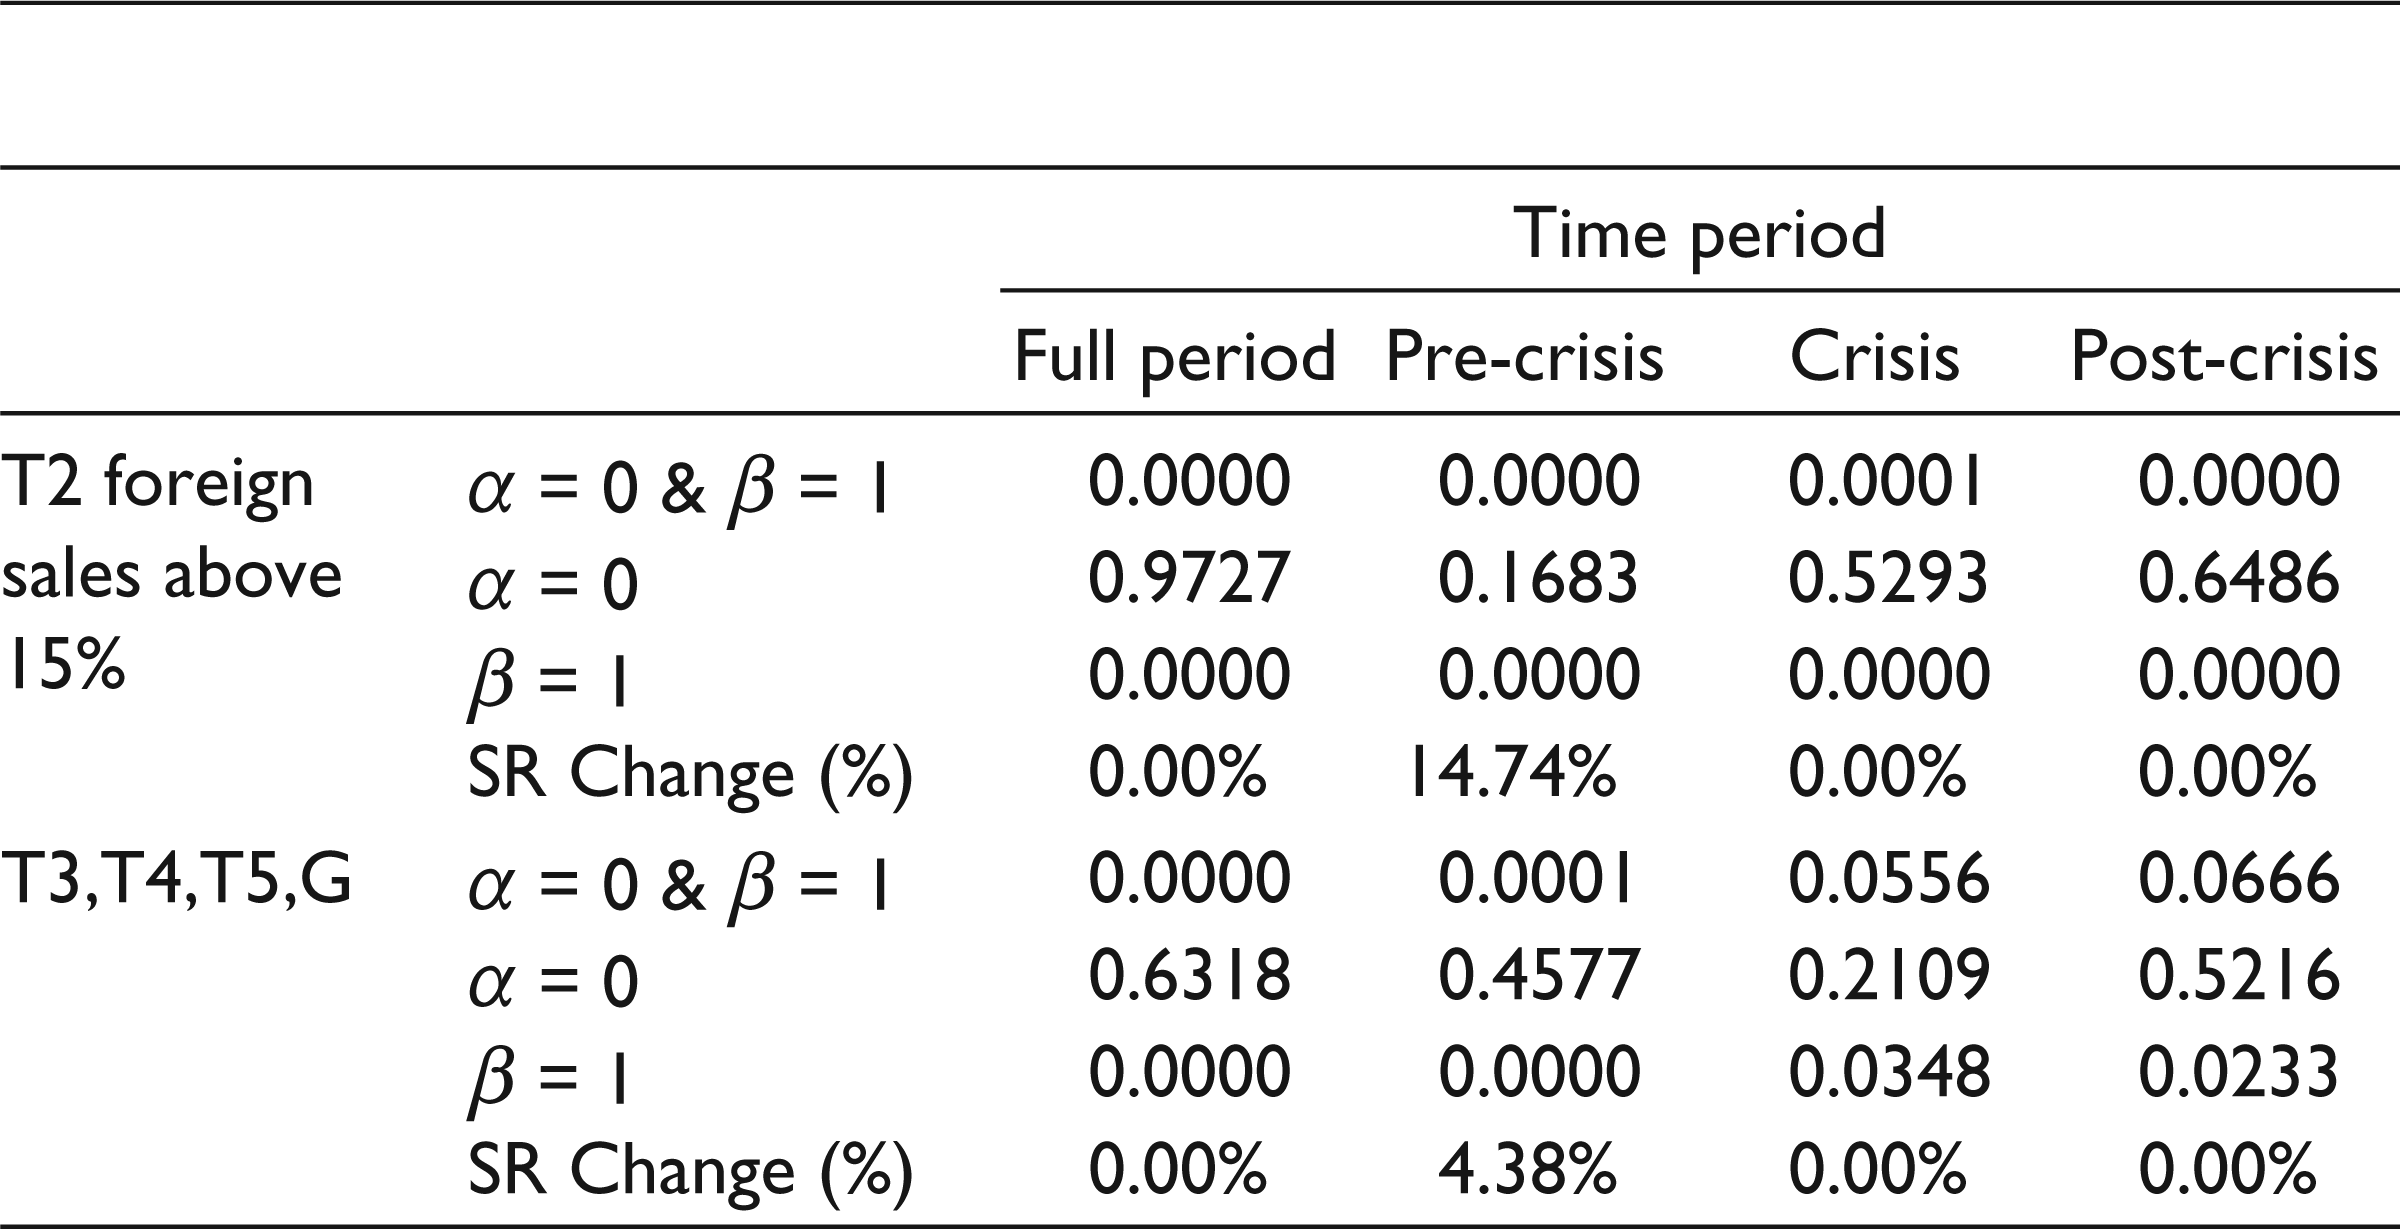
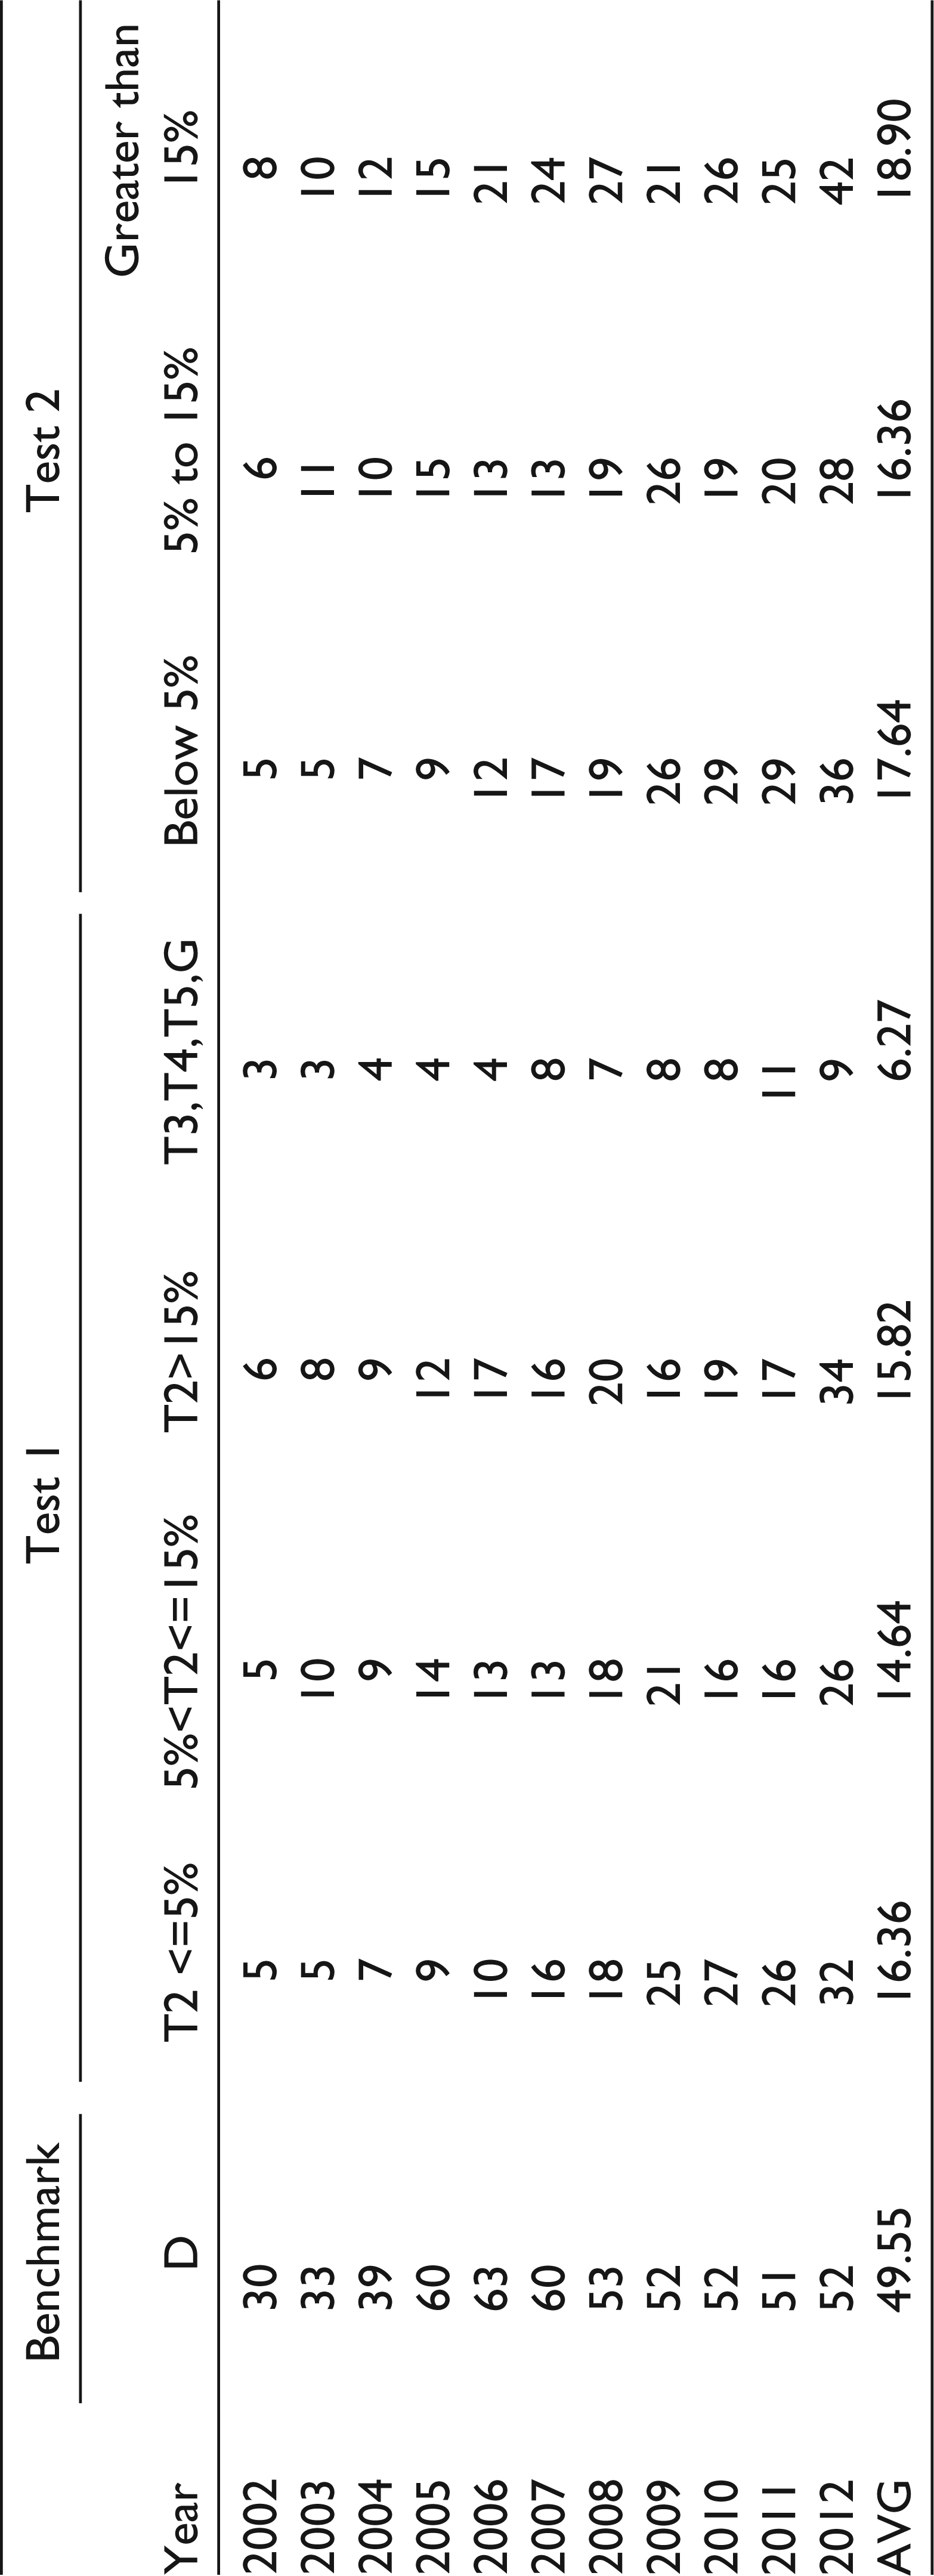
Although MNCs as a whole do not provide diversification benefits, we investigate whether this result applies to all categories of MNC. Given the dominance of firms categorised as T2 (44.78%—refer Table 2) in our sample, we further segregate this category into three levels according to their foreign sales percentages—T2 firms with foreign sales less than 5 per cent, between 5 per cent and 15 per cent, and above 15 per cent. As there are significantly less firms for T3, T4, T5 and global categories, we combine these firms to make one portfolio. Regional firms are not included as the number is extremely low. Table 4 (test 1) lists the number of firms in each category in each year. We create portfolios using a maximum of 10 firms and all firms are included for categories with less than 10 firms. This eliminates any extra diversification benefits created by larger portfolios. The results are presented in Panels B and C of Table 3.
We reject the null hypothesis of spanning in all tests, implying that diversification benefits exist in all cases (refer Table 3). For T2 firms with less than 5 per cent foreign sales, there is a slight increase in the Sharpe ratio for the entire sample period but no benefits in the sub-periods (using market capitalised weighted portfolios). Results using equally weighted portfolios show that MNCs do provide diversification benefits with an overall Sharpe ratio increase of 2.88 per cent. The remaining tests show similar results. Results for the full sample period show no change in the Sharpe ratio using market value or equally weighted data. Several sub-periods show additional benefits from investing in various categories of MNCs, but these benefits are not consistent. The T2 (<5% foreign sales) category shows relatively higher potential in providing extra benefits (0.03% for weighted average and 2.88% for equally weighted).
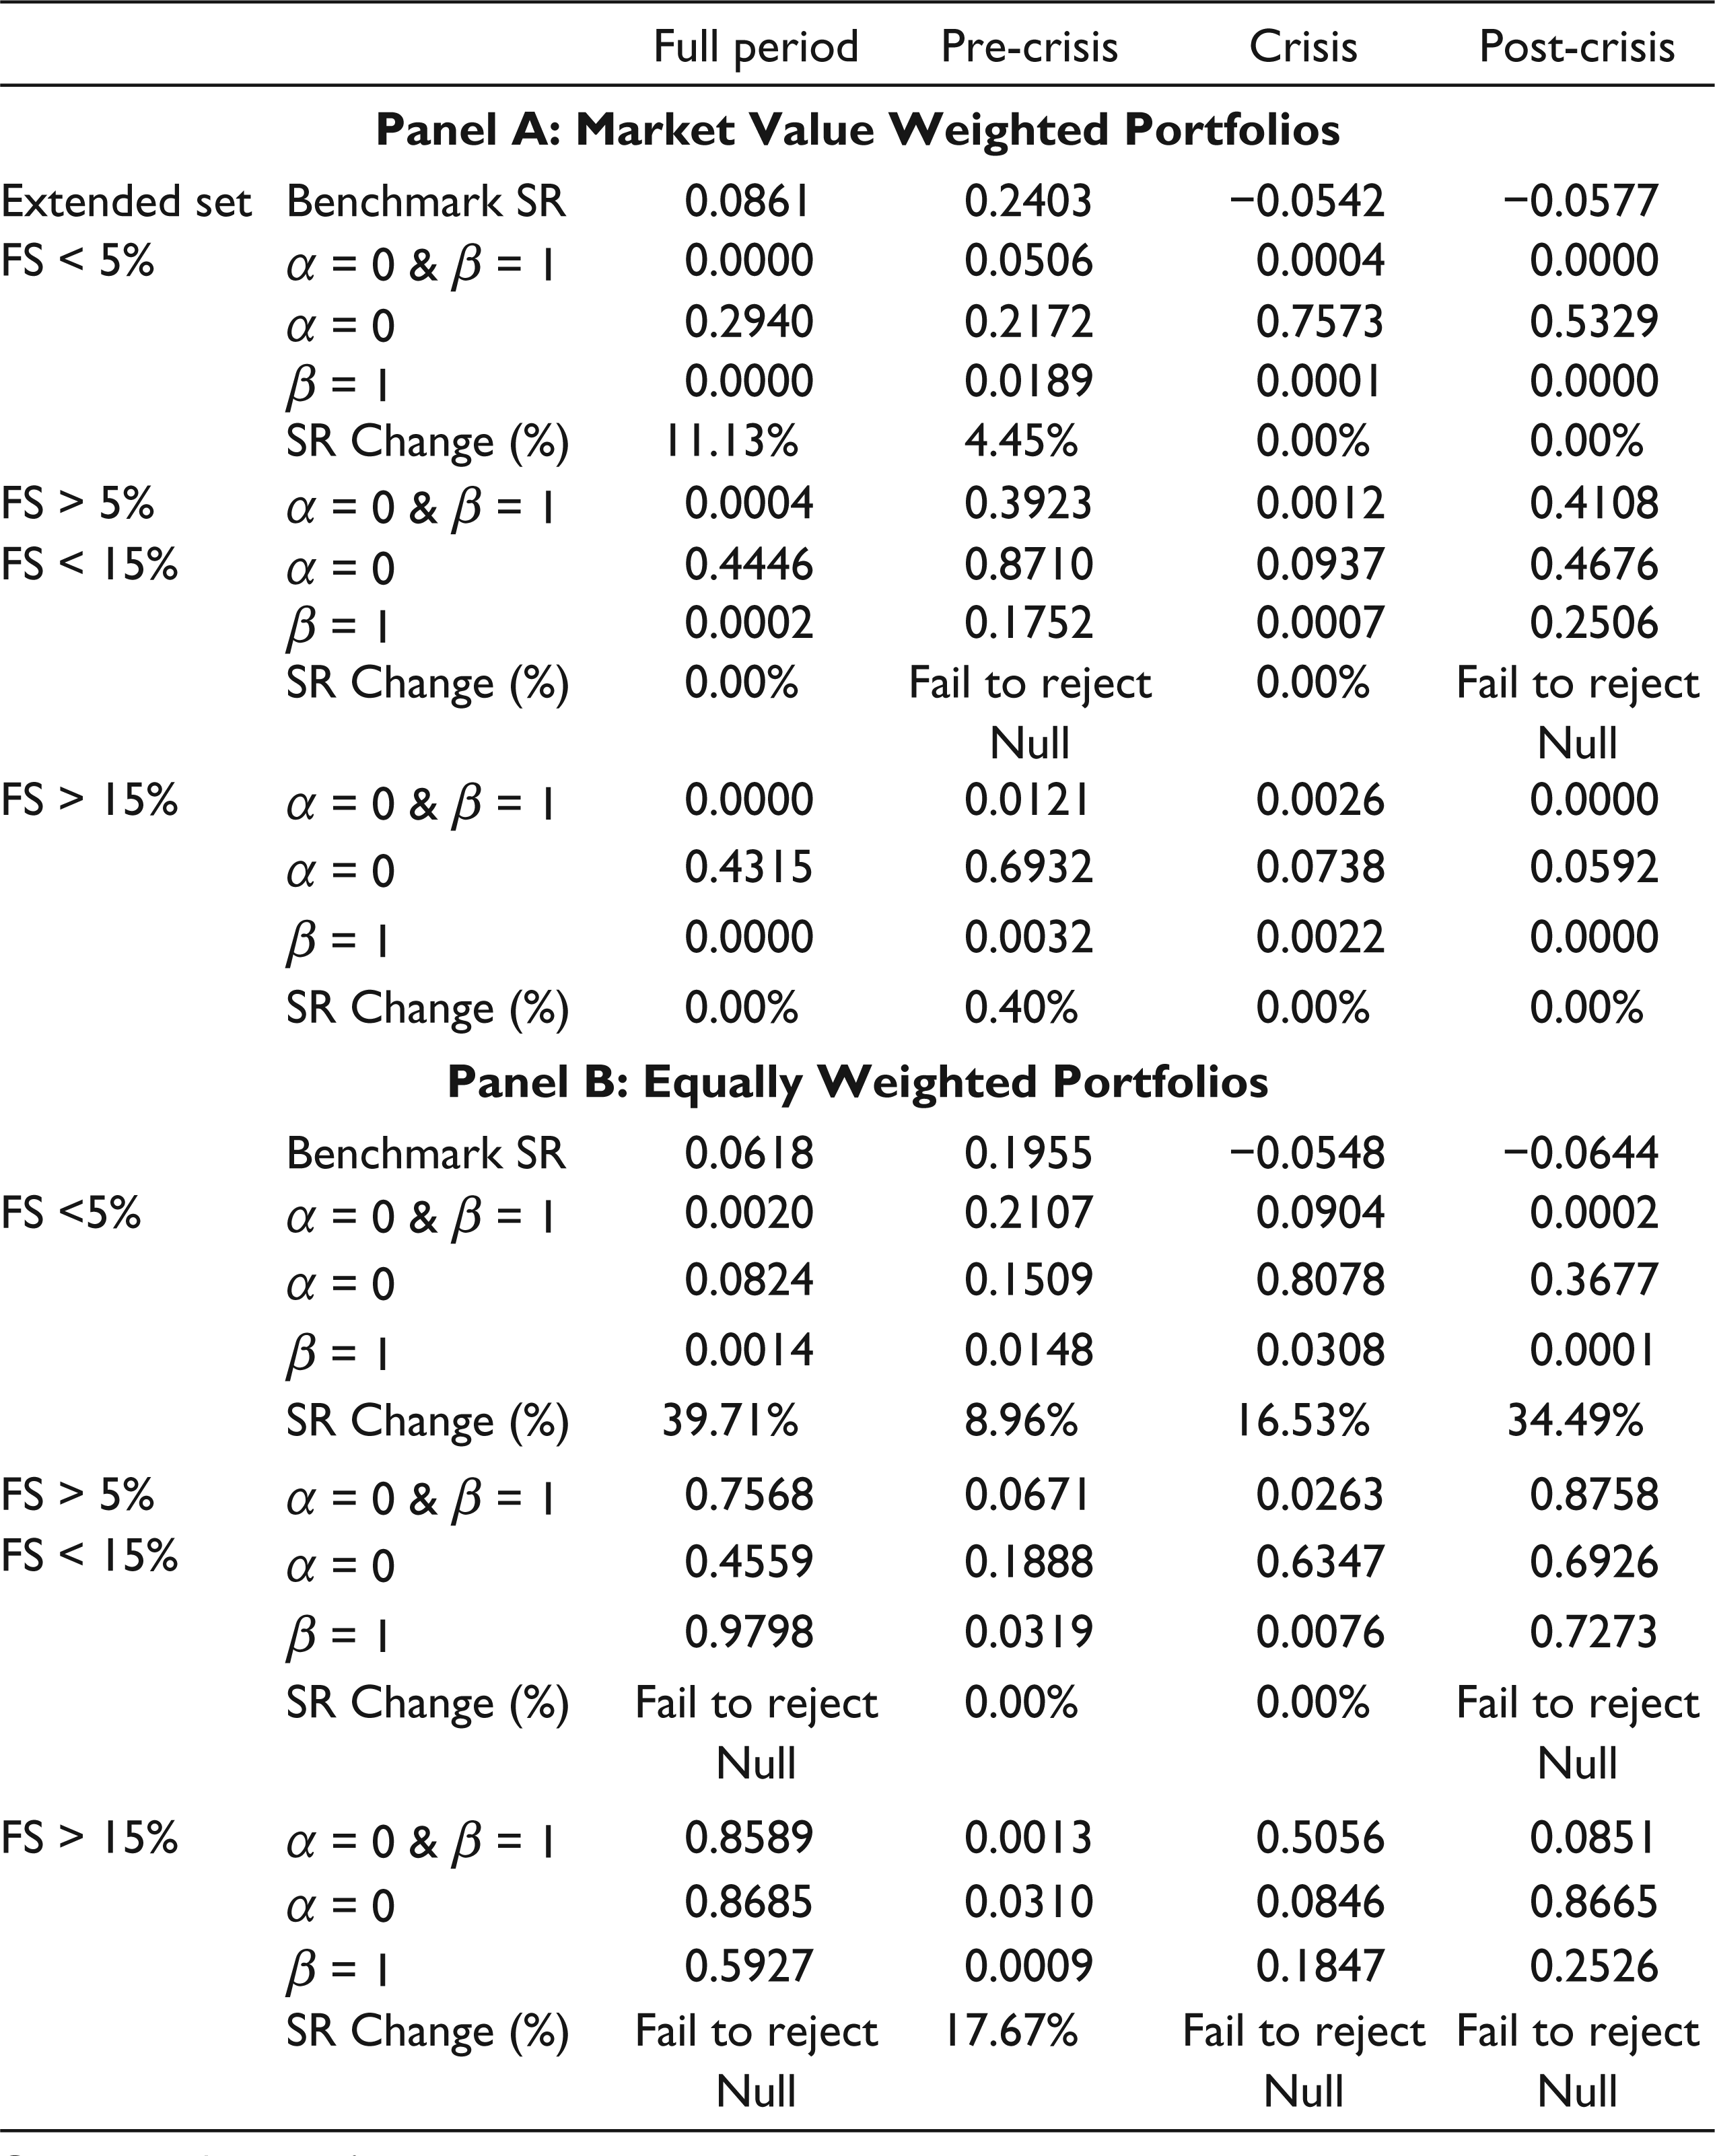
We test the robustness of our results by categorising firms into three categories based on their foreign sales percentages—0–5 per cent, 5–15 per cent and greater than 15 per cent. Table 4 (test 2) shows the number of firms in each category in each year. Results are presented in Table 5. The null hypothesis of spanning is rejected for firms with foreign sales less than 5 per cent, showing that these firms yield consistent diversification benefits. The market value weighted test shows an 11 per cent improvement in the Sharpe ratio for the whole period and a 4.45 per cent increase for the pre-crisis sub-period, but the crisis and post-crisis periods show no benefits. The benefits using equally weighted portfolios are even larger, with 39.71 per cent increase for the whole period, 8.96 per cent for the pre-crisis period, 34.49 per cent for the post-crisis period and 16.53 per cent for the crisis period. However, for the remaining two categories, approximately half of the Wald tests fail to reject spanning. We find no benefits from investing in firms with 5–15 per cent foreign sales and only marginal benefits from investing in firms with more than 15 per cent foreign sales. We conclude that the benefits from investing in MNCs in China are marginal and firms with greater levels of multi-nationality do not provide greater benefits.
MVS Results using ABHK Classifications

MVS Results using ABHK Classifications
Our results show that Chinese investors can benefit from international portfolio diversification. However, Chinese MNCs do not yield significant diversification benefits, but firms with lower levels of multinationality provide more consistent diversification benefits. The indirect diversification benefits attained do not increase as firm-level multinationality increases. Our sub-period analysis shows that no benefits exist during the crisis period and benefits tend to be higher in the post-crisis period compared to the pre-crisis period.
Number of Firms in Each Category
MVS Results using Foreign Sales Categories
We provide a unique longitudinal analysis of firm-level multinationality for Chinese firms between 2002 and 2012, using the Aggarwal et al. (2011) classification system and the percentage of foreign sales. Results show that most Chinese MNCs are categorised as T2 and have relatively low figures for foreign sales—the level and breadth of firm-level multinationality is low for firms in China. While the majority of sales are domestic, there has been some increase in foreign sales over the sample period. Europe and the USA are China’s most important exporting regions but exports to both regions reduced significantly since 2007. Our results suggest that the increase in foreign sales attributes more to the growth in number of MNCs rather than further advancement of existing MNCs.
We investigate the benefits from investing in Chinese MNCs using MVS and Sharpe ratio tests. We conclude that no extra benefits can be created by investing in MNCs. This means on average MNC shares do not perform better than domestic shares in China. Although we conclude that Chinese MNCs, in general, do not provide significant diversification benefits, counter-intuitively, our results show that firms with lower levels of multinationality tend to provide some benefits. We also conclude that the benefits from indirect portfolio diversification do not exist during the crisis period. We test the robustness of our results using two measures of multinationality, both market value and equally weighted portfolios and across three subsample time periods.
Declaration of Conflicting Interests
The author(s) declared no potential conflicts of interest with respect to the research, authorship and/or publication of this article.
Funding
The author(s) received no financial support for the research, authorship and/or publication of this article.