



Abstract
In contrast to developed countries, Indian capital markets do not exhibit strong efficiency and therefore it appears possible that fund managers beat the benchmarks. We examine the existence of superior performance of open-ended equity mutual funds in India with various models including traditional Capital Asset Pricing Model (CAPM)-based as well as recent Fama–French–Carhart (FFC)-factors-based models. We use a survivorship-bias free database including all schemes since inception till recently. We found evidence of stock picking and timing abilities in Indian fund managers. Our results are robust to changes in benchmarks, return frequency, and effects of heteroscedasticity and autocorrelation (HAC).
Introduction
Mutual Funds have attracted huge investment flows by both individual and institutional investors across the world. Present in over 50 countries, the assets under management (AUM) of Mutual Funds across the world numbering 117,763 stood at USD 41.7 Trillion by the end of 2016, having 56 per cent of World GDP. By FY16, 43 fund houses were operating in India, managing approximately INR 16,000 billion of assets with more than 2,500 schemes. 1 The AUM to GDP ratio in India is well under 10 per cent. Though mutual funds continue to be the preferred route to invest in Indian capital markets, it has been able to attract only a small fraction of retail investors. The investors’ search for the well-performing mutual funds continues to dominate the fund managers’ choices and strategies.
Prediction of mutual fund performance has been catching the attention of researchers as well as practitioners for a long time now. Research has identified various measures with mixed claims of predictive ability. Further, the economic rationale for the existence of mutual funds lies in their ability to earn superior returns. This ability can be decomposed into the ability to predict and benefit from market movements, termed as ‘Market Timing’ in literature and ability to pick out winner stocks, termed as ‘Selectivity’ in literature (Fama, 1972). The present study broadly aims to identify and probe the sources and geneses of performance of excess returns on Indian mutual funds.
Following an extensive body of literature relating to fund performance (Berk & Green, 2004; Carhart, 1997; Fama & French, 1993, 2010; Jensen, 1968; Sharpe, 1966; Treynor, 1965; Treynor & Mazuy, 1966), we envisage testing three important premises in the light of the conceptual framework developed subsequently in this study. First, fund managers of mutual funds are expected to demonstrate stock selection skills. They display an ability to pick stocks that are not trading at correct valuations to their fair value. The mutual funds managers can identify undervalued and overvalued stocks and invest/divest in them to earn superior returns for their funds. Second, the fund managers also manifest market timing ability. They anticipate changes in overall market movement correctly and take positions accordingly. They increase beta of their portfolio when they foresee an upswing in the market and reduce beta when a downturn is around the corner. Third, the stock picking and market timing abilities of the mutual funds do not coexist, that is, presence of one means the absence of another. Owing to direct relevance of these issues for the investor community, these issues have been examined extensively in developed markets. However, in case of an emerging markets like India, the few studies done appear to suffer from many limitations like short study period, sampling errors, survivorship bias, weak methodology and absence of use of improved models.
Our study markedly adds to the existing literature on Indian mutual fund performance by making a number of improvements. First, the study period (2006–2015) is 9 years long and begins at the time when data first became available in India. Second, we create a survivorship free database, for the first time in India to our knowledge, which makes our results comparable with developed market studies. Third, we use accepted rigorous estimation procedure by controlling for heteroscedasticity and autocorrelation (HAC). Fourth, perhaps the most important improvement we make is use of FFC factors as described in Carhart (1997) in the return generating process. Departing from the usual practice of monthly data in the Indian literature, we have utilised daily frequency data. For robustness checks, we use NIFTY 500 as benchmarks in addition to generally employed NIFTY 50 and compare the findings.
Literature Survey
The literature examining performance of mutual funds is extensive; covering a number of related dimensions like decomposition of performance; performance due to luck or skill; right benchmark for measuring performance; persistence of performance; consistently performing fund managers; portfolio composition and performance; performance vis-à-vis fund size, fund age, manager attributes, fee, and so on. For the present study, we exclusively focused on studying stock selection and timing skills of fund managers. The modern portfolio theory came into existence with the seminal work of Markowitz (1952), wherein he proposed a mean variance framework for creating optimal portfolios. This laid the foundation for asset pricing models, mainly by Sharpe (1964), Lintner (1965) and Mossin (1966). Around that time, investment management industry was an important one in the United States, and there existed no unambiguous technique of assessing the performance of its managers. This led to the development of various mutual fund performance measurement techniques, notably by Treynor (1965), Sharpe (1966) and Jensen (1968). While these measures reduced the performance of funds into a single measure (essentially a reward-to-risk ratio or risk-adjusted return), Fama (1972) decomposed overall performance into ‘selectivity’ and ‘market timing’. While selectivity refers to the ability of the fund manager to identify mispriced securities (also known as micro-forecasting skill), market timing is the ability of the fund manager to vary the composition of her portfolio according to the expected market movements.
Selectivity
The Jensen’s alpha was the foremost measure of selectivity skill of mutual fund managers. It represented the excess return earned by a fund over what would have been predicted by the Capital Asset Pricing Model (CAPM)-based on the fund’s beta and a premium for market risk. The basic idea is to stack the fund’s returns against that of a naive benchmark portfolio and look for excess returns, if any. Although, the CAPM forms the basis of risk-adjusted performance measures, yet the empirical validity of CAPM itself has been subject to intense scrutiny. This has been examined first by Black, Jensen and Scholes (1972) and subsequently by Blume and Friend (1973), Fama and Macbeth (1973) and Kon and Lau (1979). The biases in betas and by extension alphas estimated by CAPM-based models are inherent in models themselves (Malloch, Philip, & Satchell, 2016). Due to this, the validity of the benchmark portfolio of equivalent risk against which the fund returns are compared becomes suspect. This reasoning led Kim (1978) to explore another approach; the so-called ‘Weighted Index Benchmark Portfolio Approach’. The benchmark portfolios and their returns generated in this approach are created by using market indexes and their weighted returns in the proportion of similar asset groups sorted from managed portfolios being evaluated. Using a relatively recent data set of quarterly returns of 138 US equity mutual funds over the 1969–1975 period, Kim (1978) finds that even after adjusting transaction costs from benchmark portfolios, 90 per cent of the funds in the sample underperform their benchmarks.
The security market line (SML) is the bulwark of CAPM and beta is computed as its slope. Roll (1978) investigates indisputability of beta as a risk measure and argues that SML, and by implication betas, must provide unambiguous and robust rankings when portfolio performance is computed. He theoretically demonstrates, however, that different market indices used as proxy for market portfolio in SML produces different beta estimates. If the index so chosen is mean-variance efficient, then all portfolios being ranked would lie on SML itself. In case the index is not mean-variance efficient, then another index can be found which reverses the rankings of portfolios. Roll’s (1978) critique brings forth the logical inconsistency of CAPM-based benchmarks as CAPM is based on the assumption that investors possessed like beliefs and information, and therefore, if abnormal performance occurs, it can happen only when the market proxy is inefficient. Roll (1978) further predicts that single index model may fail to capture all the sources of variation in returns, leading to mean-variance inefficient indexes and reversible rankings. Roll’s claims were empirically studied by Peterson and Rice (1980) who find no evidence of ambiguity in performance measurement by SML.
With growing scepticism about the empirical validity of CAPM and the plausibility that there cannot but be a one-size-fits-all source of risk that explains securities’ returns, multifactor models to explain the variation in returns came into existence that allowed for multiple sources of risk. Ross (1976) introduced arbitrage pricing theory (APT) which posited that securities returns are explained by a number of factors and different stocks will have differing sensitivities to these. Also, APT was less restrictive in its assumptions than CAPM.
Fama and French (1993) popularised multifactor models of asset return and showed that three stock market factors (excess return on market index, size and book-to-market ratio) have better explanatory power compared to CAPM. Therefore, abnormal performance of a portfolio can be measured by regressing returns of portfolio against these factors. In case the portfolio being examined comprises equities largely, only the three stock market factors shall be sufficient for analysis. The mathematical equation of Fama and French (1993) model is as follows:
Here, Rit is the excess return on portfolio over risk-free rate. RMRF is excess return on an appropriate value-weighted market proxy. Small minus big (SMB) and high minus low (HML) are returns on factor mimicking, zero investment value-weighted portfolios for size and book-to-market equity.
Carhart (1997) introduced another factor ‘Momentum’ of Jegadeesh and Titman (1993) as the fourth explanatory variable to the Fama–French model. The addition of momentum has been shown to have increased the model fit significantly. The modified model with Carhart’s fourth factor, also known as the FFC model, can be expressed as:
Here, winners minus losers (WML) is the one period momentum in stock returns. This model has been demonstrated to work well in explaining the variations in US and non-US mutual fund performance (Ferreira, Keswani, Miguel, & Ramos, 2013). The four-factor model by Carhart has become the industry workhorse over the previously popular CAPM (Varma, 2011).
Market Timing
Fama (1972) decomposed the superior fund performance, primarily into selectivity and market timing. Market timing is also known as macro-forecasting skill. The first model testing presence of market timing was proposed by Treynor and Mazuy (1966). They argued that the existence of market timing will induce curvature in the SML. The curvature will arise due to increase in investment in higher beta stocks by the market timer in anticipation of a market bull run. Likewise, when a bearish market is foreseen by the market timer, the portfolio beta will be reduced by moving into safer securities. The curvature thus induced can be captured by introducing a quadratic term in the market model.

Here,
Rpt = Return from portfolio p at time t RFt = Risk-free rate at time t RMt = Return of a market portfolio at time t βp = CAPM beta βpt = Coefficient of market timing αp = Measure of selection ability
This model of market timing by Treynor and Mazuy (1966) was the first yet still popular model to find out presence of market timing.
Another model of market timing was proposed by Henriksson and Merton (1981) (HM hereafter). They proposed that the market timer essentially takes a free call option on the market with pay-offs = Max[0,Rm–RF]. Their model can be mathematically expressed as:

In this equation, C will be a dummy variable. It takes on two values.
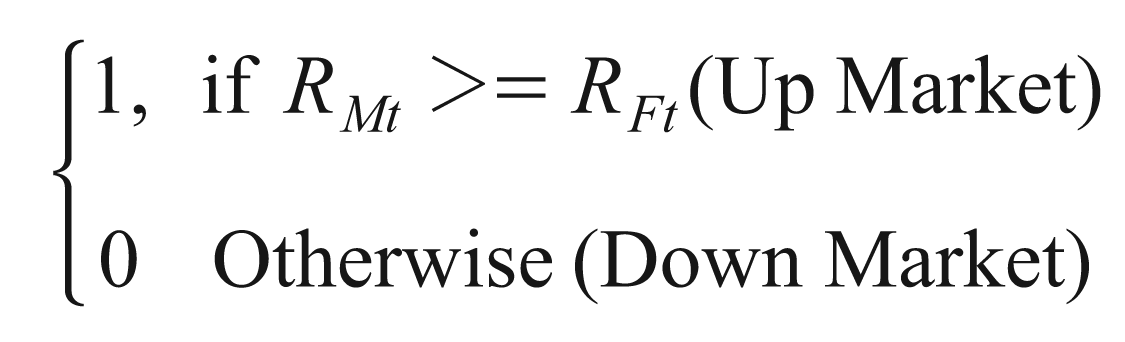
Here, the term C (RMt –RFt ) can be compared to the pay-off of a call option on the market portfolio. The term βpt measures market timing ability. It will be zero both in the cases of no market timing ability or inability to act on forecasts. A negative value would indicate negative value of market timing (timing decision going perverse).
Both these models are extensions of the CAPM. The underlying assumption is that the risk premium on assets is determined solely by a single source, that is, the variation in the market return. However, as documented time and again, multifactor models explain the variation in returns much better (Carhart, 1997; Fama & French, 1993).
Empirically, Selectivity has been numerously reported to be absent among the fund managers. Some of the prominent studies citing absence of selectivity skills are given in Table 1. The findings indicate a general absence of selectivity skill among fund managers. Further, these findings are in line with an efficient market hypothesis which says that stock prices correctly reflect all available information, and therefore, it is impossible to earn superior returns in informationally efficient markets (Kon & Jen, 1979; Verheyden, De Moor, & Vanpée, 2016). However, most of these studies have been conducted in developed capital markets which have also shown evidence of stronger market efficiency. The inferences of these markets may not entirely be applicable to markets from emerging economies such as India.
In contrast to studies in developed markets, many Indian studies have found positive selection ability (Ahmad & Samajpati, 2010; Deb, Banerjee, & Chakraborty, 2007; Panda, Mahapatra, & Moharana, 2015; Roy & Deb, 2004; Sehgal & Jhawar, 2008). This is not surprising taking into account the relatively lesser market efficiency of Indian stock markets (Dicle, Beyhan, & Yao, 2010; Lim, Brooks, & Kim, 2008). However, none of the studies on India have gone beyond the use of single-factor CAPM-based assessments.
The tests of mutual fund performance also imply the tests of market efficiency (Jagannathan & Koracjzyk, 1986). While in highly information-efficient markets it might be nearly impossible to earn abnormal returns, in a weakly information-efficient market this should be plausible. However, although, many Indian studies confirm the presence of superior selection ability, the methodology and data used adversely affect the credibility of their conclusions. In all the studies that were reviewed, except Ahmad and Samajpati (2010), single-factor CAPM were used for computing alphas. With well-documented empirical estimation of the problems of CAPM, the resultant conclusions are likely to be biased.
Empirical Findings on Selectivity
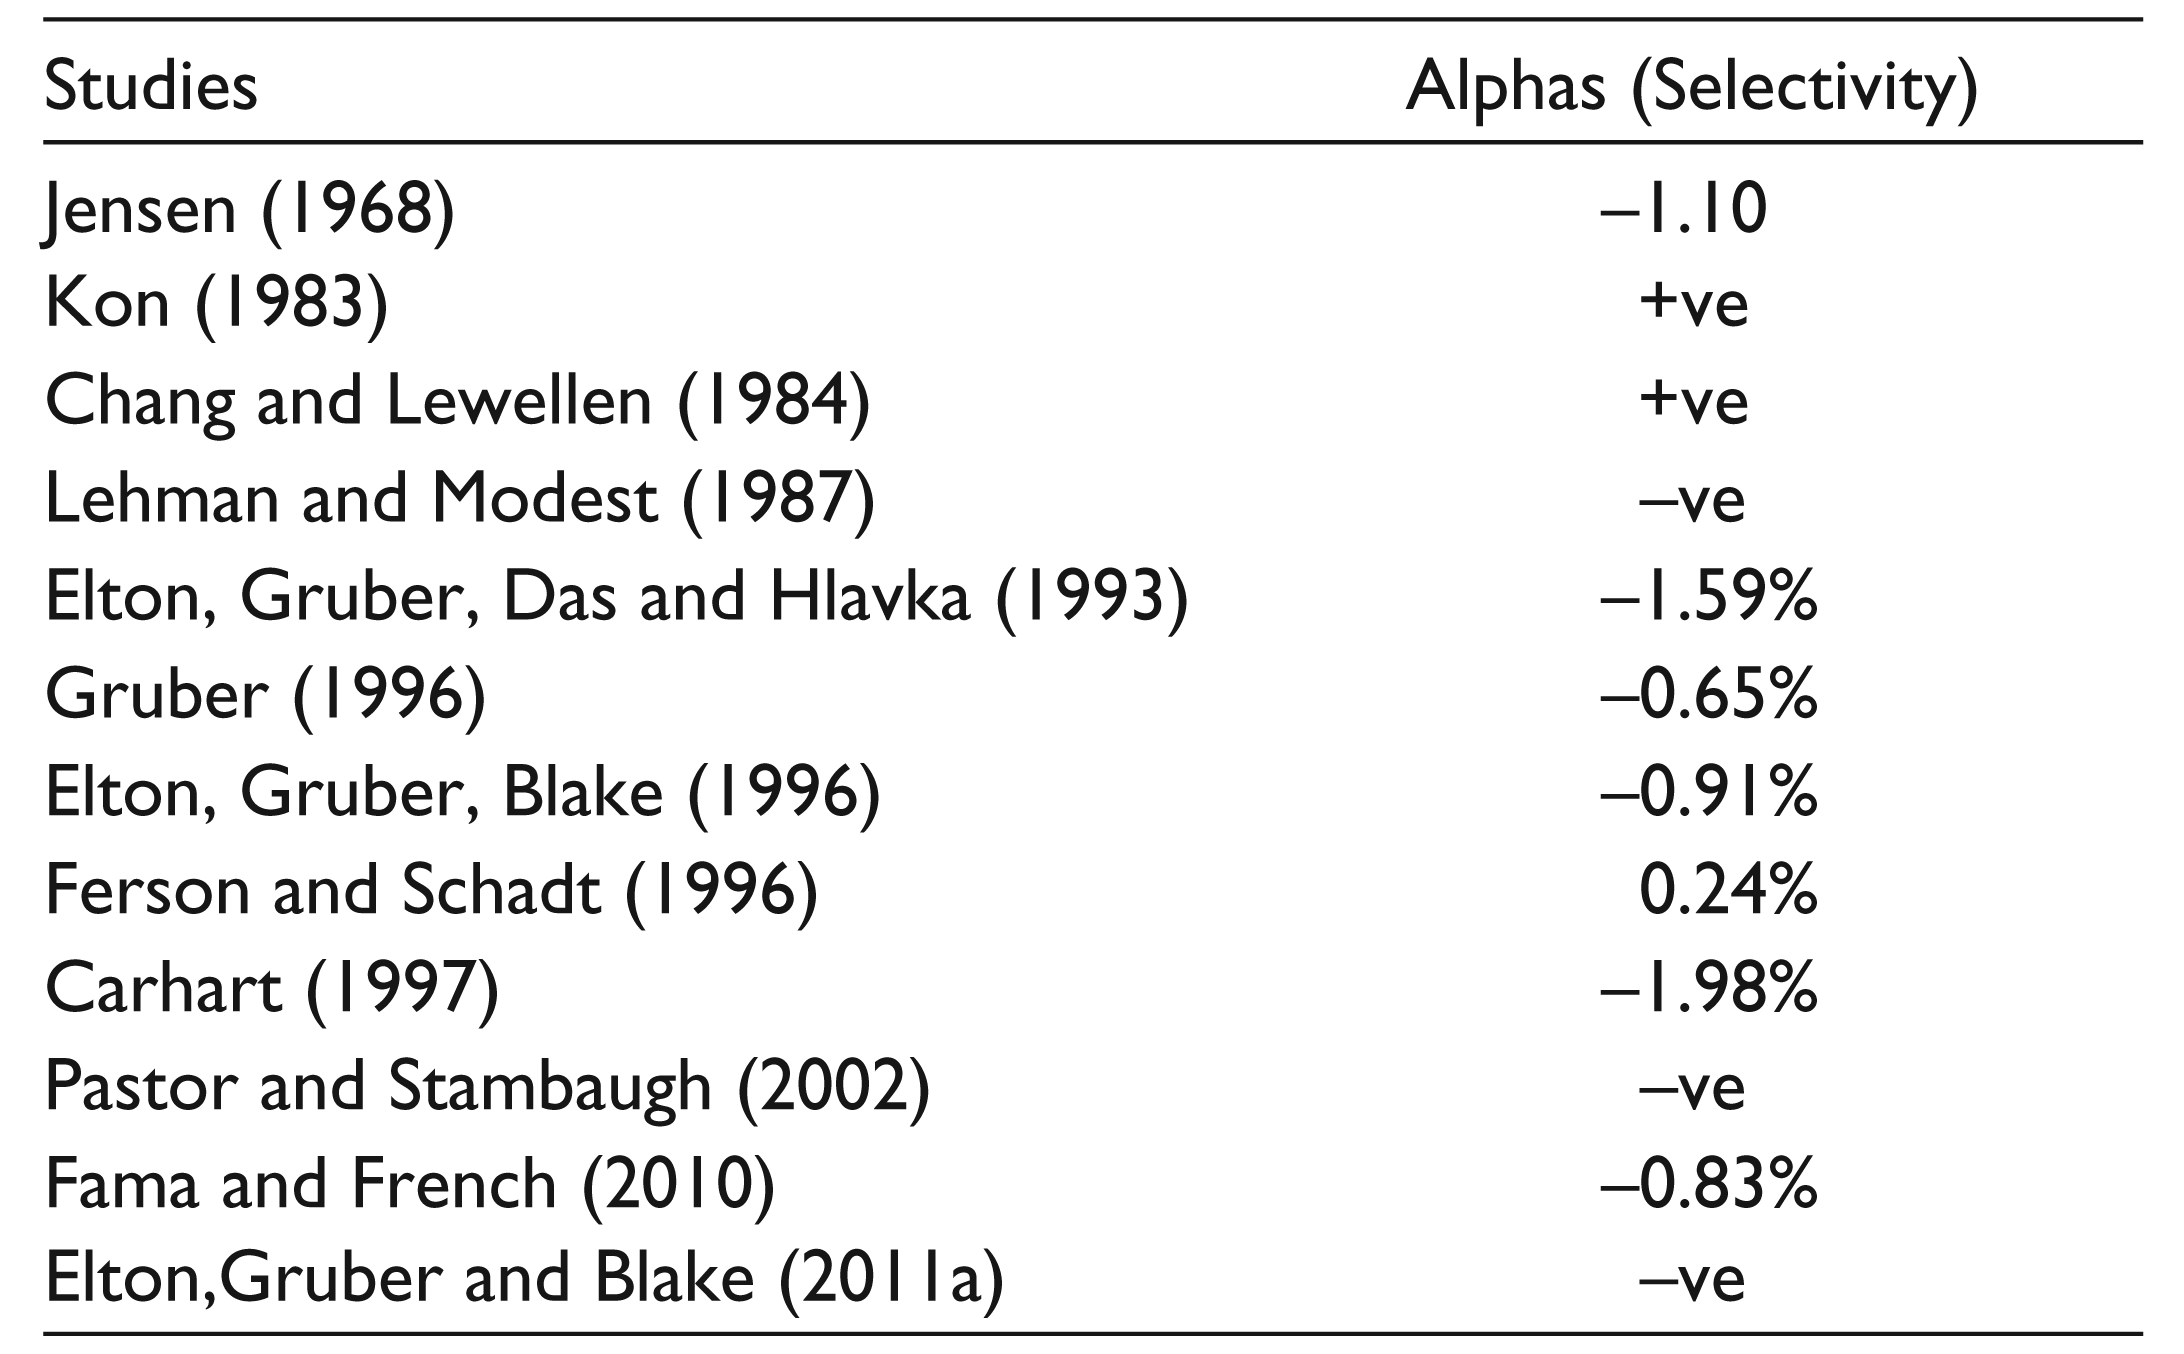
Empirical Findings on Selectivity
Market Timing
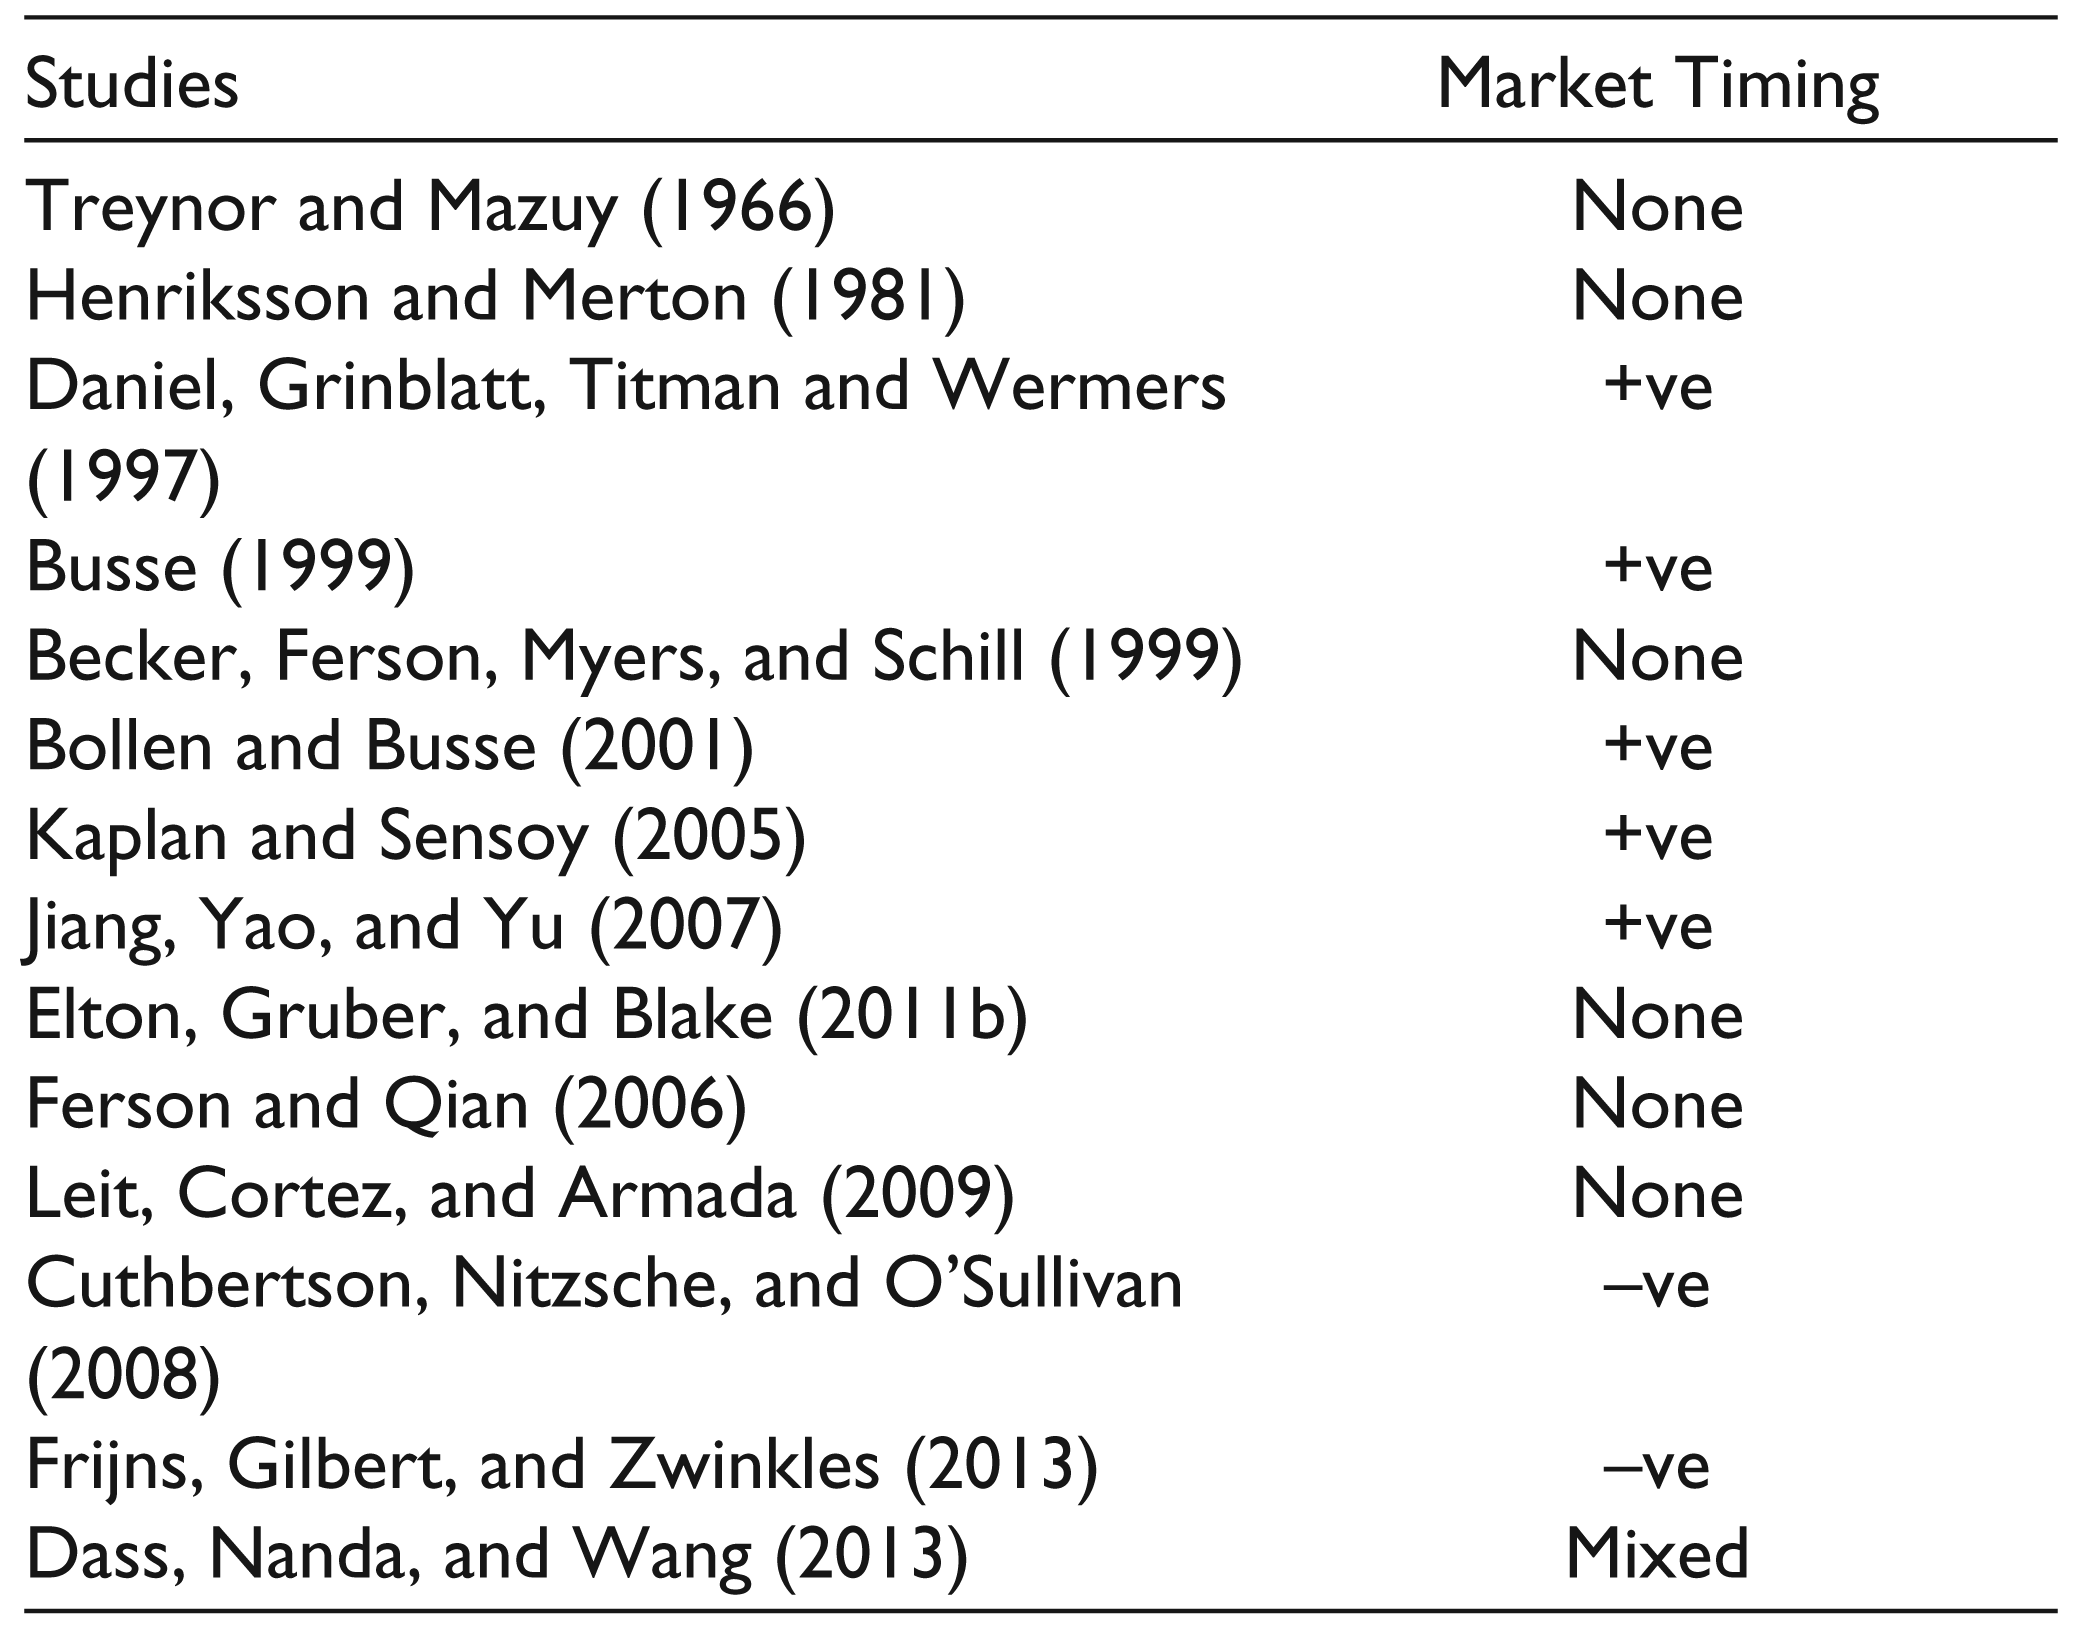
The empirical evidence on market timing is rather mixed as seen from Table 2. It lists major international studies examining timing ability of mutual funds. They employ returns or holdings data on funds in developed US/UK markets.
In case of India too, most of the studies have reported evidence of negative or no market timing (Chopra, 2011; Deb et al., 2007; Dhar & Mandal, 2014; Panda et al., 2015; Tripathy, 2006). Only a few studies have reported evidence for positive timing (Ahmad & Samajpati, 2010; Raju & Rao, 2009). Again, all these studies have studied market timing with the use of a single-factor CAPM. The problems in estimation of alphas with a single-factor CAPM are well documented (Black et al., 1972; Fama & Macbeth, 1973). The errors in single-factor CAPM alphas perpetuates to betas and estimates of timing. The present study overcomes this limitation of studies on Indian mutual funds by extensively using multifactor models.
Empirical Findings on Market Timing
Survivorship Bias
Examination of mutual fund performance in developed countries has been invariably done with data free of survivorship bias. This bias arises when funds database does not include those schemes which disappeared during the estimation period. The consequence is that the data consists entirely of surviving funds which are likely to have better performance, leading to upward bias in performance estimates (Brown, Goetzmann, & Ross, 1992). A fund that took on high risk has higher probability to fail. And if it did not, it survived with better performance commensurate with higher risk taken. And when models like CAPM fail to correctly measure risk, the performance evaluated by these models is likely to be upward biased (Brown & Goetzman, 1995; Malkiel, 1995).
Unfortunately, all the Indian studies appear to be blissfully silent over this issue. Elton, Gruber and Blake (1996) encountered a similar situation in the United States in the mid-1990s and suggest that neglect of survivorship bias by researchers might be due to their interest in demonstrating performance evaluation results by using data without missing values and poor availability of computerised databases. This might as well be true for Indian mutual fund research of the day. Almost all of the studies seem to have chosen only those funds where data was available over the whole study period, obviously leading to survivorship bias. In the present study, perhaps for the first time in India, we have used a database of fund returns for all funds that existed during the study period even if they disappeared midway. To this extent, our results are likely to be unaffected by survivorship-induced upward bias, had we taken only those funds which existed throughout the study period, in the manner of almost all the studies on Indian mutual funds.
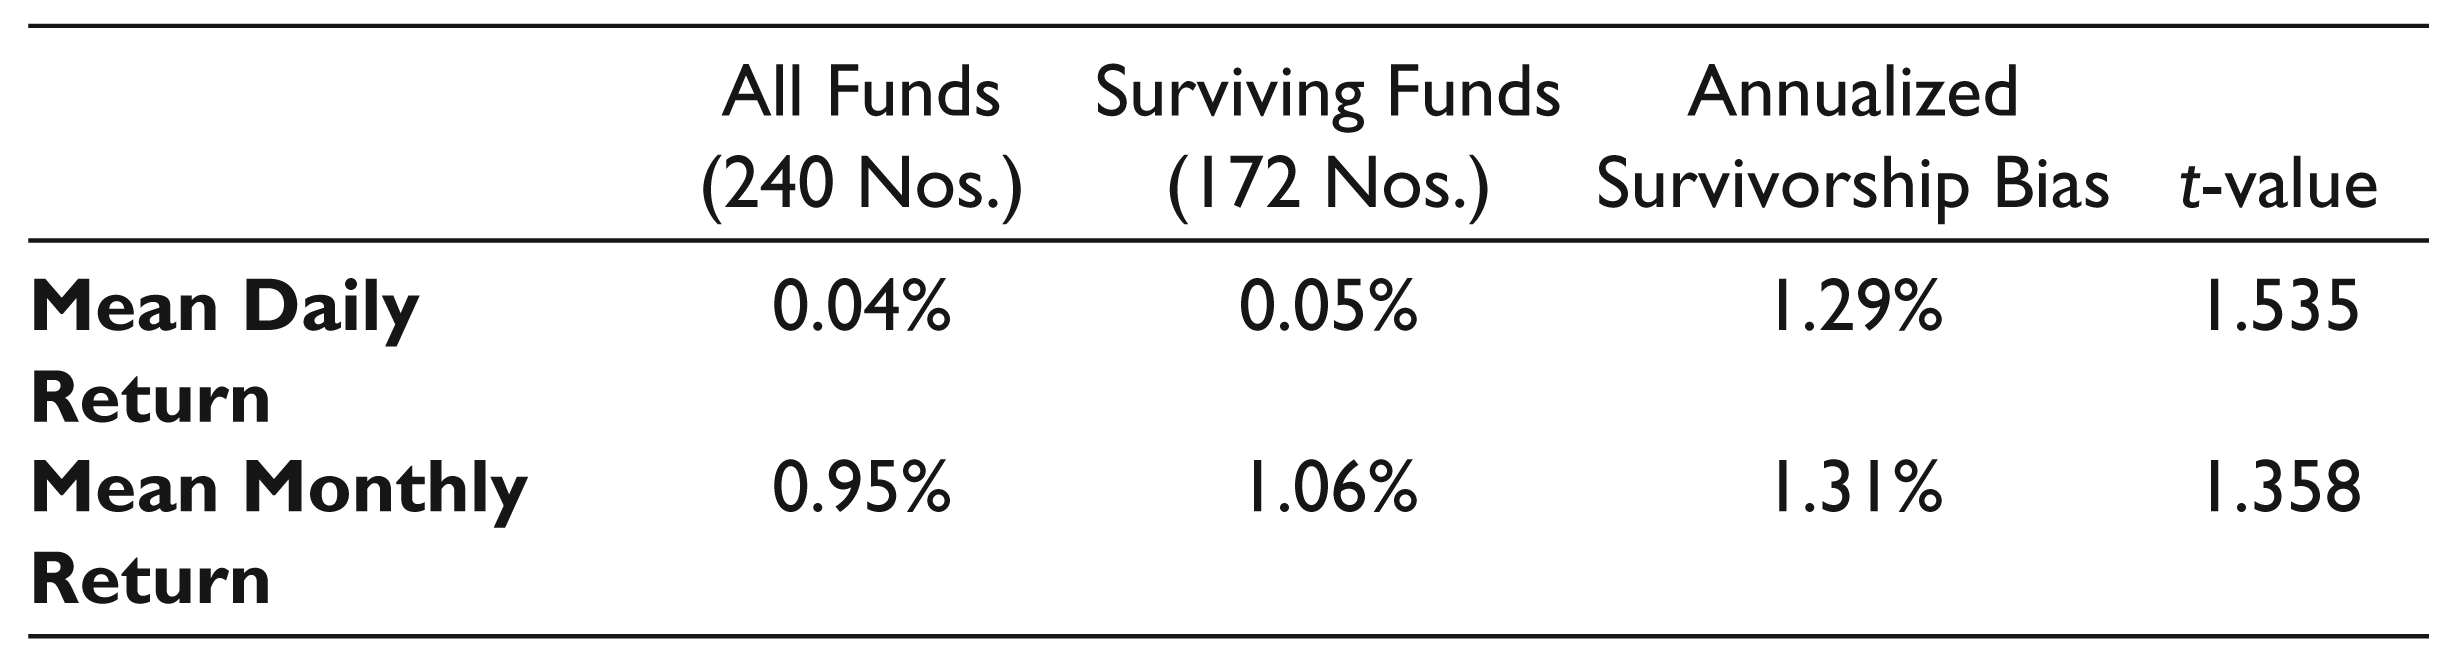
We have also attempted to compute the extent of survivorship bias present in our data both for daily as well as monthly frequencies. We have adopted the method of Malkiel (1995). First we found out the number of funds that survived till the last day of our study period. Out of 240 funds in our sample, this number is 172. So our sample contains 172 surviving and 68 non-surviving funds. Then we computed mean returns for both the surviving and total number of funds and conducted a t -test on their difference. The annualised excess of mean returns of surviving funds over total funds is the survivorship bias (refer Table 3).
Although the extent of survivorship bias is about 1.3 per cent per annum, it is not significant statistically. However, the bias appears economically large enough to lead to incorrect inferences from the results of performance evaluation studies.
Survivorship Bias
Jagannathan–Korajczyk Bias
In case of estimation of market timing with Henriksson and Merton (1981) methodology, a puzzling phenomenon is negative linear association between stock selection skills (alpha) and market timing ability (gamma). Henriksson and Merton (1981) observed that this might arise due to the use of a single factor rather than multiple factors, misspecification of market portfolio and errors-in-variables bias in the model. Jagannathan and Korajczyk (1986) propose that due to option-like specification of Henriksson and Merton (1981) methodology, market timing coefficients are likely to be negative because the benchmark portfolio incorporated in the model is mostly composed of stocks of large, potentially low-debt firms. If the portfolio of funds whose performance is being examined are composed of firms which are not as option-like as the market proxy portfolio firms, the result of Henriksson and Merton’s (1981) regression is likely to show positive selection ability and negative market timing which will be spurious. In fact, in their paper, Henriksson and Merton (1981) surmise that the ordinary least squares (OLS) estimation of the aforementioned equation is inefficient as betas are defined to be non-stationary, and therefore, the errors are not found to have constant variance. Hence, the generalised least squares (GLS) is a better procedure to estimate the regression equation.
The remedy to overcome this bias in Henriksson and Merton’s (1981) formulation is the use of White (1980) specification test or heteroscedasticity-consistent standard errors. This procedure corrects for presence of HAC in the data and induces more stringent standard errors for parameters to be statistically significant. In addition to heteroscedasticity, estimation of models with time series of returns is also likely to suffer from autocorrelation. Therefore, in order to overcome both these problems we propose to use Newey and West (1986) HAC standard errors for testing the significance of our estimate as suggested by Greene (1993) with lag four and pre-whitening. Pre-whitening is a statistical procedure used to remedy the possible effect of time series structure of x variable and shared trends between x and y series over time. 2 To our knowledge, although this procedure is fairly commonly used internationally (Christopherson, Ferson, & Glassman, 1998; Ferson & Schadt, 1996), it has been seldom employed in Indian studies, except Ahmad and Samajpati (2010).
Our study is based on the daily NAV data on mutual fund schemes from the industry body Association of Mutual Funds of India (AMFI)’s website. Since this data is available only since 03 April 2006 onwards, our sample consisted of a 9-year period starting April 2006 till March 2015. When this study was being done, fund houses existing in our sample were 51 in number, taking into account the mergers, closures and launch of new fund houses. Our sample consisted of open-ended growth equity mutual funds with dividend reinvestment option. Over the study period, several schemes closed or merged even as new schemes kept coming. The annual increase/decrease in number of schemes and their descriptive statistics are in Table 4.
Year-wise Fund Schemes and Descriptive Return Statistics

Year-wise Fund Schemes and Descriptive Return Statistics
The number of open-ended diversified equity mutual fund schemes 3 that existed ever during the sample period is 247, out of which seven funds had to be removed from our estimation for having less than 10 monthly observations available. 4 Thus the total number of funds left is 240, for which observations are available for both daily as well as monthly frequencies.
To control for survivorship bias, all the funds that ever existed over the sample period were included, notwithstanding whether they survive till the end. This resulted in 2,259 days of data of 240 funds which is equivalent to 542,160 gross fund days of data, which, to our knowledge, is the largest data set ever used in the mutual fund evaluation studies in the Indian context. We have taken all funds that existed even during a part of this 9-year period. To our knowledge, ours is the largest survivorship free database ever used for studying mutual fund performance in Indian context. On an average each fund had 1,435 trading days of data (Approximately 5.74 years).
The daily NAVs database was converted into a monthly database of returns that produced 108 months of NAV data for 240 schemes, resulting in 25,920 funds for months data. The fund returns ® were computed as
Table 5 presents descriptive statistics of daily and monthly frequency data on 240 funds’ returns, index returns (NIFTY 50 and CNX NIFTY 500), risk-free rate and yields on benchmark 10-year Government of India (GOI) dated securities. The tests for normality of the return distribution were carried out using JB tests. We find that the daily returns have an average JB stat of 199,581, and only 10 funds out of 240 fail to reject null hypothesis of normality in JB test. There is improvement on this count in monthly data, and we find that about 90 funds fail to reject the null. This pervasive non-normality in stock returns is not surprising and has been regularly pointed out in literature. It has implications for Jagannathan-Korajszyck bias, which will be discussed later.
The FFC Factors for both daily as well as monthly frequencies over the sample period have been obtained from the data library of IIM Ahmedabad, 5 which has been created on the lines of the data library of Kenneth French for FFC factors for Western countries. The four factors provided by IIM Ahmedabad are described in Carhart (1997) as SMB (size factor, small minus big), HML = A value factor, high minus low, and WML = A momentum factor, winners minus losers. As seen from Table 6, the cross-correlations are low. This is not likely to result in near multicollinearity in regression (Carhart, 1997).
Descriptive Statistics

We propose a multifactor version of both Treynor and Mazuy (1966) as well as Henriksson and Merton (1981) models to evaluate market timing and selectivity skill of mutual fund managers (Coles, Daniel, & Nardari, 2006; Leite & Cortez, 2009). The specifications of proposed models are as follows:
Multifactor Treynor and Mazuy Model:
Multifactor Henriksson–Merton Model:


Descriptive Statistics of Fama–French–Carhart (FFC) Factors

We use the regression procedure of Black et al. (1972) for estimating the time series. Models have been estimated by using OLS technique. Of late, the generalised method of moments (GMM) has become popular due to its distribution-free properties. However, in case of the linear models like the ones used in this study, the moment conditions imposed by OLS and GMM estimation are considered to be the same (following Ferson & Schadt, 1996). Further, we have used HAC-consistent standard errors of Newey and West (1986) in OLS estimation. It is easy to verify that OLS with HAC-consistent standard errors results in identical estimation as GMM (Zivot & Wang, 2007).
Selectivity
The computations of alpha with various models have been made and, the summarised results are in Table 7, with the number of funds (out of 240) with significant coefficients of selectivity obtained from different versions of multifactor models reported in the text. Unconditional TM and HM refer to standard versions of Treynor–Mazuy and Henriksson–Merton models. The models have been run with daily as well as monthly data to examine the effect of frequency. The results indicate presence of superior stock selection skills among Indian managers. The strongest evidence comes from the HM model either in regular version or with FFC factors where positive stock picking skills are shown by 180 (75%) and 90 (37.5%) funds, respectively, at 5 per cent level with daily data. However, this is not so with monthly data, where the TM model shows the maximum number of funds with positive selection skills at 22 and 23 funds in regular and FFC versions, respectively, at 5 per cent. Like the number of funds, the absolute daily superior return due to stock selection is also quite different in different models, the highest value being 0.08 per cent with the regular HM model. The trend is the same when the index is changed to NIFTY 500. The regular HM model results in maximum number of funds at 108 (45%) showing selectivity at 5 per cent. However, the HM and TM both give identical results with NIFTY 500 benchmark. The maximum return to be earned by selectivity is again given by the regular HM model.
It may be noted that the return due to selectivity is lower in case of FFC version of models than their regular versions, namely, regular TM return with NIFTY 50 as benchmark is 0.03 per cent, whereas FFC–TM return is 0.01 per cent.
This is as expected since in the regular version, the selectivity returns are being isolated by a single-factor CAPM benchmark whereas in the FFC version, the selectivity return is being isolated by a multifactor model which decomposes the gross return into sub-returns due to three additional risk factors. This inference is robust to change in data frequency and is seen in the monthly data as well. Although the selection ability is strongly suggested in daily data, it is indicated to a far lesser degree in the case of monthly data.
Empirical Results on Selectivity

However, there appears to be consistency between different models in case of monthly data with almost 18–22 funds showing statistically significant selection skills. The number of funds showing stock selection skills rises to 26–38 between models when benchmarked against NIFTY 500. Also an interesting contrast between the uses of different benchmarks is observed. Grinblatt and Titman (1993) suggested that performance studies are quite sensitive to choice of benchmarks. In our study, with daily data, selectivity is stronger in case of NIFTY 50 benchmark, whereas, in case of monthly data, selectivity is stronger in case of NIFTY 500 benchmark. When we look at the daily average returns of NIFTY 50 and NIFTY 500, we see that although daily returns of both the indices over the study period are identical, the monthly returns of NIFTY 500 (0.91%) are lower than NIFTY 50 (0.95%). This means the monthly NIFTY 500 presents a lower hurdle to cross, and that may be a reason why the return due to selectivity is higher when NIFTY 500 is used as benchmark. In addition, more normality found in monthly funds data (90 out of 240 funds) also might have led to better estimates.
In addition to assessing the selectivity as the intercept term in the market timing model regressions, we have also assessed absolute superior returns by four FFC models (two benchmarks with two frequencies). There is strong evidence of superior (or ‘beating the benchmark’ as in popular press) returns by funds. Indian mutual funds are among the few in the world where active equity-diversified funds regularly beat the benchmark (Dutta, 2014).
In case of daily returns, the FFC model shows 32 and 42 funds, respectively, with NIFTY 50 and NIFTY 500 as benchmarks, respectively, at 5 per cent level of significance. Now, with a total of 240 funds, these are sizeable numbers not likely to have occurred by chance. In case of monthly data, 27 and 33 funds, respectively, show significant superior returns at 5 per cent with NIFTY 50 and NIFTY 500 benchmarks, respectively. In all these cases, the percentage of funds showing superior returns is more than 10 per cent of the sample. Remarkably, these findings are at variance with the findings of studies on US mutual funds where almost invariably a negative abnormal return has been reported. It may be mentioned that the tests of fund performance are joint tests of market efficiency and superior returns. The Indian market is not at the level of market efficiency exhibited by developed Western markets and therefore offers more opportunities for earning a superior return (Gupta & Basu, 2007).
The superior return shown by FFC models are a combination of return due to selection skills and return due to market timing. In order to achieve the decomposition, the FFC has been clubbed with market timing models of HM and TM. This perhaps is a strong justification in support of the active fund management industry at least in a country like India. The differential returns earned are 1.00 per cent–1.3 per cent per annum as suggested by this analysis. Now at about INR 12,000 billion, AUM in Indian mutual fund industry, this translates into INR 12,0 billion of extra returns, which when divided between 44 mutual fund house in India, appears enough to justify the fund managers’ and their teams’ efforts.
In this analysis, we see that daily data has thrown up far higher number of funds exhibiting selectivity in comparison to monthly data. The monthly returns may fail to capture the managerial competence to produce superior returns because the decisions regarding portfolio and timing might be taken more frequently than a month (Goetzmann, Ingersoll, & Ivković, 2000). Therefore the use of daily data was first advocated by Bollen and Busse (2001). We can see that the inferences with both data frequencies are different. However, in our analysis, we see that selectivity is more prominently reflected with daily data and timing is more prominently reflected with monthly data. A possible explanation of this result might be that the within a given risk level, the stock picking might be a more frequent activity in mutual funds, but the decision regarding timing might not be as frequent since it relates to changing the overall risk profile of the portfolio. Again, more pervasive normality in monthly data (90 out of 240 funds) as against daily data (10 out of 240 funds) might have led to superior estimates.
Timing
Table 8 summarises the results of market timing, in terms of the number of funds (out of 240) with significant coefficients of timing obtained from different versions of timing models reported in the text. Unconditional TM and HM refer to standard versions of Treynor–Mazuy and Henriksson–Merton models. The models have been run with daily as well as monthly data to examine the effect of frequency.
One of the surprising findings of our studies is that a much larger number of market timing coefficients are significant and positive when NIFTY 500 index is used as compared to NIFTY 50. This finding is in line with Jagannathan and Koracjzyk (1986) and Bollen and Busse (2001) who suggest that when returns from market proxy is more negative than the fund returns, more coefficients of market timing are likely to turn out positive. To extend the reasoning, when funds have more negative returns than market proxy, more market timing coefficients are likely to be negative.
Empirical Results on Market Timing
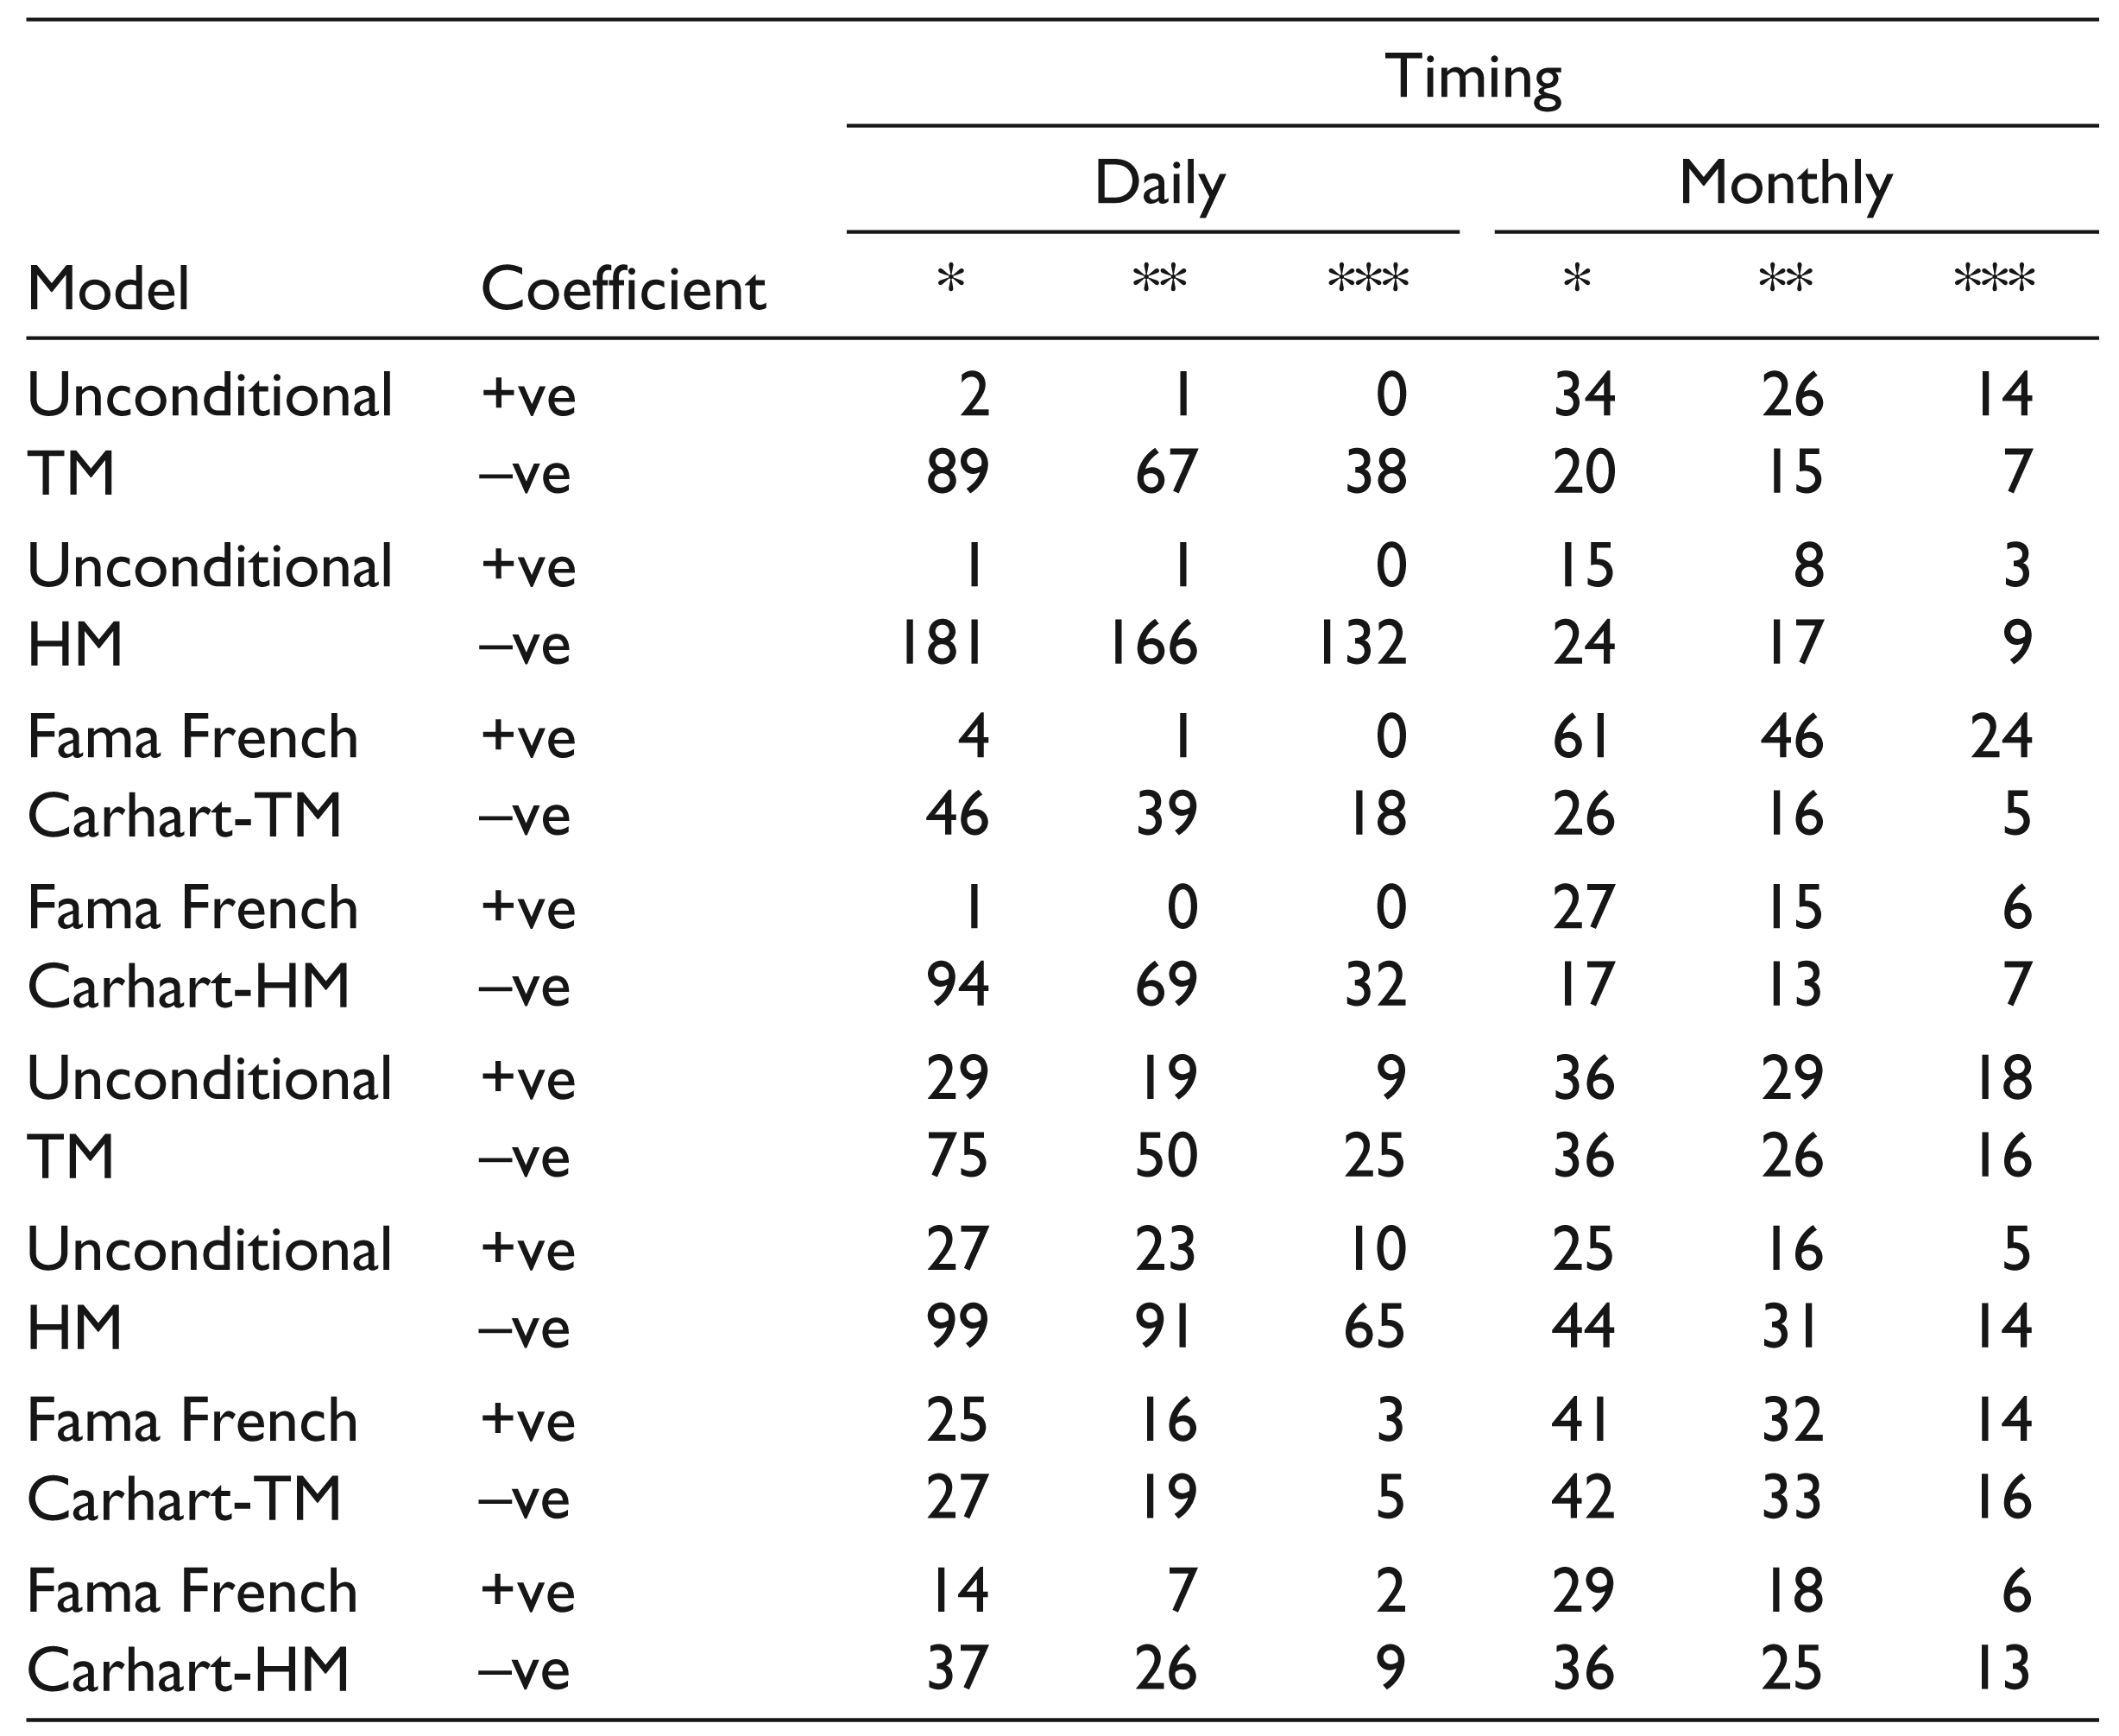
With our data, we see that the skewness across funds and proxy are in Table 9. In case of daily data, fund returns have more negative skewness than NIFTY 50 rather than NIFTY 500. Therefore, we should find more negative timing coefficients with NIFTY 50. In fact, our data does corroborate this. In case of monthly data, NIFTY 50 has more negative skewness than NIFTY 500 in comparison to funds; therefore, we should find more positive coefficients with NIFTY 50, which appears to be the case in our analysis with most of the models.
Symmetry of Distribution of Fund Returns and Jagganath–Koracjzyk Bias

Which of these models might be more acceptable? First, we can easily see that adj R 2 for all the models is higher in case of monthly data. So, it appears that monthly data better describes fund returns than daily data. We can also see that within both the frequencies of data, adjusted R 2 keeps increasing as we move towards FFC four-factor based models than simple CAPM-based versions of TM and HM models. This again reflects that FFC models are better than simple CAPM-based ones. In addition, when we compare the NIFTY 50 and NIFTY 500, we find that when the latter is used as benchmark, the explanatory power of our variables increases across the board (Adjusted R 2 is higher in all the cases when NIFTY 500 is used).
Coexistence of Selectivity and Timing
Another relevant issue is whether selectivity and timing abilities coexist. We studied the linear association between the coefficients of selectivity and timing, summarised in Table 10.
Correlation between Timing and Selectivity Coefficients

Most of the previous studies find that correlation between daily selectivity and timing coefficients is negative (Henriksson, 1984; Leite & Cortez, 2009). It is well documented in literature that these skills are not independent and it is not easy to disentangle them (Dass, Nanda, & Wang, 2013; Glosten & Jagannathan, 1994). Henriksson (1984) suggests that this apparent trade-off between selectivity and timing may also be due to misspecified market portfolio. By this yardstick, our results suggest that NIFTY 500 is a better specified benchmark than NIFTY 50 as lower correlations are reported with it. Bollen and Busse (2004) suggest that allowing for presence of only one of the stock selection or market timing strategies can be due to model misspecification. The manager can most plausibly be pursuing both the strategies simultaneously. Brown, Harlow and Starks (1996) propose changing of strategies by fund managers to optimise the compensation scheme pay-offs to them. That would mean that with better specification, we should find very low correlations between stock picking and timing abilities. Although the statistical question of why selectivity and timing ability appear to have negative correlations is yet to settle, in our results, these correlations are generally low and even negligible in case of monthly data across all models. In case of monthly data, all our models indicate this phenomenon. Our findings suggest weekly evidence of activity specialisation within managers.
We study the selectivity and market timing performance of Indian open-ended equity-diversified mutual funds from the period April 2006 to March 2015 using unconditional models of Treynor and Mazuy (1966) and Henriksson and Merton (1981). We extend these models by incorporating FFC factors. We introduce variation in inputs to these models by using daily as well as monthly frequency data and using NIFTY 50 as well as NIFTY 500 indices as benchmarks.
We find that Indian mutual funds managers possess significant stock picking skills. The results are robust to changes in return frequency and benchmark, although the number of funds exhibiting significant selectivity is far higher in case of daily data. One possible explanation might be that the stock picking takes place far more frequently than at monthly intervals. The absolute superior returns are less in case of multifactor models. Also, superior returns are evidenced with pure multifactor models without the timing component. This evidence is consistent with the general findings of market efficiency research on countries like India where weakly efficient markets make it possible to earn superior returns.
Our findings also suggest that Indian fund managers exhibit significant timing skills at monthly frequencies, although at least an equal number of fund managers show negative timing skills across all models. The absence of positive timing ability with daily data appears to be due to statistical reasons. Further, it appears more likely that timing decisions are related to altering the overall riskiness of the portfolio and may not be as frequent as to be taken on at least a daily frequency. However, this issue needs to be explored further in future research. Another related issue is the still unresolved issue of decomposing superior performance between returns due to selectivity and market timing.
We have also tackled the issue of survivorship bias and found that this bias could overestimate the superior returns performance of funds in a significant economic way. In addition, we have taken care to minimise the effect of sample selection bias and HAC by using complete population of funds and estimating robust standard errors. We also find evidence that especially on a monthly frequency, the stock picking and market timing abilities can coexist. This appears more plausible than assuming that fund managers might be engaging in activity specialisation pursuing one of the either strategies. Across all the variations of the model studies, the four-factor models better explain mutual fund returns than the regular versions.
Declaration of Conflicting Interests
The author(s) declared no potential conflicts of interest with respect to the research, authorship and/or publication of this article.
Funding
The author(s) received no financial support for the research, authorship and/or publication of this article.
Footnotes
Acknowledgements
The authors thank M/s Accord Fintech and M/s IISL Limited for generously providing data. The authors also thank the anonymous referees whose comments were helpful in improving this work.