
Abstract
Banks’ ownership and their performance form two important dimensions of the entire gamut of banking function. This article strives to establish a link between the two by studying commercial banks in India. Conducting a panel data analysis of 89 commercial banks over the period from 2008–2009 to 2012–2013, one could observe that ownership indeed mattered when net interest margin (NIM) or per-employee profitability was considered, but when return on assets (ROA) was considered, there was not much of a difference among banks when differentiated on ownership basis.
Introduction
Banking institutions are among the most important cogs in wheels that take economies forward. But banks also come in many flavours, and such flavours may have important repercussion as regards functions performed by them and how such functions are performed. One of the important dimensions of banking is related to ownership. Ownership manifests itself in various forms as far as Indian banking landscape is concerned. Even if we restrict ourselves to commercial banks, 1 we have SBI, 2 SBI associates, old private sector banks, new private sector banks 3 and foreign banks. One may aver that different forms of ownership may significantly affect the priorities of business, 4 the work culture 5 and public perception. 6 These aspects and considerations may ultimately impact the performance of banks. Micco, Panizza and Yanez (2007) found that even though the association between ownership and bank performance was not well established in industrialised countries, it was very much evident in developing countries. Lin and Zhang (2009) found such association in Chinese banks and observed that bigger public sector banks tended to be less profitable. In the Indian context, Sathye (2003) paradoxically found that public sector banks were more efficient than private sector banks. This study strives to establish a link between ownership and profitability by studying commercial banks in India.
Indian commercial banking sector is a vibrant one having nationalised banks; foreign banks; private sector banks that were established before financial liberalisation in 1991, and those that were founded afterward; the State Bank of India (SBI); and SBI associate banks. In our study, we are not clubbing SBI and its associate banks along with nationalised banks and studying them as public sector banks; rather we want to study them separately to decipher any fundamental differences within different set of banks. In our knowledge, this is the first study that explores the linkages between ownership and banks’ performance when SBI and its associates are treated as separate groups.
Conducting a panel data analysis of 89 commercial banks over the period from 2008–2009 to 2012–2013, we could observe that ownership indeed mattered when net interest margin (NIM) or per-employee profitability was considered, but when return on assets (ROA) was considered, there was not much of difference among banks when differentiated on ownership basis.
Literature Review
Short (1979) was among the first authors to comment on the relationship between ownership and profitability in ex-US countries. Based on his study of banks in Canada, Western Europe and Japan, he found out that the government owner banks underperformed their private sector counterparts. However, the interesting observation he made was that higher concentration (measured by higher market share) lead to higher profitability. As most of the public sector banks in India have high market share, it would be interesting to observe how two seemingly conflicting observations, that is, government ownership leading to lower profits for PSU banks and higher concentration increasing their profitability (vis-à-vis private sector banks), are reconciled for Indian banks.
Demirgüç-Kunt and Huizinga (2000) studied banks in 80 countries over the period of 1998–1995 and found that international ownership significantly impacted banks’ profitability. Barth, Caprio and Levine (2004) studied banks in 107 countries and reached the conclusion that government ownership leads to efficiency impairment. Lin and Zhang (2009) studied banks in China where government ownership of banks is especially noteworthy given to the fact that even the investment decisions of such banks are driven by political compulsions and considerations. Authors found that the ‘big four’ public sector banks in China were less profitable and less efficient than other banks and also had poorer quality of assets. Micco et al. (2007) studied the relationship between ownership and bank performance separately for developing and industrialised countries. They found that the public sector banks in the developing countries had lower profitability and higher costs when compared to private sector banks; opposite was true for foreign banks that were more profitable and had fewer costs than private sector banks. The relation between ownership and performance, however, blurred when banks in industrialised countries were considered. De Nicolò and Loukoianova (2007) made two important observations in this regard after observing banks in non-industrialised countries over the period of 1993–2004. They observed that the public sector banks having a high level of market share had a higher risk of failure, which meant that they lagged on the performance parameter keeping other things unchanged. They further noted that the risk profile of public sector banks was not significantly different from that of the private sector banks, though foreign banks were in different league. Iannotta, Nocera and Sironi (2007) studied 181 banks in 15 European countries and observed that public sector banks were indeed less profitable, but operated at a lower cost. They further found out that public sector banks had poorer asset quality and a higher risk of insolvency. As regards Indian banks, Rao, Rezvanian and Nyadroh (2009) explored the link between ownership and profitability by considering three ownership groups, namely, publicly owned domestic banks, privately owned domestic banks and foreign bank and concluded that foreign banks were the best performers among the three. Gupta, Kochhar and Panth (2011) studied the banks in India with the objective of looking at the impact of financial liberalisation on their functioning. Based on their analysis over the period of 1991–2007, they found that the public sector banks kept on investing in government securities and financing the fiscal deficit even when there was no requirement for them to do so. They observed that limited avenues for investments prevented banks from realising the full potential of financial liberalisation. It is not clear why the same scenario does not hold true for the private sector or foreign banks operating in the country. Dietrich and Wanzenried (2011) analysed the profitability of 372 Swiss commercial banks and, among other things, found that ownership was indeed an important determinant of banks’ performance.
As against the relationship between ownership and bank performance established in the studies noted previously, there have also been some findings to the contrary. Bourke (1989) studied 90 banks over the 10-year period (1972–1981) in 12 countries in three continents Australia, North America and Europe. Based on the novel concept of ‘value added’ by banks (as a metric of bank performance), he reached the conclusion that relationship between ownership and performance was a tenuous one. Molyneux and Thornton (1992) used the methodology used by Bourke and studied banks in the Western Europe. They studied an unbalanced panel data between 1986 and 1989 derived from 18 European countries. They reached a conclusion that government ownership, in fact, positively affected the ‘return on capital’.
Hypothesis Development
In this article, we are striving to explore the linkage between ownership and bank’s performance. Ownership is divided into six groups—SBI, SBI associates, nationalised banks, old private sector banks, new private sector banks and foreign banks. Because of special status that SBI enjoys, we are putting it separately from other nationalised banks, lest it masks some attributes of the nationalised banks as a group. Moreover, we want to see how SBI performs vis-à-vis other types of ownership, ceteris paribus. The SBI associates have also been considered a separate group for the same reason. As regards private sector banks, we are considering old and new private sector banks separately to observe some inherent difference between the two groups. As regards profitability, we are considering three different measures of the same—NIM, ROA and profitability per employee to get a peek on three different aspects of performance and also to differentiate this study from earlier attempts in this respect. These measures have been extensively used in the literature. NIM provides the difference between interest earned on loans and advances and that ceded on deposits. It shows the financial strength of a bank and has been used as a performance measure in this analysis (refer Bonin, Hasan, & Wachtel, 2005; Micco et al., 2007; Albertazzi & Gambacorta, 2009). The ROA, given by net profit divided by total assets, shows how a firm, including a bank, utilises its assets and is widely used as a measure of financial performance (refer Bonin et al., 2005; Athanasoglou, Brissimis, & Delis, 2008; Lin & Zhang, 2009). Another important measure of profitability would be to see the per-employee profitability, given by net profit divided by the total number of employees, which would indicate how productively the most important of all resources, namely, the human resources, are deployed (refer Bryan, 2007).
We would, therefore, be testing three different hypotheses that are stated further in alternative form:
H1-A Ownership affects banks’ performance by impacting the NIM;.
H2-A Ownership affects banks’ performance by impacting the ROA; and
H3-A Ownership affects banks’ performance by impacting the profitability per employee.
Taking cognizance of the fact that size of different banks can significantly influence the profitability status of banks, we control for the same by including ‘log of advances’ in the regression analysis.
Data and Methodology
Panel data for this analysis has been prepared from the data available from the website of the Reserve Bank of India (RBI), the central bank of India. Totally, 89 commercial banks have been considered over the period from 2008–2009 to 2012–2013. The dataset consists of 43 unique foreign banks, 20 nationalised banks, five SBI Associate banks, SBI, 13 old private sector banks and seven new private sector banks. The descriptive statistics of the data is given in Table 1.
Descriptive Statistics
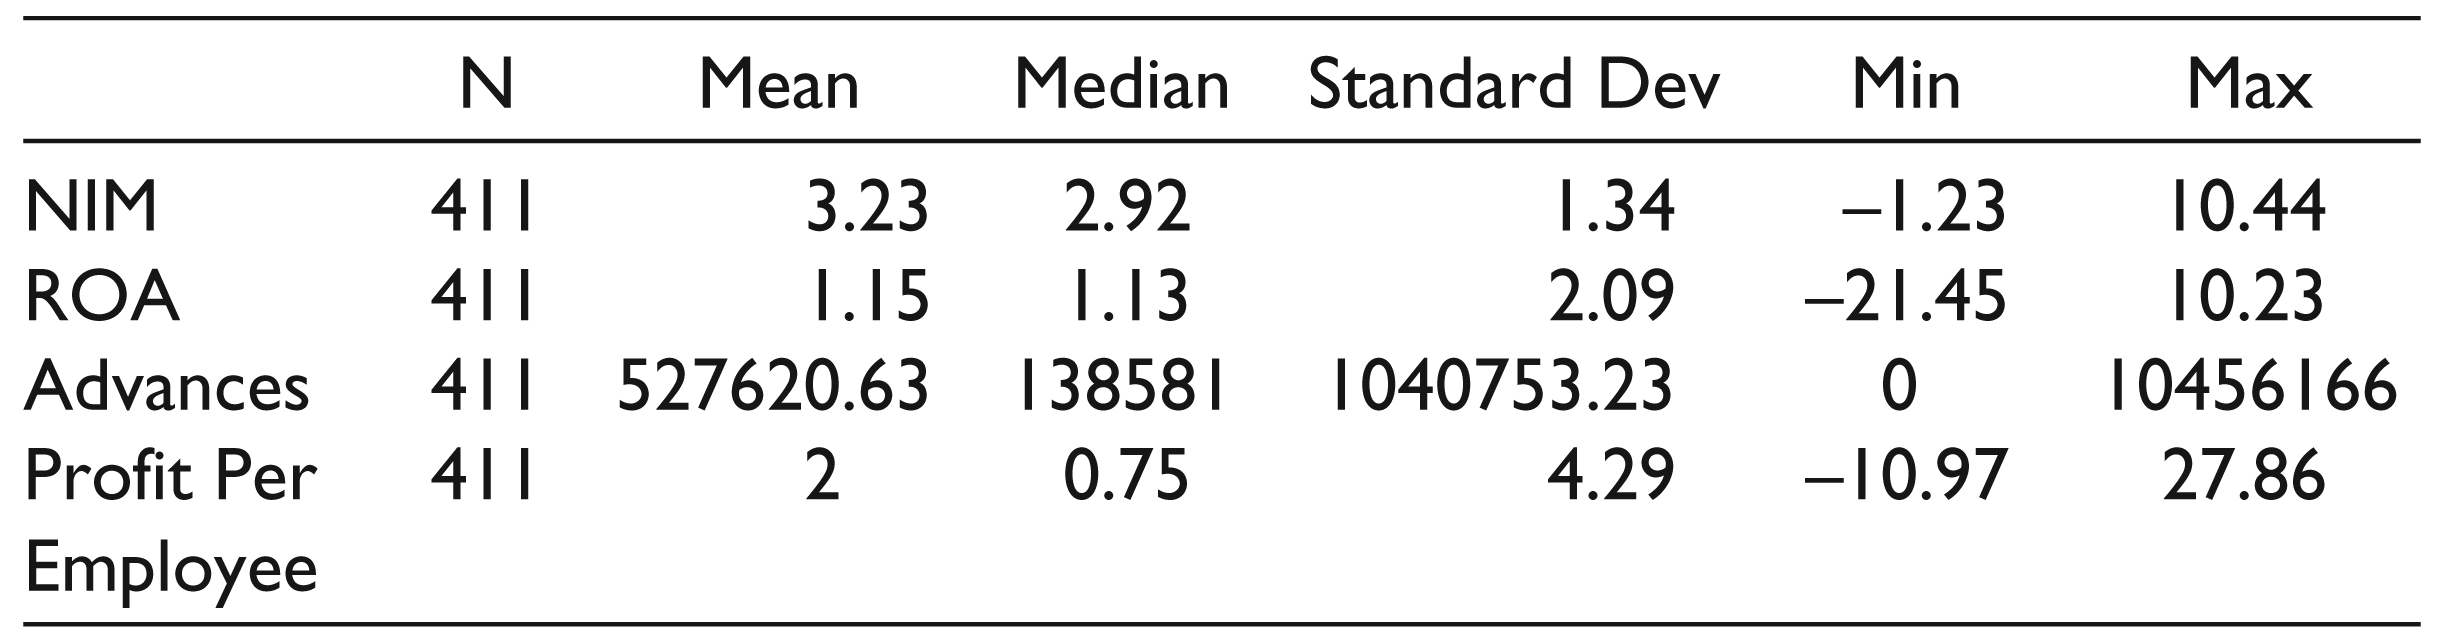
Descriptive Statistics
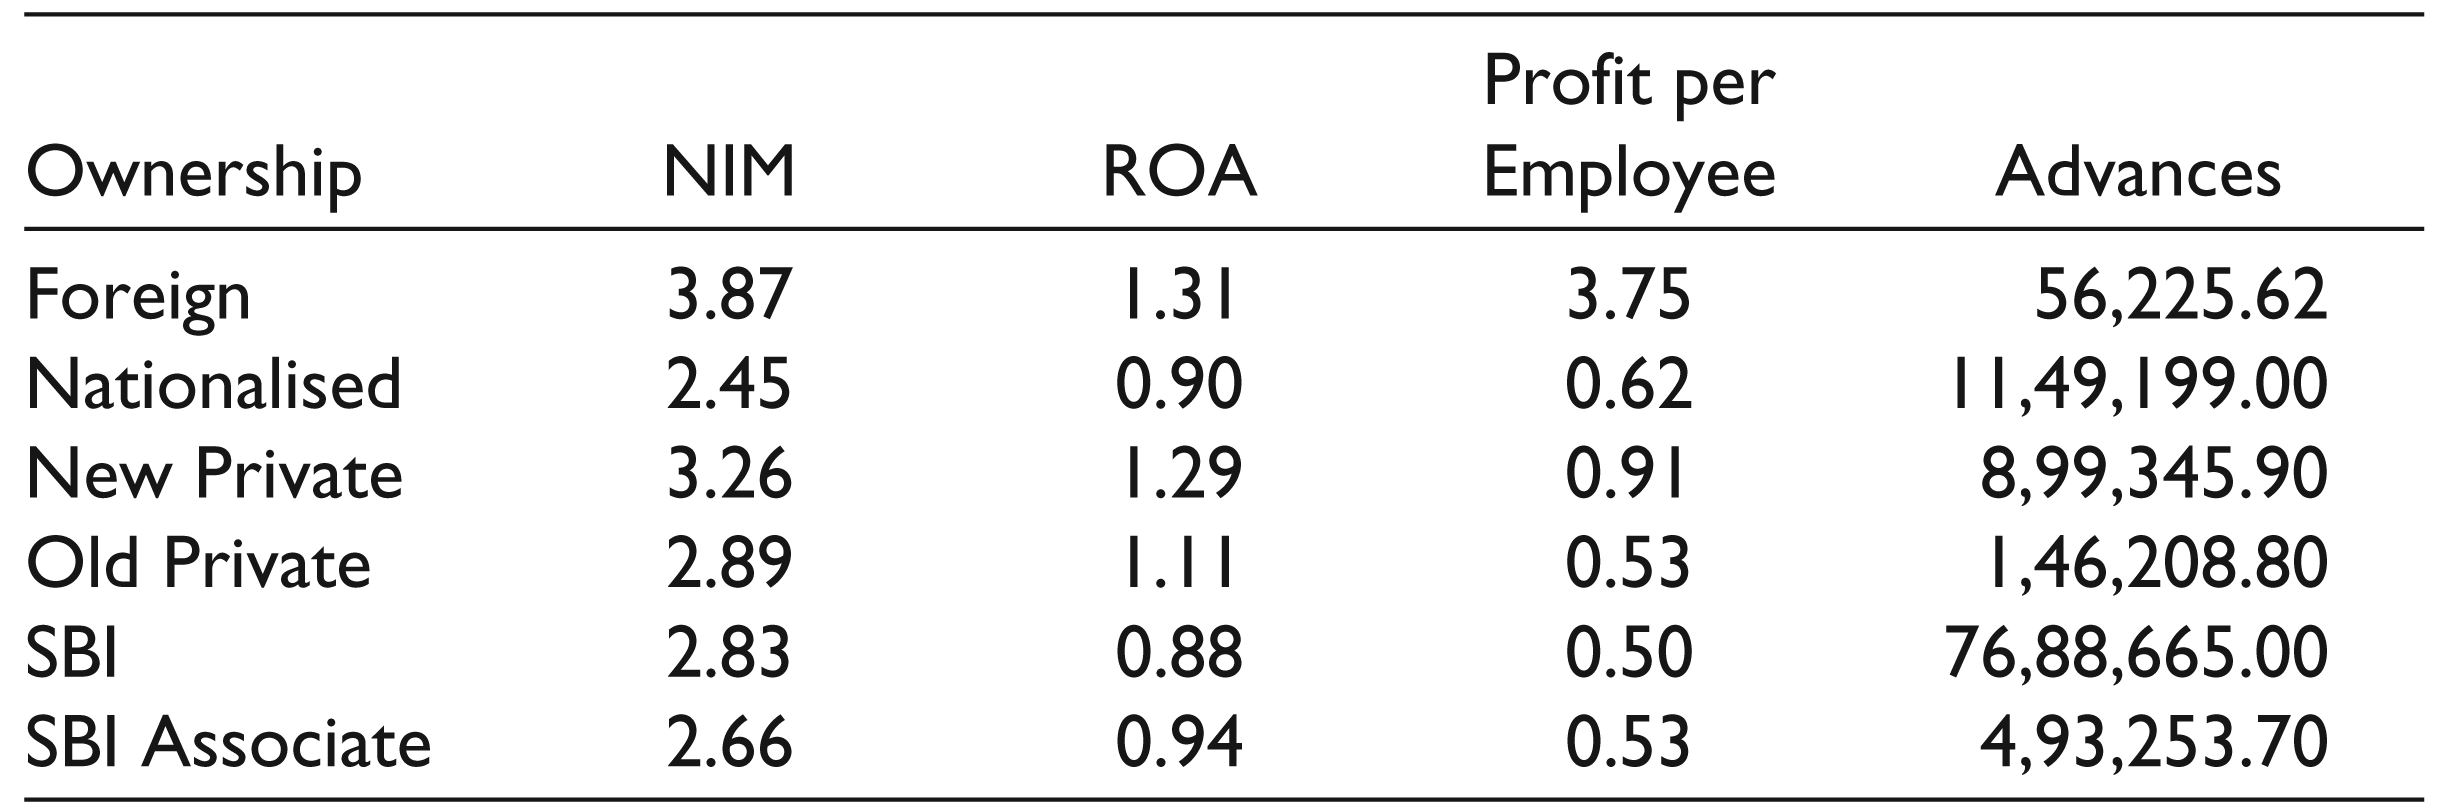
It will be more informative to see how different variables stand up if separated by ownership. The same is given in Table 2.
From Table 2, one gets inkling that foreign banks have been doing rather well on all the parameters, namely, ROA, NIM and profit per employee. Similarly, the new private sector banks have been doing well on the three parameters considered here when compared to public sector banks that include SBI, SBI associates and nationalised banks. Even the old private sector banks are doing better than the PSU banks at least on ROA and NIM. It, however, remains to be seen whether the differences in mean performance parameters are statistically significant. For the same, we have used the panel data regression. In this analysis, the dependent variable is the performance variable NIM, ROA or profitability per employee while the independent variable is ‘ownership’ type, which goes into the analysis as ‘dummy variables’, ‘foreign’ being the base scenario. To avoid ‘size of a bank’ impacting the results, log of ‘advances’ has been used as a control variable in the analysis.
Mean of NIM, ROA, Profitability/Employee and Advances Ownership-wise
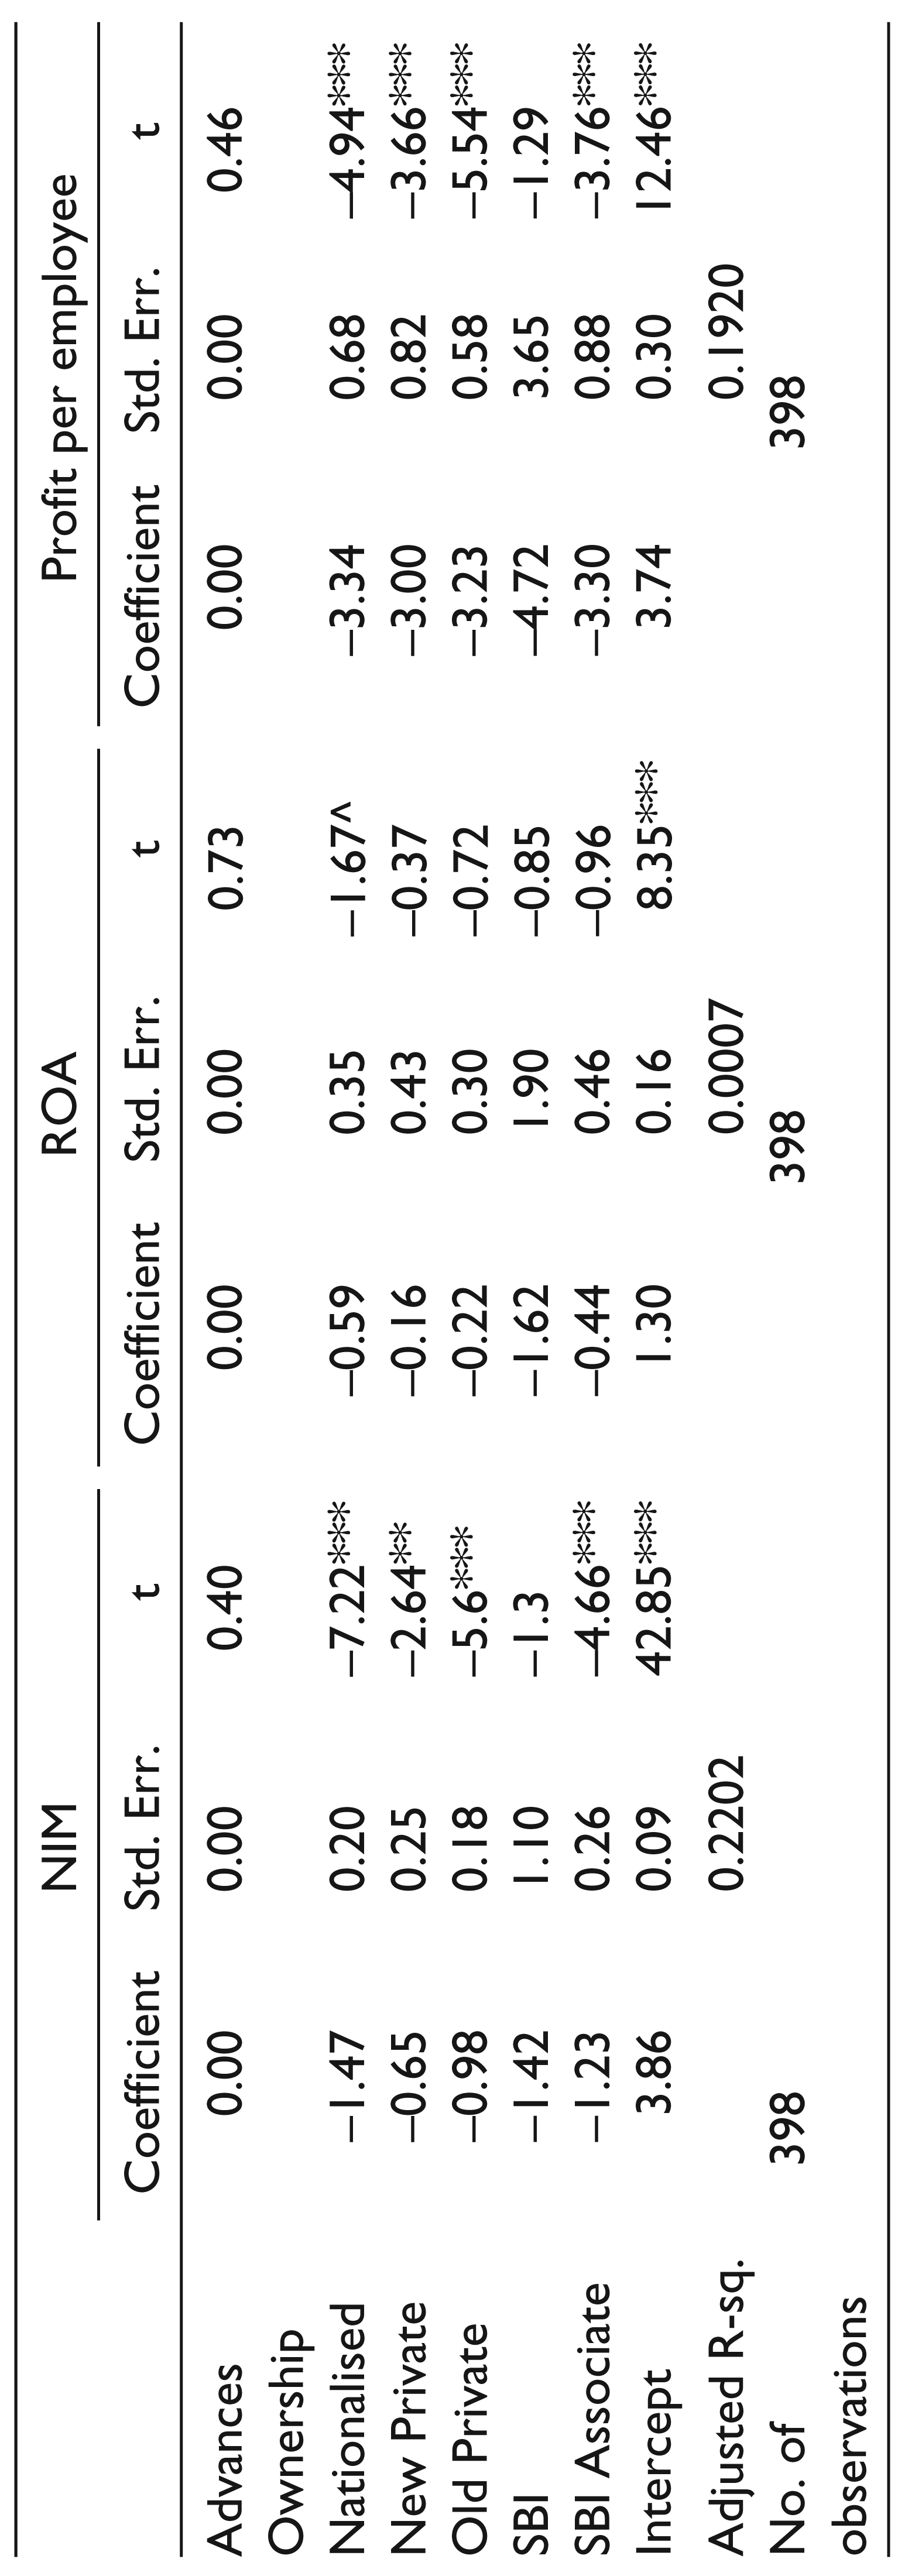
Before doing the panel data analysis, we first did a pooled OLS linear regression on the entire panel data to see how ownership variables are associated with bank performance measures when entire pooled data are used. The output of the same is given in Table 3.
Table 3 provides an estimation of regression coefficients when foreign ownership has been taken as the base case scenario. One observes that as regards NIM, the coefficients for various ownership variables are highly significant (at either 0.001 or 0.01 significance level) as compared to foreign ownership and, moreover, the coefficients are negative showing that foreign ownership results in significantly higher NIM compared to PSU or private sector domestic banks. The only exception is SBI, which, though, shows negative NIM relative to that shown by foreign banks, yet the coefficient is not significant. The interpretation, however, is not that straightforward when ROA is studied. Though the coefficients for different ownership groups are still negative, they are significantly lower from that for the foreign banks only in case of nationalised banks (at 0.10 significance level). As regards the profitability per employee, foreign banks are doing significantly better than other ownership categories, again with the sole exception of SBI.
However, OLS estimation may provide only an indicative association when analysing a panel data. It may not consider the impact of heteroskedasticity over time and also the serial correlation between different data points over the years (Wooldridge, 2013). We, therefore, carry out the panel data analysis to gather more insights. We are trying to compute the following regression,

Where NIM, ROA or Profit/employee is the dependent variable; Dis are the dummy variable representing the ownership status. We have five variables for six categories of ownership, namely, SBI, SBI associate, nationalised, old private sector, new private sector and foreign. ‘Foreign’ is treated as the base case scenario; Log of ‘Advances’ is included as a control variable for size; i varies across the banks, while t varies from 1 to 5 (2008–2009 to 2012–2013); and uit is the error term.
OLS Estimation of Regression Coefficients
OLS Estimation of Regression Coefficients
(ii) The table gives regression coefficients for three different regressions. Ownership is the common independent variable (in the form of a dummy), whereas NIM, ROA and profit/employee are the dependent variables in the three regressions considered. Log of Advances is used as a control variable for size.
Panel data have been analysed for both ‘fixed’ and ‘random’ effects. Fixed effect model would be more appropriate if we were only interested in analysing the impact of those variables that vary over time. As our explanatory variables are indicator variables that do not change, they would be lost in the fixed-effect analysis. We observe that the fixed-effect model, though highly significant, considers only the control variable in the regression equation. As the variables under consideration (i.e., ownership) are not themselves changing over the time, fixed-effect model is not suitable for carrying out the desired analysis. Moreover, as the number of years (5 financial years) is less compared to the total number of commercial banks (89), using a random effect model would be more appropriate.
We, therefore, decided to use ‘random effect’ model for our analysis. To check for heteroskedasticity and serial correlations, we have used Huber–White sandwich variance–covariance estimator. The output of this analysis is given in Table 4.
We notice that as compared to foreign banks, NIM and profit per employee for all the other groups are significantly lower, which also includes SBI. Even in the case of ROA, all the ownership coefficients are significantly lower than that for the foreign ownership at 0.05 level (except for the new private sector banks, whose coefficient is significant at 0.10 level), which is divergent from the results we obtained earlier in the case of pooled OLS. The intercept term that captures the significance level of the reference dummy variable, namely, foreign banks, is itself significant in the case of NIM and profit per employee. Results in this section make it amply clear that the first (NIM) and third hypotheses (profit per employee) in the null form are liable to be rejected; even the second hypothesis related to ROA is to be rejected in certain instances.
Random Effects Model
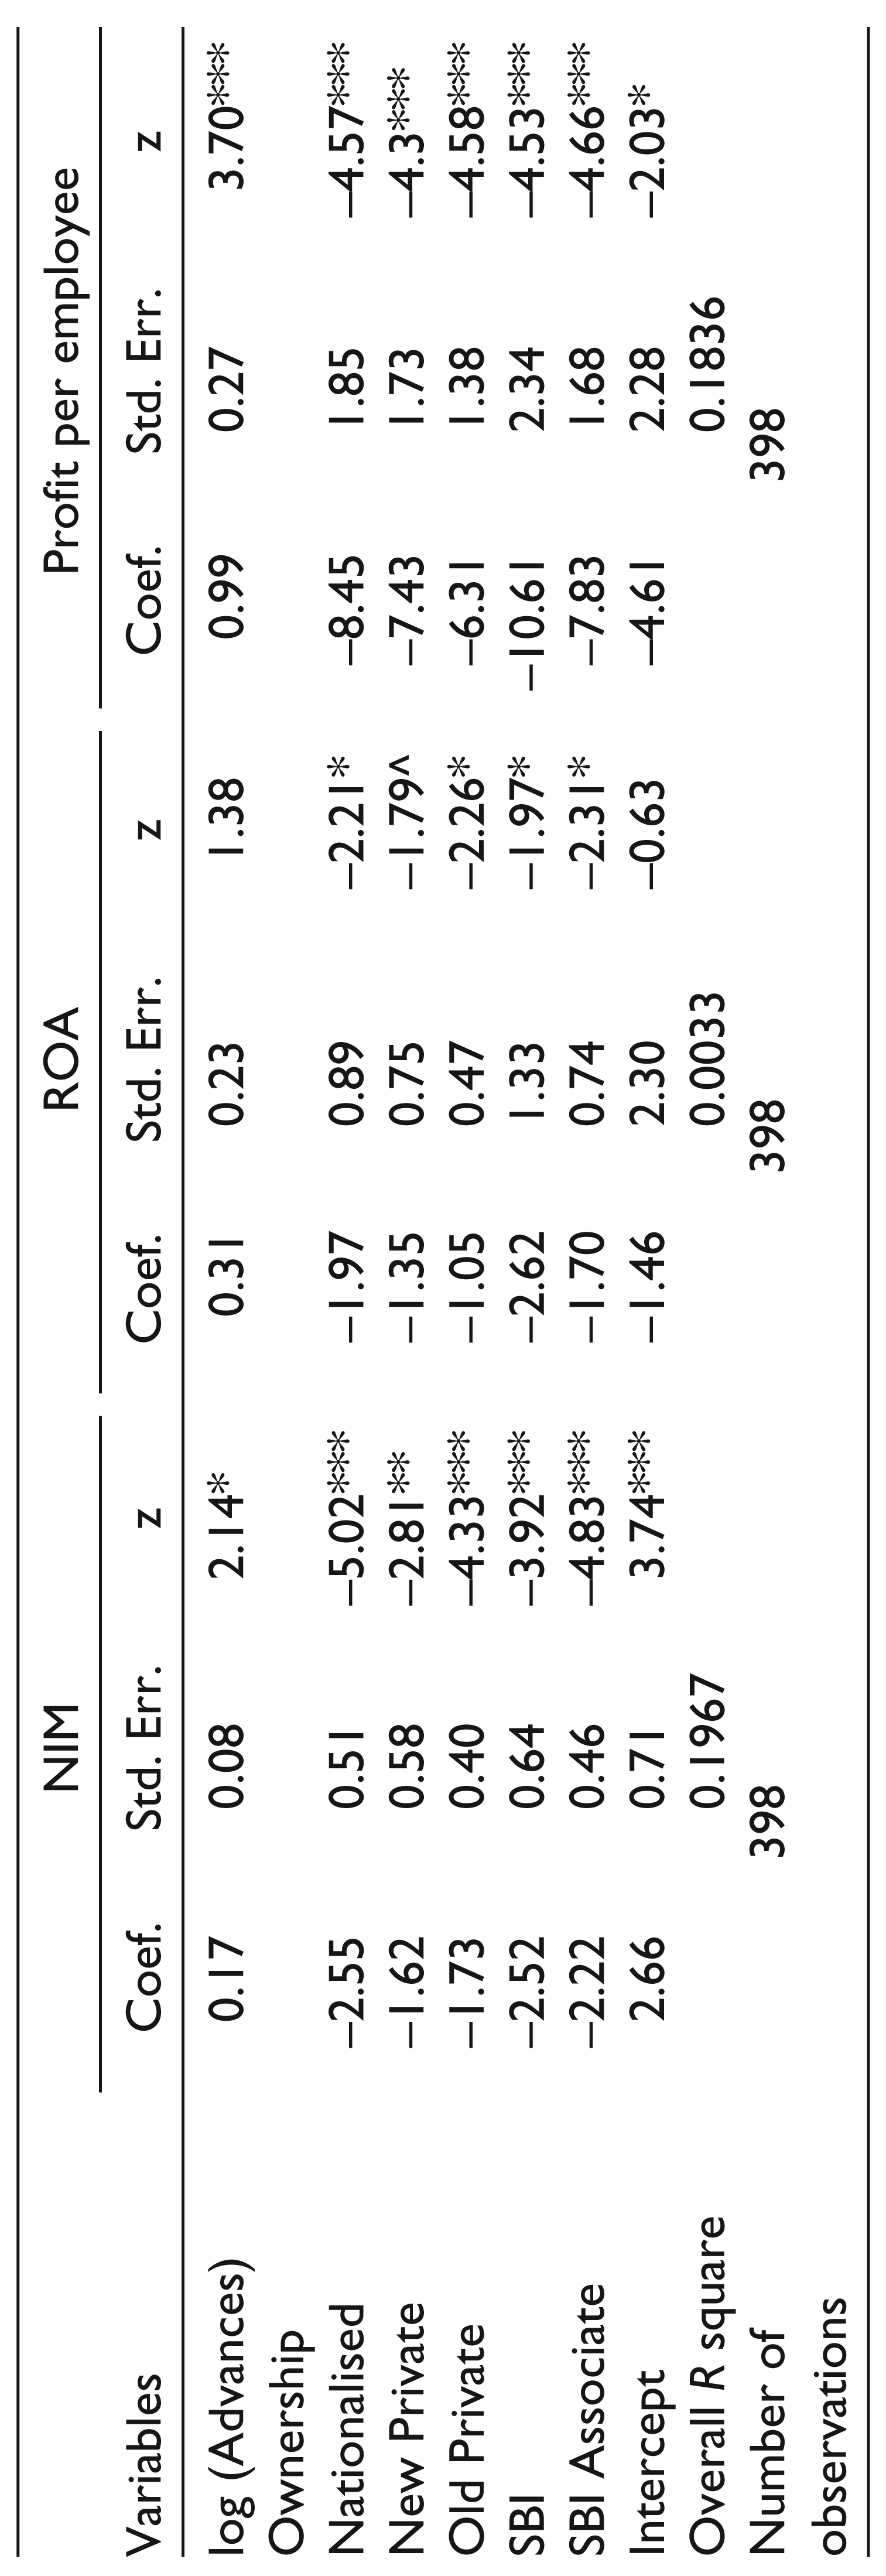
(ii) This table provides the coefficients for panel data analysis run for three different sets of dependent variables, namely, NIM, ROA and profit/employee.
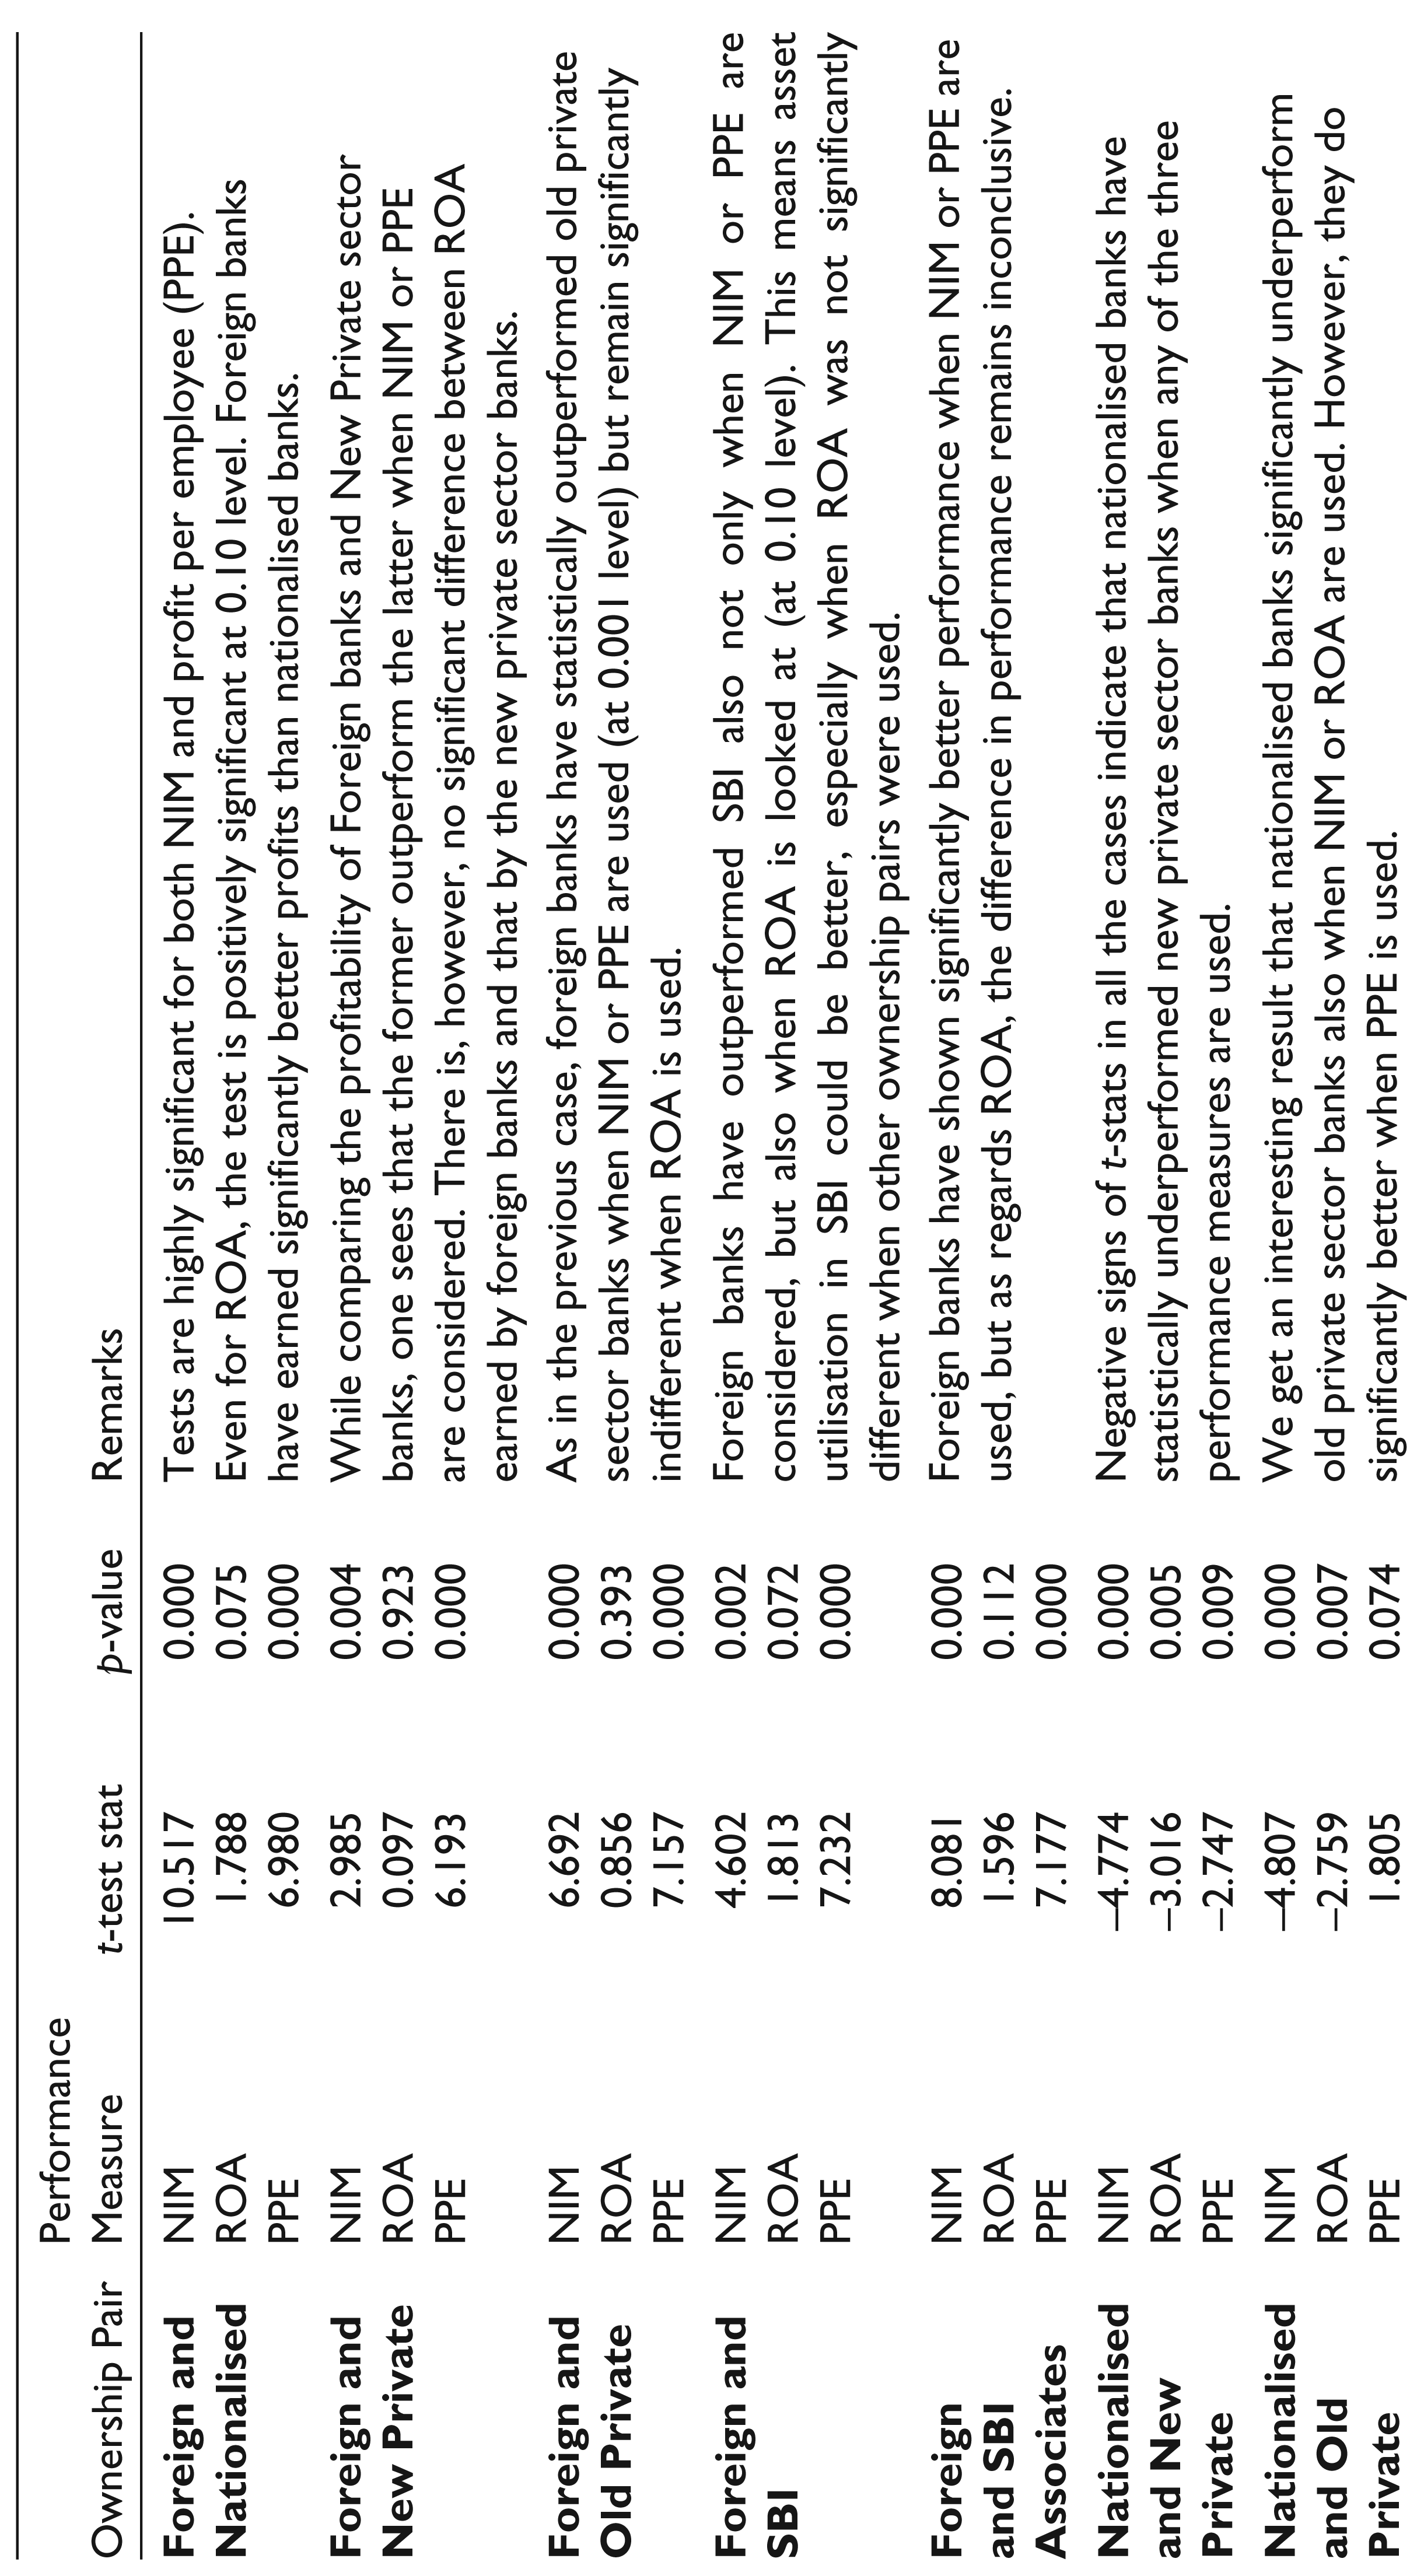
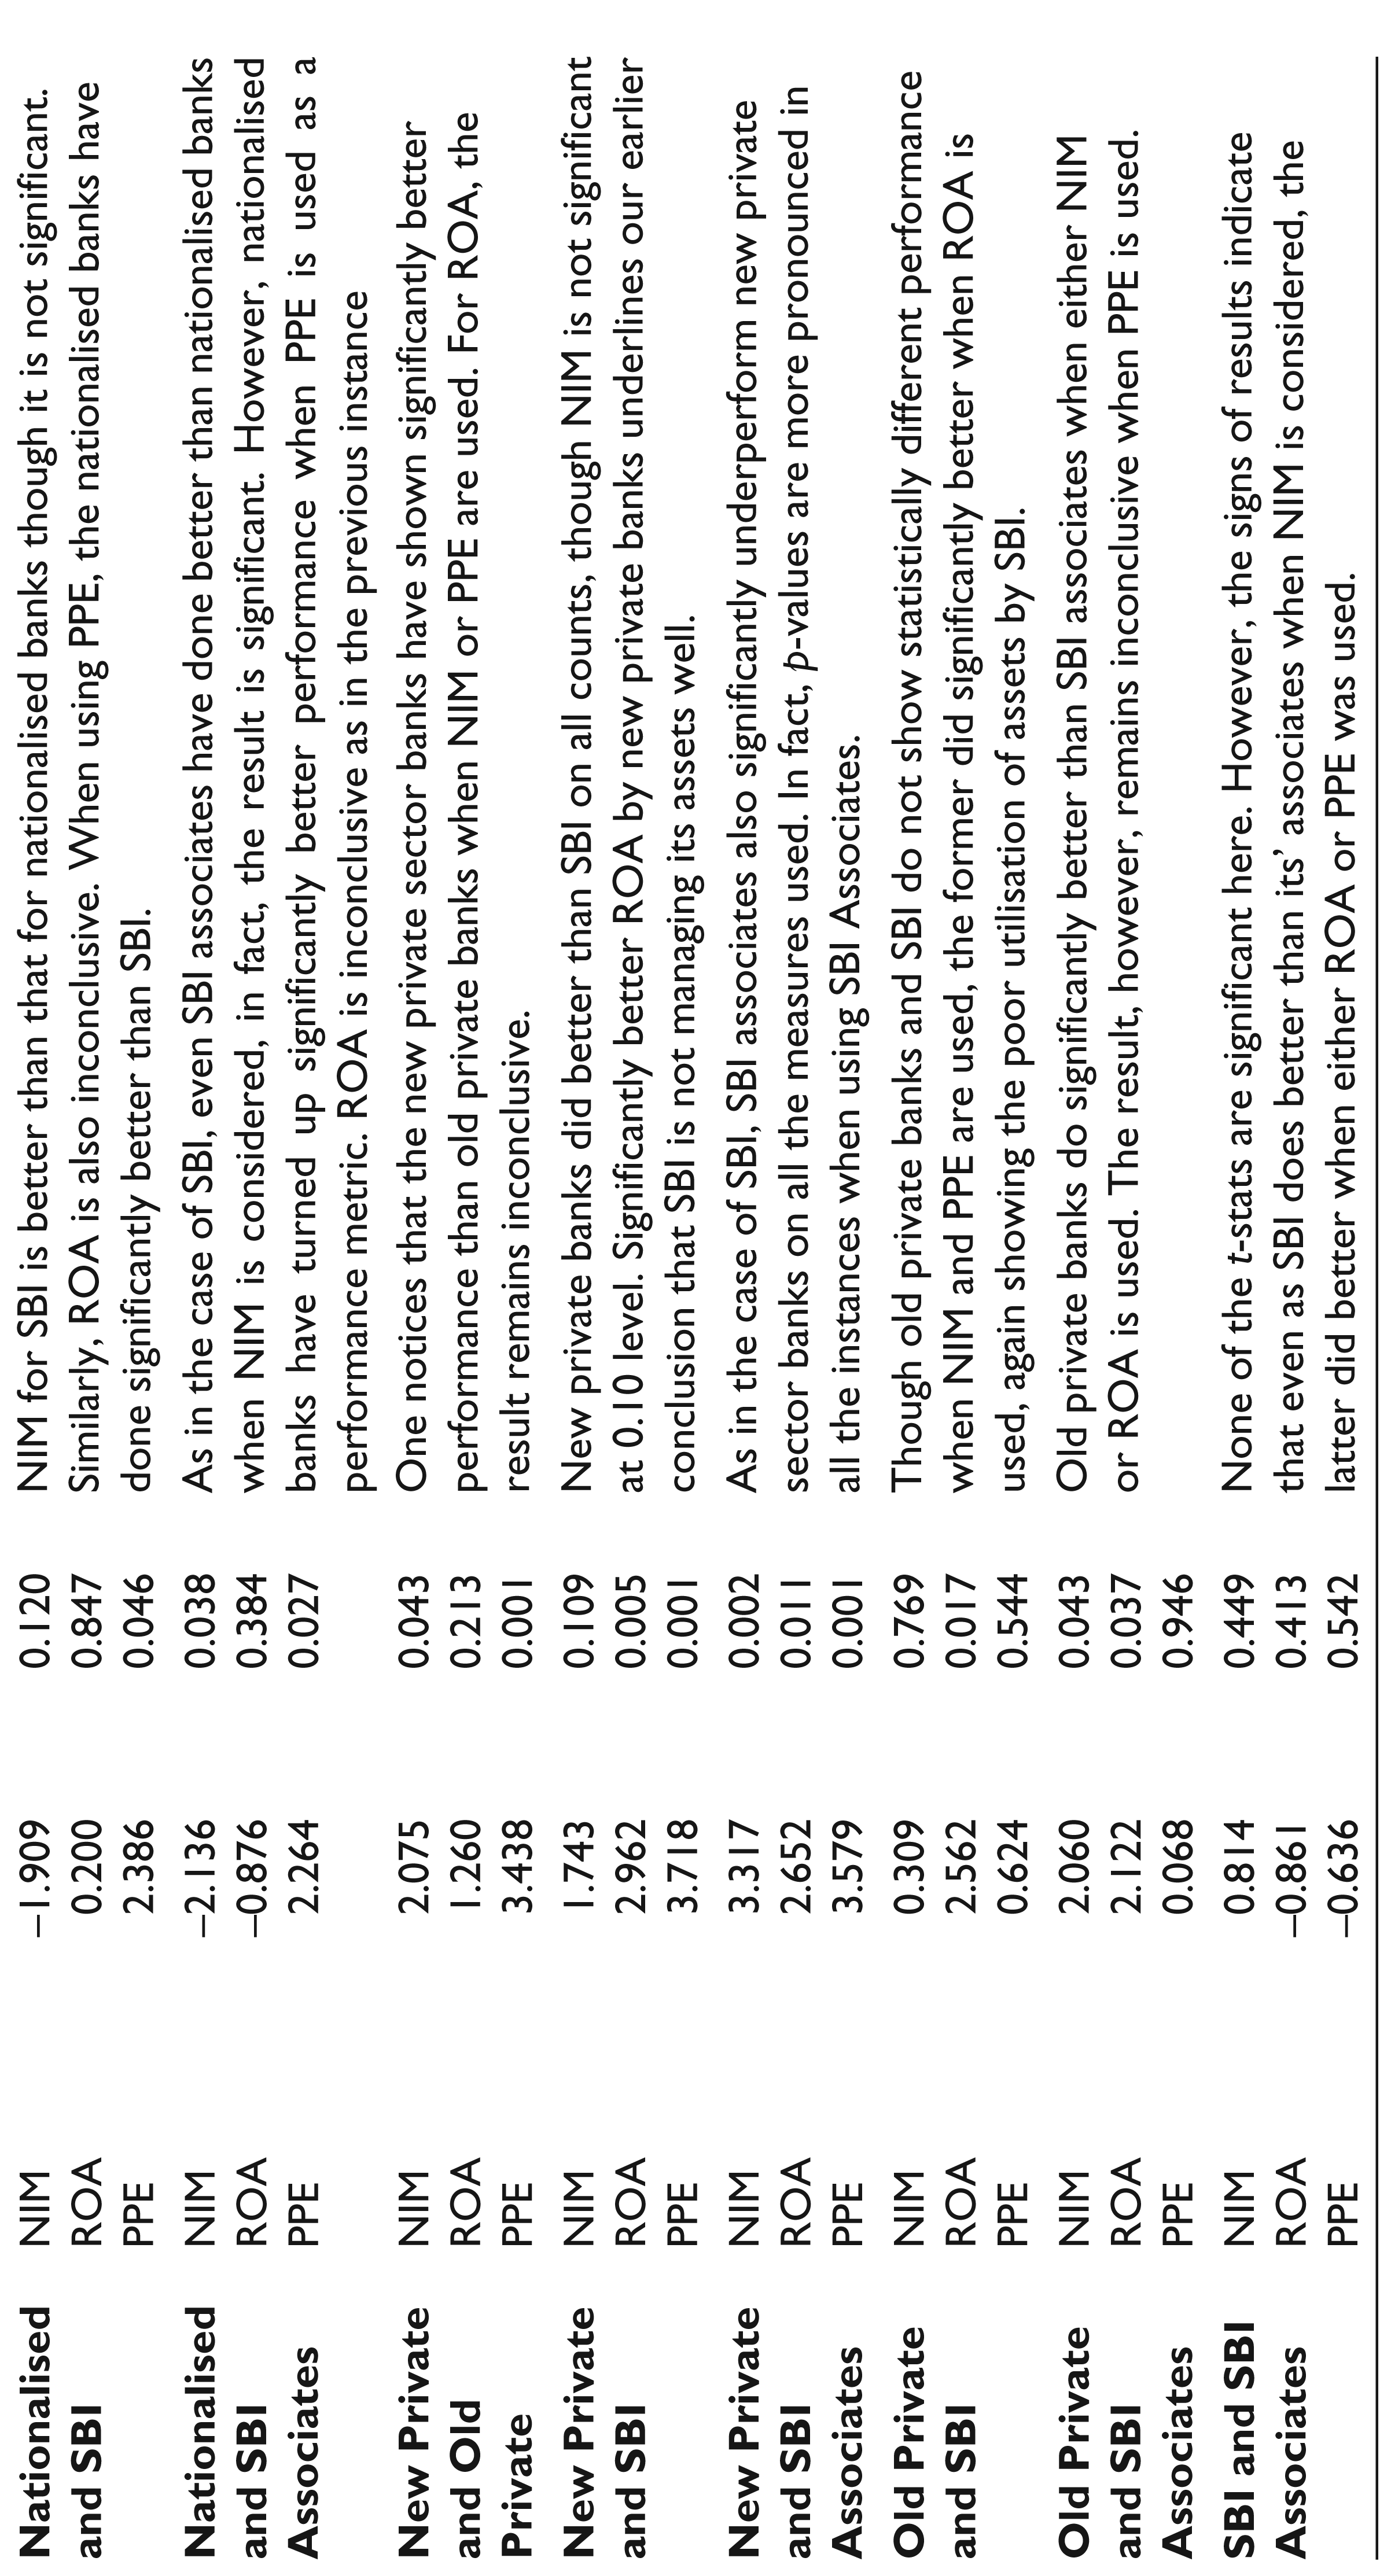
A look at the descriptive statistics and significance levels of different ownership groups in the regressions mentioned previously suggests that there may be intergroup differences in performance parameters. As the discussion so far has used foreign banks as reference ownership variable, we could assess the impact of other types of ownership vis-à-vis foreign banks only. We thought to consider all the possible pairs of ownership variables to see whether the mean performance metrics were statistically and significantly different from each other. As we have six categories of ownership, we get C2 6 , that is, 15 such pairs to analyse. We have, therefore, conducted 15 Welch two-sample t-tests with the alternate hypothesis that the true difference in the means of performance measures of the ownership groups considered are not zero. Result of this analysis is given in Table 5
This analysis reveals that foreign banks outperform all the other categories including SBI, SBI associates, or even the new private sector banks in all the performance metrics, barring ROA when results are inconclusive in a few instances. After foreign banks, it is the new private sector banks that turn up significantly better performance (again the exception is ROA, which is not consistently significant) than other categories of banks. One notable exception is NIM, for which the mean performance of new private sector banks is not significantly better than that of SBI, though the difference is positive. We also notice that the SBI, which is by far the biggest bank in the country, statistically lags behind when either foreign, or new private, or even old private banks are considered, which means that it could do well if its assets are put to more productive use. Another point worth noting is better performance of nationalised banks vis-à-vis both SBI and SBI associates when profitability per employee is considered, which means SBI and its associates 7 are lagging behind in the productive utilisation of human resources.
Pair-wise Comparative Analysis of Groups of Banks Considered
This analysis on Indian commercial banks reveals that there exist significant differences in performance parameters among different ownership groups. Foreign banks are by far the best performing followed by new private sector banks. Nationalised banks, old private sector banks, SBI and SBI associates need to do some catching up. The analysis also reveals that foreign and new private sector banks have been unable to translate their superior performance on the parameters of ‘NIM’ and ‘profitability per employee’ into ‘ROA’, on which it is only the nationalised banks and SBI that are significantly falling short of foreign banks. These results hold important policy implications, and one may ask questions why nationalised banks, and SBI and its associate banks are consistently lagging behind the foreign banks and new private sector banks when we look at the performance measures considered in the study. Is it because of poor utilisation of assets, technology or human resources or is there a cost to pay for nation building, where government-mandated lending to poorer and needy section of the society are primarily executed though the public sector banks only?
One of the key limitations of the study is the use of limited dataset as per the data availability from the RBI website while writing the papers. Though we believe that the dataset considered was adequate to reach informed conclusions, a bigger and more recent dataset is expected to provide more robust results. Another limitation of the study is to use a single control variable as we were primarily concerned with the interplay of six ownership variables and bank performance metrics. Even though we controlled for the size of banks, one may expand the set of control variables to see whether results show any deviations.
Declaration of Conflicting Interests
The author(s) declared no potential conflicts of interest with respect to the research, authorship and/or publication of this article.
Funding
The author(s) received no financial support for the research, authorship and/or publication of this article.