
Abstract
The present study examines the signaling effects of a firm’s dividend policy in developing economies (India, Brazil, China, and Taiwan) from 2010 to 2020 in 4,630 companies’ observations. It highlights that the Indian market indicates greater intensity to the signaling model, though no such reactions were recorded in the Brazilian and Taiwanese markets. Further, the Lintner partial adjustment model reveals that companies in India adjust dividends at a slower rate as compared to other emerging markets like China, Brazil, and Taiwan. We found that the Lintner model is the behavioral consequence of the applicability or non-applicability of dividend signaling theory in these emerging economies.
1. Introduction
Miller and Modigliani (1961) affirmed that dividend policy has no effect on the value of a firm. But this scenario holds true in a perfect and frictionless environment when there is no information asymmetry. In a more realistic environment, dividend policy might affect the price of a company. Dividends contain information content and a change in payout policy would reflect a shift in management’s assessment of future profitability. Lintner (1956) noted that dividends are inherently sticky and that management is hesitant to adjust payout levels in order to maintain dividend stability. He was the first to suggest that the dividend contains information about future earnings, which was also validated by Bhattacharya (1979) and Miller and Rock (1985). Because of the increased information asymmetry between managers and outside shareholders, dividend change is used as a signaling tool for the company’s future performance. According to the dividend signaling model, dividend increases (cuts) will predict increases (decreases) in future earnings. However, mixed results are reported with scant evidence on whether dividends convey any information about future earnings, especially in emerging markets. Recent studies have found evidence of the informational content of dividends (Al-Najjar & Kilincarslan, 2019; Hoang & Hoxha, 2020; Liljeblom et al., 2015). However, DeAngelo et al. (2004) and Benartzi et al. (1997) found limited support for the view that dividend changes have information content.
This article attempts to examine the informational content of dividends for firms in key developing economies such as Brazil, India, China, and Taiwan. To select emerging economies, we referred to indices that have been recognized as the top global market in 2017 (PWC, 2017) and select economies should constitute a significant share in the database of the FTSE all-world index and MSCI world index. According to the PWC report, the 2017 emerging market could grow twice than the advanced market by 2050. As a result, four of the five largest economies in the world are projected to be emerging economies in 2050 led by China (1st), India (2nd), and Brazil (5th) (PWC, 2017). We considered Taiwan and excluded Indonesia based on the criteria of the FTSE all-world index. The FTSE all-world index is a market-capitalization-weighted index covering both developed and emerging markets. Among emerging markets, China, India, Taiwan, and Brazil are the top emerging markets that have the highest representation in the FTSE all-world index both in terms of the number of companies and weightage of market capitalization (FTSE, 2022). According to MSCI country classification 2021, China (1,006), Brazil (153), India (424), and Taiwan (386) have the highest share in the total securities of MSCI emerging markets (MSCI, 2021). Based on the criterion of market capitalization and growth, we considered China, India, Brazil, and Taiwan as our sample markets.
There is limited literature available for companies in developing countries as the majority of existing research is centered on developed markets. Additionally, different levels of information asymmetry between managers and shareholders in companies across different countries are a driving force behind the study of dividend signaling models. 1 The recent changes in corporate governance in emerging markets are promoting their stability and financial growth, which is encouraging for investors searching for alternative places to invest, hold, and earn dividends. As a result, a comparison of these markets contributes to the body of literature and is vital for global stakeholders and potential investors, and it offers valuable managerial insights.
Unlike developed markets, firms in emerging markets, particularly Indian corporations are known for their concentrated ownership and family-controlled businesses (Rajput & Jhunjhunwala, 2019). In Indian corporations, the existence of controlling shareholders and family-run businesses leads to agency issues and increased information asymmetry (PWC Survey, 2016). Chinese companies do make erratic changes in their dividend (Zhihua et al., 2017) perhaps due to state ownership and being a civil law country. Taiwan is a country where large firms have inherent characteristics of predominance of family ownership, high concentration in ownership, crossholdings, and limited governance framework (Huang et al., 2012). Brazilian firms have characteristics of high ownership concentration, low protection of minority shareholders, and prevalence of large controlling shareholders (Brandão & Crisostomo, 2015). Dividend smoothing and signaling are activated when there is a high concentration of ownership (Al-Najjar & Kilincarslan, 2017; Baker et al., 2007). It’s intriguing to compare the performance of companies in the emerging markets, given the disparities in ownership structure, legal framework, and the resulting information asymmetry.
This article has been categorized into six sections pertaining to the introduction of dividend signaling, discussion of literature, formulation of research gaps, application of comprehensive methodologies, empirical results, implications, and finally conclusions with respect to our results.
2. Literature Review and Research Gaps
Most of the literature is concentrated on the developed countries like the USA and the UK, hence leaving gap to study emerging economies. In line with Lintner (1956) but in contrast to Miller and Modigliani (1961), 2 Bhattacharya (1979), Miller and Rock (1985), and John and Williams (1985) cited information asymmetry between management and shareholders and supported dividend signaling hypothesis. Baker et al. (1985) supported signaling effects indicating dividend changes convey some unanticipated information to the market. According to Brav et al. (2005), almost all executives believe that dividend payout conveys information, particularly in public firms. Michaely et al. (1995) suggested that dividend initiations led to an increase in price of the firm’s stock whereas dividend cuts lead to a decline in the stock price. Abarbanell and Bernard (1992) and Nissim and Ziv (2001) obtained similar results, validating the signaling hypothesis in explaining the firm’s payout strategy.
A more direct approach to study the informational content of dividends is the time-series relationship between dividends and future earnings, as mentioned by Liljeblom et al. (2015). Kao and Wu (1994) showed that there was a positive relationship between unexpected dividends and earnings. Later, Goddard et al. (2006) discovered evidence for strong relationships between variables like price, dividend, and earnings. Carroll (1995) found a significant positive relationship between earnings forecast revisions and dividend changes. Similarly, many researchers including Brook et al. (1998), Liljeblom et al. (2015), and Lee and Rui (2007) have found positive reactions of dividends on earnings while Farsio et al. (2004) and Grullon et al. (2005) have found no relationship between dividends and earning. Lee (2010a) and Lee (2010b) applied dividend signaling to the Australian and Singapore markets to establish the impact of dividend signaling and supported Lintner (1956). Reddemann et al. (2010) examined German and European insurance companies by considering quarterly data and did not find any empirical evidence supporting these theories. Liljeblom et al. (2015) discovered that dividends do Granger causes future earnings in the case of Sweden and Norway and not in the case of Denmark. Azhagaiah and Gejalakshmi (2015) found out that earnings per share (EPS), dividend per share (DPS), and retained earnings per share (REPS) have long-term association and positive relationship between DPS and EPS (Shareholder wealth) and DPS causing EPS.
The dividend signaling effect has been proposed as a behavioral reason for the dividend smoothing. Al-Najjar and Kilincarslan (2017) showed that Turkish markets follow stable dividend policies as a signaling mechanism with less stable policies than their developed US market counterparts. Later, Al-Najjar and Kilincarslan (2019) argued that dividend signaling is the probable explanation for the stability of dividends owing to the fact that managers are more concerned about the market reaction to changes in dividends. During similar time, Basse (2019) examined the European insurance industry and found the applicability of dividend smoothing, however, they have not found any support for the dividend signaling hypothesis. According to Hoang and Hoxha (2020), dividend smoothing is more common in China and the United States than in Taiwan, wherein dividends are frequently adjusted. Ham et al. (2020) have used an event window approach to show dividends convey information about future earnings over a long-term basis. They have shown that next year’s earnings are greater than current earnings for a company announcing increase in dividends and it is lower for companies announcing dividend cuts. Dixit et al. (2020) could not find support for signaling effect of dividends by using ordinary least square (OLS) regression on Indian companies. Recent studies like Michaely et al. (2021) supported the dividend signaling model, particularly for stable and matured firms.
2.1. Research Gap
There are varied methodologies that have examined the information content and signaling effect of dividends. In order to measure signaling effect, the data can be used either with aggregate variable or firm-level data. Studies like Lee and Rui (2007) and Liljeblom et al. (2015) preferred aggregate data and applied Granger causality to convey that dividend signals information regarding future earnings. Recently, Michaely et al. (2021) have advocated a greater emphasis on firm-level data over aggregate data. As a result, there is no agreement on this topic. From our point of view, when comparing the information content of dividends across countries, aggregate data is preferable since it accounts for the time series features of data. In addition, firm data can be analyzed to further substantiate the reliability of the results. Further, several studies have reported findings based on company-level analyses while neglecting macrodynamic, especially when managerial dividend decisions are influenced by macroeconomic factors. Hence, this study considered both aggregate and individual company data to draw parallels among key emerging economies.
The present study is based on time series data as well as panel regression methodology. Many empirical studies presented the results based on OLS methodology including Lee (2010a). But considering the nature of time series data, OLS methodology possesses an inherent limitation of assuming the variables as stationary though actually the variables may be non-stationary and therefore making the result of OLS methodology as non-reliable, especially in the case of integrated time series at first difference. Third, Goddard et al. (2006) exhibited that there is a lead-lag relationship between corporate earnings and dividend payments and Granger causality where the Lintner adjustment model seems to be the most appropriate methodology. Finally, sufficient research has been presented for developed markets such as the United Kingdom and the United States, but emerging markets have been overlooked. Especially the increasing flow of investment from FII’ in India makes it important that investment perspectives should consider dividend opportunities in India. The research is the first of its type to examine the dividend signaling model in a comparative manner. Another distinctive addition is the use of panel regression to analyze firm-level yearly data as well as the assessment of quarterly aggregate data. This study uses the GMM estimator in a dynamic framework as study’s unique contribution, which adds to its ability to provide rigorous, robust, and consistent findings on the most recent database for firms in developing markets.
2.3. Objective of the Study
While studying the dividend behavior of emerging markets, this article attempts to discover the speed of adjustment (SOA) and target payout ratio (TPR). The primary objective is to examine the link between earnings and dividends and compare the results in key emerging markets. Second, to examine whether signaling theory and Lintner partial adjustment model hold true the difference in information efficiency in these markets. Third, to draw analogies from the results of signaling theory and outcomes of the Lintner model. Precisely, the following research questions arise from the investigation of abundant pieces of the literature. The first research question is given the differences in information efficiency in two markets, does the dividend signaling model hold good in key emerging markets? The second research question is whether the Lintner partial adjustment model is valid in these key emerging markets, despite the fact that their economic, financial, and institutional backgrounds are so dissimilar? These research questions are interlinked. The study makes an important addition by attempting to reconcile the effects of dividend signaling with the results of the Lintner Partial Adjustment Model and draw a link between the two.
3. Data and Methodology
3.1. Sample and Methodology
The Lintner partial adjustment model is applied on the firm-level data of these markets from 2010 to 2020, which is given as follows (shown in Table 1).
Number of Observations for Lintner Partial Adjustment Model.
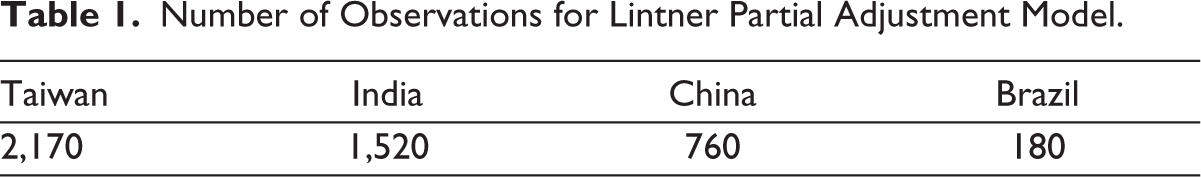
For the selection of companies for each index, the data consists of companies with information availability. All banks and financial services companies along with utility firms have been excluded because they use different accounting policies, which ensure uniformity in accounting ratios (Roy, 2015). The dependent variable in this model is the DPS in the current year, whereas the explanatory variables are lagged DPS (dividend in the previous year) and earnings per share in the current year. This model has been validated using appropriate estimation techniques, including panel estimation and the GMM approach, to ensure consistency in our results. Perhaps the objective of using different models is to make our conclusion more robust and conclusive. The consistency of these models’ results will be able to overcome each model’s limitations.
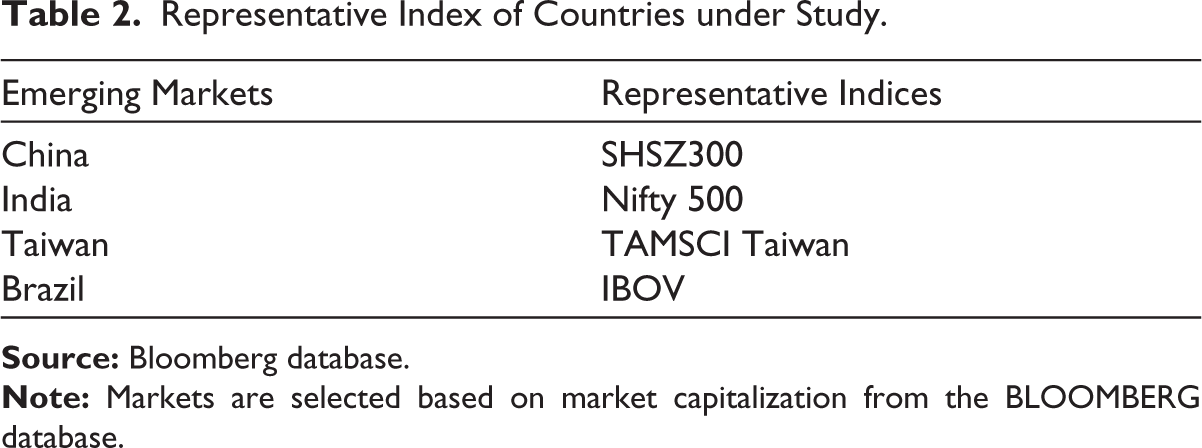
To test the signaling effects, we have considered the aggregate quarterly data for the Indian and US market for the period from 2010 to 2020 collected from the Bloomberg database, especially after the subprime crisis and prior to covid crisis. The following four market constituent indices have been used as representative samples for each country, respectively (shown in Table 2).
Representative Index of Countries under Study.
The variables selected are dividend payout ratio (DPR) and EPS as suggested by Reddemann et al. (2010), Liljeblom et al. (2015), and Lee (2010a), which have been collected from Bloomberg. We applied diverse comprehensive methodologies known as the Augmented Dickey-Fuller (ADF; Dickey et al., 1984) procedure, lag selection approaches like the Akaike information criterion, Schwarz information criteria Hannan Quinn Information criteria, Johansen cointegration test, vector error correction model (VECM), Granger causality test, and impulse response system to obtain conclusive results based on the data sets available.
3.2. Descriptive Statistics
Table 3 exhibits the average DPR of firms in Brazil and Taiwan which is above 55%, that is, greater than the average DPR of Indian companies, 28.16%, and Chinese firms, 28%. Further, in order to compare the variation of DPR, we can gauge the standard deviation of the DPR and EPS. The variation in the DPR as measured by the standard deviation for Indian companies is 5.4 and for China is 3.05, which is very low as compared to Brazil and Taiwan.
Descriptive Statistics.
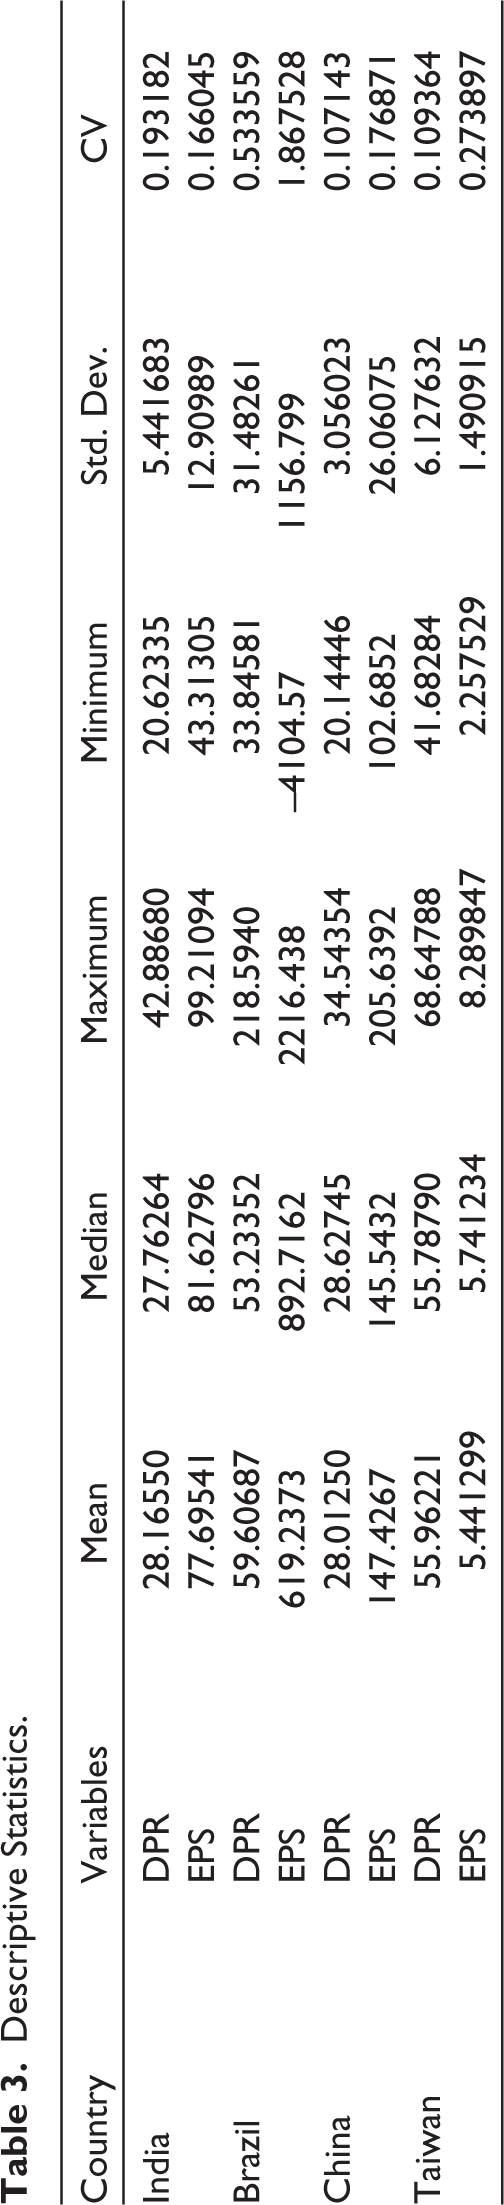
Therefore, from the descriptive analysis, we may interpret that the companies of the Brazil and Taiwan follow a higher degree of fluctuation in their dividend payout as compared to the Indian companies. Overall, we may state that there is a higher dividend payout as well as fluctuations in companies from Brazil and Taiwan. On the contrary, Indian companies are generally considered to be conservative in changing their dividend payout.
4. Results and Discussions
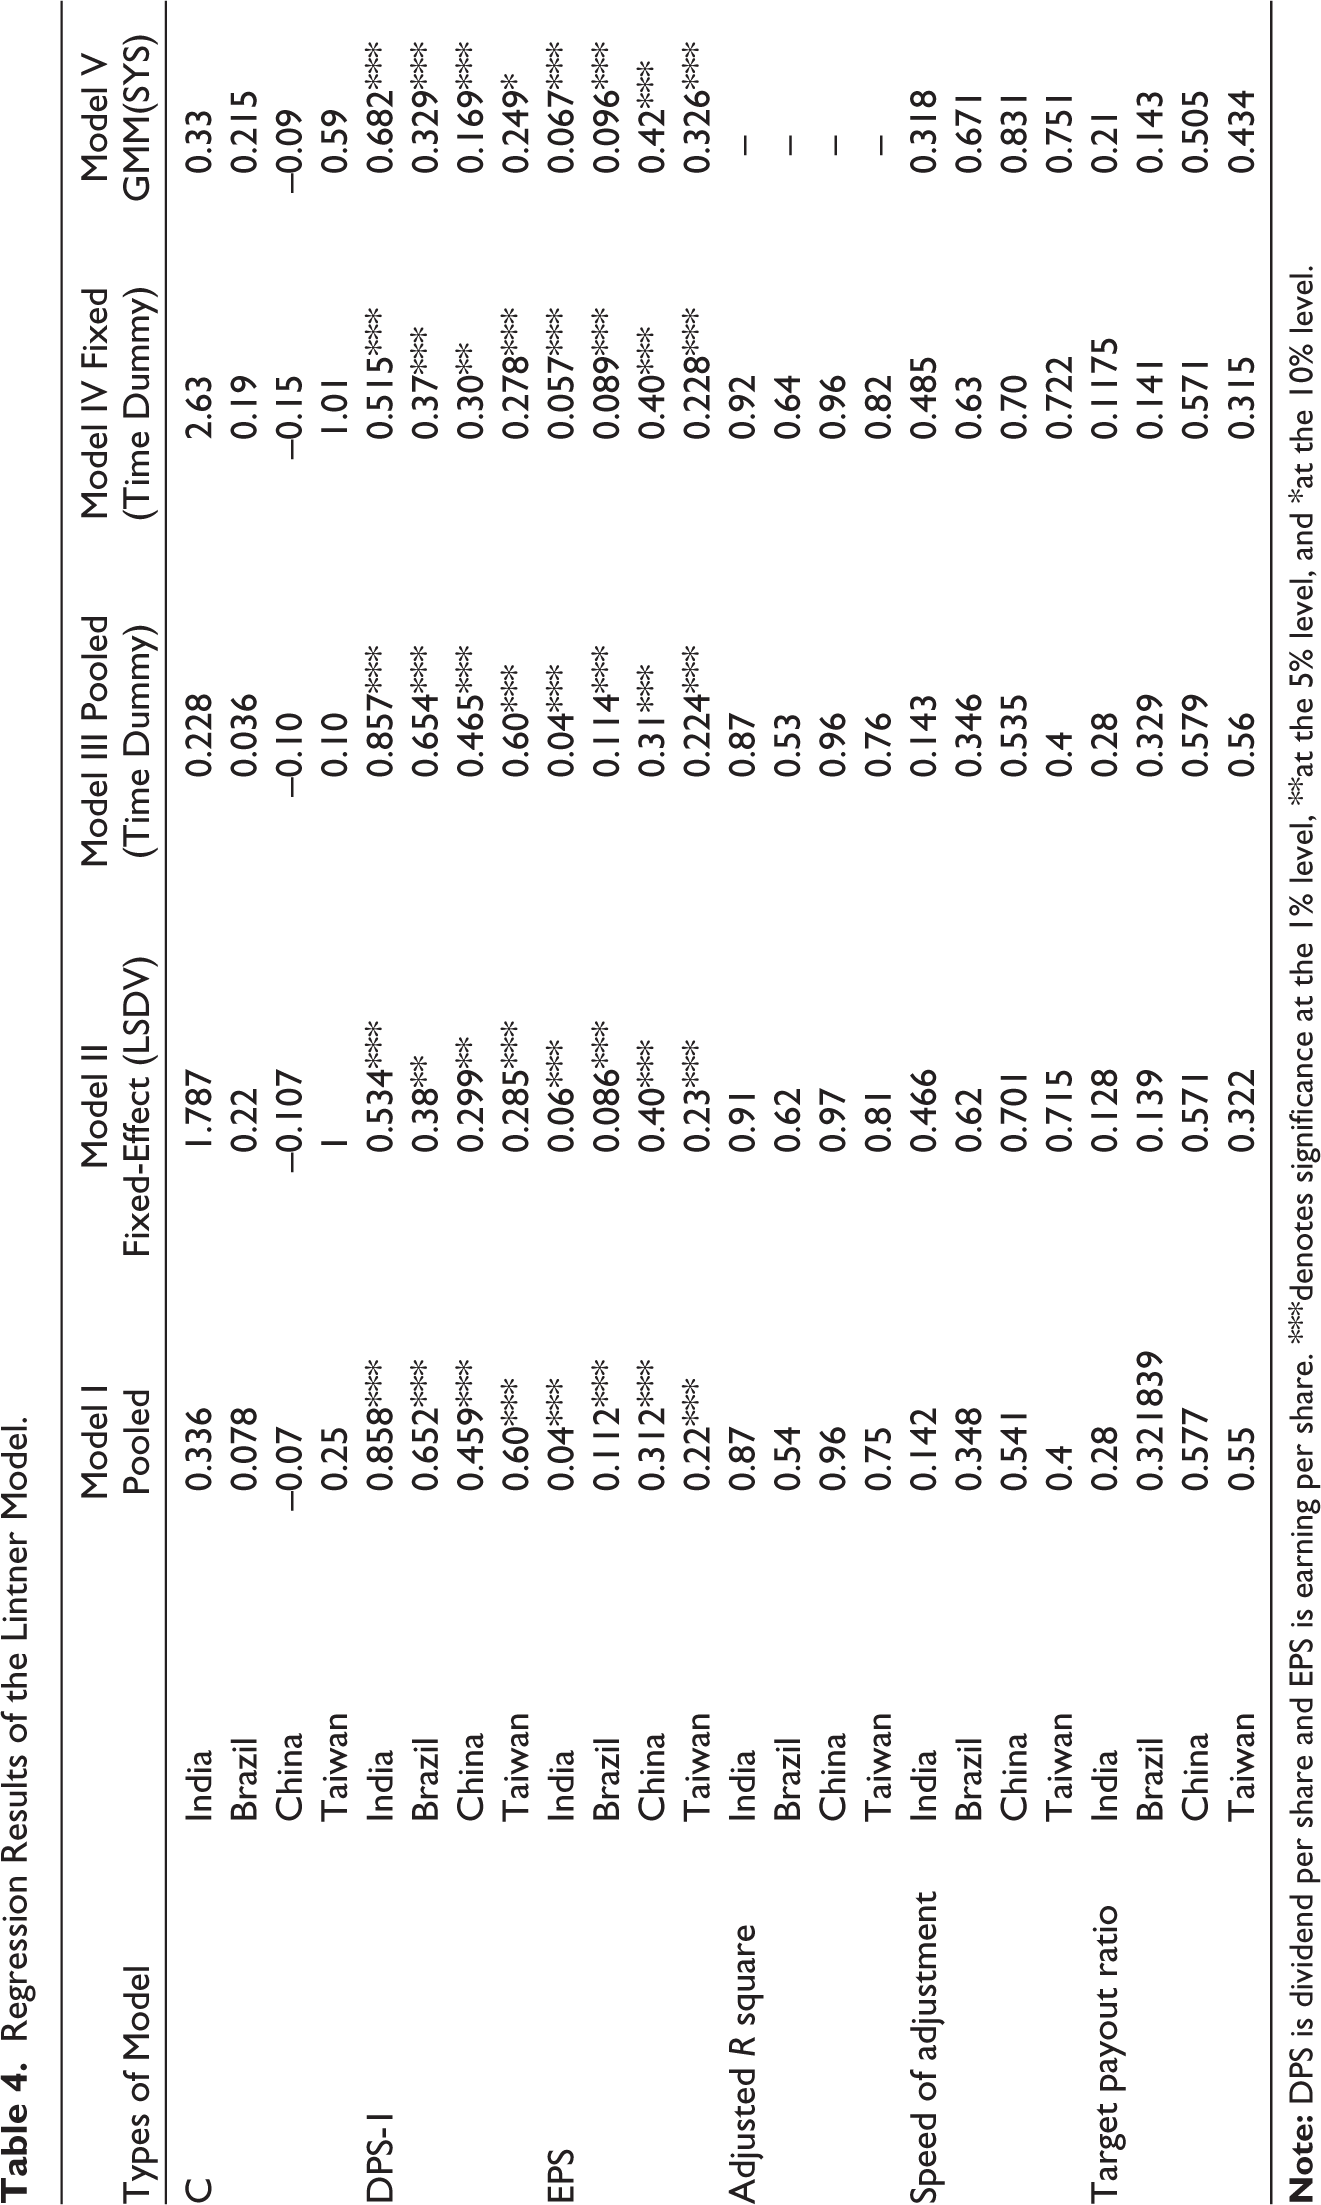
Table 4 provides the results of the Lintner partial adjustment model. To substantiate the results of the dividend signaling model, the Lintner partial adjustment model is also applied on sample emerging markets. This will also help in overcoming the limitation of results from aggregate data used. The significant F in all the models was below 0.05 signifying that the dividend decisions are jointly explained by the current earning and lagged dividends. Adjusted R square in each model ranges between 0.54 and 0.96, demonstrating that the portion of the variation in the dependent variable is well-explained by the variation in the predictors of the model.
Further, Durbin Watson’s coefficient is near 2 in each model, indicative of the nonexistence of an autocorrelation problem. To decide between the fixed-effect model and the random-effect model, the Hausman test and joint significance of differing group mean test were conducted. The p-value of the Hausman test and joint significance of differing group means test is .00, hence, preference is given to the fixed-effect model over the random-effect model.
4.1. The Lintner Partial Adjustment Model: Evidence from India
The coefficient of lagged DPS is 0.857 and has a significant impact at 1% level (shown in Table 4). The coefficient of EPS is very low in magnitude but found to be significant. The SOA estimated in the pooled model is 0.142. It implies that firms initially adjust only 14.2% of their dividend toward their new target in response to any changes in their earnings. The TPR estimates of 0.28 indicate that companies, on an average distribute 28% of earnings in dividends to its shareholder on a long-term basis. The results indicate that Indian companies follow stable dividends with a moderate TPR. The speeds of adjustment values estimated under the fixed-effect model are 0.466 and 0.485 (with time dummy). The TPR values in the fixed-effect model are 0.128 and 0.1125 (with time dummy). Both pooled effect and fixed-effect model shows the significance of current EPS and lagged DPS in determining dividend behavior of the Indian companies. The results shown in the generalized method of moments (GMM) model are on the same line as shown by the fixed effect model.
Regression Results of the Lintner Model.
4.2. The Lintner Partial Adjustment Model: Evidence from Brazil
The results of Brazilian firms (in Table 4) show that both lagged dividends and current earnings are the primary determinant of current-year dividend behavior of companies. The SOA lies between 0.34 and 0.67. The SOA reported under the GMM is 0.67; indicating dividend smoothing is not followed by Brazilian companies. It means that firms initially adjust 67% of their dividend toward their target in response to changes in earnings. Brazilian firms have characteristics of high ownership concentration, low protection of minority shareholders, and prevalence of large controlling shareholders (Brandão & Crisostomo, 2015). This might lead to the high SOA in Brazil. The target ratio varies from 0.14 to 0.33 which means that companies distribute 14% to 33% of their earnings in dividends in the long run on an average basis. The large controlling shareholders are interested in high dividend payout to resolve the problem of the free cash flow used by the management.
4.3. The Lintner Partial Adjustment Model: Evidence from China
The results of Chinese companies (in Table 4) show the coefficient of lagged DPS and Lagged EPS are quite significant and high in terms of their magnitude. It indicates that the significance of current-year earnings is as important as lagged dividends in explaining the dividend policy. The TPR was 50% to 57% which is consistent in all the models. It suggests that a firm in China distributes 50 to 57% of its earnings in dividends to its shareholders in the long run. The SOA lies between 0.53 and 0.83, which suggests that Chinese firms adjust a very high proportion of their dividend payment toward the target due to changes in their earnings. The SOA and TPR of Chinese companies are quite high as compared to companies of other markets. It indicates that changes in earnings bring sudden and immediate changes in dividends and there is less degree of dividend smoothing. The basic reason behind the high SOA could be attributed as a feature of civil law country, it results in corporate managers doing instant or erratic changes in their dividend policy. At times the state of the regulatory framework also forces companies to target a high DPR to establish reputation in the perception of the investors. China is the fastest-growing emerging nation and world’s manufacturing giant, companies therein are extremely swift to bring policy changes for good reputation corroborating their earnings change.
4.4. The Lintner Partial Adjustment Model: Evidence from Taiwan
The coefficient of both lagged dividends and current year earnings are high and significant for Taiwanese firms (in Table 4). According to GMM model, lagged value of the dividend is not significantly affecting the payout policy of Taiwanese companies. Also, the coefficient of lag dividend is low as compared to other nations. The TPR varies from 32% to 55%. It suggests that a firm in Taiwan distributes 32% to 55% of its earnings in dividends to its shareholders in the long run. The result is convergent with the life cycle hypothesis which states that lower growth potential in the large and mature firms provides the scope for distributing higher dividends. The SOA varies from 40% to 75%, which suggests that a Taiwanese firm adjusts a very high proportion of its dividend payment toward the target due to changes in its earnings. The results are in line with the findings of Shinozaki and Uchida (2017). Hence, they are not consistent in paying out dividends, due to poor governance mechanisms in Taiwan. The SOA parameter stood at 40% to 75% for Taiwanese companies. It is extremely higher as compared with other nations. In Taiwan, SOA is high because of the poor corporate governance framework. It suggests that Taiwanese companies are not reluctant to adjust their dividend according to changes in their earnings. The SOA for Chinese companies is, even more, higher at 53% to 83%. Taiwan and China are classified into high adjustment and high target ratio countries, and Brazil is classified into high adjustment and low target ratio.
4.5. Results of the Signaling Model
We also tested the signaling model using time series data of quarterly dividends from 2010 to 2020. In the case of time series data, it is better to check stationarity. To check stationarity of variables, we have conducted a unit root test with the help of the ADF test taking exogenous variables as none, constant, and constant with a linear trend. The results are shown in Table 5.
Results from Augmented Dickey–Fuller (ADF) Test Statistics of Unit Root.
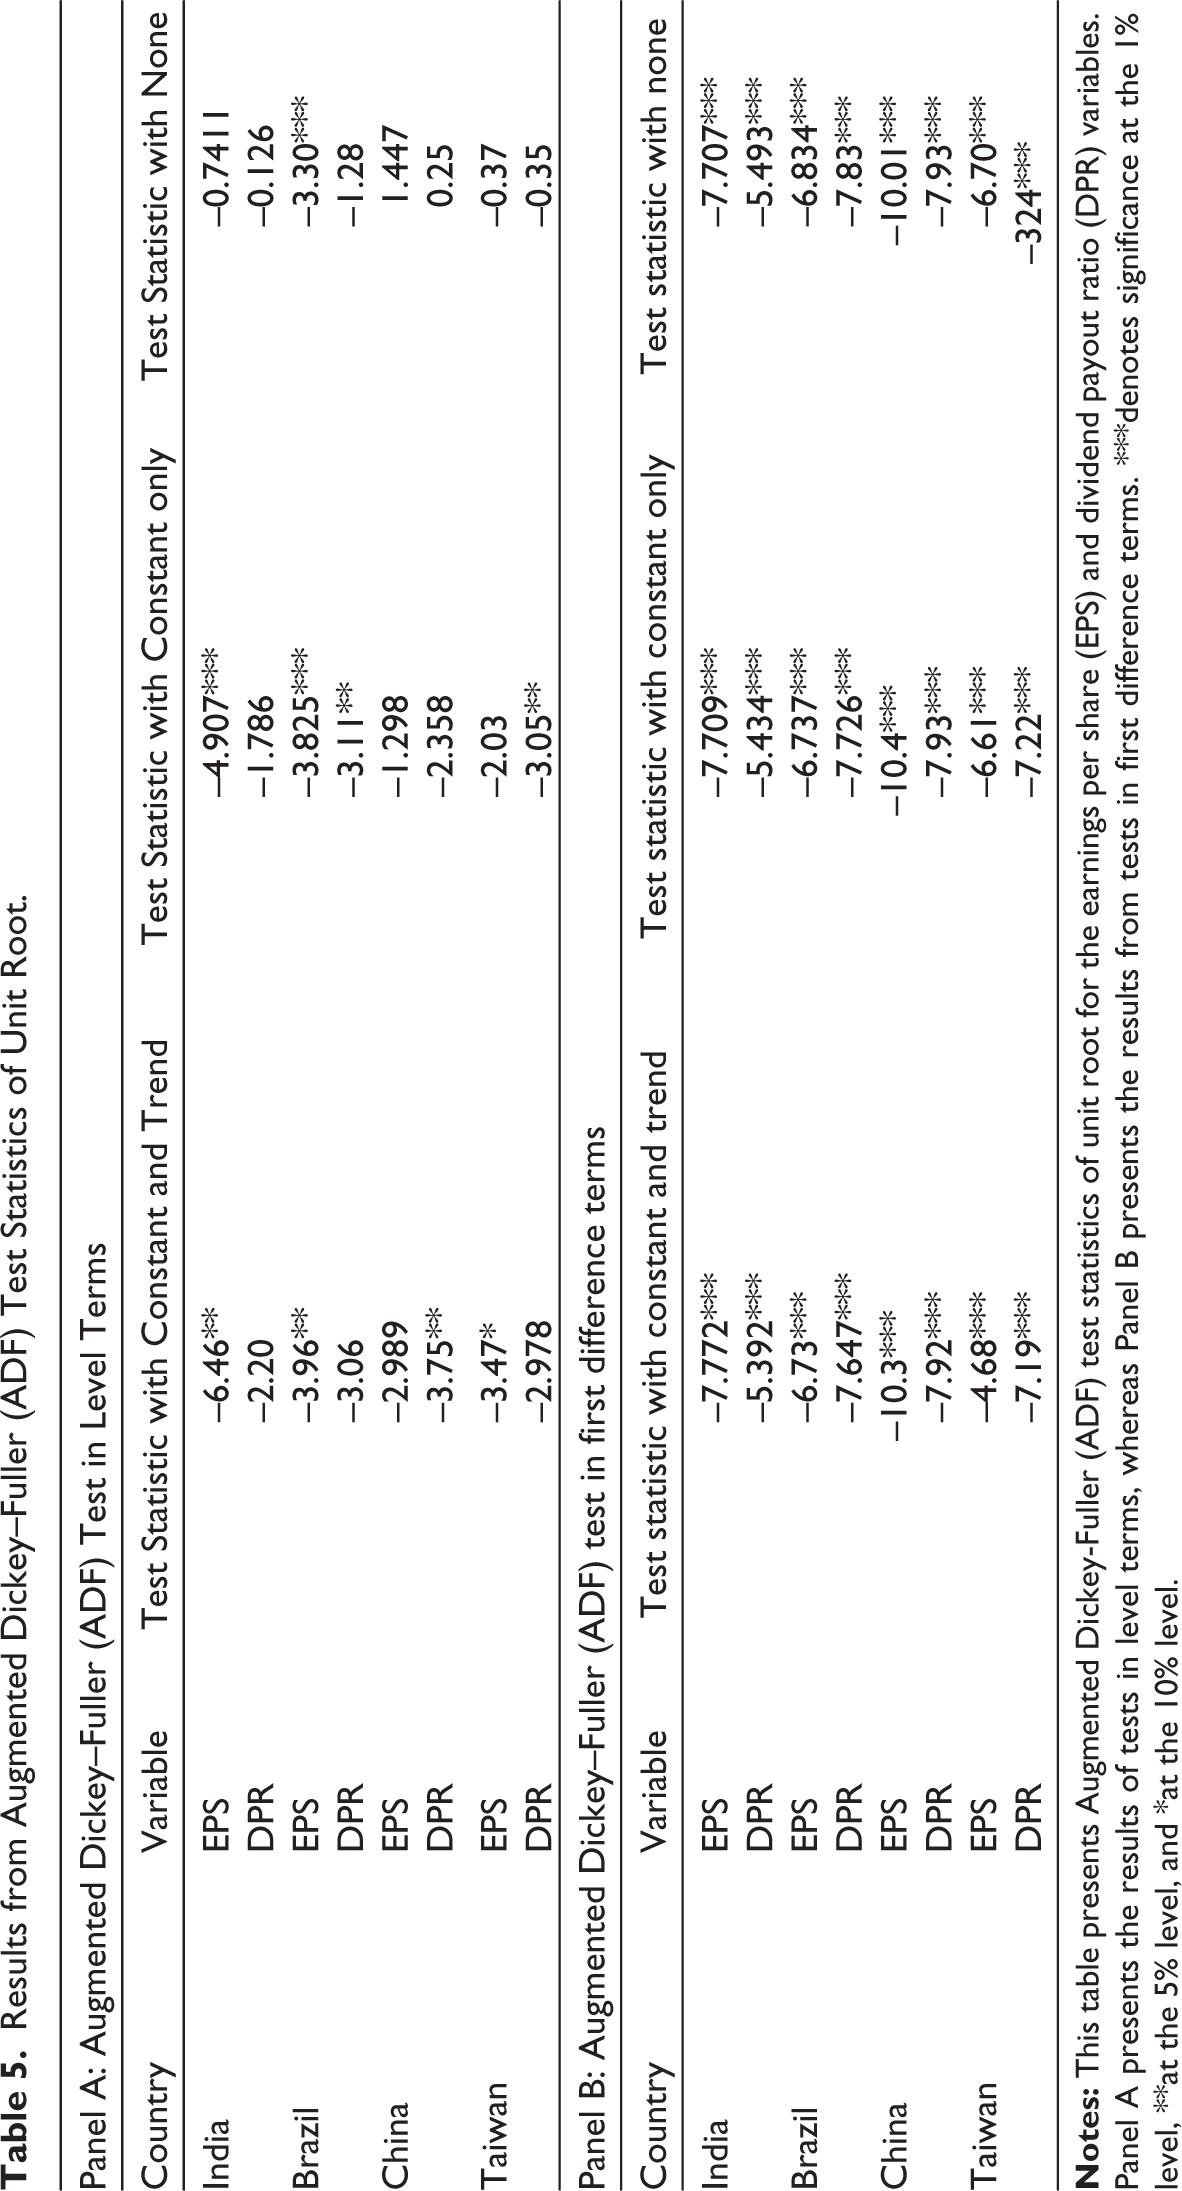
The p-value for companies from each country is non-significant, indicating variables are non-stationary at the level. Then, we have taken the first difference of the variables and the probability value was found to be significant in each of the circumstances of the exogenous variable. Therefore, we can say that our variables are non-stationary at the level and stationary at the first difference. It can be called as integrated of order one, I (1).
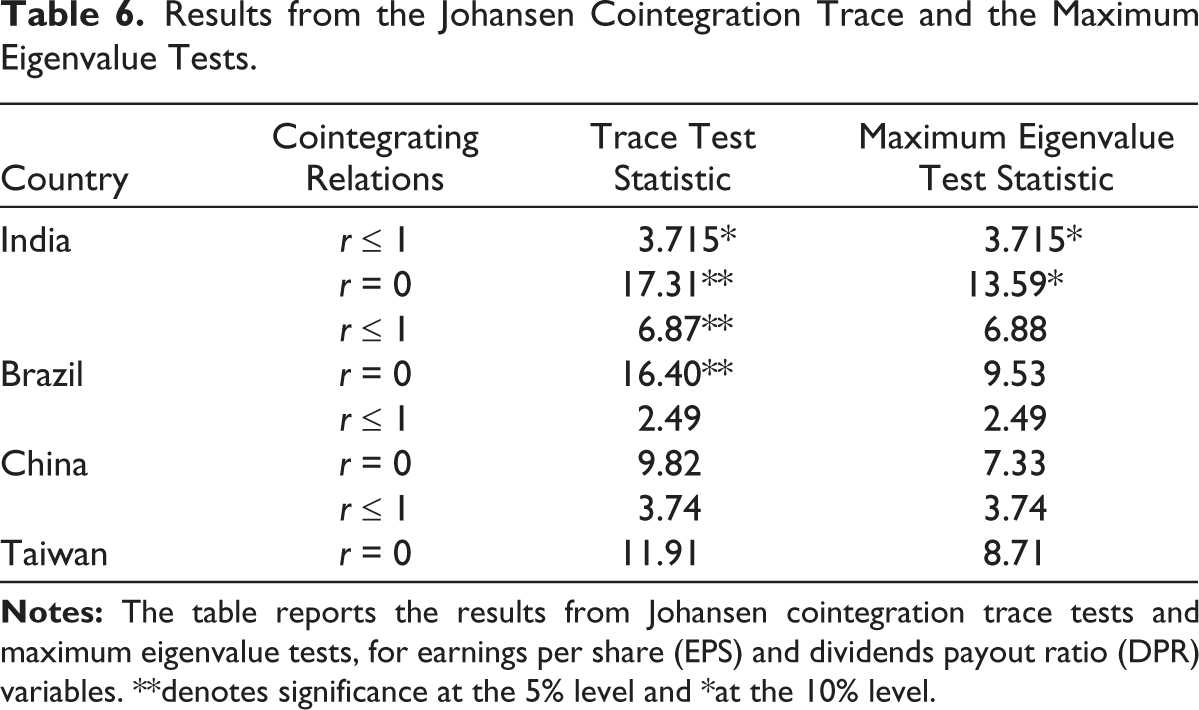
Table 6 presents the results of the Johnson cointegration test propounded by trace and maximum eigenvalue tests. Trace test indicated one cointegrating equation at a 5 percentage level of significance for Indian companies. On the other hand, maximum eigenvalue tests have indicated no cointegration equation at 5% level and one cointegration equation at 10% level. Therefore, we may infer that there is a long-term association between dividend payout and EPS of Indian companies. The trace test and maximum eigenvalue test indicated no cointegrating equation at 5% level of significance for other countries. Hence, we may state that there is no long-term association between dividend payout and EPS of firms in other countries.
Results from the Johansen Cointegration Trace and the Maximum Eigenvalue Tests.
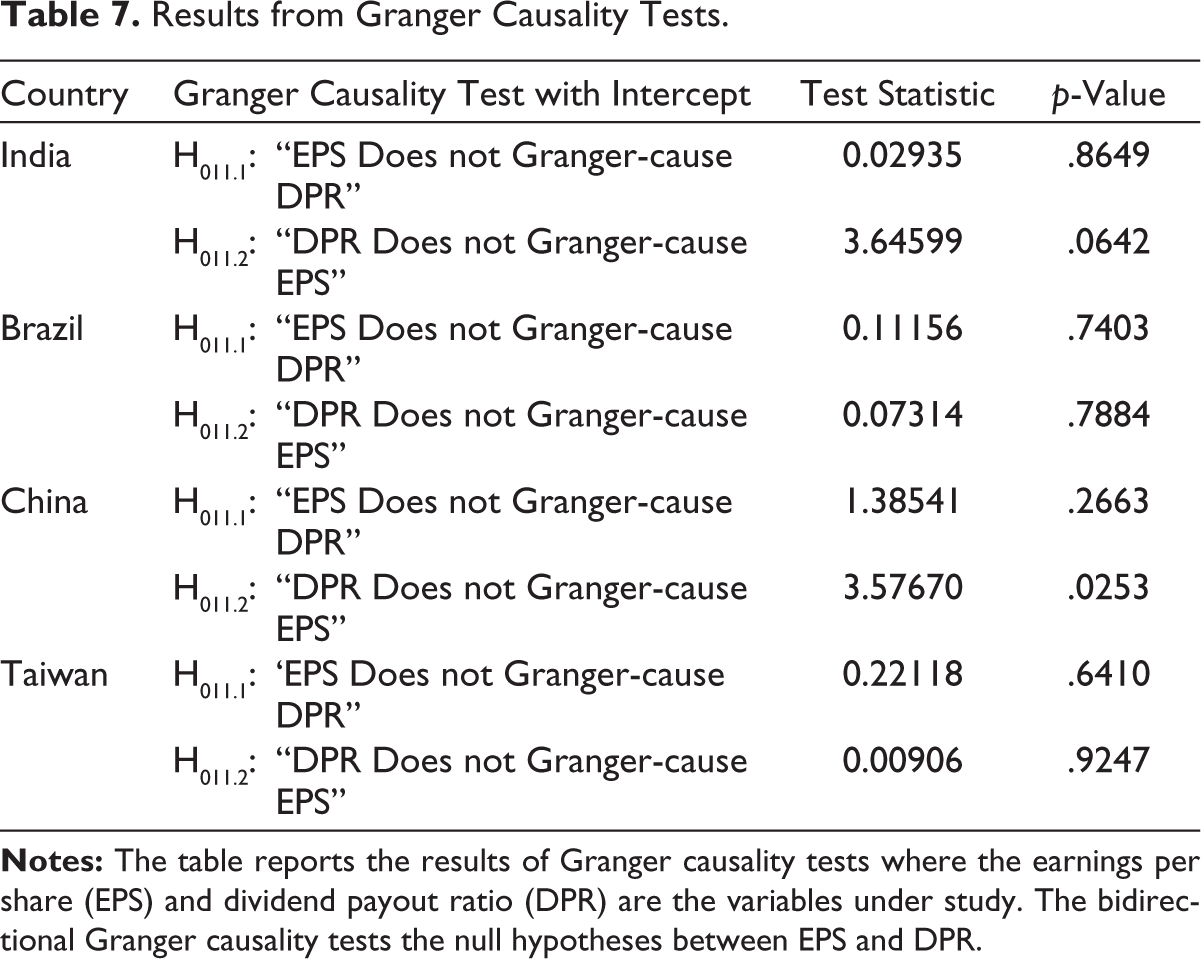
Till now we have checked only the long-term association between the DPR and EPS. Now in order to check the direction of causality between the EPS and DPR, the next step is to conduct the Granger causality test. Since the results of Indian companies were found to have one cointegrating equation between DPRs and EPS we may infer that there might be some degree of association between the DPR and EPS of Indian companies. Therefore, the VECM and the Wald test can be conducted for Indian firms. VECM confirms long-run causality from DPR to EPS for Indian companies. Wald test does not confirm short-run causality from the DPR to EPS.
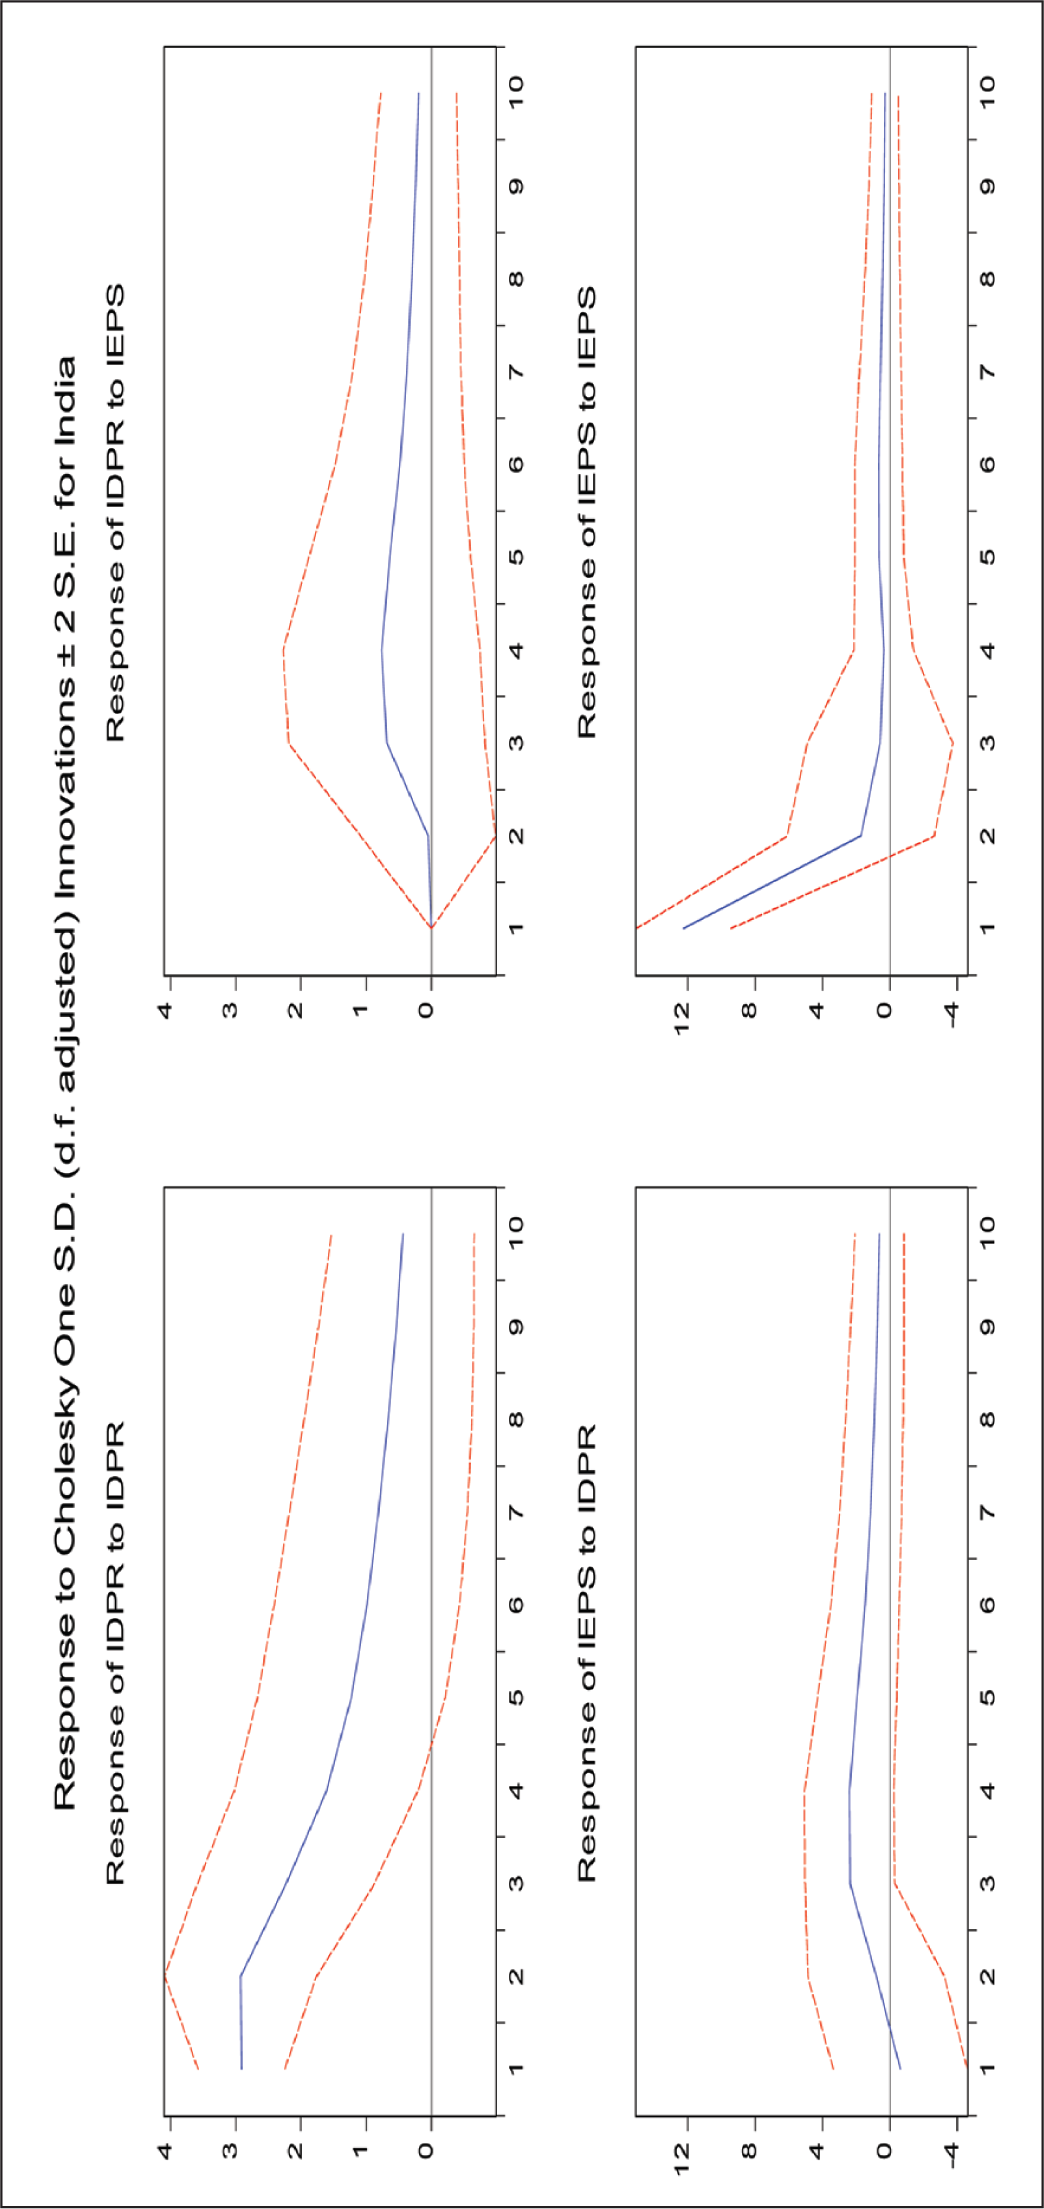
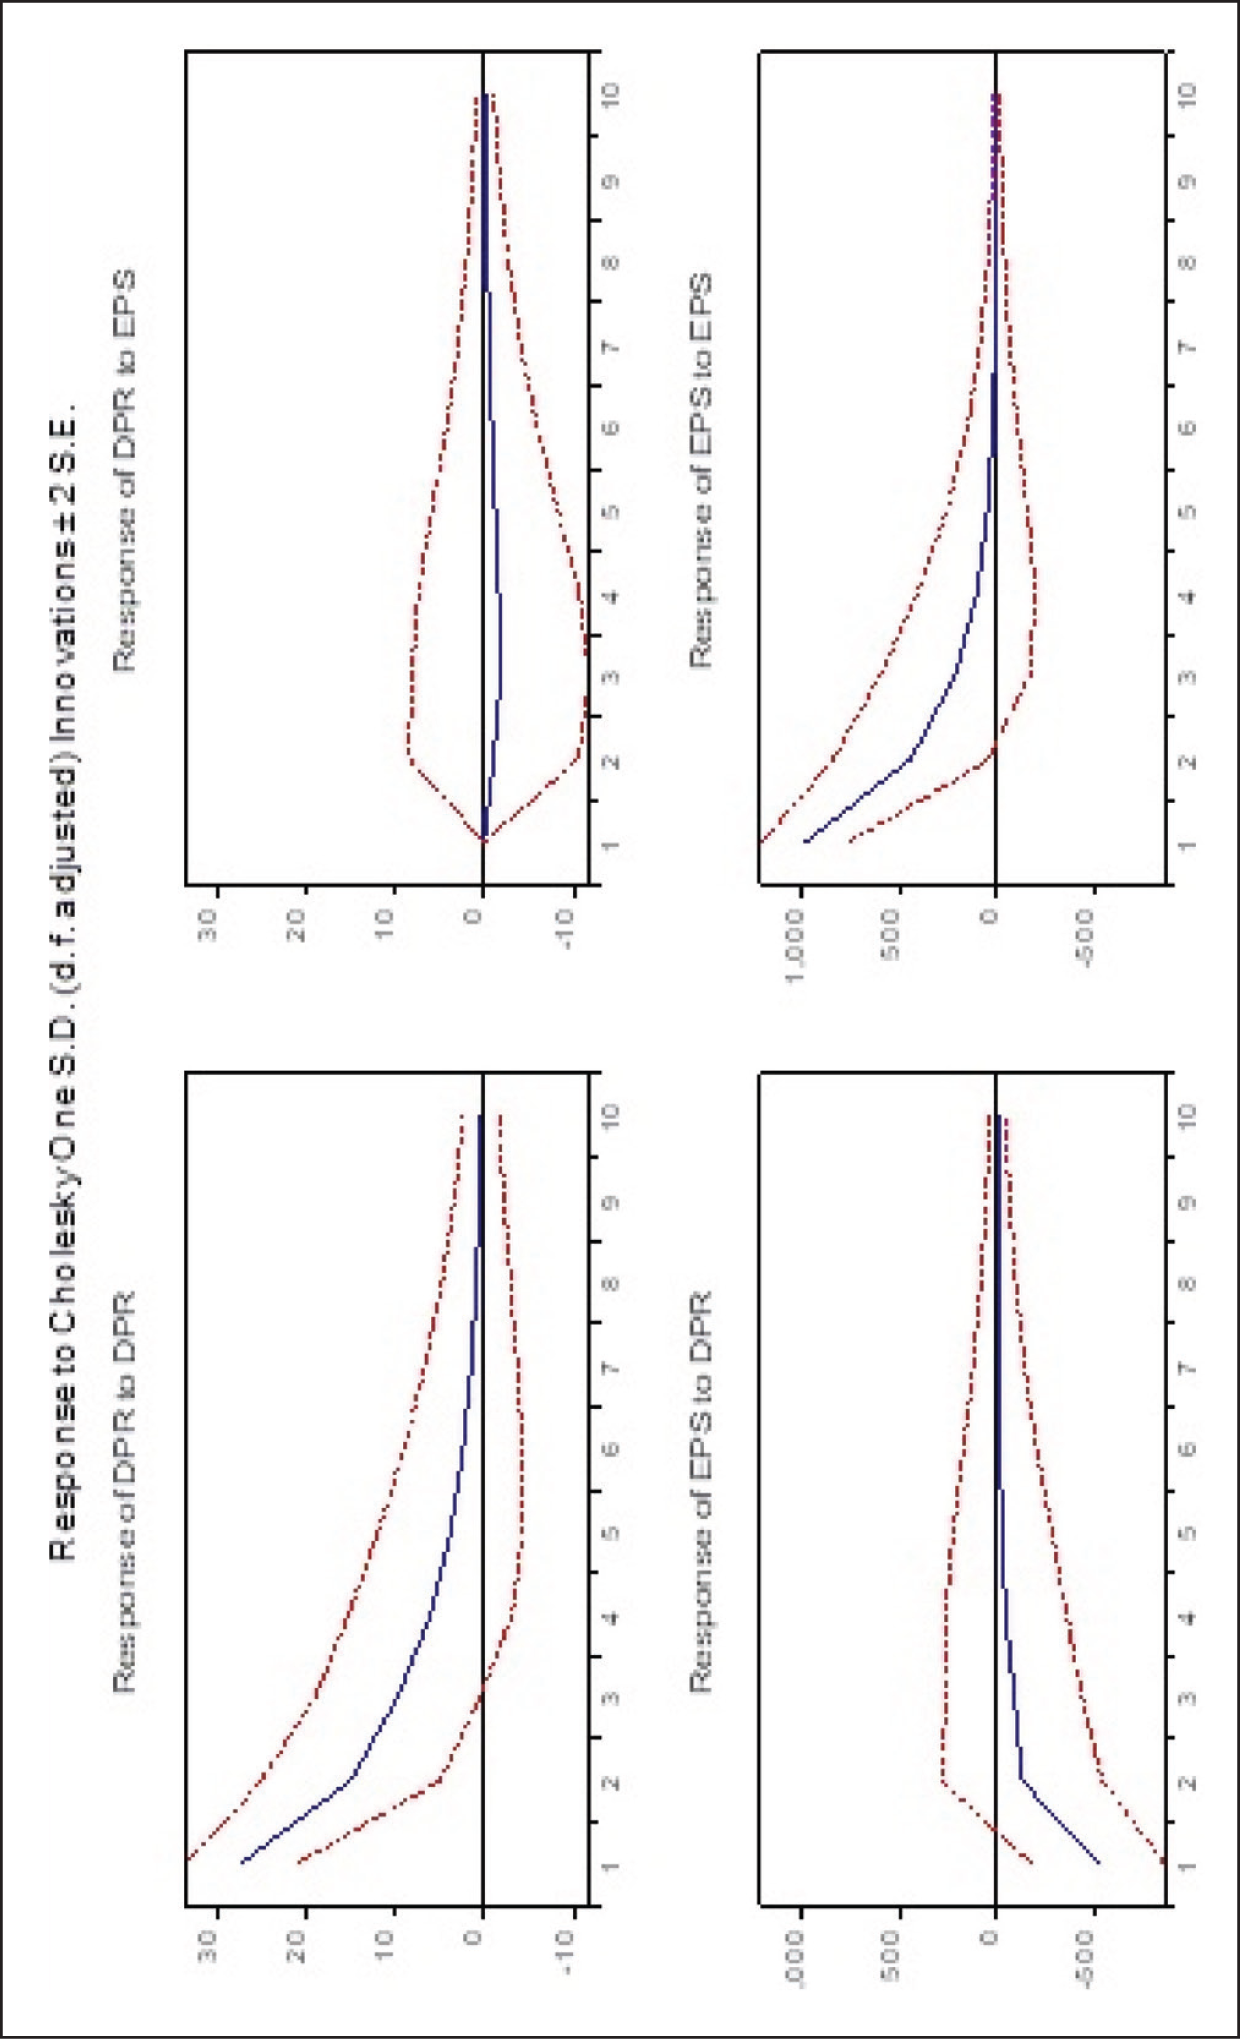
The Granger causality test exhibits in Table 7 that there is no Granger causality between the EPS and DPR for, Brazil and Taiwan. Our results affirm the findings of Brav et al. (2005) and Aggarwal et al. (2012), implying that the change of data set and macroeconomic scenario has not changed the managerial decision in respect of dividend declarations. Interestingly, the DPR of Indian companies is Granger-causing EPS at 10% level of significance, and, EPS is not Granger-causing DPR at lag 1. It implies that the DPR predicts EPS of the future quarters for Indian companies. Similarly, Chinese companies’ dividend policy is also Granger causing the future earnings at 5% level at lag 3, but not vice versa. Further, to consolidate our results, we have conducted an impulse response graph to understand the magnitude of reaction between the DPR and EPS. It can be observed from the graph (top right panel of Figure 1 shown in the appendix) of response of the Indian DPR to Indian EPS there seems to be a positive shock in the DPS due to increase in Indian EPS by 1 unit.
Results from Granger Causality Tests.
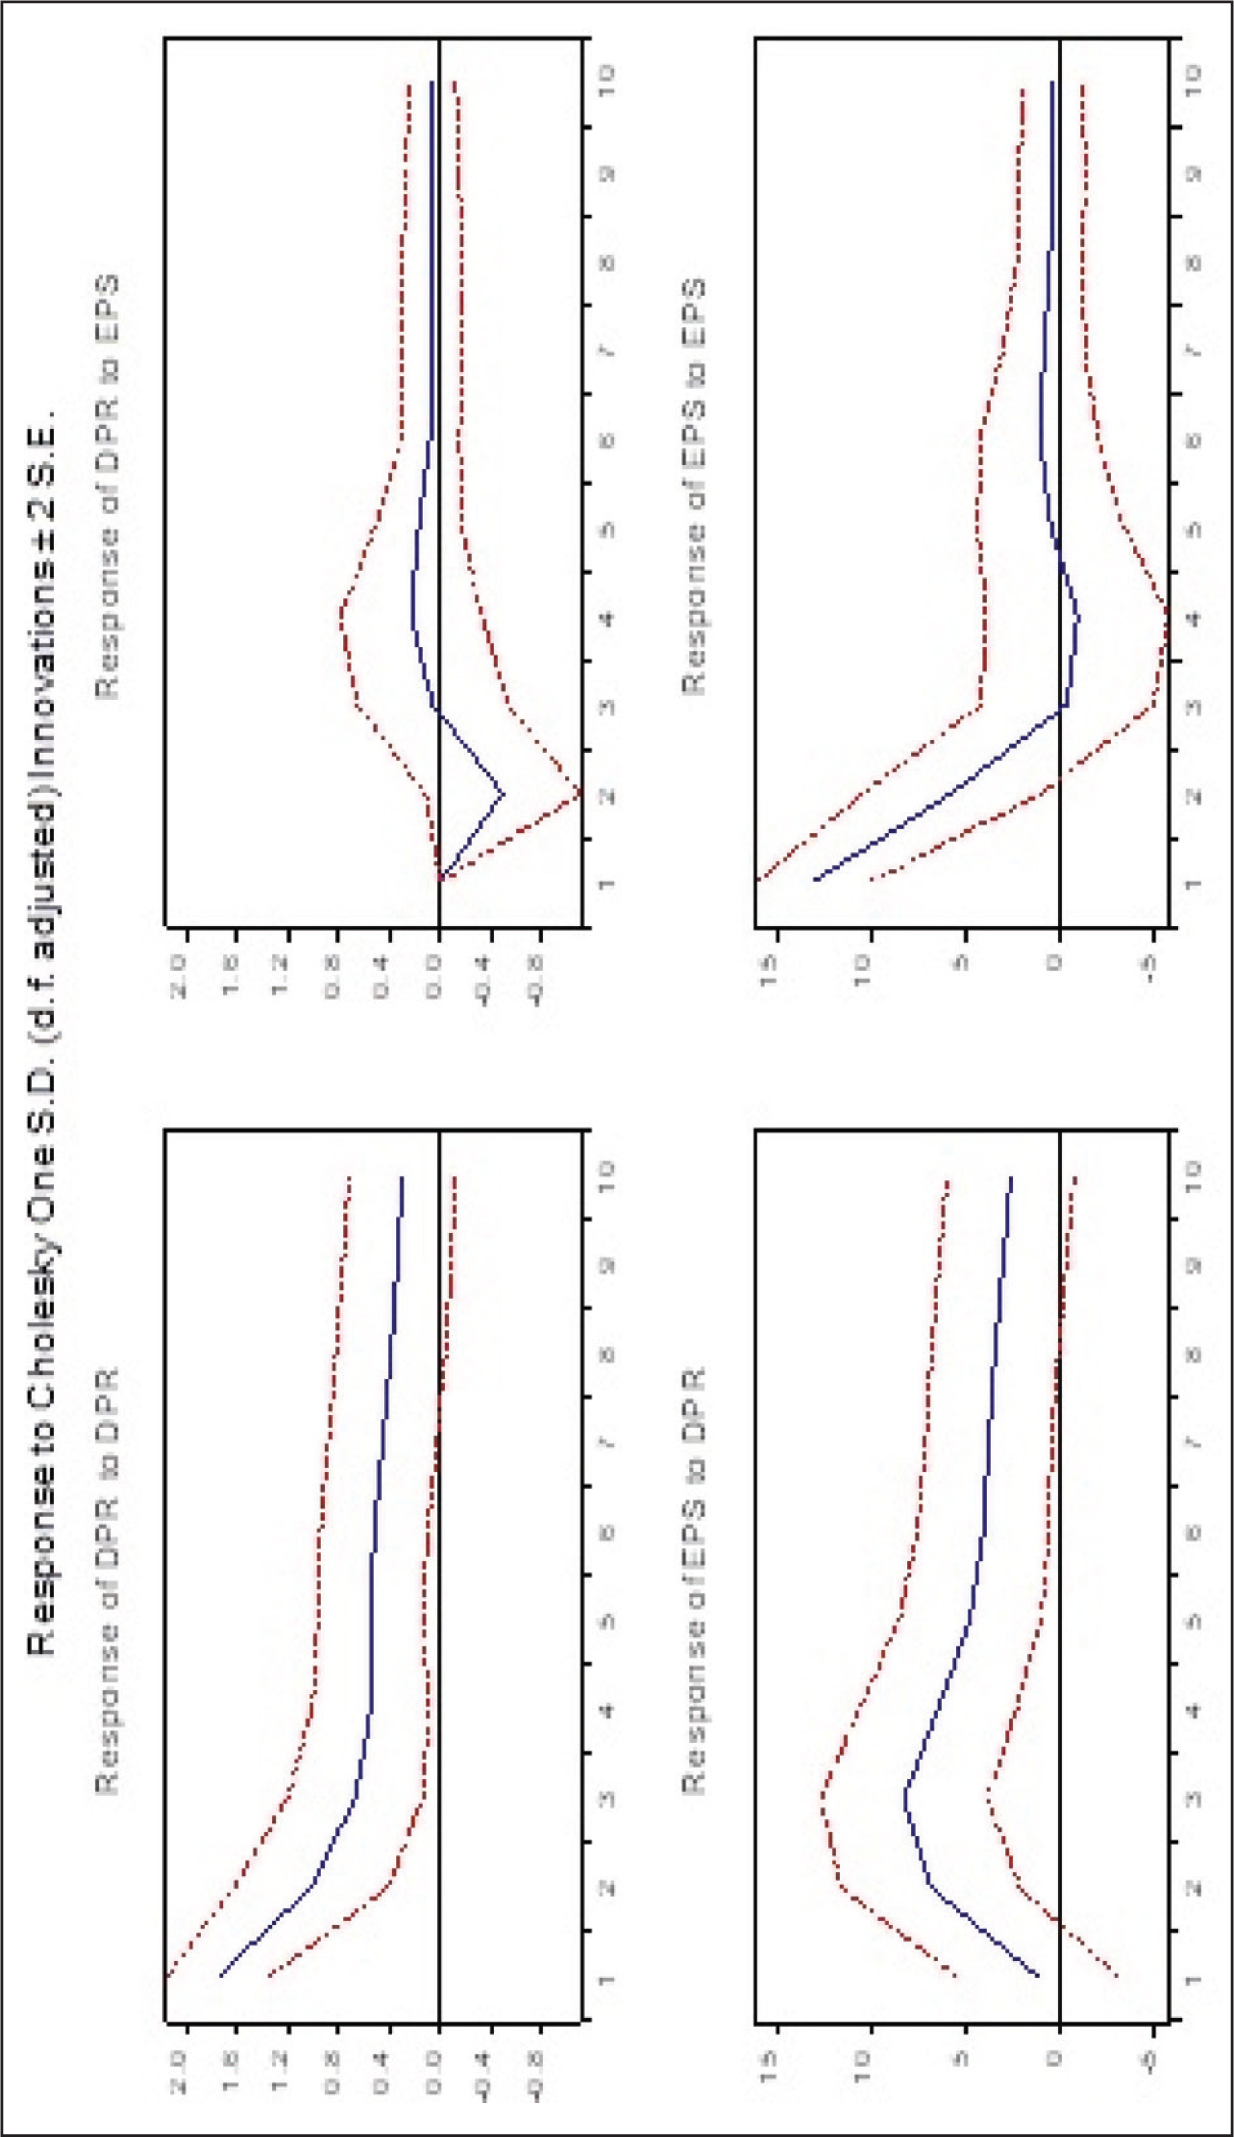
The positive shock began from the second quarter and remains throughout the next eight quarters. Similarly, in the bottom left panel of Figure 1 (shown in the appendix), there is a positive effect on the EPS due to one unit shock in the DPS. It indicates that the positive Indian DPR is predicting better future earnings on a long-term basis and it signals to investors that future performance of the company will improve. Similarly, Figure 2 shows the graph for the impulse response system between EPS and DPR of companies in Brazil. First, the response of DPR to EPS indicates that when there is one standard deviation positive shock in DPR, the response of DPR is meager in magnitude and minor negative throughout the upcoming ten quarters. Interestingly, when looking at the response of EPS to DPR at Quarter 1, EPS reacts negatively, during the second and third quarters, it starts increasing until it reaches out to the baseline till Quarter 6. Subsequently, it has shown no response to the innovation in DPR. Overall, it may be stated that DPR is reacting negligibly to any shock in EPS. In the short run, EPS reacts negatively, but in the long run, there is an asymmetric response of EPS to DPR.
Impulse Response System for Indian Companies.
Impulse Response System for Brazil Companies.
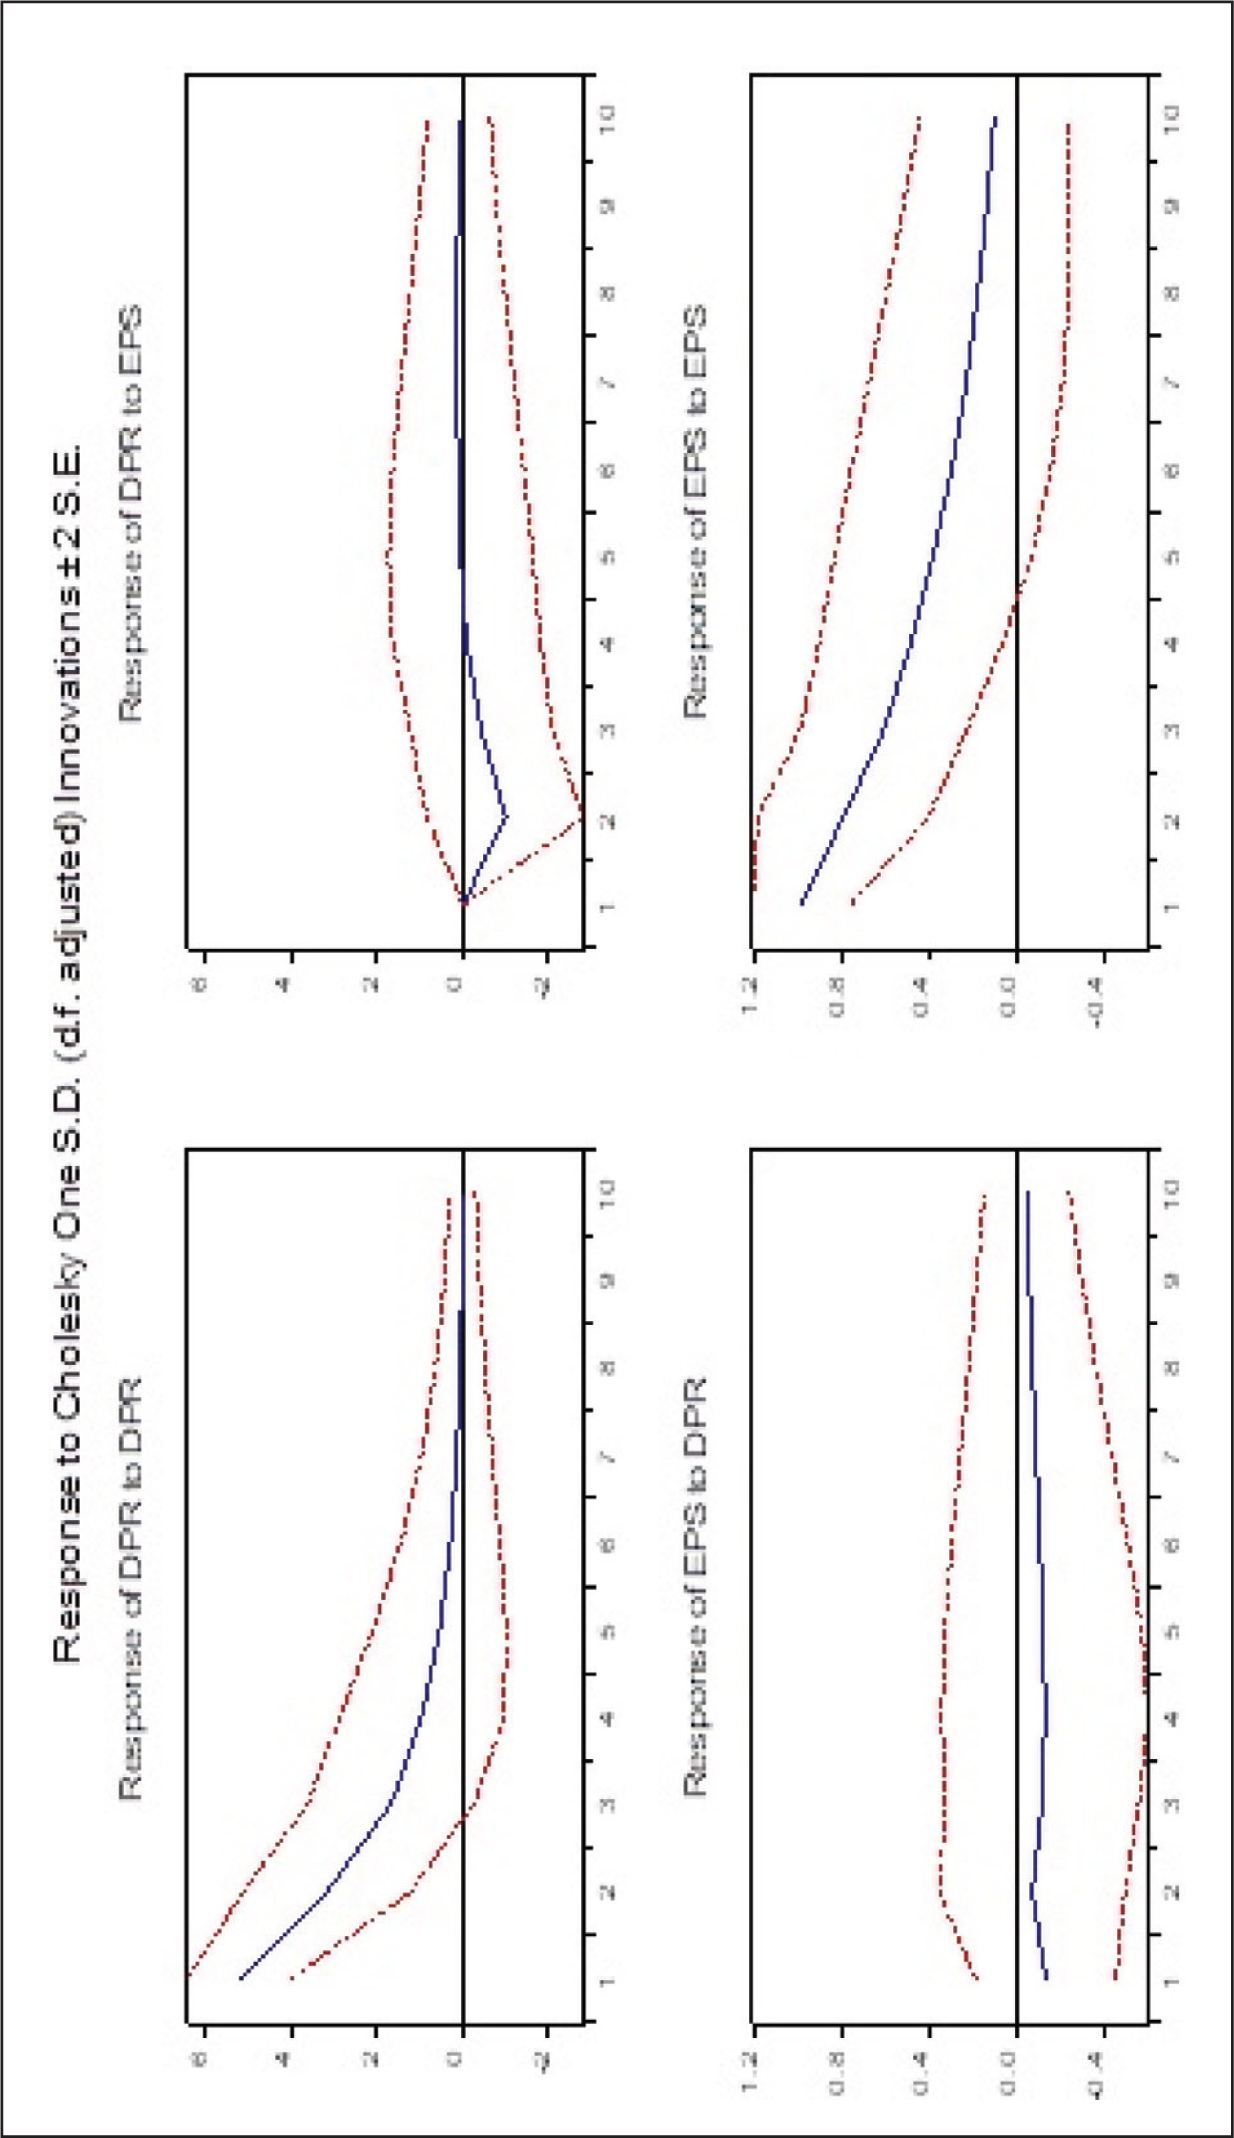
Therefore, we may say that the signaling model does hold good in Brazil and corporate managers tend to adjust dividends rapidly with little apprehension about its signaling effect on future earnings. It is possible that mandatory dividend regulations in Brazil create non-responsive- ness of dividends to earning changes and vice versa. Therefore, dividend changes are not viewed as a source of communication of inside information to the outside investors. Figure 3 depicts the impulse response graph for Chinese companies. The response of DPR to one positive innovation in EPS (top-right panel) is quite asymmetric. Initially, in Quarter 2, it becomes negative, then it starts rising and becomes positive in Quarter 4. Though, the magnitude of the reaction is relatively low. Nevertheless, the response of EPS to one positive shock in DPR (bottom-left panel) is quite evident. Initially, it increases till the third quarter and then it goes down but remains positive throughout the remaining quarters. Hence, we may state that the positive reaction of future earnings to the dividend in the short run and the long run for Chinese companies provides strong evidence of information asymmetry and the applicability of the dividend signaling model. These results are consistent with the results of Granger causality for Chinese firms, indicating that the results of the study are conclusive. Chinese investors should view and consider dividend changes as a signal of firm’s future performance in their fundamental analysis of a particular stock.
Impulse Response System for Chinese Companies.
The graph of the impulse response system for Taiwanese companies is shown in Figure 4. indicating response of DPR to one positive innovation in EPS shows a minimal reaction to DPR. Similarly, the response of EPS to one positive shock in DPR has been quite negligible and negative during all the quarter. Overall, the reaction is highly negligible and may not contribute any significant contribution. Though, it may provide behavioral implications for the managers considering the non-responsiveness of dividend changes in Taiwan. Investor should show asymmetric reactions toward dividend changes and look at other financial reporting and corporate governance disclosure mechanisms before investing in Taiwan.
Impulse Response System for Taiwanese Companies.
5. Implications of Results
We find that the dividend payout of Indian companies is associated with the future earnings. It means that there are certain key information pointers which is reflected through the signaling of dividend. But, the same does not hold true for other markets, in which dividend changes do not predict future earnings. On the same line, the results of the Lintner model predict dividend stability as inherent characteristics of Indian firms giving evidence of dividend signaling effect. The result documents the evidence of dividend signaling in India. On the other hand, the SOA provided in the Lintner partial adjustment model for other markets suggested that managers in Brazil, China, and Taiwan are quite bold and flexible in adjusting dividends in response to changes in earnings. In this way, we may integrate the results of the dividend signaling with that of the Lintner model. The results of Lintner model are the behavioral consequence of the applicability or non-applicability of dividend signaling theory.
Firms in other emerging economies, such as Taiwan, China, and Brazil, have a high SOA either due to non-stringent flexible legislation or a few being civil law country. But firms in India have a relatively low SOA. It can be attributed to the difference between corporate governance structures across emerging markets. The possible explanation for difference in results may be due to dissimilarity in the level of information asymmetry. Indian companies are facing higher information asymmetry as compared to their counterparts due to prevalence of family ownership. This is the reason that dividend is perceived as a signal of future performance by the outside shareholder due to the high information gap between outsiders and insiders in India. But in other markets like China, the information gap is not as severe due to different ownership mechanisms. Another implication is that changes in dividends will have a more severe reaction in stock prices in India as compared to the other markets. It means that increase in dividends may lead to rise in stock price and decrease in dividends may lead to fall in share price for Indian companies signaling their potential increase or decrease in the future earnings. Consequently, Indian managers are more conservative in changing their dividends and managers in Taiwan, China, and Brazil may act quite bold in changing the rate of dividends. While evaluating investment in a particular stock, investors should consider the direction of dividend changes in India in particular. Global investors while assessing portfolios and asset allocations for Indian companies should be considering those companies which are paying out consistently higher dividends, which signal better prospects for the company. Further, reduced information asymmetry is observed in those firms with better corporate governance, which is preferred for long-term investment. In the end, we can say that the findings classified countries based on the degree of SOA from the high SOA to low SOA; investors based on their degree of risk aversion can invest accordingly. Investors looking for dividend stock can also compare the TPR in their fundamental analysis. The implications of study have specific relevance during financial crisis. From the investor’s perspective, they can be cautious of those Indian companies, which are resorting to dividend cuts in times of financial crisis as it indicates future problems in maintaining earnings due to the financial crisis. They may prefer investing in those firms which are maintaining their dividend payouts despite the financial crisis, which indicates good health of the company even in financial turbulence.
6. Conclusion
We documented the evidence of the applicability of the signaling model in India. The findings support signaling theory stating dividend payout possesses informational content about future earnings, and that the two variables are positively correlated in India. Consequently, a dividend adjustment may convey information about the prospects of a company. It provides the justification for conservative behavior of Indian managers. Hence, investors do find high dividend yield companies in Indian markets and increase in dividend payout indicates increase of earnings in subsequent quarters. There is no association between dividend payout and future earnings for markets like Brazil and Taiwan. Correspondingly, we have classified these countries as high SOA countries according to Lintner partial adjustment model. This means that managers are fluctuating dividends at a faster pace because dividends are not considered to be the signal of future earnings in these countries. In this way, we observed the relationship between the Lintner adjustment model and the dividend signaling model. Our results are contradictory to Dixit et al. (2020) who do not find support for the signaling effect in India. The results are in line with the findings of Ham et al. (2020), Liljeblom et al. (2015), Lee (2010a), and Nissim and Ziv (2001). The results emphasized that emerging economies, like, Taiwan, China, and Brazil have a high SOA of dividends.
The findings indicate that the framework of corporate governance, ownership pattern, and theory of dividend signaling seems to be the most important reason behind diverse dividend policies and behavior across various nations. The corporates with high prevalence of family ownership and less stringent corporate disclosure results in substantial information gaps between outside investors and shareholders and thus dividends are used as a tool to signal future outlook. Therefore, managers are conservative in changing the dividend policy in such scenario of information asymmetry.
Concentrated ownership along with family-controlled firms is an inherent characteristic of Indian companies (Rajput & Jhunjhunwala, 2019). The presence of controlling shareholders and family-run firms leads to agency problems and higher information asymmetry in Indian companies (PWC Survey, 2016). Ownership concentration activates dividend smoothing and signaling (Al-Najjar & Kilincarslan, 2017; Baker et al., 2007). Therefore, the dividend signaling model holds true in India, but not in the other markets. The results have interesting implications for shareholders in implementing portfolio management. Shareholders should consider changes in dividends as parameters in assessing their portfolio management and asset allocation in India. The signaling effect will have its thoughtful relevance during crisis (financial crisis or Covid). The long-run SOA for firms in emerging nations ranges from 0.34 to 0.60. Managers are conservative while formulating dividend policy and cautious about its impact on stock prices. Consistent with the suggestions of Al-Najjar and Kilincarslan (2019), we observed that dividend signaling is probable explanation for the behavioral justification of dividend smoothing advocated by the Lintner model. The present study can be considered as a theoretical benchmark for future research work in the field of dividends, especially related to the signaling effects.
Footnotes
Declaration of Conflicting Interests
The authors declared no potential conflicts of interest with respect to the research, authorship, and/or publication of this article.
Funding
The authors received no financial support for the research, authorship, and/or publication of this article.