
Abstract
Background
In order to understand social interactions, integration of emotional valence and semantic information plays a pertinent role. Emotional interference is reflected as a decline in executive function in the presence of emotional stimuli (faces and valenced words). We hypothesise that apart from what we perceive, the intrinsic brain activity may also influence the behavioural outcome.
Purpose
We aimed to investigate the role of the pre-stimulus EEG microstate in determining the performance of an individual in an emotional interference task.
Methods
Twenty healthy participants performed the emotional interference task, while microstate parameters were derived from single trial 128 channel EEG during correct and error trials.
Results
We found that four microstate maps could represent the response accuracy of the preceding behavioural response during emotional interference. The intracranial generators of the pre-trial microstate during emotional interference revealed the areas related to phonological processing (middle temporal and superior temporal gyri), emotional processing (inferior parietal, parahippocampal, transverse temporal gyri), conflict resolution (inferior frontal gyrus and insula) and motor responses (pre-central gyrus).
Conclusion
In addition to the valence and semantics of the stimuli, the pre-stimulus microstate may help to determine subsequent performance.
Introduction
Emotion and the ability to regulate it is inevitable for social survival. Various studies have reported that emotional stimuli capture one’s attention and disrupt executive function, a phenomenon known as emotional interference. 1 Thus, to optimise the goal-directed behaviour, conflict control mechanisms aim to suppress emotionally irrelevant stimuli over emotionally relevant stimuli. 2 To elucidate the same, various tasks have been used wherein facial expressions are superimposed with congruent or incongruent valenced words and the subjects are asked to categorise based on one emotional stimulus while ignoring the other. 3 Though various theories and possible pathways have been proposed, the neural mechanisms implicated for emotional interference have been an unanswered question.
Electrophysiological studies may help to decipher the possible neural signatures of this phenomenon. Amongst all neuroimaging tools, EEG can help to understand the neural changes to the finest temporal resolution of a few milliseconds, and further analysis can help to identify the cortical areas implicated for emotional interference. One such study was done by our lab, using a similar paradigm of emotional interference in healthy controls to explore the EEG cortical sources during face-word and word-face interference task versus baseline. We found that there was differential cortical source activation during tasks as compared to the baseline. 1 Another novel method to explore the brain’s electrical activity is EEG microstates, defined as successive discrete short time periods during which the configuration of the scalp potential field remains semi-stable ∼80–120 ms. 4 Microstate analysis offers an advantage in terms of representation by a single time series of alternating global field power (GFP) at discrete intervals. The GFP gives a measure of the instantaneous field strength over time. Unlike other techniques, microstate analysis considers signal from all electrodes at the same time to create a global representation of a functional state.
Though the microstate changes during resting state and cognitive function tasks (visuospatial working memory, binocular rivalry) have been studied in the literature,5, 6 there is a paucity of literature related to brain microstate changes during emotional interference. The pre-trial microstates will help us decipher the neural sources required for preparedness during emotional interference tasks. Thus, this study attempts to find out the EEG microstates and their underlying cortical sources during an emotional interference task.
Methods
Twenty healthy male volunteers 27.25 ± 4.77 years of age participated in the current study. All the participants were right-handed as assessed by the Edinburgh Handedness Inventory 7 with normal or corrected-to-normal vision and without any history of any psychiatric or neurological illness, as well as, being able to perform a computer-generated task. Written consent was taken before the task and the paradigm of the task was explained to all the participants. The sample size calculation is based on the previous study by Batabyal et al. 1
Emotional Interference Task
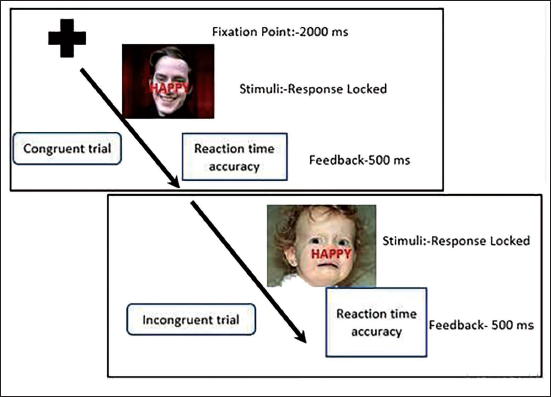
Emotional interference task was designed using E-Prime version 2.0 using 60 standard high arousal pictures of faces with three Valence categories (20 each of positive, negative and neutral category) from International Affective Picture System 7 with three valenced words (happy, sad or neutral [bland]) from affective norms for English words written across it. 8 It was presented in all possible combinations of congruent and incongruent trials in two blocks, with a total of 60 trials. 1 The participants had to categorise the emotion of face, neglecting the valence of word. One trial consisted of a fixation cross for 2000 ms followed by a response-locked stimulus, given through the response keypad and feedback of 500 ms. The trial structure of the task has been given in Figure 1.
The Trial Structure of the Emotional Interference Task with Fixation Cross for 2000 ms, Followed by Response Locked Stimuli and Feedback for 500 ms, Congruent Trial Implies That Emotion of the Face is of Same Valence as the Emotion of Word, While Incongruent Stimuli Imply a Mismatch Between the Emotion of the Face and Word. Emotional Interference Task Wherein the Emotion of the Face Needs to be Categorised While Neglecting Valence of the Word.
Stimulus Presentation
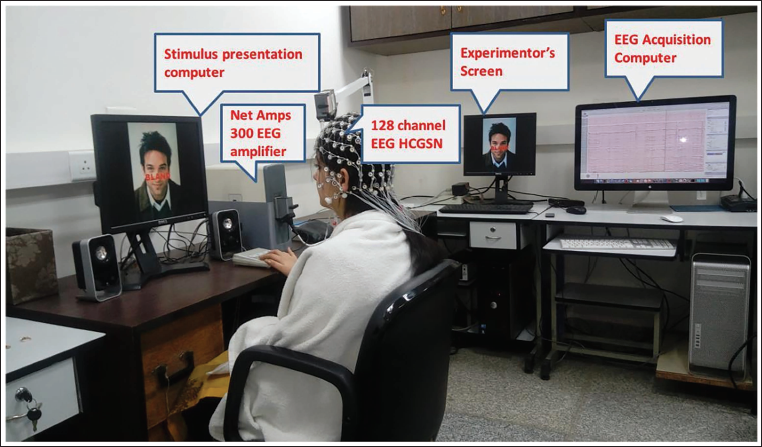
A 17-inch flat panel liquid crystal display (LCD) monitor (Dell Professional P170S, refresh rate 60 Hz) was used as the monitor. Participants were seated on a comfortable chair 70 cm horizontally opposite to the screen with right hand control over stimulus response box and left hand comfortably placed over thighs and allowed to settle in before the recording followed by baseline recording of five minutes to ease them out (Figure 2).
Figure Showing Stimulus Presentation of an Emotional Interference Task and Acquisition of 128 Channel EEG.
QEEG Data Acquisition
EEG data were acquired using a 128-channel array (EGI Philips Neuro; now MagStim) using 0.01–100 Hz digitisation at a sample rate of 1000 Hz using Cz as recording reference and impedance was kept below 50 kΩ.
Data Processing and Statistical Analysis of EEG Data (Pre-processing)
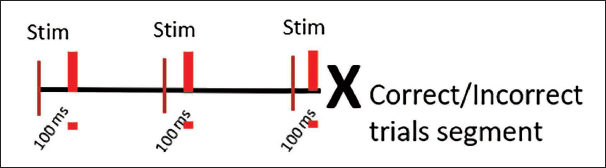
Data were filtered at 1 Hz using a high pass filter and 40 Hz using a low pass filter and were further segmented into 60 artifact free segments of 100 ms prestimulus epochs from correct and incorrect trials (Figure 3).
Segmentation Strategy for the Emotional Inference Task. 100 ms Pre-stimulus Epochs were Taken from Correct and Incorrect Trials.
The data were further subjected to artefact detection using a semi-automated artefact detection algorithm to mark bad channels, eye blinks and eye movements. 9 Eye blinks were defined as ≥140 µV drift in a moving average of 80 ms and eye movements were defined as ≥55 µV drift. Further artefacts like EMG, movement artefacts were identified by visual inspection and marked manually as bad channel or bad segment. Subsequently, bad channel replacement was done to remove bad channel/bad segments and only good epochs were carried forward for further analysis. All the files were converted to the raw file format and then exported to EEGLAB. Further down-sampling of data was done to 256 Hz, and 28 channels from the neck and face location were removed. Independent component analysis (ICA) was done to separate artefacts from EEG signals and also recover the independent sources of signals. 10
Microstate Analysis
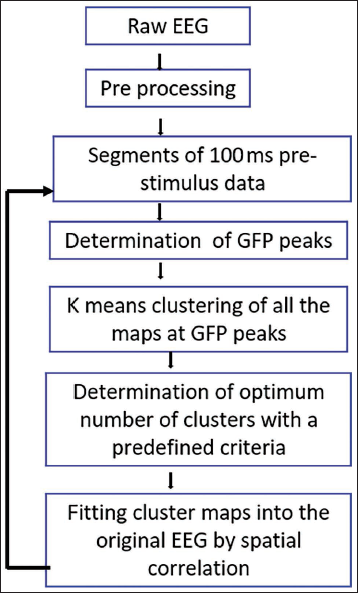
Microstate is global brain activity which can be described by the GFP, that is the root of the mean of the squared potential differences at all K electrodes (i.e., Vi(t)) from the mean of instantaneous potentials across electrodes (i.e., Vmean(t)). GFP is a measure of scalp electric field strength which is computed as the spatial standard deviation of the scalp electric potential field. 11 For analysis, the scalp maps of each of the participants were subjected to K-means cluster analysis, which determined the templates of the most dominant classes of EEG scalp topography. 12 The optimal number of clusters was determined using the cross-validation (CV) criterion, a measure of predictive residual variance. The minimum value of CV was taken as the residual variance for that cluster was minimal. The CV criterion was used to select the optimal cluster number with an intent to perform the analysis strictly driven by the data without having any prior assumptions. Subsequently, template maps of the cluster identified from the first step were spatially correlated with the scalp topographic maps of each subject. The microstate map that best represented each subject was determined based on the global explained variance (GEV). All the steps were performed separately for the emotional interference task. In the next step, the maps which were identified in the second step, were submitted to the second K-means cluster analysis and its best solution using CV criterion was determined. Subsequently, in the final step, the spatial correlation was done between the template maps and the scalp topographic maps of each subject for both the conditions separately. The number of time frames (TF), GEV, mean duration (MD) and time coverage (TC) were computed based on the spatial correlation for each template map (Figure 4).
Flowchart Highlighting the Steps Involved in Microstate Analysis.
Source Analysis
Standardised low-resolution brain electromagnetic tomography (sLORETA) was used for estimation of cortical sources based on solving the inverse problem of the current source density of different brain maps location. 13 Voxel-by-voxel comparison was done to ascertain the inter-group differences in the cortical activity. Subsequently, the critical probability threshold for the observed t-values with correction multiple comparisons across all voxels was done using statistical nonparametric mapping (SnPM) randomisation.
Data points for source analysis were extracted from the output of the second and final fitting in microstate analysis. Further, in order to localise the current source densities for microstate topographical changes, exact low resolution brain electromagnetic tomography was implemented in sLORETA software, consisting of 6,239 cortical voxels of 5 mm representing different gyri and Brodmann areas.
Results
Emotional Interference Task
Pre-stimulus EEG microstate between conditions correct versus incorrect trials.
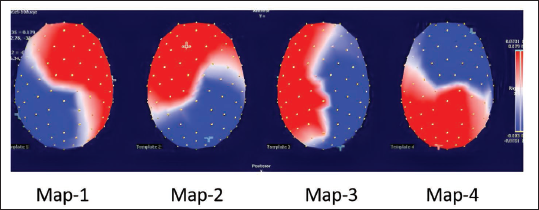
In correct versus incorrect trials of the emotional interference task, the CV criterion in the 2nd K-means cluster analysis identified four EEG microstate maps (55% variance) across the condition (Figure 5).
Four Scalp Topographical Template Maps Depicting the Pre-trial EEG Microstates as Identified by K-means Cluster Analysis. The Electrode Location is Shown as White Dots. The Colour Scale Represents the Intensity of Scalp Electric Potentials with Red and Blue Representing Positive and Negative Values, with a Cross Symbol Denoting Spatial Positions of Maxima and Minima of Scalp Electrical Potential.
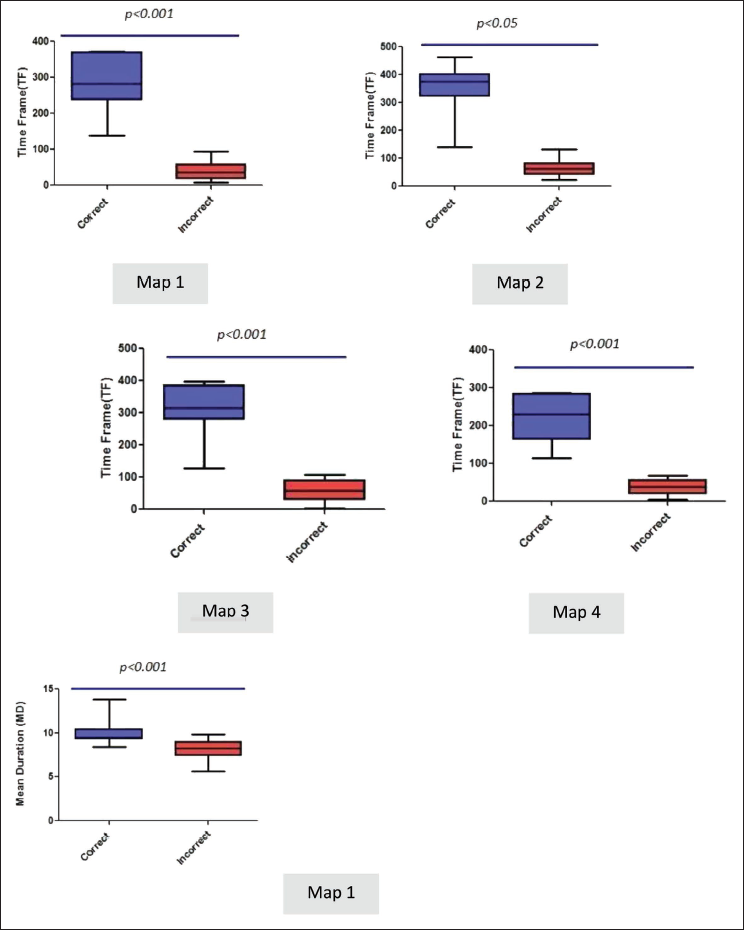
The following temporal parameters were calculated for each of the maps: GEV, MD, number of TF and TC (Table 1). Statistically significant difference was found in a number of TF temporal parameters in all the four maps, while the MD of Map 1 was significantly higher in correct versus incorrect trial. There was no significant difference in GEV and TC parameters of microstates (Figure 6). We also found a negative correlation between reaction time of the face word interference task with TC parameter of Map 3 (r: –0.5, P: .01).
Table Showing Significant Difference in Microstate Parameters Between Conditions for all the Maps of Face-word Task.
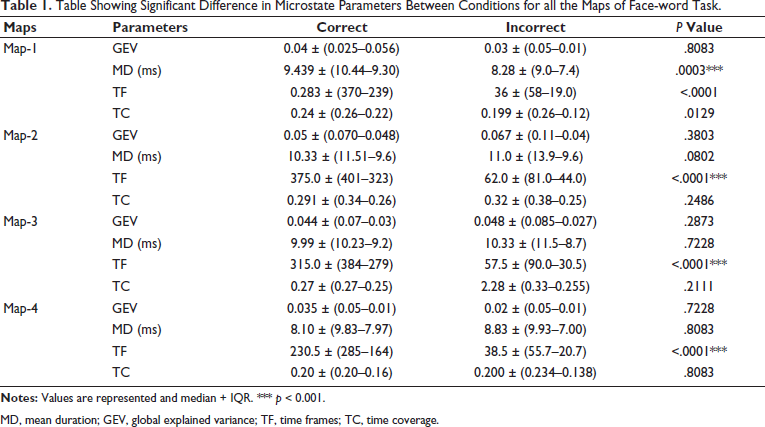
MD, mean duration; GEV, global explained variance; TF, time frames; TC, time coverage.
Boxplots Showing Statistically Significant Difference in Pre-trial Microstate Parameters (Time Frame [TF] and Mean Duration [MD] for Correct Versus Incorrect Trials for the Maps Provided. Values Represented and Median + IQR.
Source Analysis
The EEG microstate maps were extracted from each subject and their intracerebral current sources were estimated using standardised low resolution brain electromagnetic tomography (sLORETA).
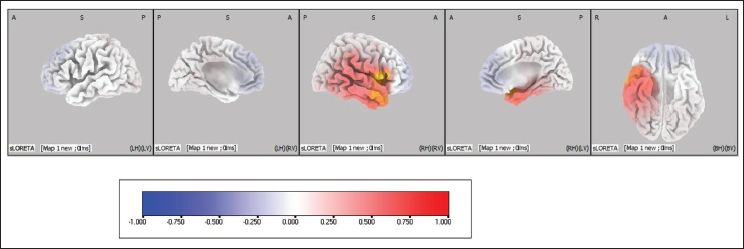
Pre-stimulus source results of emotional interference correct versus incorrect trials. Statistical analyses of the pre-stimulus EEG of the emotional interference task for all four maps were done using sLORETA. Based on the voxel-by-voxel analysis, suprathreshold cortical voxels that showed increased activations in correct trials versus incorrect trials in all four maps are shown in the table below and orthogonal slice view have been provided for Map 1 (Figure 7; Table 2), Map 2 (Figure 8; Table 3), Map 3 (Figure 9; Table 4) and Map 4 (Figure 10; Table 5).
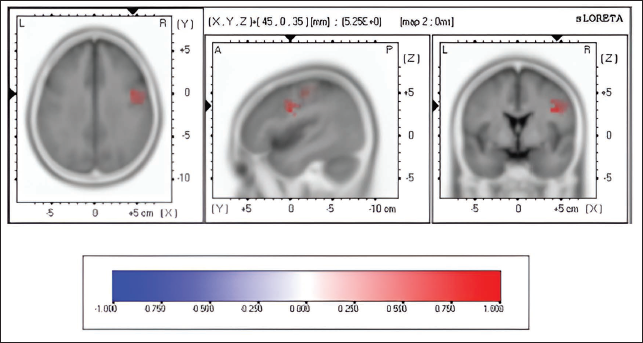
Pre-stimulus Source Activity of Map 1 Between Correct Versus Incorrect Trials of Emotional Interference Task. The Coloured Areas Represent the Spatial Extent of Voxels with Significant Difference in the Current Source Density. The Scale Presented Represents the t-statistic Values (Threshold Value: 4.387, Extreme P Value: .00020). L, Left; R, Right; A, Anterior; P, Posterior; S, Superior; I, Inferior.
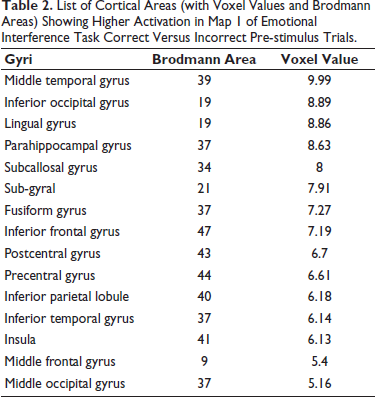
List of Cortical Areas (with Voxel Values and Brodmann Areas) Showing Higher Activation in Map 1 of Emotional Interference Task Correct Versus Incorrect Pre-stimulus Trials.
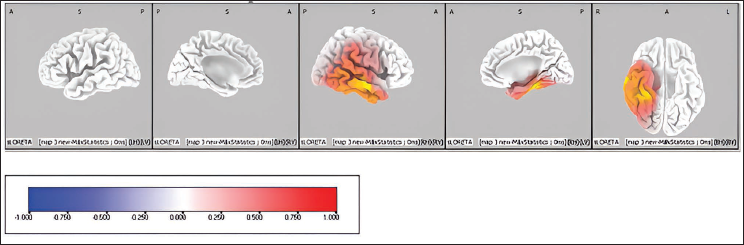
Pre-stimulus Source Activity of Map 2 Between Correct Versus Incorrect Trials of Emotional Interference Task. The Coloured Areas Represent the Spatial Extent of Voxels with Significant Difference in the Current Source Density. The Scale Presented Represents the t-statistic Values (Threshold Value: 4.271, Extreme P Value: .00020). L, Left; R, Right; A, Anterior; P, Posterior; S, Superior; I, Inferior.
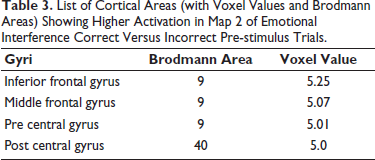
List of Cortical Areas (with Voxel Values and Brodmann Areas) Showing Higher Activation in Map 2 of Emotional Interference Correct Versus Incorrect Pre-stimulus Trials.
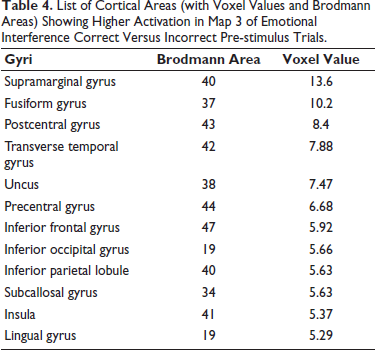
Pre-stimulus Source Activity of Map 3 Between Correct Versus Incorrect Trials of Emotional Interference Task. The Coloured Areas Represent the Spatial Extent of Voxels with Significant Difference in the Current Source Density. The Scale Presented Represents the t-statistic Values (Threshold Value: 4.230, Extreme P Value: .00020). L, Left; R, Right; A, Anterior; P, Posterior; S, Superior; I, Inferior.
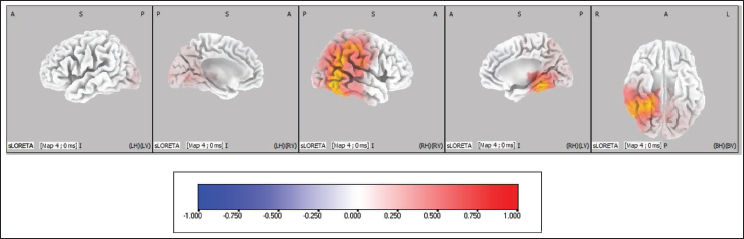
List of Cortical Areas (with Voxel Values and Brodmann Areas) Showing Higher Activation in Map 3 of Emotional Interference Correct Versus Incorrect Pre-stimulus Trials.
Pre-stimulus Source Activity of Map 4 Between Correct Versus Incorrect Trials of Emotional Interference Task. The Coloured Areas Represent the Spatial Extent of Voxels with Significant Difference in the Current Source Density. The Scale Presented Represents the t-statistic Values (Threshold Value: 4.404, Extreme P Value: .00020). L, Left; R, Right; A, Anterior; P, Posterior; S, Superior; I, Inferior.
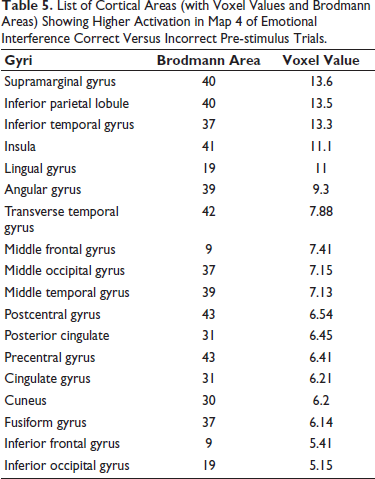
List of Cortical Areas (with Voxel Values and Brodmann Areas) Showing Higher Activation in Map 4 of Emotional Interference Correct Versus Incorrect Pre-stimulus Trials.
Discussion
The current study aimed to decipher the EEG microstate changes during the emotional interference task. To the best of our knowledge, this is the first study which has explored the neural changes in emotional interference using microstate analysis. Most of the previous studies have explored such analysis in mostly cognitive domains. Very few have attempted in emotional context and none in emotional interference. Significant changes were seen in the TF microstate parameter of the Maps 1, 2, 3 and 4 and the MD of Map 1 during the emotional interference task. Also, we have found the negative correlation of reaction time of Face Word interference and the TC parameter of Map 3. The differential topography and the intracerebral generators were found during the emotional interference task, which we will be discussing results-wise:
Microstate topography change during correct versus incorrect trials: Four common maps were generated between the correct and incorrect trials of the emotional interference task. We compared these maps with the canonical maps available in the literature.
Map 1: We found that Map 1 of our study matched with the canonical map of Map A given by Britz et al., 2010, implicated for phonological processing.
14
Since the emotional interference task involves the processing of words as an interfering stimulus, therefore, this topography may be predominant. Additionally, the cortical sources also revealed significant activations in middle temporal gyrus and superior temporal gyrus, areas involved in the process of phonological processing.
14
We also found activation in the pre and post central gyrus, fusiform gyrus, inferior frontal gyrus and insular cortex. Quevedo et al. (2018) also reported that higher activity was seen in precentral gyrus, postcentral gyrus and insula during exposure to emotional faces compared to neutral faces.
15
Kawasakhi et al., reported that fusiform gyrus is activated while processing of facial emotion,
16
while inferior frontal gyrus and insula contribute to interference resolution for emotional information.
17
Significant activation was found in inferior parietal gyrus involved in early processing of faces and motivational relevance,
18
parahippocampal gyrus, involved during the encoding of emotional information
19
and areas of prefrontal and temporal cortex, which are reported to have an enhanced activity during emotional words and pictures.
20
Map 2: Map 2 of correct versus incorrect trials of emotional interference task matched with the canonical map of C, given by Britz et al., 2010.
14
Map C is involved in attentional orientation, required for attending the stimuli during the performance of the task. The significant cortical sources were precentral and postcentral gyrus, prefrontal cortex, anterior cingulate gyrus, inferior frontal gyrus and middle frontal gyrus. These areas were in line with the study by Song et al., 2017, wherein tasks with more intense emotional interference consistently elicited increased brain activity in the precentral/postcentral gyrus, and the inferior and middle frontal gyrus too.
21
Similarly, Ovasikiya et al., 2011, also found increased activity in the anterior cingulate cortex and inferior frontal gyrus during emotional interference task.
3
Map 3: Interestingly, we found that the Map 3 of our tasks was similar to Map E involved in the default mode network.
22
The source analysis revealed significant activations in inferior parietal lobule, pre central and post central gyrus, submarginal gyrus, parahippocampal gyrus and uncus. Similarly, Batabyal et al., 2018 revealed significantly increased activity in premotor areas of pre and post central gyri, supramarginal areas in baseline as compared to task while using an emotional interference task
1
while Kilpatrick and Cahill, in 2003, reported activation of parahippocampal gyrus, fusiform gyrus and uncus during the emotional Stroop task.
19
Further, we found a significant negative correlation emerged between the reaction time of the face-word task and the TC parameter of Map 3 (P = .01). Map 4: Similar to Map 2, Map 4 had a similar topography to a canonical map of C, involved in attentional orientation.
14
The areas activated during source analysis were parahippocampal gyrus, posterior cingulate gyrus, insula and angular gyrus. Schlochtermeier et al. also documented higher activation in parahippocampal gyrus extending to the amygdala, frontal pole, anterior and posterior cingulate and insula during the performance of emotional cognitive tasks.
20
We also found higher activity in inferior temporal, middle temporal, superior temporal and transverse temporal gyri, which is in line with the previous literature in terms of processing of the facial expressions.
23
Thus, the pre-stimulus microstate can determine the performance of the individual in terms of the topography and cortical sources of microstate maps, elucidating interplay between the domains of phonological processing, attention orientation and default mode network. Further, we hypothesise Map 3, may be one of the pre-stimulus microstates, which governs the reaction time of the responses as evident by the behavioural manifestation.
Conclusion
The neural correlates of emotional interference in healthy controls were seen to unravel the microstate changes and their underlying cortical sources involved during emotional interference. Thus, apart from the stimuli attributes, ongoing brain activity even before the stimuli is presented (pre-stimulus microstate) also determines the task in hand in terms of the preparedness for the task.
Footnotes
Acknowledgement
The authors would like to thank all the participants for taking part in the study.
Authors’ Contribution
TR: data acquisition, processing and analysis, interpretation and manuscript writing; CL: data acquisition, processing and analysis, SK: Conceptualisation, interpretation and manuscript writing SPM: concept guidance PT: concept guidance; RS: supervision and conceptualisation. All authors: reviewed and approved the final version of the manuscript.
Statement of Ethics
The study has been approved by the Institute’s Ethical Committee (Ref. No. IECPG-48/.02.2020, RT-23/12/2020), AIIMS, New Delhi.
Declaration of Conflicting Interests
The authors declared no potential conflicts of interest with respect to the research, authorship and/or publication of this article.
Funding
The authors received no financial support for the research, authorship and/or publication of this article.
Patient Consent
Consent was obtained from the subjects for this study.