
Abstract
Background
Ageing (AG) is associated with cognitive decline and an increased risk of developing neurodegenerative diseases (NDs) like Alzheimer’s disease (AD) and Parkinson’s disease (PD). While individual diseases have been widely studied, cross-condition convergence at the transcriptomic and regulatory levels has not been systematically defined.
Objective
To identify a conserved molecular core shared across AG, AD and PD and to understand its functional and regulatory architecture using integrative network biology.
Methods
Four independent human brain transcriptomic datasets (n = 173 samples) representing AG, AD and PD were analysed using false discovery rate correction (FDR < 0.05). Genes commonly dysregulated across all conditions were identified via intersection analysis. Functional enrichment, protein–protein interaction (PPI) network analysis, and microRNA (miRNA) regulatory mapping were performed using clusterProfiler, STRING and multiMiR frameworks.
Results
A conserved set of 142 genes was identified across AG, AD and PD, with 94.4% exhibiting consistent directionality of regulation. AG clustered transcriptionally closer to AD than PD, while PD displayed stronger amplitude of dysregulation. Functional enrichment analysis revealed dominant involvement in synaptic signalling, axonal transport, vesicle trafficking and calcium homeostasis. Network analysis identified three essential regulatory hubs, CALM3, CDC42 and RAB3A. They are critical to neuronal signalling and cytoskeletal dynamics. miRNA analysis revealed coordinated regulation of hub genes by disease-associated miRNAs, including miR-29, miR-34, miR-7 and miR-195, and identified shared disease-associated regulators across AG, AD and PD conditions.
Conclusion
This study defines a shared neurodegenerative molecular core that bridges physiological AG with pathological neurodegeneration. The integration of transcriptomic, network, and miRNA analyses reveals systems-level convergence and identifies key regulatory nodes as attractive targets for cross-disease therapeutic strategies.
Keywords
Introduction
Neurodegenerative disorders are unified by the progressive dysfunction and loss of neurons, driven by molecular abnormalities that accumulate over decades before clinical symptoms become evident.1, 2 Central to neurodegeneration is the pathological aggregation of misfolded proteins, including amyloid-β and tau in Alzheimer’s disease (AD) and α-synuclein in Parkinson’s disease (PD), which initiate cascades of mitochondrial dysfunction, impaired proteostasis, synaptic failure, neuroinflammation and ultimately neuronal death.3–11 These disorders share overlapping pathological mechanisms despite their distinct clinical phenotypes, highlighting the need for integrative molecular investigations to identify common drivers of disease susceptibility and progression. 12
Ageing (AG) represents the dominant non-modifiable risk factor for neurodegeneration and is increasingly viewed as an active biological process rather than a passive decline.13, 14 AG is associated with cumulative molecular damage, impaired DNA repair, altered epigenetic regulation, mitochondrial dysfunction and chronic low-grade inflammation (‘inflammaging’) that collectively render the nervous system vulnerable to disease.13, 15 Individuals aged ≥65 years account for over 80% of AD cases globally, and the prevalence of PD exceeds 1% after the age of 60, rising to approximately 4%–5% in those above 85 years.16–18 With global life expectancy increasing, the number of individuals living with AD and PD is projected to triple by 2050, placing unprecedented pressure on healthcare systems worldwide.19, 20 Despite this convergence, most studies investigate AD, PD and AG independently or in pairs, limiting our understanding of shared molecular architectures of these three conditions.
Recent systems-level transcriptomic studies have demonstrated that neurodegenerative diseases (NDs) are not driven by isolated genes but by perturbations across gene networks governing synaptic integrity, ion homeostasis, cytoskeletal organisation and intracellular transport.3, 21, 22 However, existing meta-analyses predominantly focus on a single disorder or perform pairwise comparisons, thereby overlooking molecular signatures that may be conserved across AG, AD and PD.23–27 An integrated cross-condition analysis is therefore needed to identify conserved disease-associated transcriptional programmes that may represent a shared neurodegenerative core.22, 28
Beyond protein pathology, post-transcriptional regulation has emerged as a pivotal contributor to neurodegeneration.29–33 MicroRNAs (miRNAs) constitute an additional regulatory layer capable of modulating entire gene networks by targeting messenger RNAs (mRNAs) and altering neuronal survival, mitochondrial function, neuroinflammation and synaptic plasticity.2, 34–37 Several studies have reported dysregulated miRNA profiles in AD and PD brain tissue, cerebrospinal fluid and serum. Specific miRNAs implicated in these NDs include the miR-29 family, miR-34a and miR-132. They have been implicated in amyloid metabolism, tau phosphorylation, α-synuclein toxicity and neuroimmune signalling.9, 38–45 Importantly, miRNAs often target multiple disease-associated genes, enabling systems-level dysregulation that extends beyond single-gene effects. 46
These observations indicate that protein aggregation, transcriptomic remodelling and miRNA dysregulation represent interconnected molecular layers of neurodegeneration rather than independent processes. 30 Integrating these regulatory domains offers a powerful strategy to resolve gene networks that persist across AG, AD and PD and to identify molecular convergence points suitable for therapeutic targeting. 47
In this study, we perform a cross-condition transcriptomic meta-analysis using four independent human brain microarray datasets encompassing AG, AD and PD. We identify genes that are consistently dysregulated across these conditions and systematically characterise their biological functions using gene ontology (GO), pathway analysis, protein–protein interaction (PPI) networks and miRNA regulatory mapping. Our objective is to identify a conserved neurodegenerative molecular signature and uncover regulatory features that may underlie shared disease mechanisms at the intersection of AG and neurodegeneration.
Materials and Methods
Data Collection and Study Design
Publicly available human brain transcriptomic datasets were obtained from the Gene Expression Omnibus (GEO)48, 49 repository of the National Centre for Biotechnology Information (NCBI). Four independent microarray datasets representing AG, AD and PD were selected based on brain-region relevance, platform compatibility and adequate sample size. For AD, two datasets profiling the superior frontal gyrus were used (
Only postmortem cortical or nigral tissue was analysed to reduce anatomical variability. A case–control design was maintained across all datasets such that each disease cohort was compared against its corresponding control group. A summary of sample composition and dataset characteristics is provided in the supplementary data S1.
Data Preprocessing and Normalisation
Raw CEL files were processed using the Robust Multi-array Average (RMA) algorithm implemented in the affy and oligo packages in R (version 4.5.2).54, 55 RMA preprocessing included background correction, quantile normalisation and summarisation of probe intensities into expression values, which were log2 transformed where required based on quantile inspection. Expression distributions were assessed to ensure comparability across arrays within each dataset.
Probe identifiers were mapped to official gene symbols using the corresponding platform annotation files obtained from the Bioconductor repository. Where multiple probes matched the same gene symbol, median expression values were used to represent gene-level expression.
Differential Expression Analysis
Differential expression analysis was performed independently for each dataset using the limma package (version 3.66.0) 56 in R. Linear models were fit for each gene, comparing disease or aged cohorts against their respective controls. Empirical Bayes moderation was applied to stabilise variance estimates. Raw p values were adjusted using Benjamini–Hochberg false discovery rate (FDR) correction to control for multiple hypothesis testing.
Genes with adjusted p values (FDR) less than 0.05 were considered statistically significant. No log2 fold-change threshold was applied, consistent with the objective of capturing coordinated transcriptional shifts rather than amplitude-restricted effects. For each condition, a list of significantly dysregulated genes was generated for downstream integration.
Cross-condition Meta-analysis Strategy
This study employed a convergent differential expression framework to identify genes that were significantly dysregulated across AG, AD and PD. To identify genes commonly affected across the datasets, the differentially expressed gene (DEG) lists from the AG, AD and PD datasets were intersected. The resulting set of genes is referred to as common differentially expressed genes (cDEGs). This vote-counting strategy emphasises biological concordance across independent datasets and is suitable for heterogeneous conditions where effect size distributions vary by cohort and platform.
In addition, directional consistency was examined by evaluating the sign of log2-fold changes across datasets. Genes with concordant upregulation or downregulation across conditions were classified as same-direction cDEGs and analysed separately as supportive evidence of regulatory coherence.
Functional Enrichment and Pathway Analysis
Biological annotation of the cDEGs was conducted using the clusterProfiler 57 and ReactomePA 58 packages in R. GO analysis was performed to identify enriched biological processes (BP), molecular functions (MF) and cellular components (CC). Pathway enrichment was assessed using ReactomePA.
Statistical significance was assessed using combined score ranking and adjusted p values. Terms with corrected p values less than 0.05 were considered significant. Enrichment outputs were visualised using dot plots with colours representing Bonferroni-adjusted significance values and dot size corresponding to gene overlap.
PPI Network Construction
PPI analysis was performed using the STRING database (version 12.0), 59 restricting interactions to experimentally supported and predicted functional links with a minimum interaction confidence score of 0.4. The cDEGs were imported into STRING to retrieve interaction networks, which were subsequently visualised and quantified using igraph60, 61 in R.
Network nodes were analysed by calculating Degree centrality and Betweenness centrality. Nodes (proteins) scoring in the top 10th percentile for Degree centrality were designated as hubs, while those in the top 10th percentile for Betweenness centrality were termed bottlenecks. Nodes that ranked in the top 10th percentile for both Degree and Betweenness centrality were categorised as essential nodes (ENs), representing critical nodes to network integrity. Subnetworks involving only hubs and bottlenecks were extracted to visualise the core regulatory architecture.
miRNA Regulatory Network Analysis
Experimentally validated miRNA–gene interactions targeting the cDEGs were extracted from the multiMiR R package.62, 63 A miRNA–gene regulatory network was constructed to visualise multi-targeting regulatory interactions. Emphasis was placed on miRNAs regulating hubs and bottleneck network nodes, given their functional importance in disease regulation. To focus on potentially significant regulatory elements, the network was constrained to include only miRNAs that fulfilled two criteria: the presence of at least one experimentally validated interaction (e.g., reporter assay, western blot, quantitative polymerase chain reaction) with a hub or bottleneck gene, and the targeting of a minimum of two hub or bottleneck genes.
Disease–miRNA Association Mapping
To identify disease-associated miRNAs, the Human MicroRNA Disease Database (HMDD v4.0) 64 was queried independently for AD, PD and AG. Disease-associated miRNAs were catalogued and compared across conditions to identify overlaps. Overlap analysis was performed to identify miRNAs implicated in multiple conditions. These miRNAs were evaluated based on functional roles reported in the literature.
Statistical Environment
All analyses were performed using R statistical software (version 4.5.2). Functional enrichment analyses for GO and biological pathways were conducted using the clusterProfiler and ReactomePA packages. PPI data were retrieved through the STRING database using the STRINGdb package, while miRNA–target interactions were obtained using the multiMiR package and validated disease–miRNA associations were retrieved from the HMDD database. Network construction, topological analyses and graph visualisations were performed using the igraph and ggraph packages within R.
Results
Conserved Neurodegenerative Transcriptomic Core
Large and distinct DEG landscapes were identified in each condition, comprising 5,369 genes in AD, 6,367 in AG and 473 in PD. Intersection analysis revealed 142 genes commonly dysregulated across all three conditions (i.e., AG, AD and PD), defining a conserved neurodegenerative transcriptomic core, referred to as cDEGs (Figure 1A and Supplementary Figure S2). The complete gene list and corresponding log2 fold-change values are provided in supplementary data S3.
To visualise expression behaviour across conditions, the 142 shared genes were plotted as a heatmap using raw log2 fold-change values (Figure 1B). Hierarchical clustering demonstrated structured transcriptomic organisation, with AG and AD clustering more closely than PD, indicating greater similarity between AG and AD at the expression pattern level. PD showed partial separation, reflecting both shared and condition-specific transcriptional features within the conserved gene set. Of the 142 shared genes, 134 (94.4%) exhibited the same direction of regulation across AG, AD and PD, demonstrating highly consistent directional alignment despite variation in magnitude (Supplementary data S4).
Cross-condition Transcriptomic Overlap and Expression Patterns Across AG, AD and PD. (A) Venn Diagram Showing the Overlap of Significantly Differentially Expressed Genes (DEGs; Adjusted p < 0.05) Identified Independently in AG, AD and PD Brain Transcriptomic Datasets. Each Circle Represents the DEG Set from One Condition. Intersections Denote Genes Shared Between Conditions, with the Central Overlap Highlighting the 142 Genes Commonly Dysregulated Across AG, AD and PD, Which Define the Conserved Neurodegenerative Transcriptomic Core Analysed in Downstream Functional, Network and miRNA Regulatory Analyses. (B) Heatmap of 142 Commonly Dysregulated Genes Across AG, AD and PD. Hierarchical Clustering Heatmap Representing Raw Log2 Fold-change Values for the 142 Shared Genes. Red Indicates Upregulation and Green Indicates Downregulation Within Each Gene. AG and AD Show Closer Clustering Compared to Parkinson’s Disease, Indicating Stronger Transcriptional Concordance Between AG and AD.
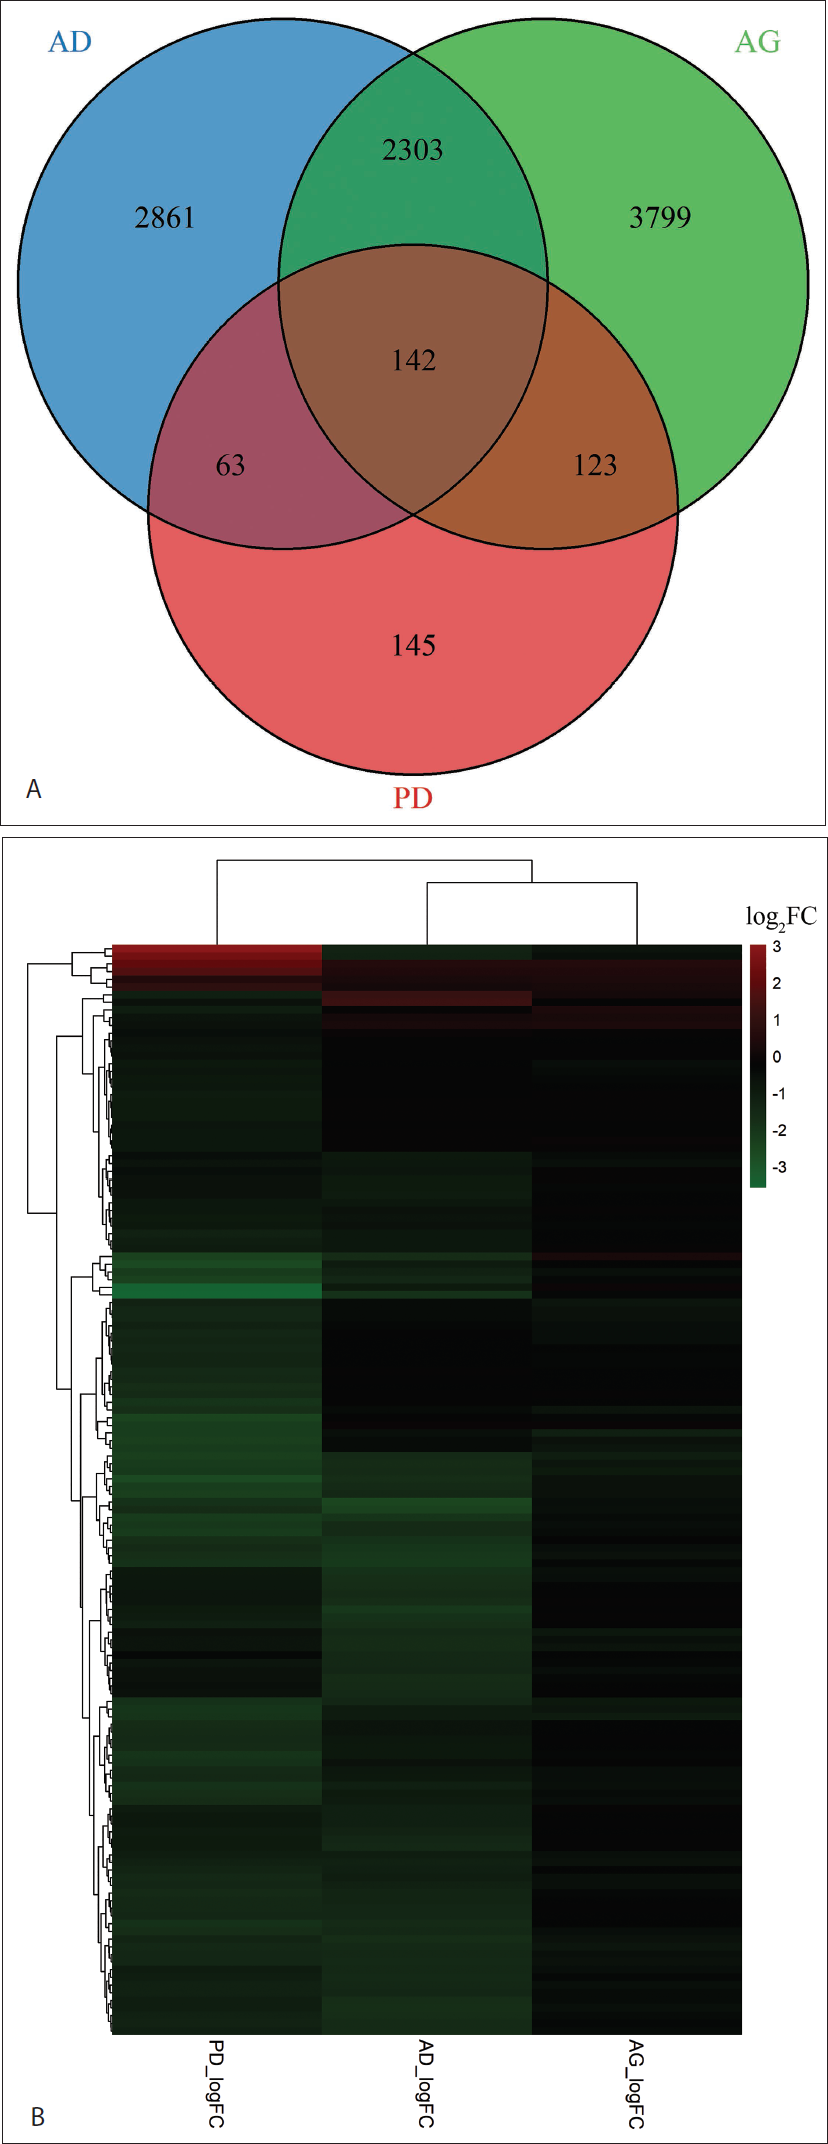
Pairwise overlap analysis revealed the highest intersection between AG and AD (2,303 genes), compared with AG–PD (123 genes) and AD–PD (63 genes). Despite having fewer total DEGs, PD exhibited high proportional involvement in the conserved gene set, indicating selective enrichment within a shared molecular framework rather than random overlap (Figure 1A and Supplementary Figure S2).
Together, these findings define a conserved transcriptional axis linking physiological AG with NDs and establish a unified molecular foundation underlying AG, AD and PD.
Functional Enrichment Highlights Synaptic Dysfunction and Axonal Degeneration
GO enrichment analysis of cDEGs demonstrated strong overrepresentation of the nervous system–associated BP. The most significantly enriched BP categories were related to neuronal development and synaptic function, including axonogenesis, neuron projection morphogenesis, axonal transport, synaptic signalling, chemical synaptic transmission and vesicle-mediated neurotransmitter release (Figure 2A).
Functional Enrichment Analysis of the Shared Neurodegenerative Gene Set. (A) Gene Ontology (GO) Biological Process Enrichment. Dot Plot Illustrating Significantly Enriched Biological Process (BP) Terms Among the 142 cDEGs. Gene Ratio Represents the Fraction of Shared Genes Involved in Each Pathway. Dot Size Corresponds to Gene Count, and Dot Colour Reflects Adjusted p value. Enriched Terms Highlight Synaptic Signalling, Axonogenesis, Neuron Projection Morphogenesis and Vesicle-mediated Transport. (B) GO Cellular Component Enrichment. Significantly Enriched Cellular Compartments Associated with cDEGs. The Analysis Localises Dysregulation to Axons, Presynaptic Terminals, Synaptic Vesicles and Postsynaptic Membranes, Indicating Disruption of Neuronal Architecture and Neurotransmission. (C) GO Molecular Function Enrichment. Dot Plot of Enriched Molecular Functions. The Dominant Term, Transporter Inhibitor Activity, Suggests Altered Ion Channel Regulation and Synaptic Excitability Across Conditions. (D) Reactome Pathway Enrichment Analysis. Reactome Pathway Dot Plot Highlighting Overrepresented Signalling Cascades Including Ion Homeostasis, Dopamine Neurotransmitter Release, Rho GTPase Signalling, Calcium Dynamics and VEGFR-mediated Vascular Permeability. Dot Size Reflects Gene Count and Colour Corresponds to Adjusted p Value.
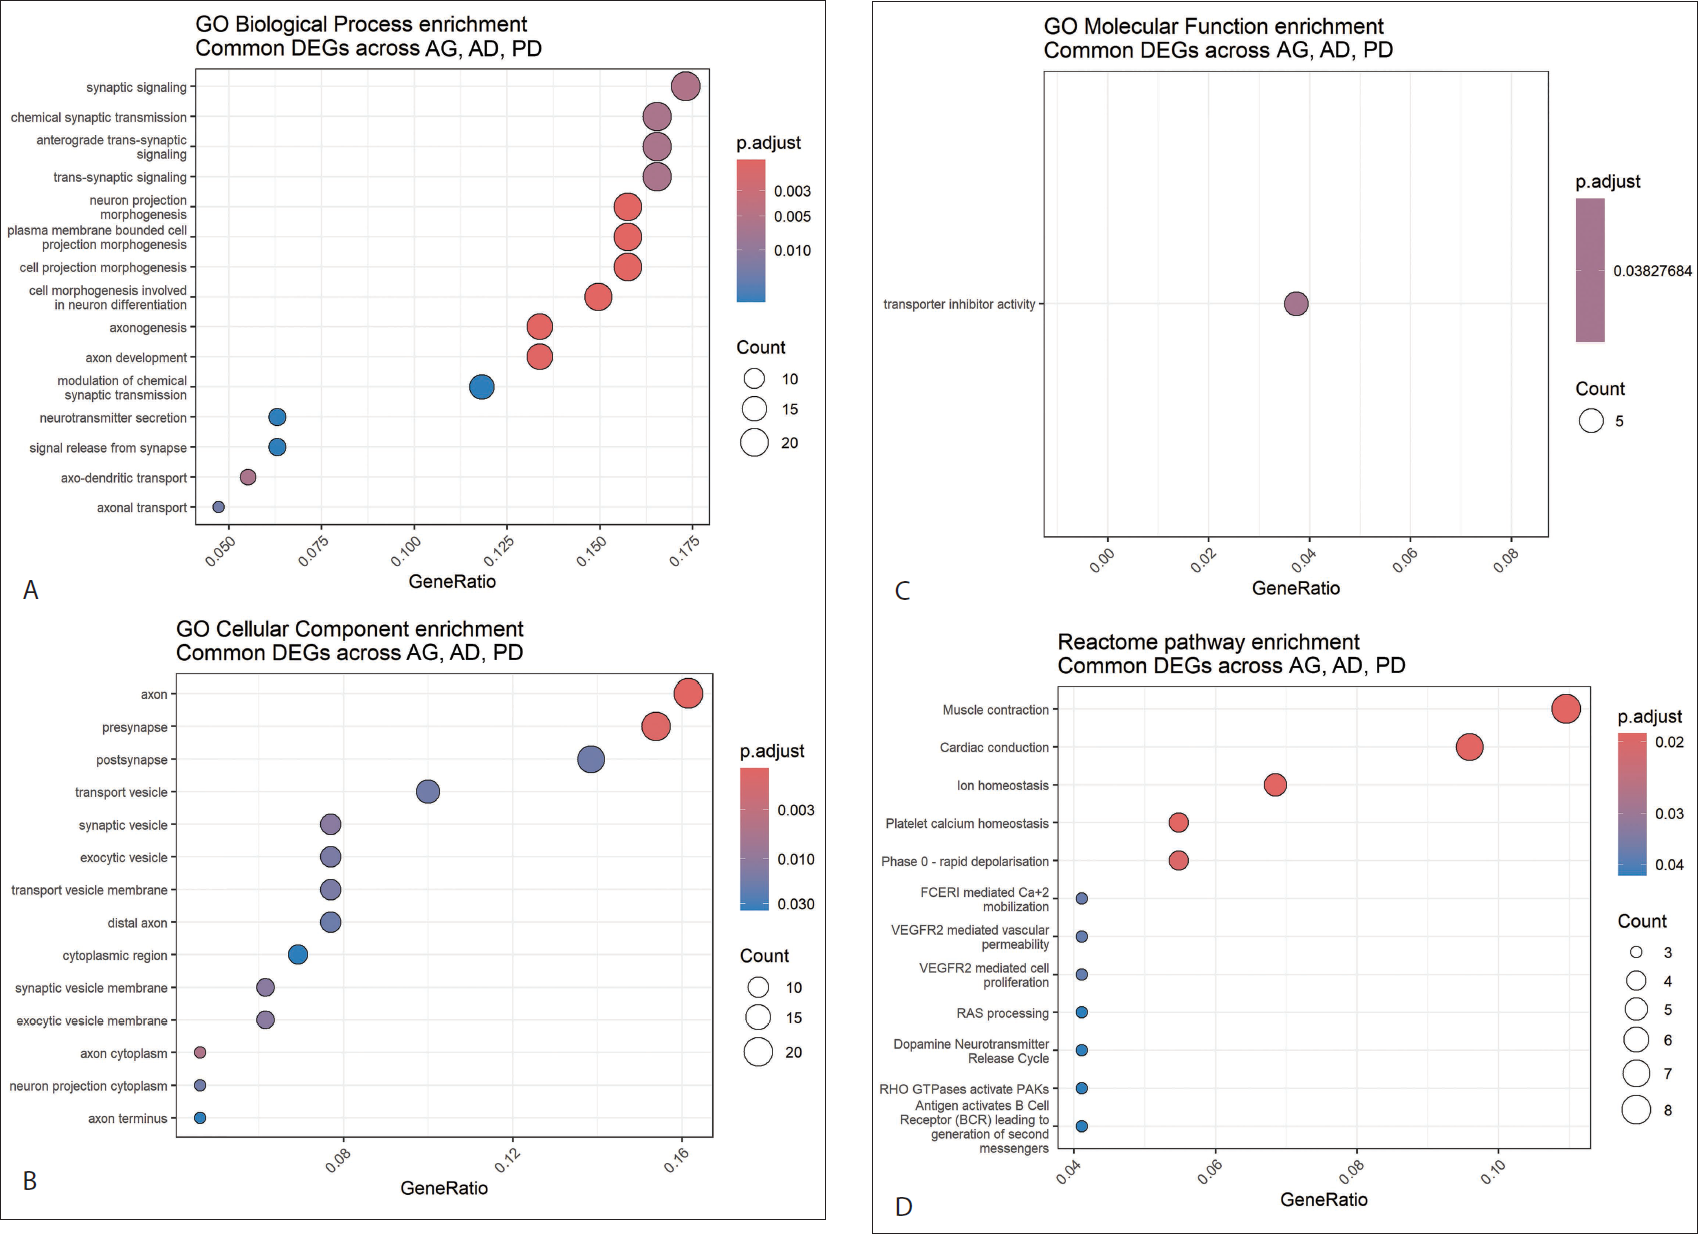
CC enrichment localised the common molecular disturbances to discrete neuronal compartments. Significantly enriched terms included axon terminals, presynaptic regions, synaptic vesicles, postsynaptic membranes, neuron projections and axonal cytoplasm (Figure 2B). Enrichment of transport vesicles, synaptic vesicle membranes and distal axon compartments indicates altered intracellular trafficking and synaptic organisation at the subcellular level.
MF analysis revealed selective enrichment for transporter inhibitor activity (Figure 2C), suggesting altered regulation of membrane transport processes involved in neuronal excitability and signalling.
Pathway enrichment analysis further identified significant associations with signalling and cytoskeletal regulatory cascades. The Reactome database highlighted ion homeostasis, calcium signalling regulation, Rho GTPase–mediated cytoskeletal remodelling, CDK5 deregulation, and synaptic vesicle cycling among the top-enriched pathways (Figure 2D). Additional enriched pathways included dopamine neurotransmitter release and RAS processing, as well as vascular signalling modules such as VEGFR-mediated permeability.
Collectively, GO and pathway analyses define a conserved functional signature centred on synaptic structure, neurotransmission, intracellular transport and signal transduction across AG, AD and PD.
PPI Network Identifies Core Regulatory Axis
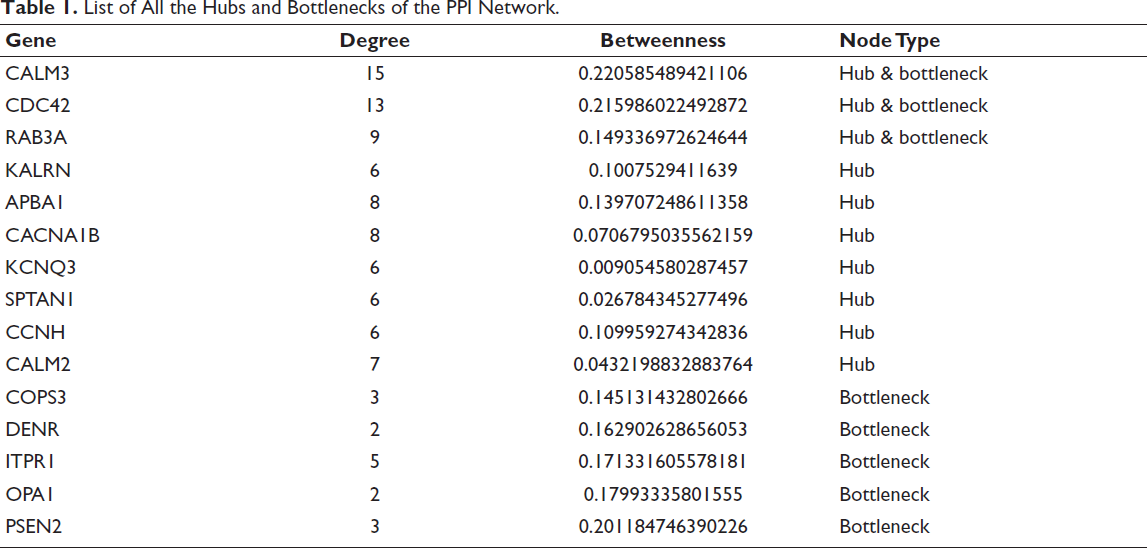
To examine whether the conserved transcriptional signature forms an integrated molecular network, a PPI network was constructed from cDEGs using the STRING database (interaction score cutoff = 0.4). The resulting network displayed a densely connected topology, consistent with a structured and non-random interaction architecture (Figure 3A). Multiple interconnected modules were observed, indicating functional organisation within the shared neurodegenerative gene set. The list of all the hubs and bottlenecks of the network is given in Table 1.
List of All the Hubs and Bottlenecks of the PPI Network.
Network Analysis of Conserved Neurodegenerative Proteins. (A) Protein–Protein Interaction (PPI) Network of cDEGs. PPI Network Constructed Using STRING (Minimum Confidence Score 0.4) Showing Interactions Derived from 142 Common Genes. Nodes Represent Proteins and Edges Indicate Predicted or Experimentally Supported Interactions. (B) Subnetwork of Hubs and Bottlenecks. Extracted Subgraph Illustrating Interactions Among Hubs, Bottlenecks and Essential Nodes. CALM3, CDC42 and RAB3A Emerge as the Central Regulatory Triad Anchoring the Shared Interactome.

Using this strategy, three genes emerged consistently as ENs, they are CALM3, CDC42 and RAB3A. These proteins exhibited both high connectivity and strong bridging properties, indicating their central positions within the network. CALM3 (Calmodulin-3) functions as a principal intracellular calcium sensor, coordinating signalling processes essential for neurotransmitter release and neuronal excitability. CDC42 (Cell division cycle 42) regulates actin cytoskeleton dynamics required for synaptic structure and neurite extension, whereas RAB3A is a vesicle-associated GTPase that controls synaptic vesicle docking and exocytosis.
A focused subnetwork consisting of hubs and bottlenecks revealed dense interconnectivity among ENs (Figure 3B), confirming the presence of a tightly organised protein core shared across AG, AD and PD.
To investigate how ENs behave across conditions, a heatmap of CALM3, CDC42 and RAB3A was generated using z-score–scaled log2 fold-change values (Supplementary Figure S5). This analysis revealed closely concordant expression profiles between AG and AD, whereas PD exhibited substantially stronger downregulation for all three genes. These differences indicate preserved regulatory direction but disease-specific magnitude of alteration across conditions.
Collectively, PPI analysis demonstrates that the common transcriptional signature is organised around a small number of highly connected proteins that anchor the broader molecular network and exhibit condition-dependent expression shifts.
Post-transcriptional Control of Hub Genes by miRNAs
To evaluate post-transcriptional regulation of the conserved neurodegenerative core, a miRNA–gene interaction network was constructed by mapping experimentally validated miRNA–target pairs onto all identified hubs and bottlenecks of the PPI network, including ENs. To enhance robustness, only high-confidence miRNA–gene interactions were retained after stringency filtering, as defined in the Methods section, were used for network construction. This integrative framework revealed extensive miRNA-mediated targeting of central regulatory proteins, indicating that transcriptional convergence across AG, AD and PD is reinforced at the post-transcriptional level.
Network reconstruction showed that multiple miRNAs exhibited high target multiplicity and preferentially regulated topologically important genes. Notably, miR-29c, miR-34a, miR-7 and miR-195 each targeted multiple hubs and bottlenecks, forming a dense regulatory layer over critical synaptic, mitochondrial and cytoskeletal proteins (Figure 4A). Target clustering around PPI hubs was not random but strongly enriched in core regulatory proteins governing neurotransmission, calcium signalling, vesicle trafficking and cytoskeletal integrity.
miRNA-mediated Regulatory Architecture. (A) miRNA–Hub/Bottleneck Gene Network. miRNA–Gene Regulatory Network Constructed by Mapping Experimentally Validated miRNA Interactions to Hub and Bottleneck Genes. The Network Highlights Regulatory Convergence of miRNAs Such as miR-29, miR-34a, miR-7 and miR-195 onto Central Synaptic and Cytoskeletal Regulators. (B) miRNA–Disease Association Network from HMDD. Disease–miRNA Network Constructed Using the HMDD Database. Red Nodes Represent Diseases (AD, PD, AG) and Blue Nodes Indicate Associated miRNAs. Yellow Nodes Denote miRNAs Common to Multiple Conditions. Edges Indicate Curated Disease Associations. Shared miRNAs Including miR-29 Family Members, miR-34c, miR-21 and miR-199a Isoforms Form Cross-condition Regulatory Links, Highlighting Post-transcriptional Convergence Across Neurodegenerative States.

miRNAs that affect ENs showed a significant overrepresentation of neurological and inflammatory conditions. Several miRNAs have been independently implicated in neurodegenerative mechanisms, including the miR-29 family in amyloid regulation and neuronal survival, miR-34a in synaptic remodelling and stress-associated apoptosis, miR-7 in mitochondrial regulation and α-synuclein homeostasis, and miR-195 in inflammatory signalling and neurovascular integrity.
These findings demonstrate that miRNA regulation is not peripheral but central to shared neurodegenerative biology. The miRNA regulation converges selectively on network-critical proteins, reinforcing dysregulation within synaptic and metabolic systems.
Collectively, this analysis establishes miRNAs as key regulatory amplifiers of the neurodegenerative core and highlights their relevance as biomarkers and therapeutic modulation points spanning AG, AD and PD.
Disease–miRNA Associations Reveal Cross-condition Regulatory Regulators
To identify miRNAs associated with disease-specific neurodegenerative phenotypes, curated miRNA–disease associations were retrieved from the HMDD database for AD, PD and AG. This yielded condition-specific miRNA profiles comprising 30 AD-associated, 35 PD-associated and 6 AG-associated miRNAs, reflecting differential regulatory landscapes across physiological AG and neurodegenerative pathology.
Disease overlap analysis revealed a subset of miRNAs implicated in more than one condition, indicating shared post-transcriptional regulatory architecture. Specifically, hsa-miR-29a, hsa-miR-29b-1, hsa-miR-29b-2 and hsa-miR-34c were common to AD and PD, hsa-miR-199a-1 and hsa-miR-199a-2 were shared between AG and PD and hsa-miR-21 overlapped between AD and AG. These intersections were visualised using a miRNA–disease network, where edges represent experimentally supported disease associations (Figure 4B and Table 2).
List of Common miRNAs Associated with Multiple Diseases.
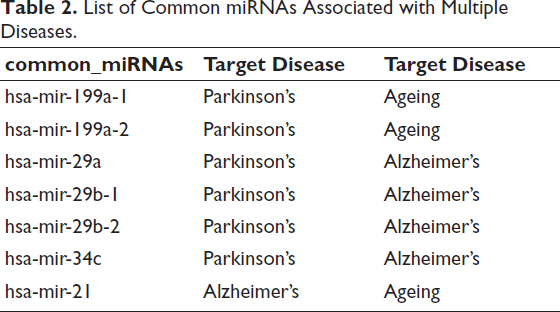
Notably, the miR-29 family and miR-34c formed the dominant regulatory cluster linking AD and PD, while miR-199a isoforms constituted the principal regulatory bridge between AG and PD. The intersection of miR-21 between AG and AD further supports involvement of immune and inflammatory regulatory modules shared between disease onset and physiological decline.
These multi-condition miRNAs represent a compact regulatory set underlying pathological convergence. Their recurrence across disease categories suggests that miRNA dysregulation precedes or accompanies neurodegenerative remodelling rather than functioning solely as disease-specific biomarkers.
Collectively, this analysis reveals a miRNA-based regulatory axis connecting AG, AD and PD and underscores post-transcriptional control as a shared molecular substrate of neurodegeneration.
Discussion
This study provides an integrative systems-level characterisation of molecular convergence across AG, AD and PD. By intersecting independently derived transcriptomic signatures from four well-curated brain datasets, we identified a robust core of 142 genes that define a conserved neurodegenerative axis. Importantly, the overwhelming directional concordance (94.4%) among these genes across conditions demonstrates that AG and NDs are not transcriptionally independent states but occupy a shared regulatory continuum. These findings provide a molecular basis for the long-observed epidemiological relationship between AG and neurodegenerative risk and establish a unified transcriptional foundation linking physiological and pathological neurodegeneration.
A central insight from the meta-analysis is that AD exhibits the highest transcriptional proximity to physiological AG, as reflected by clustering patterns and pairwise overlap, whereas PD retains selective integration into the core network despite a smaller DEG footprint. This observation is consistent with clinical and neuropathological evidence suggesting that AD more closely recapitulates accelerated AG in cortical systems, 65 whereas PD shows region-specific vulnerability dominated by substantia nigra pathology. 66 The comparatively stronger downregulation observed in PD among essential genes suggests that PD represents a more severe or advanced disruption of shared molecular programmes rather than a mechanistically distinct entity. Together, these patterns reinforce the concept that NDs reflect differential trajectories along a conserved molecular axis rather than isolated disease models. 67
Functional enrichment analysis revealed that the shared gene core is dominated by synaptic maintenance, axonal transport, vesicle trafficking and calcium signalling. These processes are fundamental to neuronal survival and network integrity and are disrupted early in neurodegeneration, often preceding histopathology.67–69 The overrepresentation of axonogenesis, synaptic vesicle cycling and presynaptic specialisations indicates that synaptic failure is not merely a downstream consequence of neuronal loss but is likely a primary driver of disease evolution. 70 Similarly, enrichment of cytoskeletal and transport processes highlights impaired intracellular trafficking as a shared vulnerability that compromises neurotransmitter delivery and mitochondrial positioning.68, 71 The enrichment of transporter inhibitor activity at the MF level further emphasises dysregulation of ion homeostasis and excitability, offering mechanistic insight into electrophysiological instability observed clinically.72, 73
PPI analysis further refined this transcriptional signature into a structured molecular architecture centred on three highly conserved regulators: CALM3, CDC42 and RAB3A. Each of these genes functions at cardinal points of neuronal regulation, CALM3 in calcium-dependent signalling and neurotransmitter release, CDC42 in cytoskeletal remodelling and synaptic morphogenesis, and RAB3A in vesicular trafficking and exocytosis. All three emerged as ENs across conditions, suggesting that neurodegeneration converges on disruption of calcium signalling, actin dynamics and vesicular transport as primary structural axes of vulnerability.74–76 The stronger transcriptional suppression observed in PD among these genes is consistent with profound synaptic failure and dopaminergic vulnerability in the substantia nigra. Importantly, these regulators integrate multiple downstream pathways rather than representing isolated effectors, supporting the hypothesis that central network failure rather than peripheral dysfunction drives disease propagation.
The miRNA regulatory analysis extends this convergence into the post-transcriptional domain, revealing that hubs and bottlenecks are not only transcriptionally dysregulated but are also subject to dense miRNA targeting. Key miRNAs, including miR-29, miR-34a, miR-7 and miR-195,43, 75, 77 emerged as common regulatory nodes targeting multiple essential proteins. Notably, these miRNAs have independently been implicated in amyloid metabolism, tau phosphorylation, mitochondrial regulation, α-synuclein homeostasis, synaptic remodelling and neuroinflammatory signalling. Their recurrence across conditions underscores the notion that miRNAs do not merely reflect disease consequences but actively shape disease progression through systems-level gene control.
This miRNA-driven convergence was further supported by disease association mapping, which revealed shared miRNAs across conditions. The miR-29 family and miR-34c unified AD and PD, miR-199 associated AG and PD, and miR-21 bridged AG and AD.40, 78–81 These overlaps indicate that post-transcriptional dysregulation emerges early and persists across disease trajectories, implicating miRNAs as upstream regulators rather than disease-specific byproducts. In particular, miR-29 and miR-34 family members have known roles in neuronal survival and apoptosis, while miR-199 and miR-21 influence inflammatory signalling and vascular integrity. Their cross-condition recurrence supports their biological relevance and translational potential as biomarkers and therapeutic targets.
The following methodological strengths enhance the validity of these findings. First, by applying dataset-level FDR correction and restricting conclusions to intersecting genes, we minimised platform-specific biases and prioritised biological reproducibility. Second, the absence of hard fold-change thresholds allowed detection of coordinated low-amplitude regulation, a defining feature of AG biology. Finally, by integrating functional annotation, protein networks, and miRNA regulation, this study transcends simple DEG overlap and reconstructs an interpretable regulatory framework.
However, this analysis is inherently correlative and does not establish causality. Brain-region specificity, cell-type heterogeneity and disease stage variation may also contribute to observed expression patterns. Furthermore, while validated miRNA–gene interactions were used, disease-specific regulatory contexts may introduce variability not fully captured by database resources. These limitations underscore the importance of independent experimental validation to confirm regulatory effects and cellular specificity.
Future validation strategies should include single-cell transcriptomic profiling to resolve cell-type contributions, CRISPR-based perturbation to assess gene dependency, and in vivo modelling to validate interactions within disease-relevant contexts. In addition, longitudinal sampling could clarify whether miRNA dysregulation precedes gene network collapse or results from it. Such studies would substantially strengthen causal inference and aid translation toward clinical application.
Conclusion
This study identifies a conserved neurodegenerative molecular core shared across AG, AD and PD. Using a cross-condition meta-analysis of human brain transcriptomes, we identified 142 genes that form a unified regulatory axis characterised by overwhelming directional consistency and functional concentration in synaptic integrity, intracellular transport and calcium signalling.
Network analysis resolved this signature into a central protein core anchored by CALM3, CDC42 and RAB3A, genes that integrate calcium dynamics, cytoskeletal architecture and vesicular trafficking. Complementing transcriptional convergence, miRNA network reconstruction revealed a coordinated post-transcriptional layer dominated by disease-relevant regulators, including miR-29, miR-34, miR-7 and miR-195. Disease association mapping further confirmed regulatory convergence through the recurrence of multi-disease miRNAs.
Together, these results support a unified model of neurodegeneration in which AG, AD and PD intersect through a conserved biological framework rather than through separate molecular programmes. The identified genes and miRNAs do not merely reflect pathology but constitute regulatory control points shaping cellular vulnerability.
These findings provide a biologically coherent foundation for therapeutic development aimed at shared vulnerabilities rather than disease-specific targets. With further experimental validation, the conserved neurodegenerative core described here may inform biomarker discovery and the design of multi-disease intervention strategies.
Footnotes
Acknowledgements
VV would like to thank the Anusandhan National Research Foundation (ANRF/PAIR/2025/000012/EPAIR), Indian Council of Medical Research (ICMR), New Delhi (ISRM/12(72)/2020, ID: 2020-2951), and Department of Biotechnology (DBT), Government of India (No. BUILDER-DBT-BT/INF/22/SP41176/2020), for their financial support to Lab.
Authors’ Contribution
Mona Chaurasiya: Conceptualisation, Methodology, Software, Data curation, Formal analysis, Investigation, Validation, Writing – original draft; Sai Nikhith Cholleti: Conceptualisation, Methodology, Data curation, Formal analysis, Investigation, Writing – original draft; Gajendra Prasad: Methodology, Data curation, Investigation.
Vaibhav Vindal: Conceptualisation, Methodology, Software, Resources, Writing – review & editing, Supervision.
Data Availability
Data are available within the article. The authors declare that all data supporting the findings of this study are included within the article and its supplementary information files.
Declaration of Conflicting Interests
The authors declared no potential conflicts of interest with respect to the research, authorship and/or publication of this article.
Funding
The author(s) received no financial support for the research, authorship, and/or publication of this article.
Statement of Ethics
Not applicable.
Supplemental Material
Patient Consent
Not applicable.
References
Supplementary Material
Please find the following supplemental material available below.
For Open Access articles published under a Creative Commons License, all supplemental material carries the same license as the article it is associated with.
For non-Open Access articles published, all supplemental material carries a non-exclusive license, and permission requests for re-use of supplemental material or any part of supplemental material shall be sent directly to the copyright owner as specified in the copyright notice associated with the article.