
Abstract
Background
Autoimmune encephalitis (AE) is a major cause of acute and subacute neuropsychiatric syndromes.
Purpose
While neuronal autoantibody testing aids diagnosis, results are often delayed or negative in seronegative cases. Cerebrospinal fluid (CSF) cytokine profiling may provide a rapid diagnostic adjunct.
Methods
In this cross-sectional study, we analysed CSF from 43 AE patients (29 seronegative, 9 N-methyl-
Results
All measured cytokines were significantly elevated in AE compared with controls (p < .001). CXCL10 and CXCL13 showed the largest differences between AE and controls, with CXCL13 particularly high in LGI1-positive cases. IL-6 correlated positively with IL-13 (r = 0.47, p = .0013) and CXCL13 (r = 0.41, p = .0064), while IL-7 correlated with IL-21 (r = 0.33, p = .029). Cytokine profiles in seronegative AE were comparable to antibody-positive AE, with no statistically significant differences.
Conclusions
CSF cytokines—particularly CXCL10, CXCL13, IL-6 and IL-13—are consistently elevated in AE and reflect shared intrathecal immune activation across antibody-positive and seronegative cases. These findings are exploratory, and cytokines are proposed as adjunctive immunological markers rather than standalone diagnostic tools.
Keywords
Introduction
Autoimmune encephalitis (AE) is an emerging group of neuroinflammatory disorders caused by dysregulated immune responses directed against neuronal cell surface antigens, synaptic proteins or intracellular molecules. Autoimmune diseases are characterised by immune responses directed against self-antigens, resulting in tissue inflammation and organ dysfunction. Over the last two decades, AE has been increasingly recognised as a major cause of acute and subacute neuropsychiatric syndromes, with clinical presentations that include psychiatric disturbances, seizures, memory impairment, abnormal movements and cognitive decline.1–3 AE may occur in both paediatric and adult populations and can be paraneoplastic or non-paraneoplastic. The diagnosis often requires a multidisciplinary approach involving neurology, psychiatry, neuroimaging and immunology.
Currently, antibody testing is considered the cornerstone of AE diagnosis, as specific antibodies such as anti-N-methyl-
Cerebrospinal fluid (CSF) analysis offers a unique opportunity to explore intrathecal immune responses in AE. While routine CSF findings, such as mild pleocytosis or oligoclonal bands, are supportive, they are not disease-specific. Cytokines and chemokines are central mediators of neuroinflammation and may serve as measurable biomarkers to differentiate AE from other encephalitis. Several studies have highlighted elevated levels of interleukins (IL-6, IL-7, IL-13, IL-21) and chemokines (CXCL10, CXCL13) in AE, which play roles in T-cell activation, B-cell trafficking and antibody production.9–14 However, the adjunctive diagnostic value of these markers in a well-characterised cohort that includes both antibody-positive and seronegative AE has not been comprehensively assessed.
In this context, we conducted a cross-sectional study at a tertiary referral centre in India to evaluate CSF cytokine and chemokine profiles in AE patients compared with disease controls. The primary objective was to determine whether specific CSF biomarkers could distinguish AE from controls and whether seronegative AE exhibited inflammatory signatures comparable to antibody-positive AE. By systematically analysing IL-6, IL-7, IL-13, IL-21, CXCL10 and CXCL13, we aimed to clarify their potential as diagnostic adjuncts and provide insights into the immunopathogenesis of AE.
Materials and Methods
Study Design and Setting
This was an observational cross-sectional study conducted at the Department of Neurology, All India Institute of Medical Sciences (AIIMS), New Delhi, between December 2020 and December 2024. The study was approved by the Institutional Ethics Committee, and written informed consent was obtained from all participants or their legal guardians. A total of 43 patients fulfilling the diagnostic criteria for AE were enrolled.
5
Patients were classified as:
Antibody-positive AE: Including NMDA receptor (NMDAR) antibody-positive (n = 9), LGI1 antibody-positive (n = 3), glutamic acid decarboxylase 65 (GAD65) antibody-positive (n = 1), and γ-aminobutyric acid B receptor (GABAB) antibody-positive (n = 1). Seronegative probable AE: Patients fulfilling clinical and radiological criteria but were negative for known neuronal antibodies (n = 29).
The control group comprised 34 individuals, including patients with idiopathic intracranial hypertension (IIH, n = 33) and one patient with viral encephalitis. These controls were chosen because lumbar puncture was clinically indicated, providing CSF samples for comparison.
The diagnosis of possible AE and antibody-negative probable AE was as per the criteria by Graus et al. 2
Inclusion and Exclusion Criteria
Inclusion criteria were:
Patient of AE.
Patients having no contraindication for CSF study.
Exclusion criteria included:
Patients with systemic autoimmune disease unrelated to the central nervous system (CNS).
Insufficient or poor-quality CSF samples.
Refusal of consent.
Cerebrospinal Fluid Collection and Processing
CSF (approximately 3 mL) was collected under sterile conditions via lumbar puncture at the L3–L4 or L4–L5 interspace. Samples were centrifuged at 4,000g for 10 min at 4°C to remove cells and debris. The supernatant was aliquoted in 500 µL volumes into sterile tubes, labelled and stored at −80°C until analysis. To minimise variability, all samples were thawed only once prior to assay. Clinical and demographic information was recorded at the time of sample collection. All CSF samples underwent a single freeze–thaw cycle prior to analysis to minimise degradation-related variability.
Neuronal Autoantibody Detection
Neuronal surface and intracellular autoantibodies were analysed in CSF and/or serum samples. Antibodies against the NMDAR, LGI1 and GABAB were detected using commercially available cell-based assays (Euroimmun, Lübeck, Germany), following the manufacturer’s instructions.
Briefly, patient samples were incubated on biochips containing human embryonic kidney (HEK293) cells transfected with the respective target antigens. CSF samples were used undiluted or minimally diluted, while serum samples were tested at an initial dilution of 1:10. After incubation for 30 min at room temperature, slides were washed with phosphate-buffered saline and incubated with fluorescein isothiocyanate-conjugated anti-human IgG secondary antibody. Following a second wash, slides were mounted and evaluated by fluorescence microscopy. Results were interpreted based on the presence of specific membrane fluorescence in transfected cells compared with non-transfected controls. Positive and negative controls were included in each assay run.
Antibodies against GAD65 were detected using a quantitative enzyme-linked immunosorbent assay or a line immunoassay (Euroimmun), in accordance with the manufacturer’s protocol. Optical density was measured using a microplate reader, and results were interpreted using predefined cut-off values. Borderline results were retested for confirmation.
All assays were performed in accordance with the standard operating procedures of the institutional laboratory, with appropriate internal quality controls to ensure assay validity and reproducibility.
Multiplex Cytokine Assay
Cytokine and chemokine concentrations were quantified using a custom Bio-Plex Pro multiplex immunoassay (Bio-Rad, Hercules, CA, USA). The analytes measured included IL-6, IL-7, IL-13, IL-21, CXCL10 (IP-10) and CXCL13. Each CSF sample was run in triplicate, and assays were performed according to the manufacturer’s protocol. The assay sensitivity, detection limits, and intra- and inter-assay coefficients of variation were within the ranges specified by the manufacturer (Bio-Rad Laboratories).
Briefly, 50 µL of diluted bead solution and 50 µL of CSF were added to wells of a 96-well plate and incubated for 3 h. Plates were washed and incubated with biotinylated detection antibodies for 1 h, followed by streptavidin-phycoerythrin for 30 min. Plates were read on a Bio-Plex system, and standard curves were generated using five-parameter logistic regression. Quality control included replicate wells, negative controls, and the use of internal standards.
Statistical Analysis
Data were analysed using GraphPad Prism 7.03 and SigmaPlot 13.0. Continuous variables were expressed as the mean ± standard deviation (SD). Those variables without normal distribution (as assessed by the Shapiro–Wilk test) were tested by non-parametric tests (Mann–Whitney U test or Kruskal–Wallis test as appropriate). One-way analysis of variance (ANOVA), followed by Dunnett’s test/Tukey’s post hoc test, is used as required to analyse the data between more than two groups. A p value < .05 was considered statistically significant. Results were considered to be statistically significant at a significance level of p < .05 (*), p < .01 (**), p < .001 (***), p < .0001(****). Pearson’s correlation coefficients were calculated to assess associations between cytokine levels. No correction for multiple comparisons was applied. Scatter plots were generated to visualise relationships.
Results
Clinical Characteristics
A total of 43 patients with AE (17 male, 26 female) were enrolled. Of these, 29 were seronegative, 9 were NMDAR antibody-positive, 3 were LGI1-positive, one patient was positive for the GAD65, and another for the GABAB antibody. The mean age varied considerably across groups: patients with seronegative AE were older (45.6 ± 18.4 years), while those with NMDAR-positive AE were younger (27.4 ± 9.4 years). The control group comprised 33 patients with IIH and one with viral encephalitis, with a mean age comparable to the AE group (Table 1).
Clinical Data of Patients and Controls.
Cytokine and Chemokine Profile in Autoimmune Encephalitis Patients
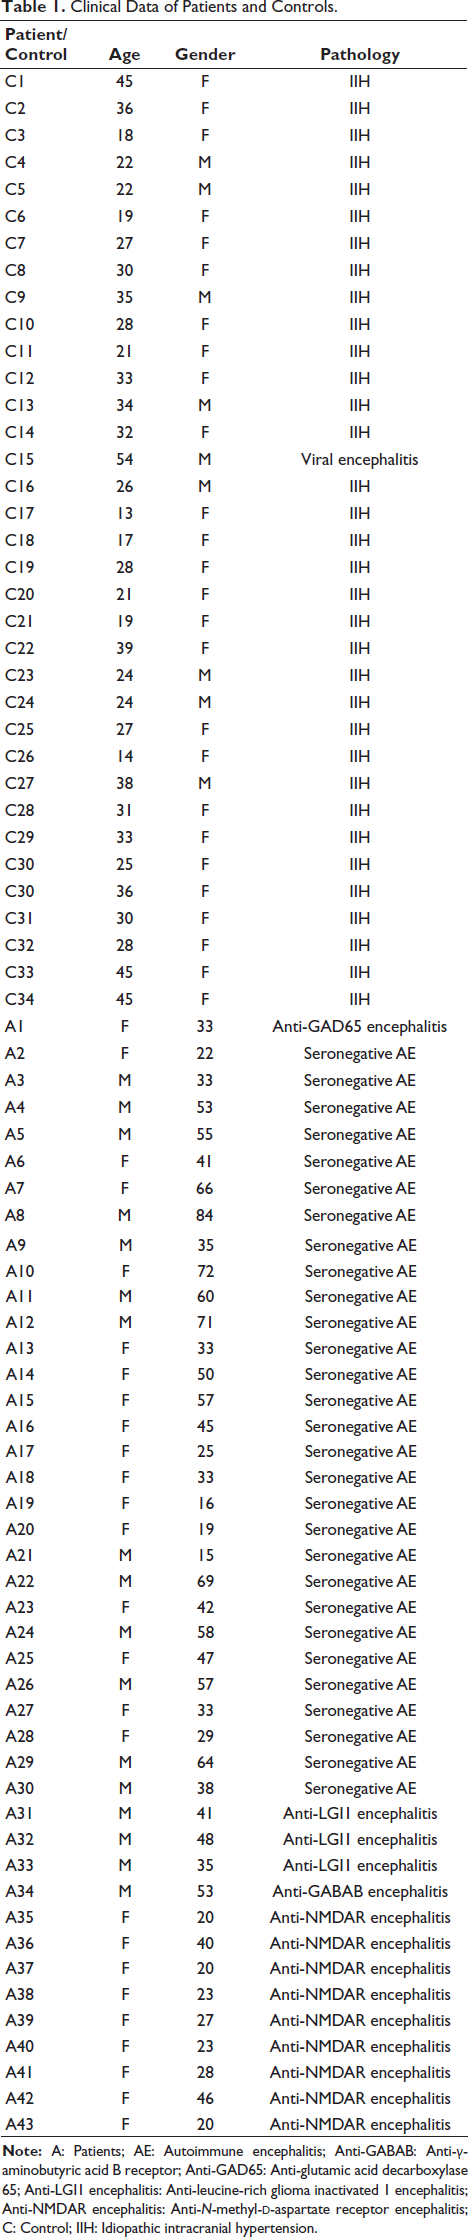
Across all subgroups, cytokine concentrations in CSF were substantially higher in AE compared to controls. CXCL10 levels were particularly elevated in AE patients, with mean values nearly fourfold higher than in controls (19,387 ± 13,006 pg/mL vs 4,991 ± 1,443 pg/mL). The highest CXCL10 values were observed in seronegative AE, followed closely by NMDAR-positive cases. Statistical comparisons revealed highly significant differences between AE patients and controls (p < .001 for most subgroups), whereas differences between AE subgroups were not significant, suggesting a uniform elevation of this chemokine across AE phenotypes (Figure 1).
CXCL13 also demonstrated significant elevation, with mean levels of 3.37 ± 1.38 pg/mL in AE patients compared to 0.75 ± 0.30 pg/mL in controls (p < .001). Interestingly, LGI1-positive patients had markedly higher CXCL13 levels; however, this observation should be interpreted cautiously due to the small number of patients in this subgroup (5.47 ± 1.23 pg/mL) compared to both the seronegative and NMDAR-positive groups, suggesting a potentially stronger B-cell-mediated response in this subtype (Figure 1).
IL-7 concentrations showed a distinct pattern, with values approximately five times higher in AE than in controls (25.77 ± 11.33 pg/mL vs 5.84 ± 2.54 pg/mL). Within AE subgroups, seronegative patients again had the highest IL-7 levels, though differences between AE subgroups were not statistically significant (Figure 1).
IL-6 was consistently elevated in AE patients, with mean concentrations of 10.66 ± 5.28 pg/mL compared to 2.56 ± 0.82 pg/mL in controls (p < .001). The elevation was uniform across subgroups, underscoring its central role in inflammatory cascades (Figure 1).
IL-13 showed the most dramatic difference, with AE patients exhibiting nearly fivefold higher levels than controls (75.6 ± 27.3 pg/mL vs 15.8 ± 4.27 pg/mL, p < .001). All AE subtypes showed comparable increases, highlighting IL-13 as a reliable marker of CNS inflammation (Figure 1).
IL-21 concentrations, though modest compared to IL-13, were significantly elevated in AE patients (5.25 ± 1.51 pg/mL) compared with controls (1.41 ± 0.42 pg/mL, p < .001). No significant inter-subgroup differences were observed (Figure 1).
Correlation Analyses
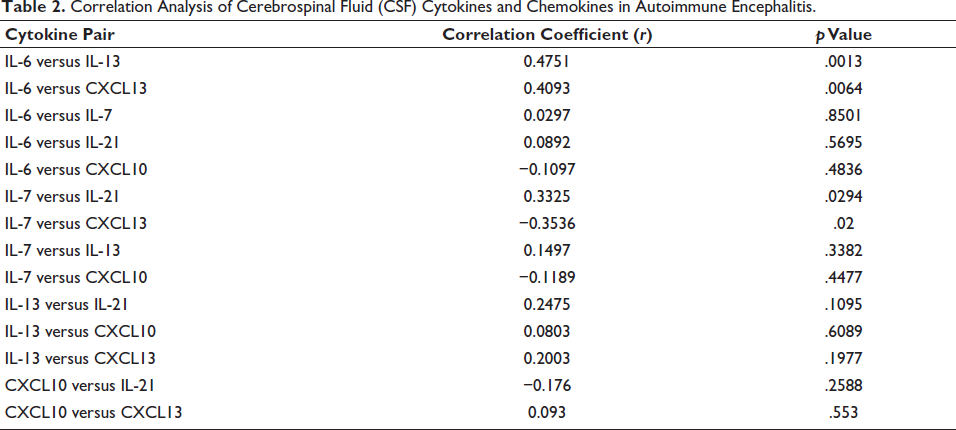
Correlation analyses revealed important interactions between cytokines. IL-6 correlated positively with IL-13 (r = .47, p = .0013) and with CXCL13 (r = 0.41, p = .0064), suggesting a mechanistic link between pro-inflammatory and B-cell-attracting mediators. IL-7 correlated positively with IL-21 (r = 0.33, p = .029), indicating co-activation of T-cell survival and helper functions, while a significant negative correlation was observed between IL-7 and CXCL13 (r = −0.35, p = .020). CXCL10, despite its marked elevation, did not correlate significantly with other cytokines, suggesting independent regulation (Table 2).
Correlation Analysis of Cerebrospinal Fluid (CSF) Cytokines and Chemokines in Autoimmune Encephalitis.
Discussion
This study provides comprehensive evidence that CSF cytokines and chemokines are consistently elevated in AE patients compared with controls, irrespective of antibody status. The findings underscore the central role of inflammatory mediators in AE pathogenesis. Among the measured analytes, CXCL10 and CXCL13 showed the largest differences between AE and the controls, aligning with previous studies that identified these chemokines as critical for lymphocyte recruitment to the CNS.6, 7
The elevation of CXCL13 was particularly striking in LGI1 AE, highlighting the dominant contribution of B-cell activity in this subtype. This observation is consistent with earlier work showing frequent CSF pleocytosis and oligoclonal bands in LGI1 encephalitis. 10
IL-6 emerged as a pivotal pro-inflammatory cytokine, strongly correlating with IL-13 and CXCL13. This suggests that IL-6-driven signalling may amplify both Th2-mediated cytokine production and B-cell chemoattraction, reinforcing its established role in autoimmune disorders. IL-13 elevation across all AE subtypes further highlights the Th2 skewing of immune responses, supporting its potential as a biomarker.9, 14–18
IL-7 and IL-21, both implicated in T-cell survival and helper functions, showed coordinated increases, suggesting a contributory role of T-cell-mediated immune mechanisms alongside established B-cell-driven pathology. Their correlation reinforces the concept that T-cell homeostasis and B-cell assistance are intertwined processes in AE. The negative correlation between IL-7 and CXCL13 suggests that distinct immune pathways may dominate in different AE subsets, reflecting the heterogeneity of immune activation. 9
Importantly, seronegative AE patients demonstrated cytokine and chemokine profiles similar to antibody-positive cases. This finding is clinically significant, as seronegative AE is often diagnostically challenging and is prone to delays in immunotherapy. The results suggest that cytokine profiling could serve as an adjunctive diagnostic tool in such cases, bridging the gap until antibody results are available.
Our results are consistent with prior reports by Jiang et al., 5 who demonstrated IL-21 and CXCL10 as promising markers of CNS inflammation, and by Leypoldt et al., 6 who emphasised CXCL13 as a potential biomarker of treatment response. Similarly, previous studies have shown elevations in IL-6 and IL-13 in anti-NMDAR encephalitis, highlighting their adjunctive diagnostic value.8, 9, 14
The lack of significant inter-subgroup differences (except for CXCL13 in LGI1 AE) suggests that AE shares common immunopathological mechanisms across antibody-defined entities. This convergence may explain why immunotherapies such as corticosteroids, plasma exchange and rituximab are effective across diverse AE subtypes; however, refractoriness to rituximab in some cases may reflect the persistence of long-lived plasma cells or antibody-independent immune mechanisms.
The strengths of this study include its prospective design, the inclusion of both antibody-positive and seronegative AE, and the use of a multiplex immunoassay, allowing simultaneous assessment of multiple cytokines from limited CSF volumes.
However, limitations must be acknowledged. The cross-sectional design, predominance of IIH in the control group, limited infectious encephalitis representation, small antibody-defined subgroups, lack of longitudinal outcome assessment, absence of sex-stratified analysis, and lack of correction for multiple testing should be considered when interpreting these findings. IIH patients were used as non-inflammatory controls due to the availability of CSF; however, they may not fully represent ideal neurological controls. The sample size was modest, particularly within subgroups such as LGI1 AE. Only one patient with viral encephalitis was included as a control, precluding robust comparisons between AE and infectious encephalitis. CXCL10 elevation reflects generalised neuroinflammation and may not reliably distinguish AE from infectious encephalitis, particularly given the limited representation of viral encephalitis in our control cohort. Paired serum cytokine measurements were not available in this study, precluding assessment of CSF–serum cytokine dynamics and compartmental immune responses. Additionally, the cross-sectional design does not allow evaluation of cytokine dynamics over the disease course or in response to treatment. The treatment status prior to CSF collection was also not uniform and may have influenced cytokine levels.
Early differentiation between AE and viral encephalitis is a clinical priority, as treatment strategies diverge dramatically. Our findings support the role of CSF cytokines—especially IL-6, IL-13, CXCL10 and CXCL13—as adjunctive immunological markers, providing supportive context rather than standalone diagnostic accuracy, particularly when antibody results are delayed or negative. Future multicentric studies should validate these findings in larger cohorts and explore whether cytokine levels correlate with prognosis or treatment response.
Conclusion
CSF cytokine profiling demonstrates that IL-6, IL-7, IL-13, IL-21, CXCL10 and CXCL13 are significantly elevated in AE patients compared with controls. The similarity of cytokine patterns between antibody-positive and seronegative AE supports their potential biomarker role across the disease spectrum. These markers could serve as rapid adjuncts to traditional antibody testing, aiding earlier recognition and treatment initiation.
Footnotes
Acknowledgements
The authors acknowledge Dr Ajay Garg and Dr Biswamohan Misra for their valuable contribution in the diagnosis and management of the patient.
Authors’ Contribution
AS: Acquisition and analysis of data, writing a manuscript.
RKS: Acquisition and interpretation of data, writing a manuscript.
JB: Interpretation of data and writing of results.
EA: Writing and revision of manuscript.
AD: Study design and data acquisition, writing a manuscript.
BR: Data acquisition, writing a manuscript.
JP: Drafted the manuscript and data acquisition.
AKP: Data acquisition, writing the discussion section of the manuscript.
VVY: Critically reviewed the manuscript and revision.
DV: Critically reviewed the manuscript and revision.
SC: Study design and interpretation of data.
MVPS: Study design, acquisition of data and writing of manuscript.
MT: Critically reviewed the manuscript and revision.
Data Availability Statement
The data supporting the findings of this study are available from the corresponding author upon reasonable request. Due to institutional policy and patient confidentiality, the data are not publicly available.
Declaration of Conflict of Interests
The authors declared no potential conflicts of interest with respect to the research, authorship and/or publication of this article.
Funding
The authors disclosed receipt of the following financial support for the research, authorship, and/or publication of this article: This work was supported by the AIIMS intramural research grant (Project Code Grant No. A 816).
Statement of Ethics and Patient Consent
The authors certify that ethical clearance and appropriate patient consent were obtained.