Abstract
Faced with considerable losses and increased pressure to generate alternative sources of funding, Union Railways (UR) twice attempted to auction ad spots at their flagship trains and stations. On both the occasions, the market responded with substantially lower bids than management’s expectation. Surprised by the lackluster response, the management decided to conduct a detailed analysis of the ad spot market and engaged a team of advisers. They were tasked to help UR decide the base price for different types of ad spots (e.g. billboards, window skins, bogie door skins) and to recommend whether the ad spots be sold to either one or multiple intermediaries. Equipped with data (e.g. prevalent market rates and industry best practices) from multiple sources, the advisors faced the daunting task of designing a simple pricing mechanism that can work for multiple types of ad spots.
Uzair Khan, Deputy Commercial Manager at Union Railways (UR), entered the room with a worried look and greeted the project advisors who were enjoying their sandwiches in a relaxed atmosphere. It was 1 July 2014 and the advisors for the sale of advertising spot rights at UR assets (i.e., major stations and trains) were meeting Uzair to deliberate on reserve price mechanism for the upcoming third auction. During the previous two attempts, no direction on reserve price was given to the market, and this resulted in unacceptably low quotes from the bidders. It was then decided that a member of UR commercial team along with designated project advisors would work to estimate reserve prices for the ad spots in order to solicit reasonable quotes from the market.
After exchanging pleasantries, the room atmosphere turned serious as Uzair put forward the agenda for the meeting: How to devise reserve prices for UR assets such that it took into account differences in ad spots (e.g., 1,200 sq. ft billboard in front of the train station or 600 sq. ft at the reception, or the exterior of the bogie (also known as railcar, railway wagon, railway carriage) entrance door (7' × 3'), or interior windows (2' × 2') of a bogie in a train)? Should they put all the ad spots of a train station on auction for a single bidder or should they bundle them? For bundling, should they include all the ad spots in a zone (e.g., reception area or AC bogie) or should it be a combo with ad spots from different zones, for example, one at the reception, one at platform 1, one in the AC bogie, one in economy class, etc.
Brief History of Union Railways
It was the British who first established a railway network in the country, Nepa. In 1847, Sir H Edgware (Commissioner), while conducting a survey for Korum seaport, proposed constructing a rail network connecting the southern seaport with the rest of the country. At the time of the Partition, Nepa inherited a majority of the railway structure of the two companies that operated in its demarcated territory, that is, Nine-Western and Ceylon-Asset. Initially, the operations were managed under a subdivision of Ministry of Communications, but then in 1974 a separate Ministry of Railways was established under the Federal Government of Nepa.
The earliest reported statistics (i.e., those of 1950–1955) showed that at inception, UR transported 78.9 million passengers/annum (UN Nepa population estimate of 1955: 41.1 million people) and carried 9.2 million tons of freight/annum. It earned 37.6 per cent of its revenues from passenger train journeys and 53.5 per cent of revenues from freight train journeys. Railway operations experienced growth till the 1970s, but the growth trajectory halted in the 1980s, and since then the organization had continuously been struggling to restore its operational excellence of yesteryears. In financial year (FY) 2012–2013, UR recorded the lowest operational output in its history, both for passenger and freight business. During the year, UR transported 41.9 million passengers (UN Nepa population estimate of 2011: 173.6 million people) and carried nearly 1.01 million tonnes of freight. The revenue mix had also swung strongly in favour of the unprofitable passenger train business such that it contributed 74.9 per cent to revenues and freight trains contributed 11 per cent only.
While struggling to control the rising costs of the organization, the newly elected Minister for Railways was eager to create new sources of revenue. A potential idea was to utilize spaces at major stations and trains, and convert them into profitable out
Out-of-Home (OOH) in Practice
In FY 2012–2013, OOH was the third most preferred advertising medium for advertisers after TV and print. An advantage of OOH advertising was that while other media (TV, print, Internet and radio) advertising heavily depended on consumers’ media consumption habits, OOH advertising engaged consumers while they were outdoors for daily activities. OOH activities included advertising on billboards (static, digital, mobile), posters, bus/taxi flexes, kiosks, street advertising, etc. A myriad of OOH outlets and spots were available in the market; therefore, large organizations (e.g., MNCs, established local brands) normally hired intermediaries, commonly referred to as ‘agencies’ to purchase ad spots on their behalf for their outdoor campaigns. 2 These agencies primarily reduced hassle for their clients (brand managers) by reducing complexity in media buying that involved selection between multiple mediums (e.g., TV vs print vs OOH), multiple outlets within each medium (e.g., site vendors 3 ‘A’ or ‘B’ for OOH; Millennium or City News) and multiple spots within each outlet (e.g., billboards owned by site vendor A at two different traffic signals on the same road; Millennium TV ad spot in the 8 p.m. programme or the 9.30 p.m. programme).
Ad Spot Buying Process
In a typical scenario, a brand manager appointed an agency to run their nationwide OOH campaign and conducted a campaign briefing session to cover details of the product, target market (demographics), prescribed budget and campaign starting dates. After the briefing session, the agency developed an OOH media plan (containing various sites of single/different vendors along with their negotiated rates, locations, sizes, etc.) and shared it with the client. After analysing and/or revising, the client gave formal approval to start the campaign on a prescribed date. This was followed by the agency working on printing the skin (flex to be displayed on board) and ensuring timely delivery to site vendors. When the campaign was launched, the agency collected visuals on a daily basis and eventually shared these with the client in the form of a report. Thus, by engaging agencies, brand managers significantly simplified their media buying and execution as they did not need to deal with vendors, negotiate rates, lock sites, provide skins (material on which the ad was printed) for display and sort out execution and payment issues related to multiple vendors.
For attractive spots, agencies participated in auctions to lease the spot on an annual basis from site owners. For such self-leased spots, agencies typically claimed to charge between 15 per cent and 25 per cent profit margin. However, most spot purchases involved multiple intermediaries, for example, the client (brand manager) bought an advertising spot from an agency, who in turn bought it from site vendor holding annual lease of the spot from the site owner (i.e., site owners to site vendor to agency to client). In such cases, agencies charged commission in the range of 3 per cent–10 per cent. Normally, hundreds of site vendors marketed their billboards to agencies and sometimes to clients directly for display. These vendors developed PowerPoint (PPTs) slides with actual visuals of the sites, details (size, location, traffic count, target market A/B/C along with the monthly/annual display rates) and then circulated them through emails on weekly basis to the targeted agencies/clients or even other vendors.
Few companies in the transportation sector had used their site locations to their advantage and had developed OOH ad spots at their sites. These companies, as site owners, either auctioned off multi-year lease to site vendors or sold it directly to end consumers (i.e., brand managers, agencies). Swift Express and National Aviation Authority (NAA) were two such organizations which had successfully executed OOH advertising projects and now served as active competitors to other OOH media outlets.
Swift Express
Swift Express, which started its operations in 1999, was the biggest transport service company in Nepa. Its high standard buses, courteous staff and punctuality gave it a strong competitive advantage over others. The primary operation of the company was to provide intercity connectivity to passengers across Nepa. In addition, it also operated an intracity bus service in Rajpur and Swift cab service to facilitate pick and drop of passengers to/from their terminals.
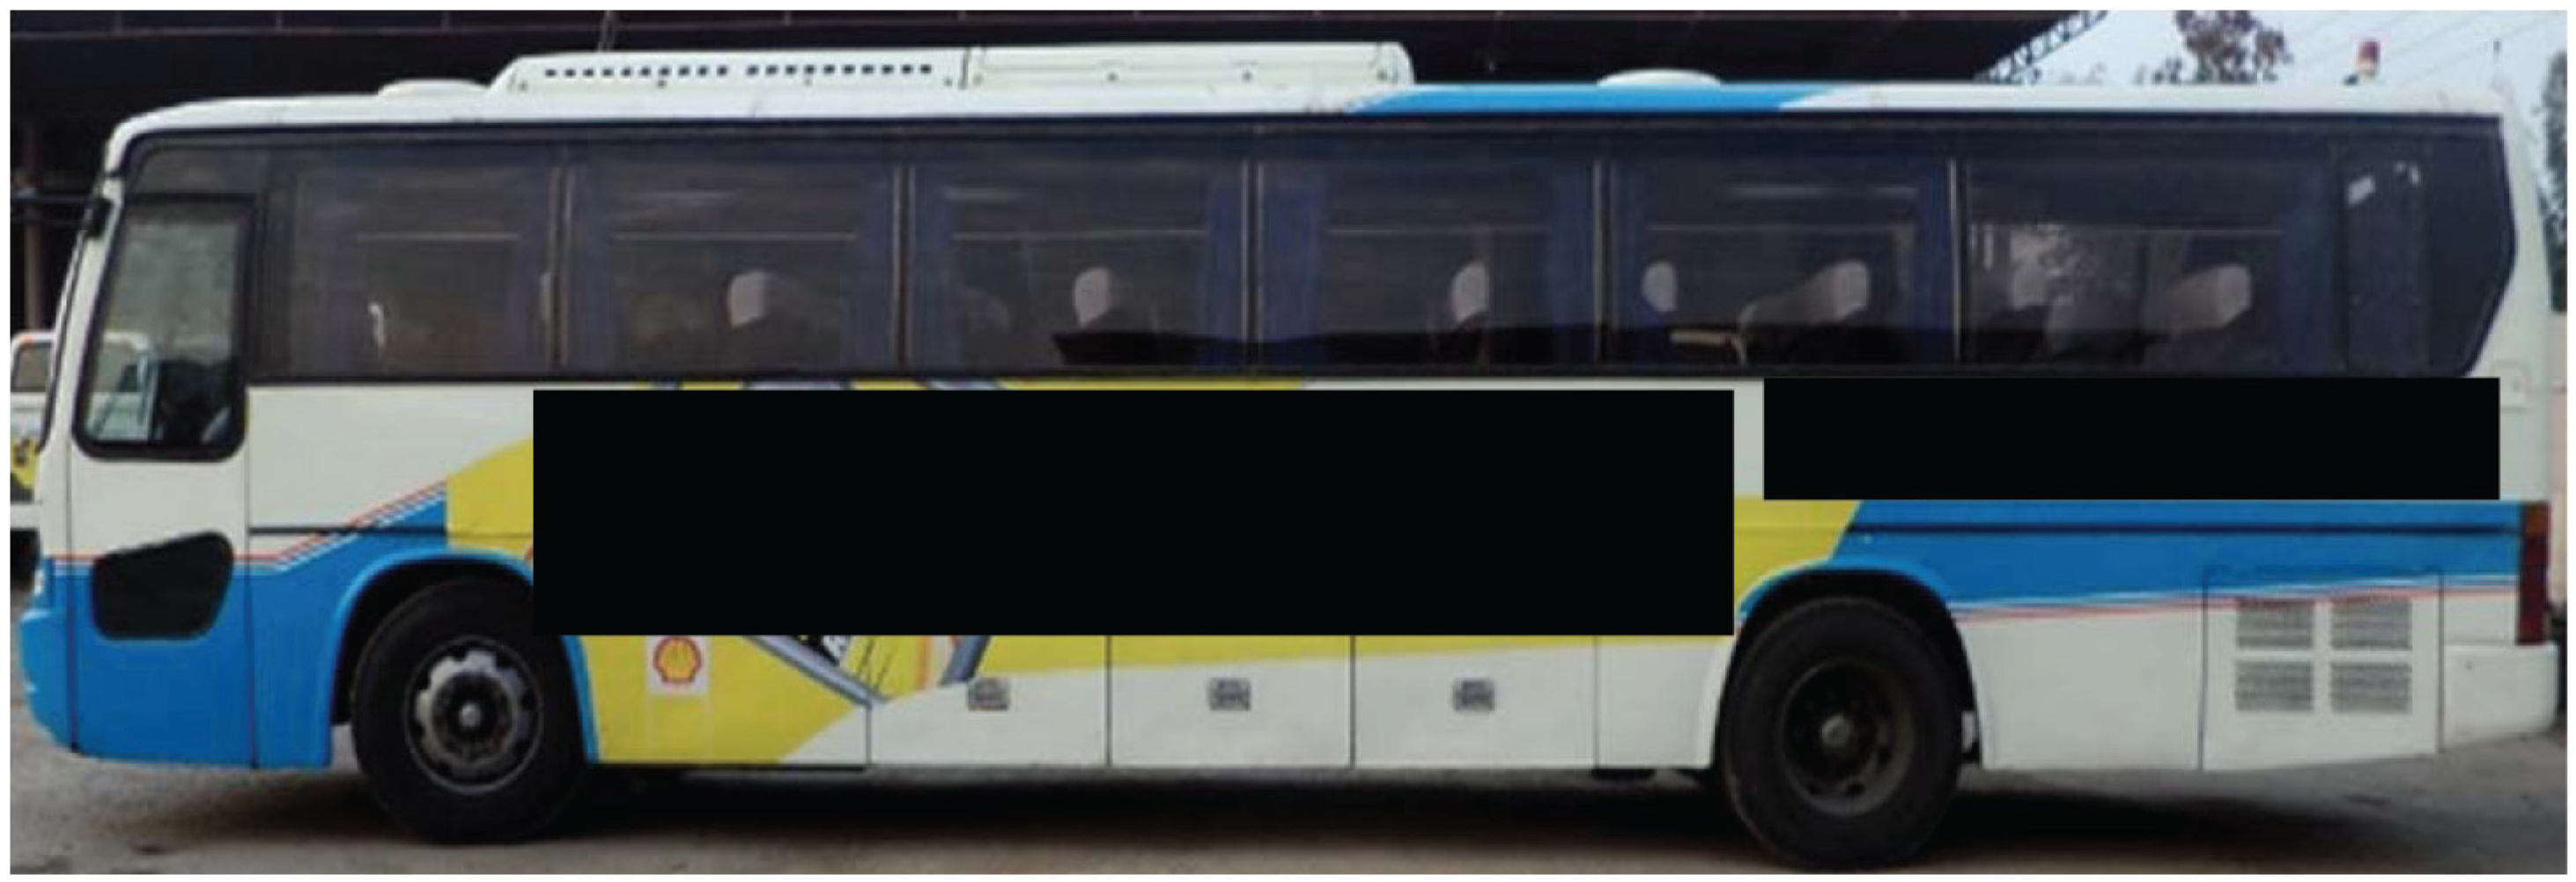
In 2012, a new marketing director, Mr Sheriar Haris, was hired to streamline marketing activities of the company and evaluate possible opportunities to generate incremental revenue. Sheriar and his team decided to create advertising spots at their terminals and on their buses (Exhibits 1A and 1B) to generate revenue by letting brands advertise on them. It was expected that such opportunities would attract advertisers because being the most reputed intercity transport service, Swift Express had a substantial total footfall of nearly six million passengers per annum across its 50 terminals all over Nepa where passengers from different age groups and income levels boarded the bus service on a regular basis. 4
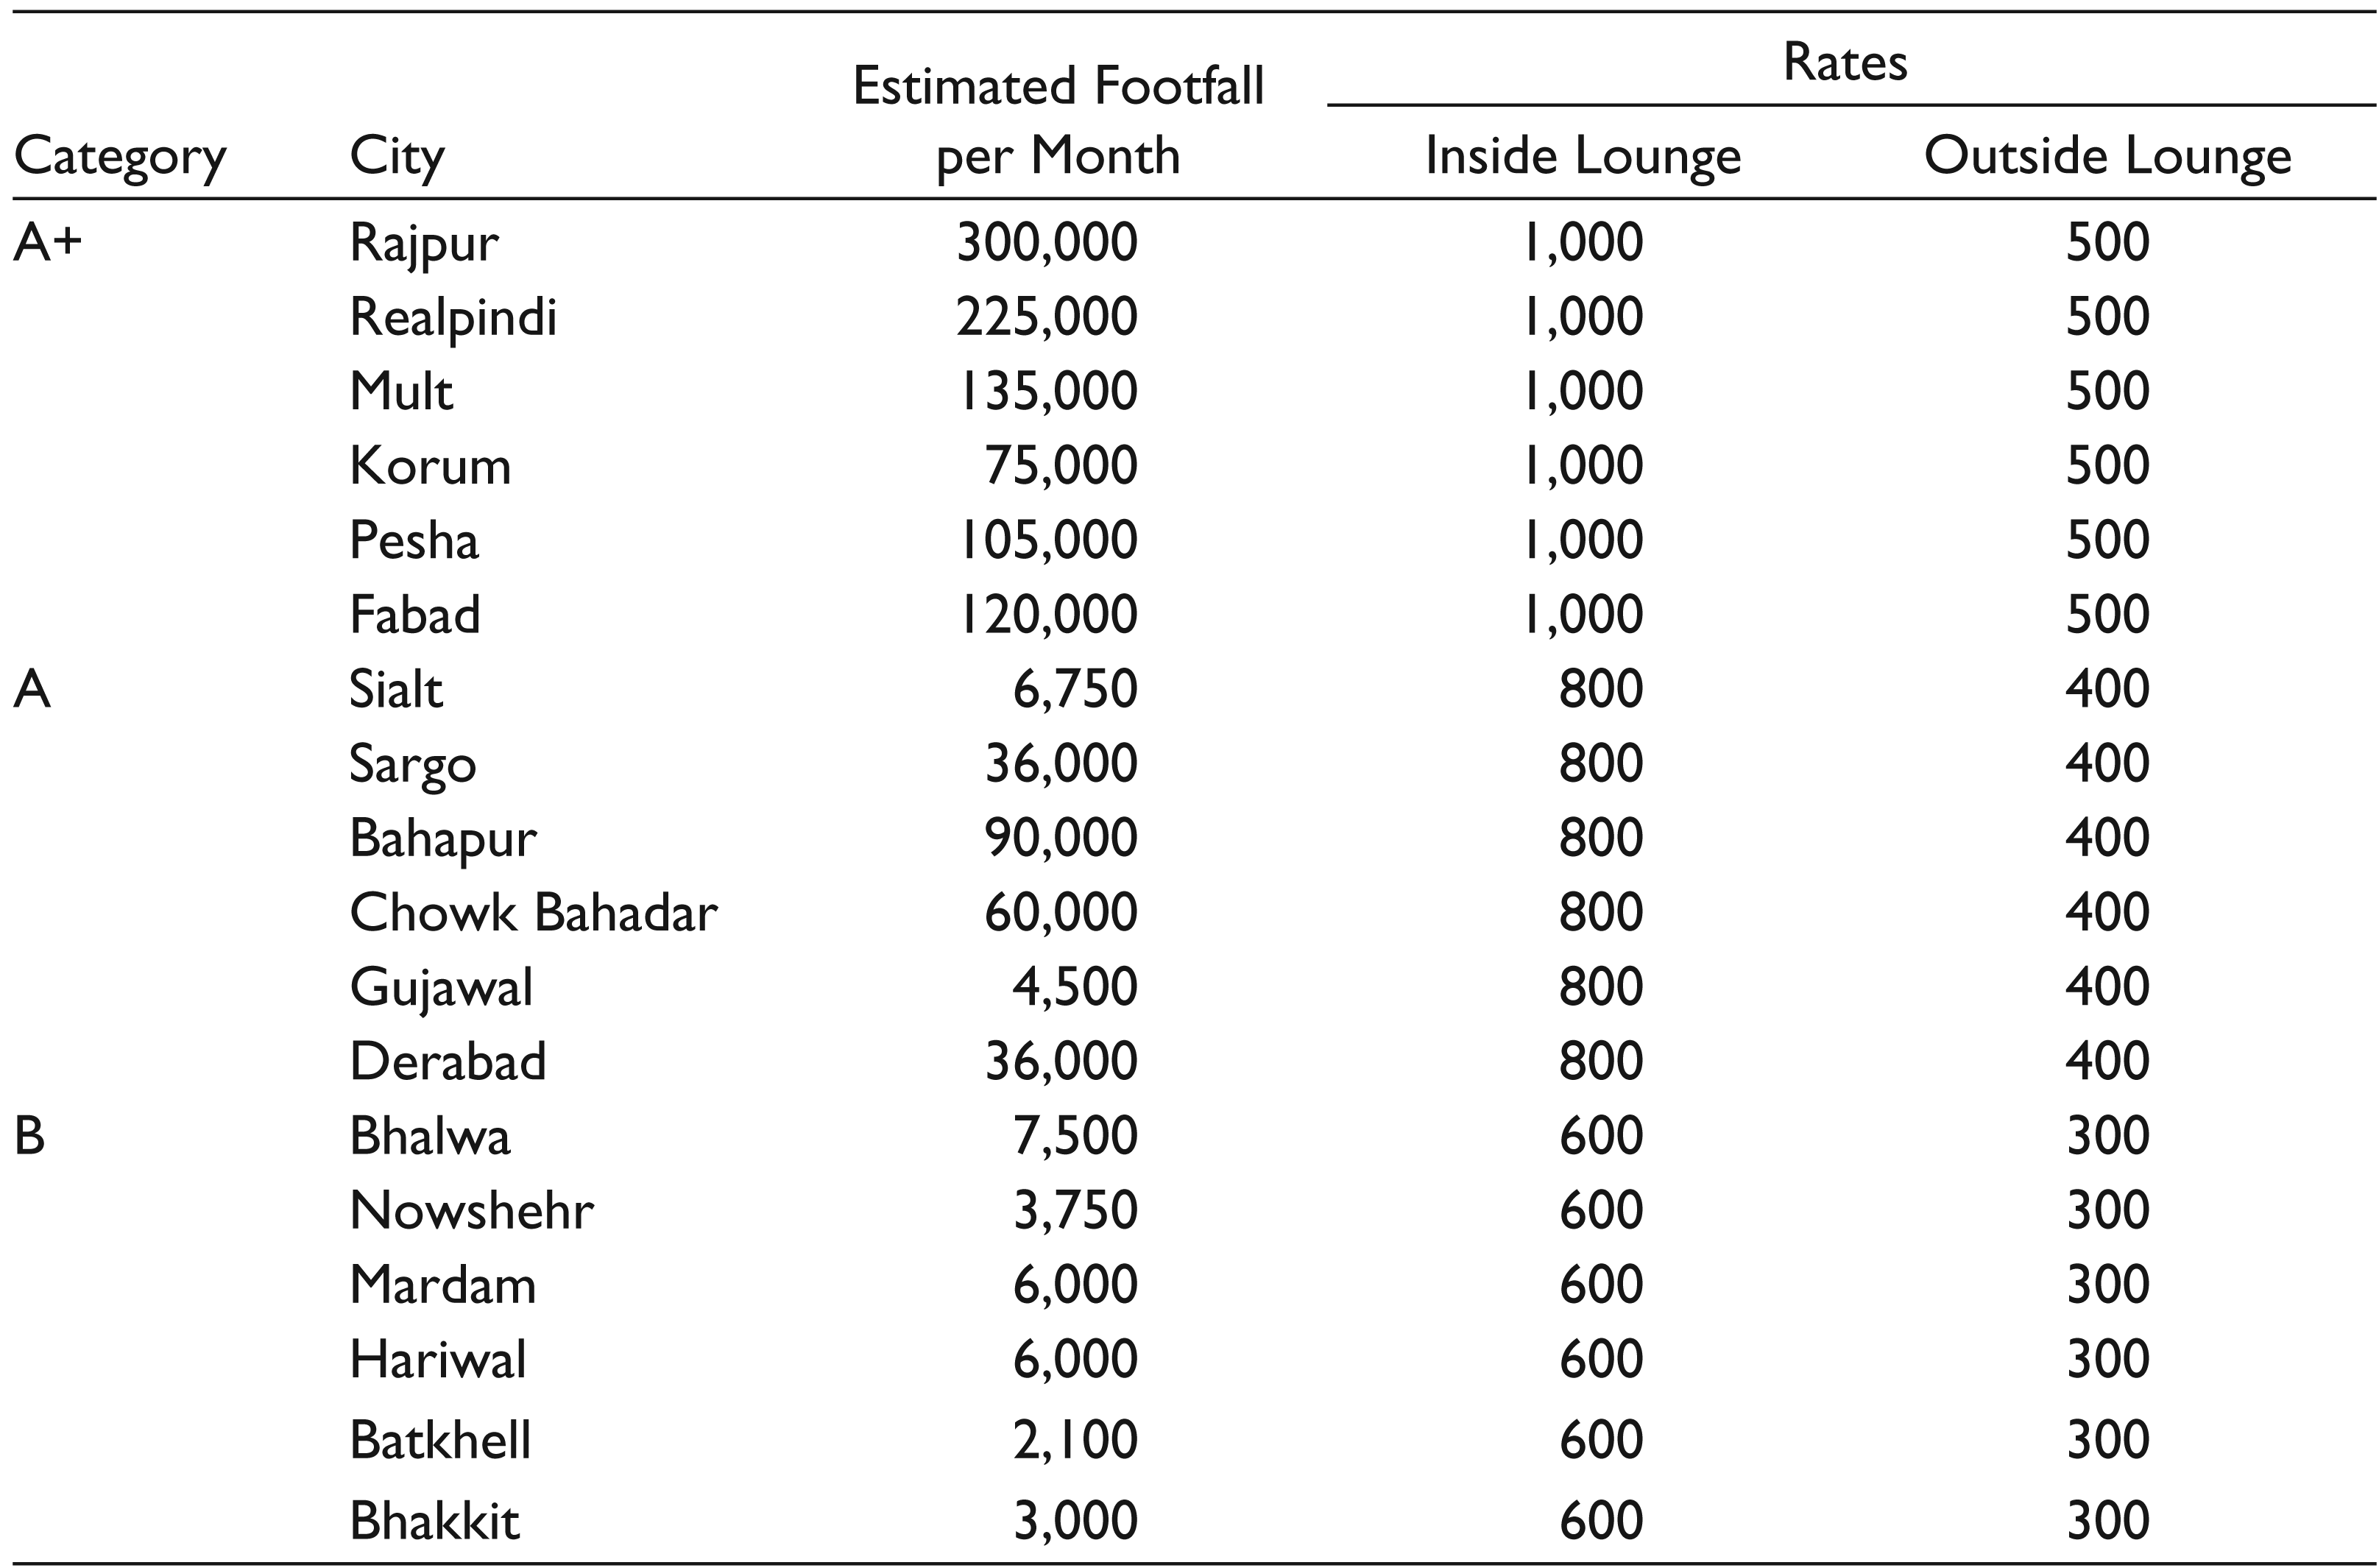
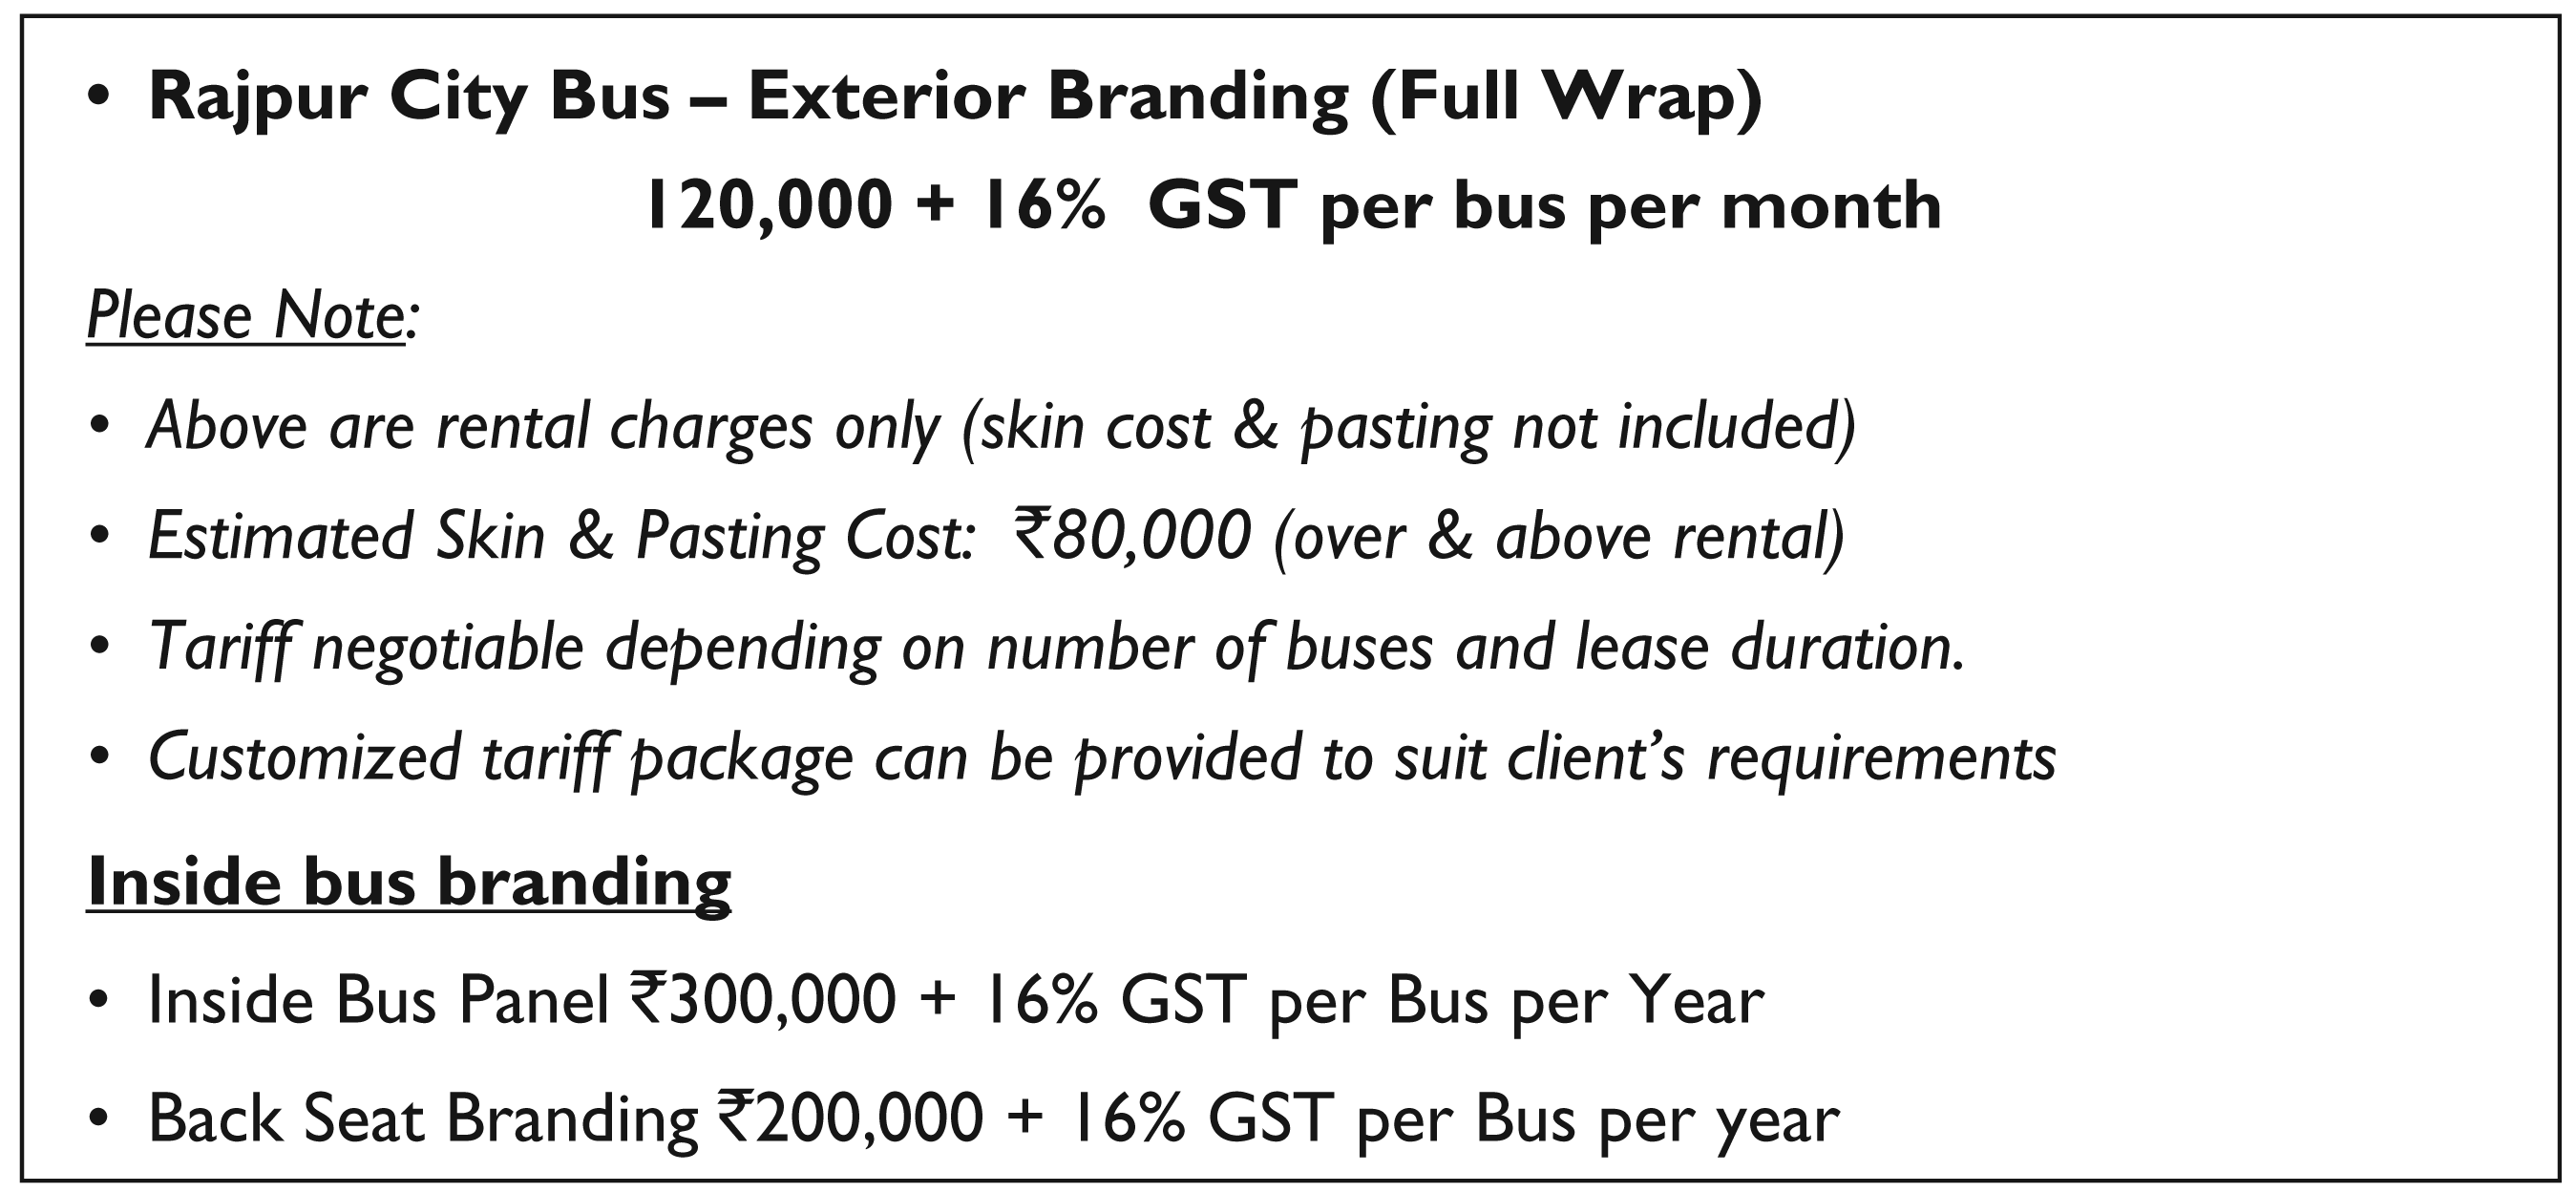
To set prices for different ad spots, the team first divided their stations into three categories based on the monthly footfall at these sites (Exhibit 2). Subsequently, through discussions with a designated media agency for the sale of these ad spots, they estimated prices depending on their understanding of the prevalent market rates in outdoor advertising. While setting the prices, they considered passenger footfall and spot location (e.g., inside the terminal was twice as expensive as outdoors). As for their bus operations, both inter and intracity, they applied a uniform fixed rate (Exhibits 3A and 3B). To sell its ad spots, Swift used a dual channel. For brands with which Swift enjoyed a strategic partnership, it sold the spots directly to them on monthly basis, and for all other clients it used a designated media agency on a commission basis.
National Aviation Authority (NAA)
NAA, Nepa, was a government-owned regulatory authority responsible for all civil aviation activities of the country. It owned and operated all airports (except the privately owned Torangi airport) and aerodromes. Zartash International Airport Korum, the largest international and domestic airport of Nepa, served as its head office. In 2014–2015, it looked after air traffic activities of almost fifteen airlines operating in Nepa, of which four were local, that is, Oceatic Airways, Air Sky, Air Nepa and Hummingbird Air.
At NAA, the OOH initiative was propelled by the fact that placing ads at airports provided a significant source of revenue to national aviation authorities all over the world. During FY 2002–2003, NAA had worked to auction advertising rights at the Falad International Airport, Rajpur.
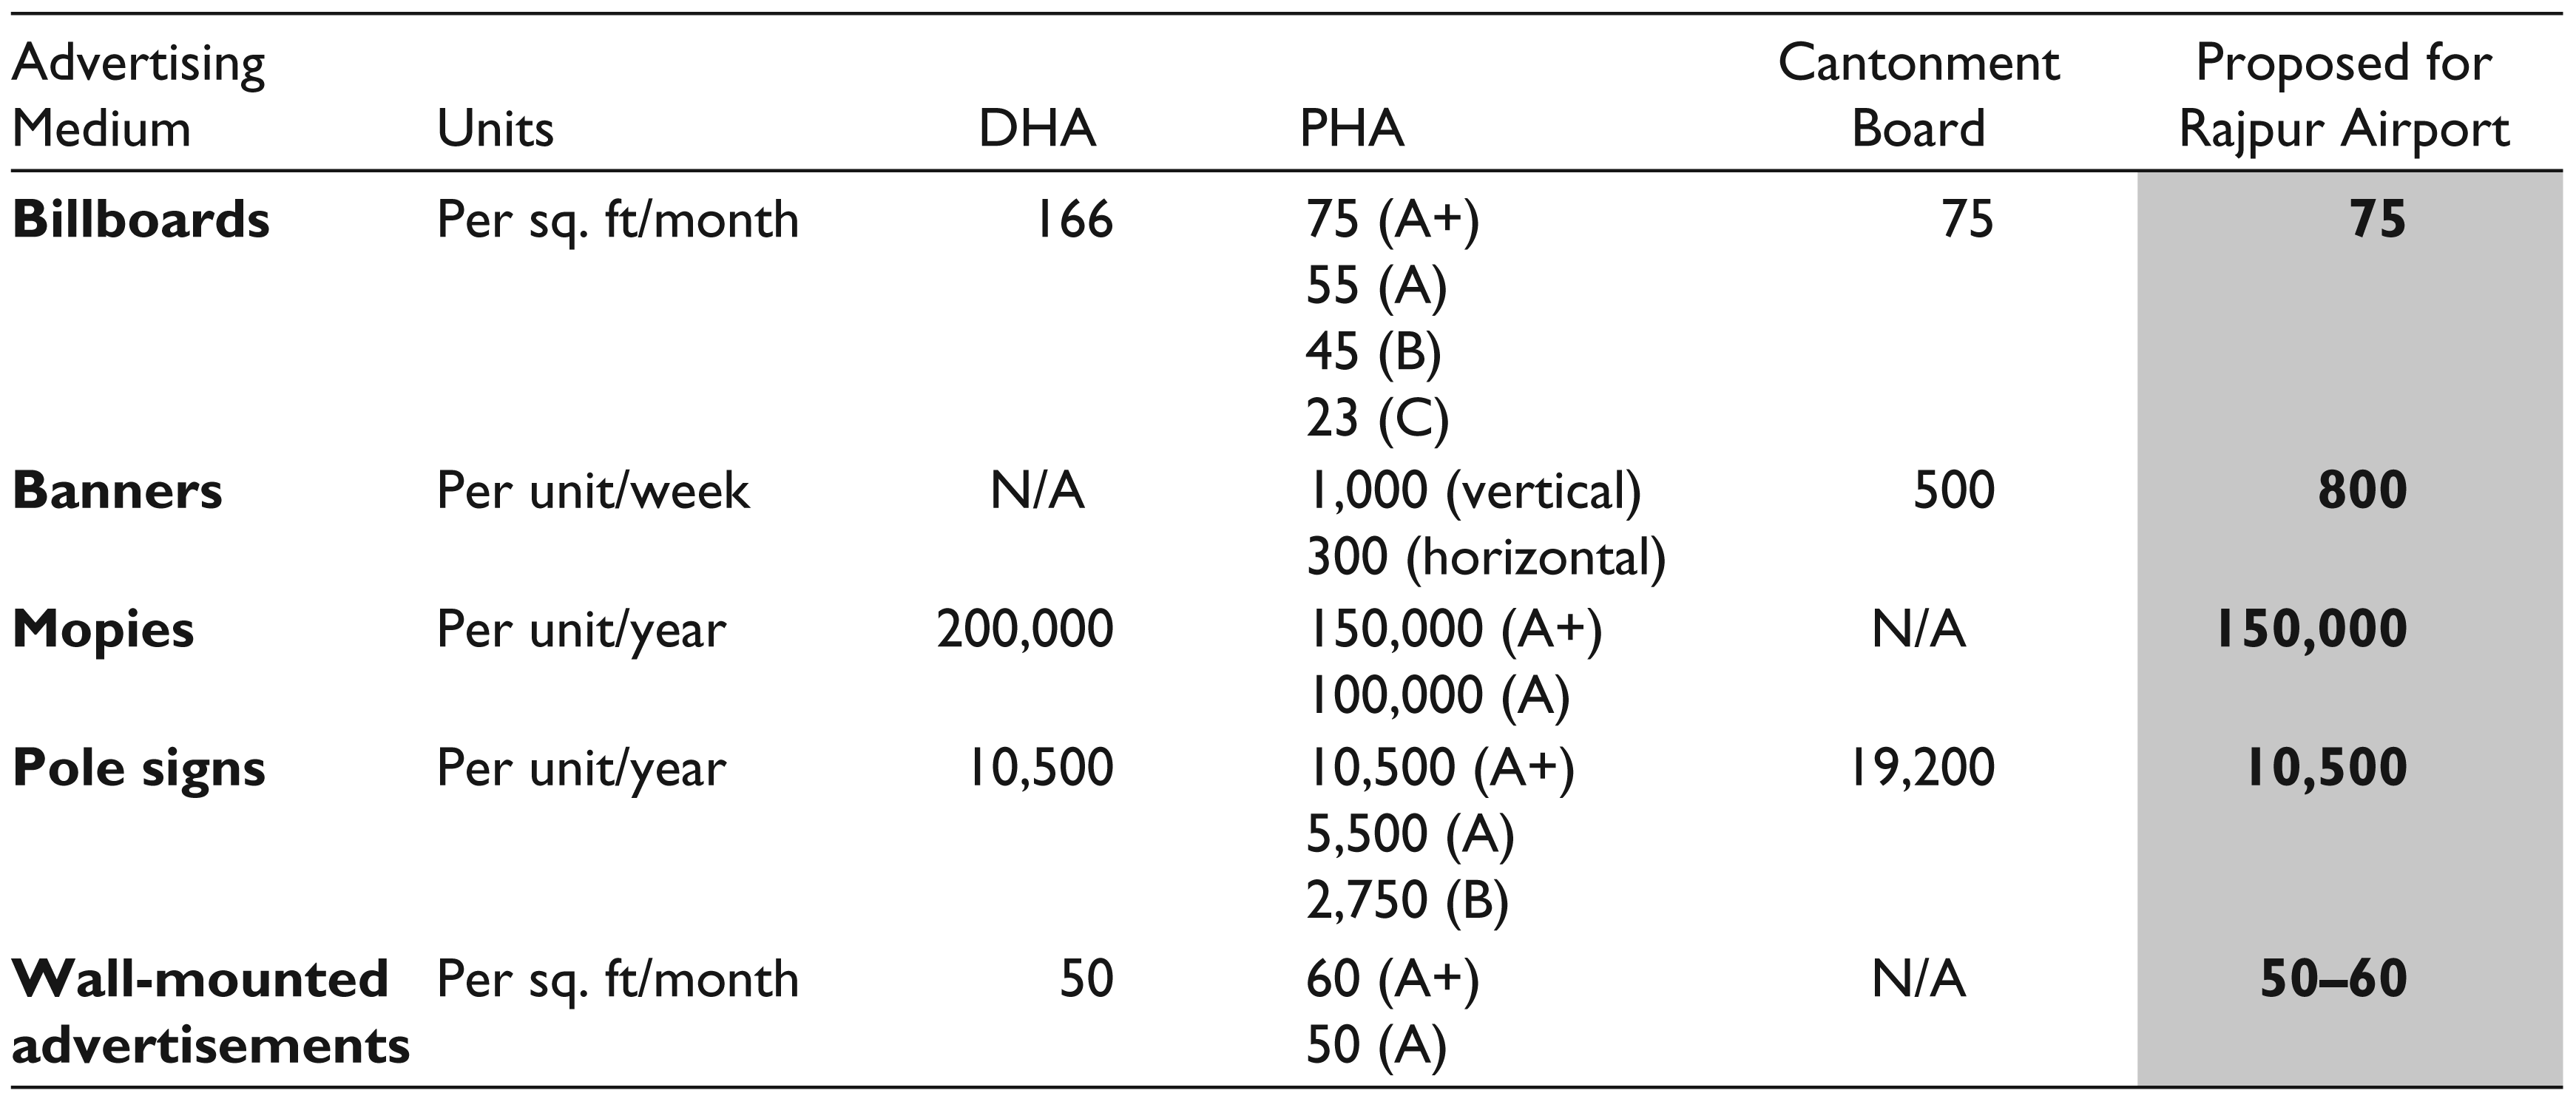
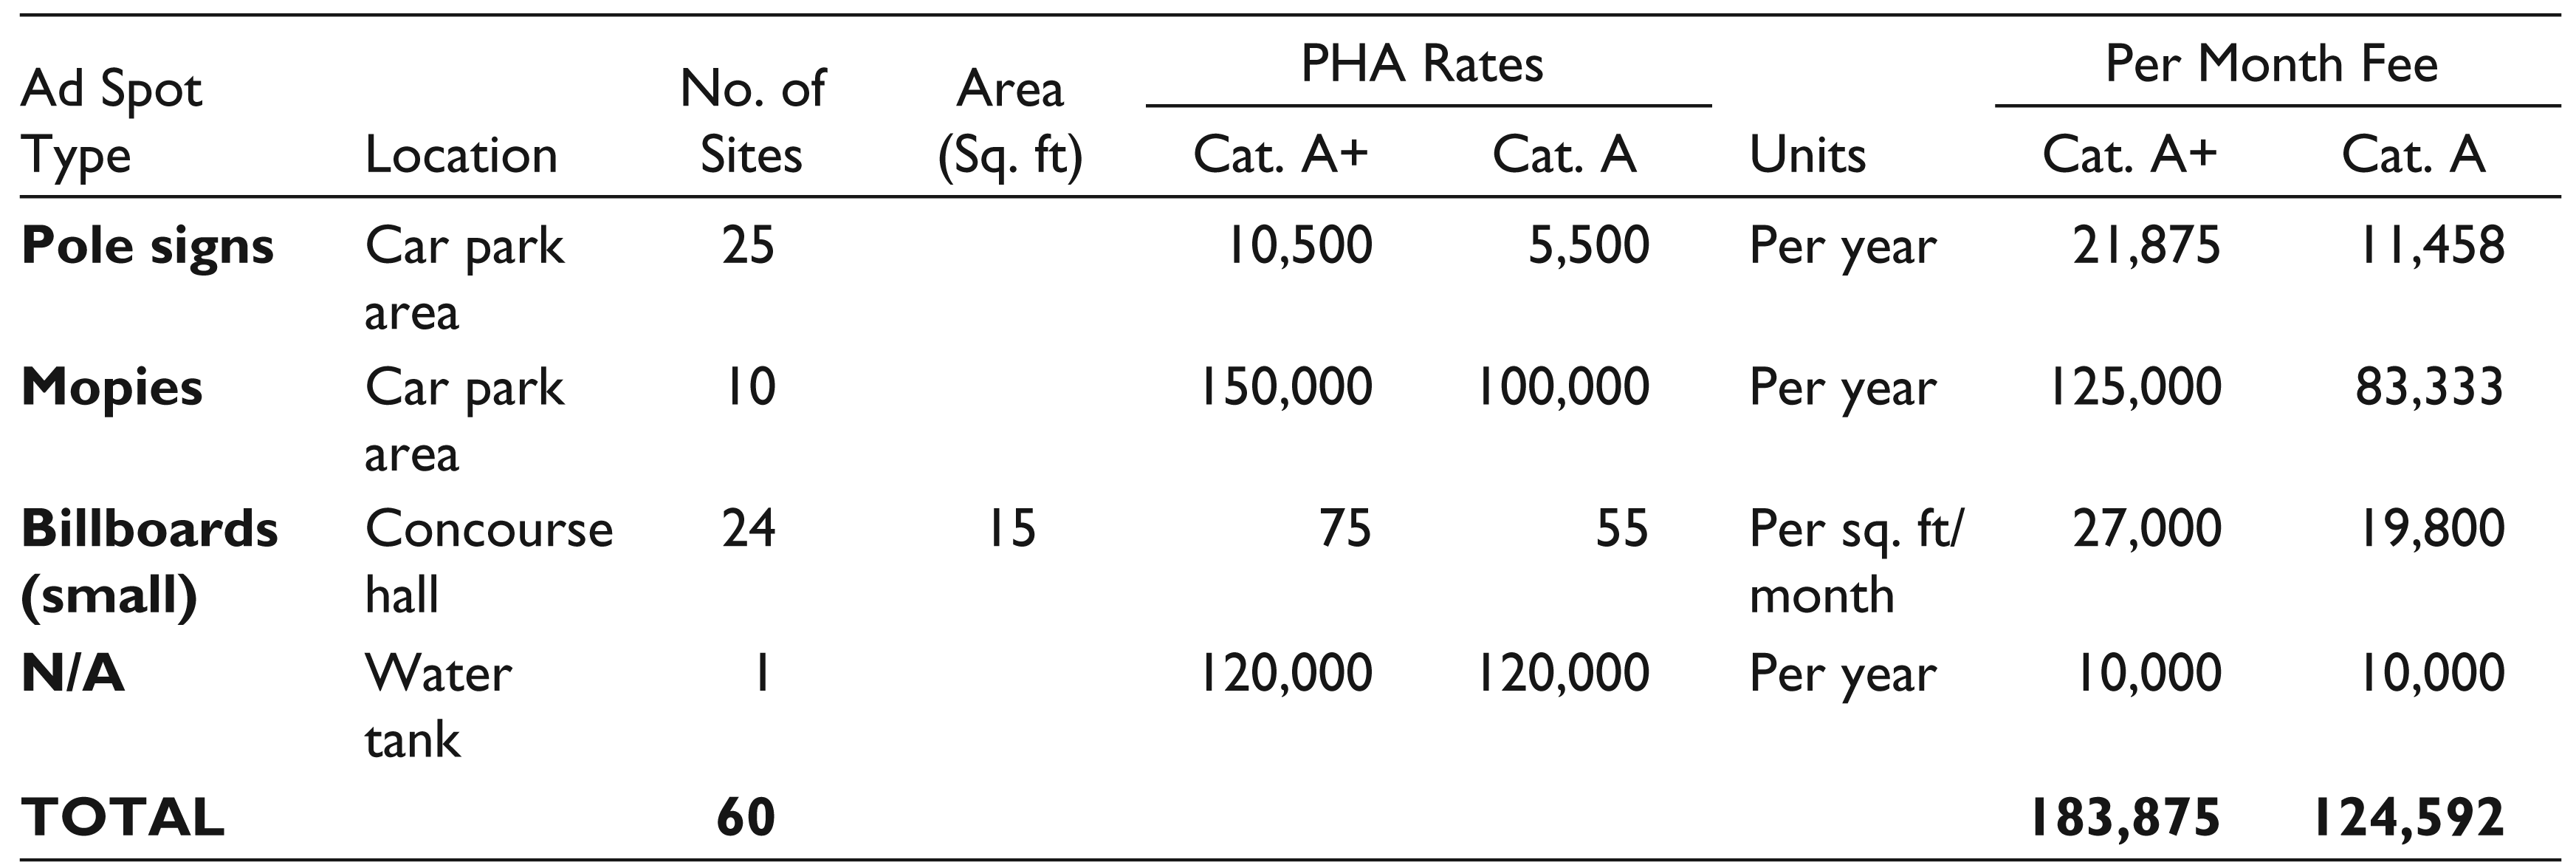
The planning process was executed in two phases. In the first phase, NAA developed ad spots at the airport by identifying attractive locations (based on traffic flow and vantage) and the most suitable advertisement type (billboards, mopies, wall-mounted advertisements, pole signs, trolleys, avio bridges) for these spots. In the second phase, they estimated prices for these ad spots by benchmarking them with rental prices of other local authorities such as Decent Housing Authority (DHA) and Parks and Horticulture Association (PHA). NAA estimated ad spot prices with the highest rental spot rate (usually in high SEC A traffic locations) of DHA and PHA because airports attracted high SEC class passengers; therefore, airport ad spot rates should be at par with high SEC locality rates in the city (Exhibit 4). In order to encourage wider market participation for their multi-year annual auctions and to diversify default risk, different spots were grouped to make multiple bundles, for example, bundle 1: spots in the international lounge; bundle 2: spots in the domestic lounge; bundle 3: car parking area, etc., so that they could be auctioned off to multiple site vendors. During the first round, most of these bundles were auctioned off; a few that did not attract bids were then revised with lower rental prices and subsequently auctioned off in the second round. For example, car parking area bundle did not receive attractive bids at the highest rental calculations; subsequently, the bundle price was calculated with second-tier pricing rentals, and then it was successfully auctioned off (Exhibits 5A and 5B).
Parks and Horticulture Association (PHA)
In the public sector, PHA Rajpur regulated advertising in areas covered under City District Government (CDG) Rajpur, such as Rajpur railway station. Established in 1998, PHA was responsible for maintaining the green belts of Rajpur and regulating the installation of billboards, sky signs and outdoor advertisements on public and private property. For any OOH ad spot that had public exposure from the roads and green belts under the jurisdiction of CDG, permission had to be first sought from PHA. This was usually granted once the relevant dues were paid (see Exhibit 6). However, no such permission was required for ad spot placed inside private property, as no mass public exposure would be generated in such a case.
Outdoor Ad Rating and the UR Project
Historically, it had been seen that expenditure on media was undertaken without detailed deliberation on the ad spot. Businesses aimed for a strategy based on ‘perceived maximum value for the best price’. It was witnessed that some OOH spots were over-purchased, while other seemingly valuable spots received lacklustre response. This had created substantial price variations. To check this unsystematic pricing, Nepa Advertisers Society (NAS) decided to introduce an outdoor rating scale. Through a bidding process which involved six agencies (NOVE, IPS, Marketics, OAO, Oasis Kraft, Odit), NOVE, a consortium of four specialised firms (Informate, Digital Go, Telno and TNA) was selected for the task.
Initially, the NOVE consortium had planned to focus on Korum, Rajpur, Nizamabad and Realpindi as these cities accounted for 75 per cent of the total investment in OOH advertising. The measurement scale for the ratings involved four factors: traffic count, travel survey, site classification and visibility adjustment. Traffic count measured the number of passengers and vehicles using a certain route, provided by satellite imagery and cameras installed by NOVE at traffic junctures across the cities. Travel survey was based on personal interviews determining the profile of traffic. Each billboard in these cities was profiled according to owners and geographical position, which was shown by the factor of ‘site classification’. Location factors including visibility of billboard and distance from a vantage point comprised the variable ‘visibility adjustment’. Finally, values for all four factors were entered into a software, that is, Quantum, to obtain composite rating for a billboard. However, the project was expected to be operational by 2015 and NOVE ratings were not yet available for benchmarking.
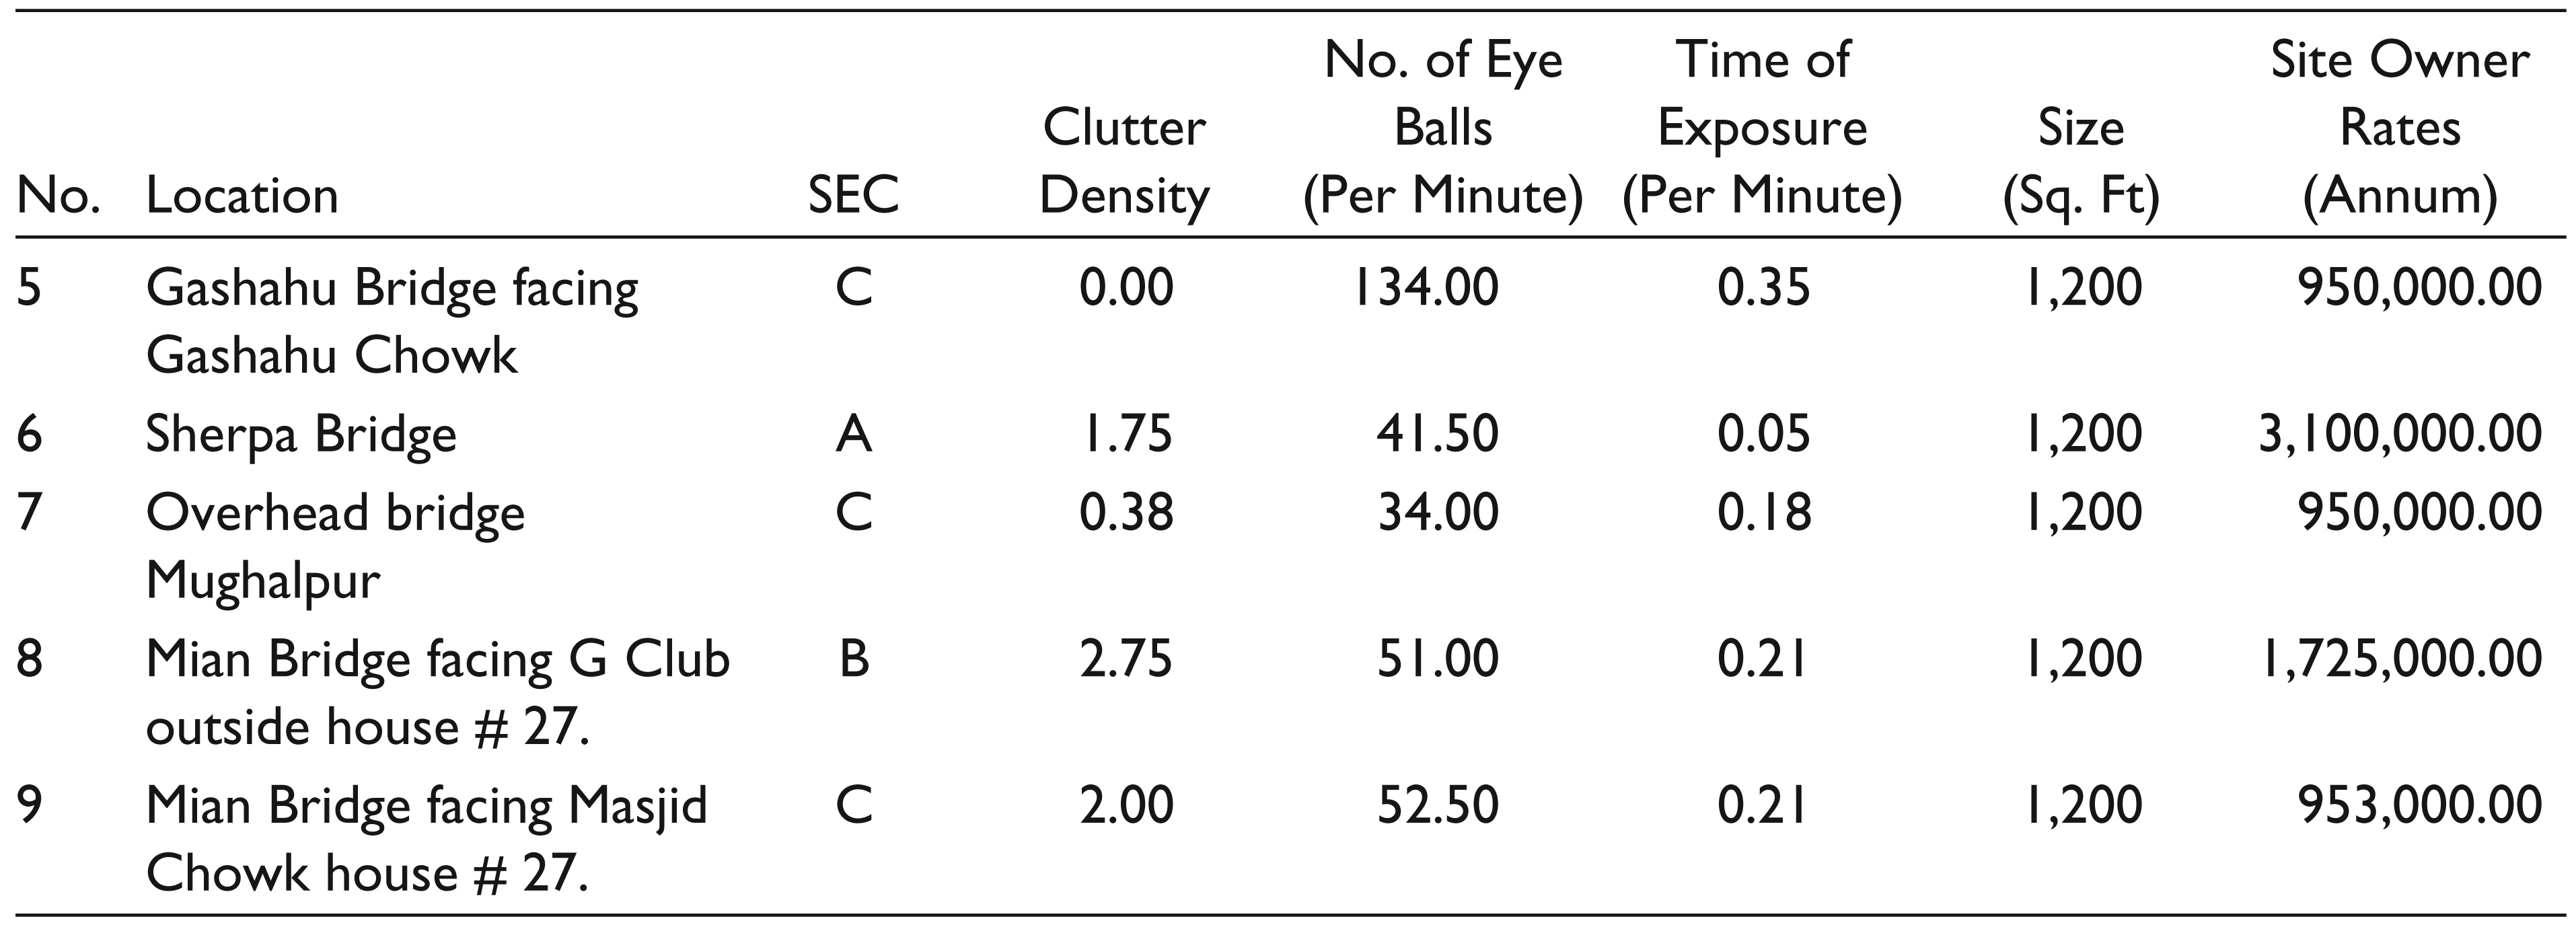
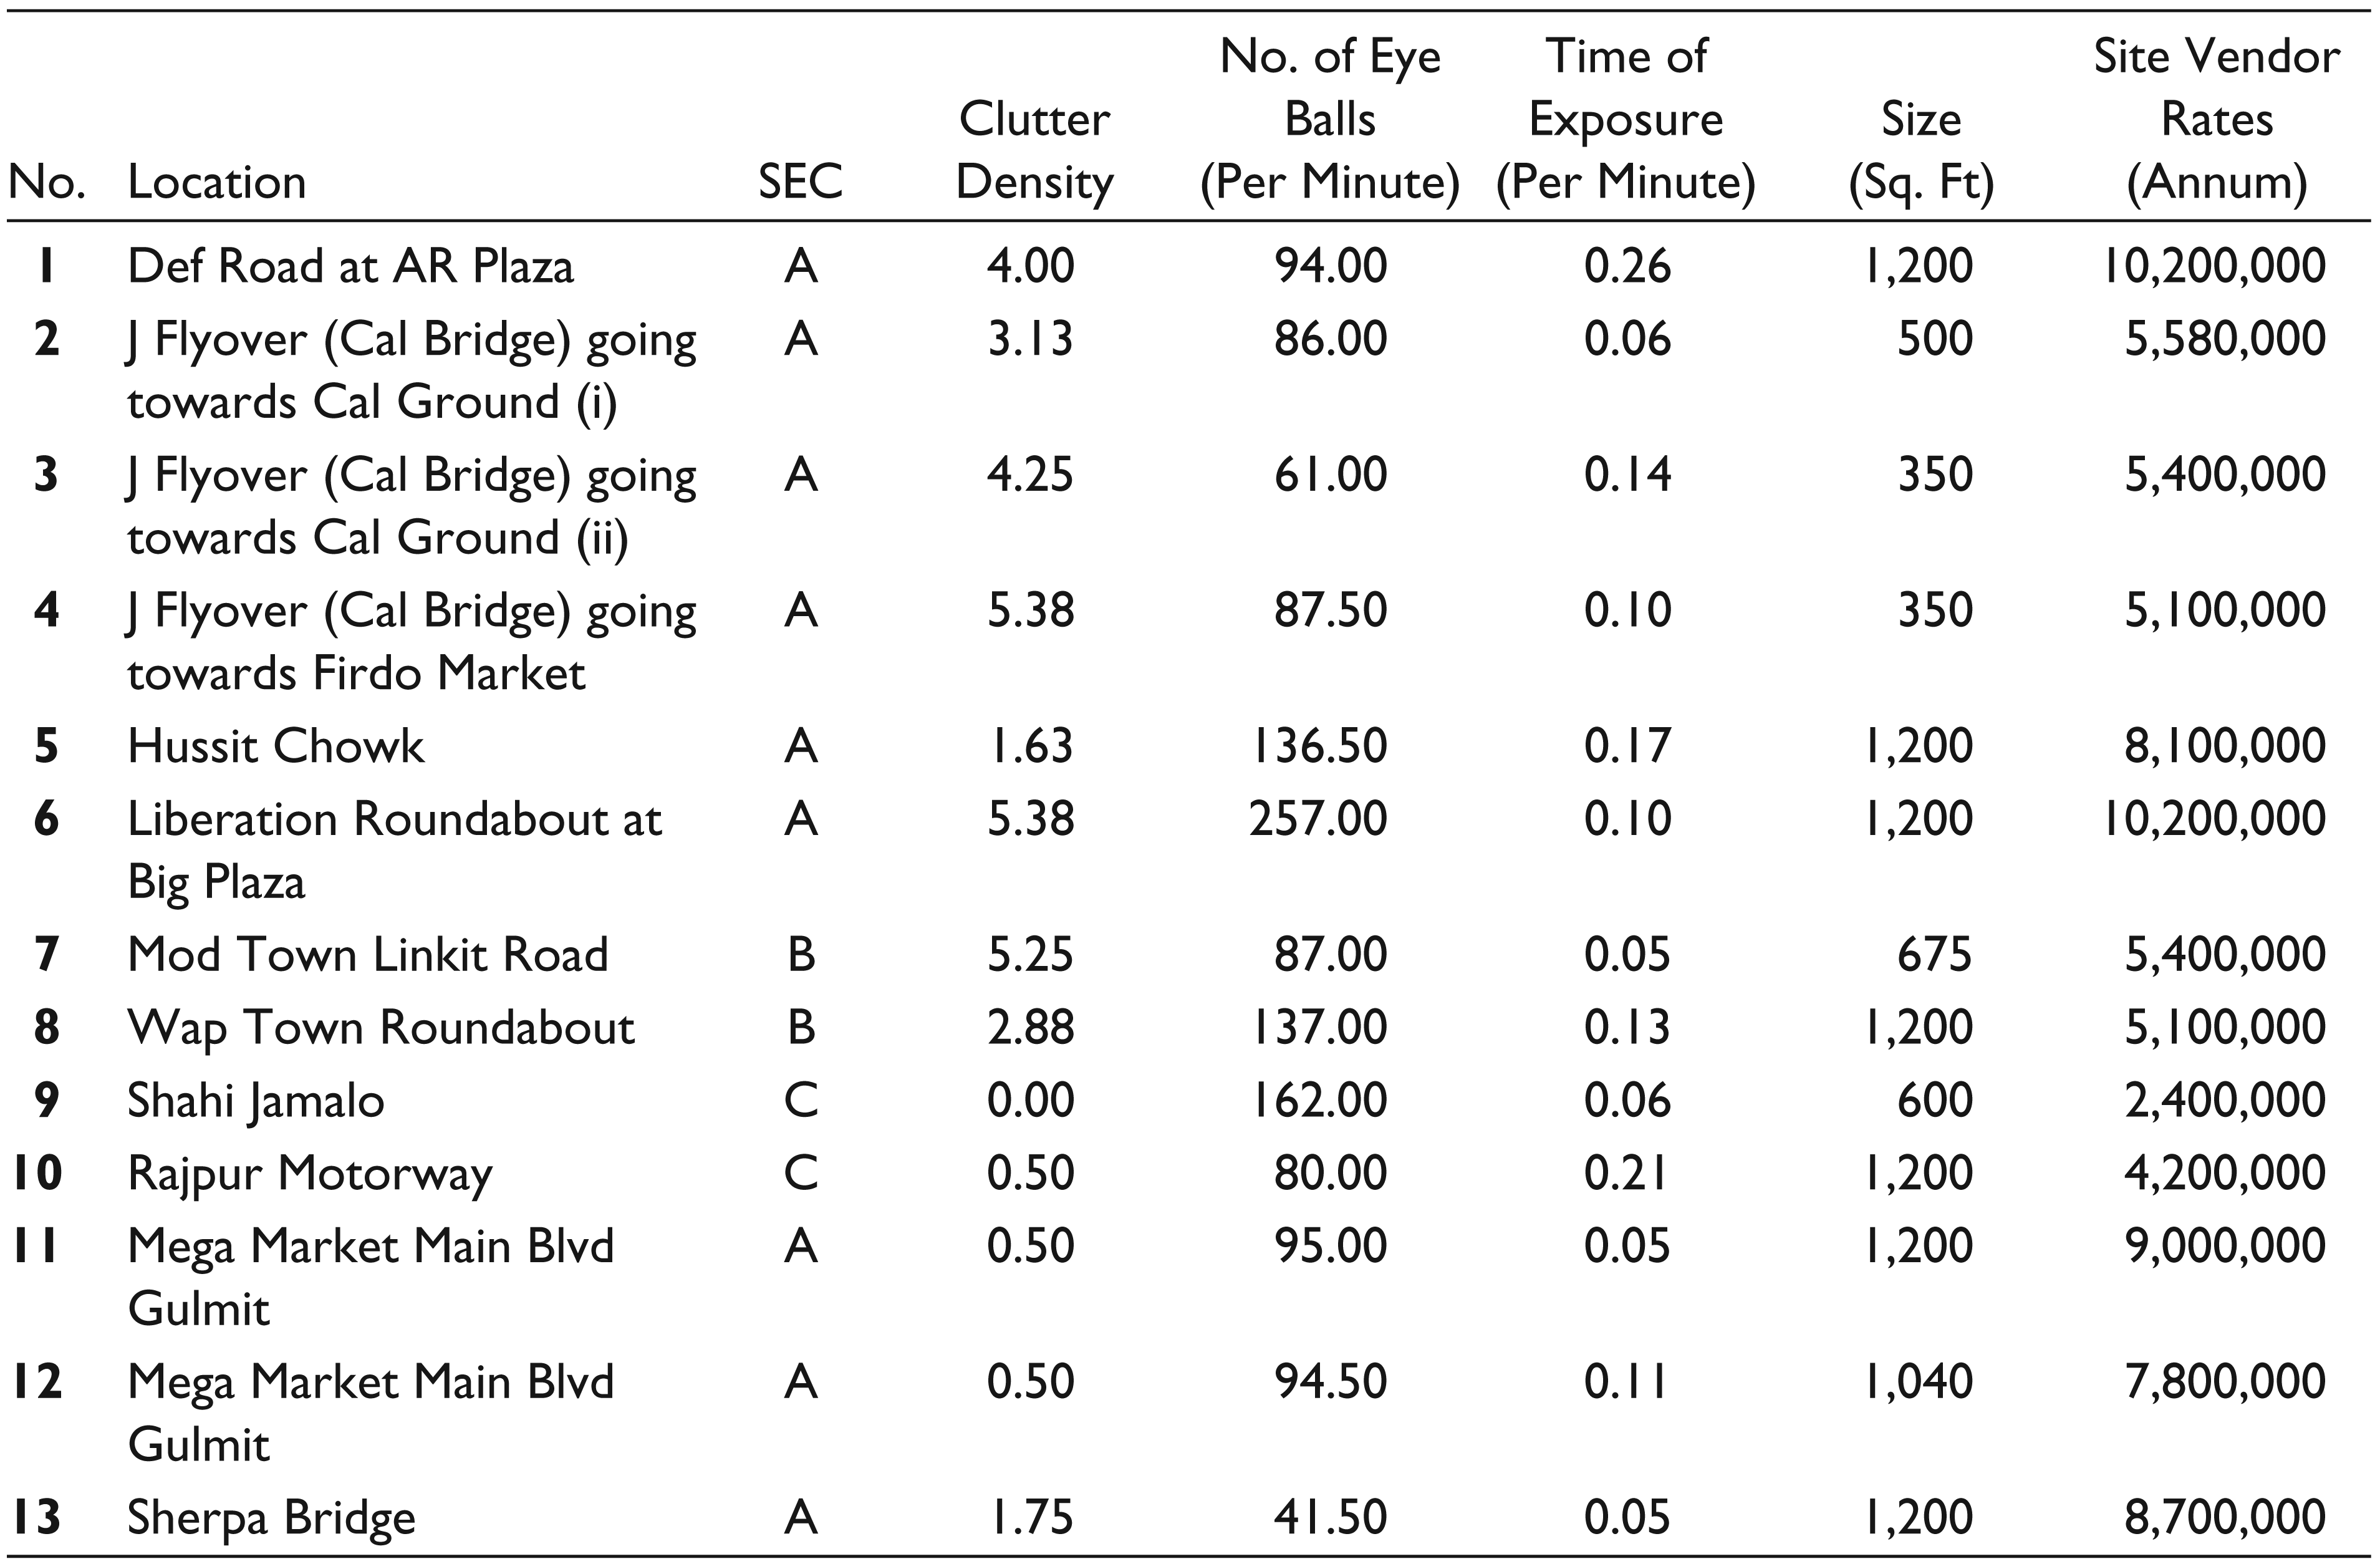
Following a similar procedure, two members of the UR research team were sent to visit various locations in Rajpur to collect some primary data on billboards. They were given two sets of billboards: (a) prices at which billboards were auctioned to site vendors (Exhibit 7A) and (b) prices at which site vendors rented billboards to the advertisers (Exhibit 7B). For each billboard, data was collected for the following factors:
‘Clutter density’ included the number of hoardings and boards near the target billboard. The surrounding billboards were classified depending on their size relative to the 1,200 sq. ft billboard. Same size billboards were rated as ‘1’ and double as ×2. Half-and quarter-sized ads were categorized as ‘medium’ (×0.5) and ‘small’ (×0.25). Thus, an ad spot with a clutter density of 1.5 meant that in addition to the target billboard, that is, 1,200 sq. ft, it had (1,200 × 1.5) 1,800 sq. ft of additional ad spot area.
‘Number of eyeballs’ was calculated by counting the number of vehicles passing by each billboard in a single minute. Both researchers took two readings for each billboard and an average of all four readings was considered to minimize counting error. Further, to achieve maximum accuracy, two persons were assumed to be in each vehicle, so the average observation was then multiplied by two.
‘Exposure time’ indicated the maximum exposure time for each passing vehicle regarding the targeted billboards. This figure was also separately noted by both researchers and was consequently converted into minutes for a uniform scale.
‘Size’ was calculated by multiplying the width of the billboard with its height.
A Conversation with the Consultants
The mood in the room was sombre. Uzair pressed the consultants (Ashar, Rashid and Zartaash) to come up with a precise and simple pricing solution.
Picking up on Uzair’s argument, Zartaash added,
We need to be very precise as to which factors should be considered in pricing UR ad spots. I know from my previous experience when I owned an advertising agency that ‘number of eyeballs’ was a crucial factor that needed to be considered. The managers have always been concerned about how many people will actually be able to see the ad properly.
Rashid argued, ‘Don’t you guys think that eyeballs are useless if the ad spot has visibility issues?’
Zartaash gave a puzzled look.
‘Well let’s say that if there are a lot of billboards that can dilute each passer-by’s attention, or let’s say the passer-by doesn’t even have enough time to look at it, then don’t you think it matters?’ Rashid elaborated on his point.
‘Oh! So you are referring to clutter and traffic flow? Well, I agree’, Zartaash said while looking at Ashar who had been silent throughout.
Ashar, typical of his ‘out-of-the-box’ thinking and critical style, jumped into the argument,
Eyeballs, clutter, and vantage … guys, they have little value when ad display is done in low SEC areas compared to high SEC areas. You should consider the location profile as well. A low SEC audience will not have the same value as a high SEC audience. As UR station is in a SEC ‘C’ area so the traffic there may not be very valuable.
‘Come on Ashar! This makes little sense. We have brands like Anchorbuoy, PMobile, and Bonny; all such brands will be looking to advertise in low SEC areas. We are not talking about Sansong or Vux’, Rashid rebutted the logic.
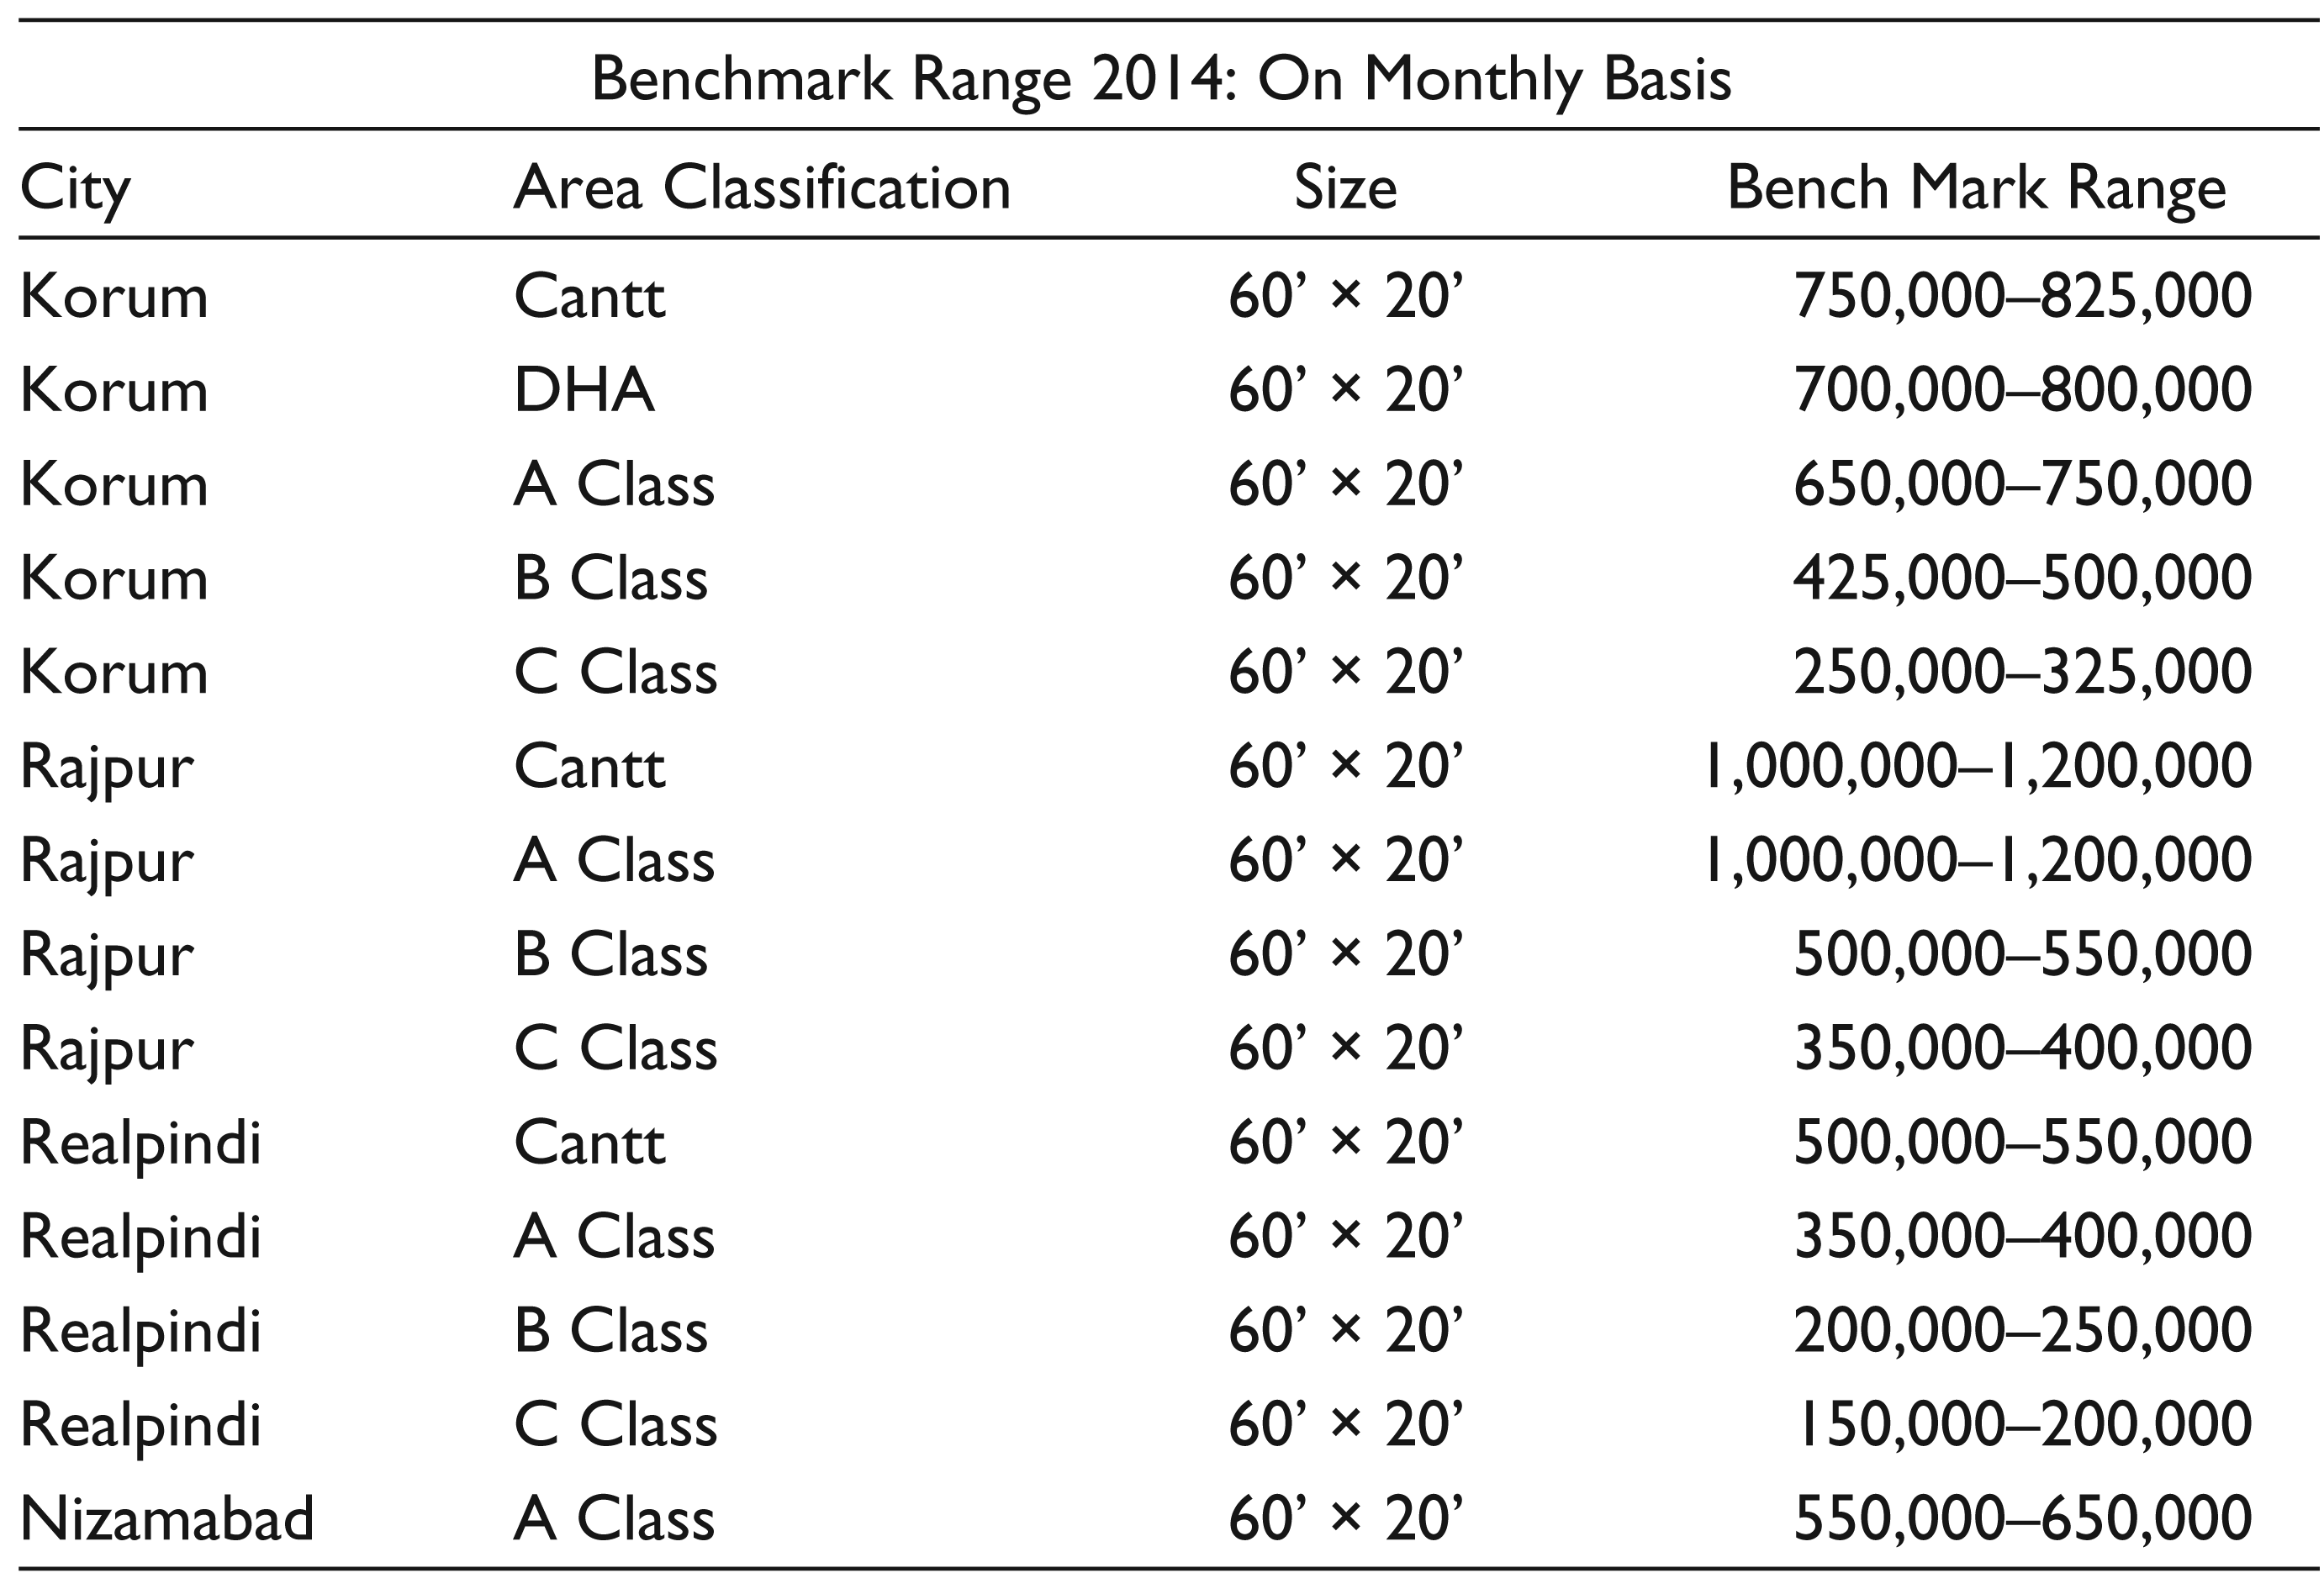
Ashar said, ‘The market has its own dynamics and whether it makes sense or not, it is the way things are. Recently, a friend shared some billboard prices of a few major cities in Nepa (see Exhibit 8) and you can clearly see price differences across localities based on their SEC profile’.
Zartaash replied, ‘I do agree with Ashar that SEC profile is very important and let’s not ignore it. By the way, I think one final variable to consider should be the size of the billboard’.
Rashid and Ashar, both nodded in the affirmative.
Seeing that the discussion was reaching an end, Uzair jumped in, ‘Seems like you guys have too many variables for an ad spot, does it really make sense? Also, how will we incorporate all this to come up with one single price?
‘Well, it’s not a big deal. We can start with the most commonly agreed ones, that is, size, traffic variables (count and flow) and SEC profile. If the results are counter-intuitive, then we can always add more complexity to the estimations’, Ashar explained to Uzair.
Uzair pointed out, ‘Look, we do not only have billboards at UR. What you are doing will only give us some estimate of billboard prices, but what about posters, banners, in-train advertising etc.?’
Zartaash came to the rescue, ‘Uzair, don’t worry. All that we need to do is to come up with a per square foot price. This price value can then be used for all sorts of static ad spots with some modifications based on the characteristics of the ad spot.’
‘Ok so let’s start with Rajpur Station and Rawal Mail and let’s see what we can come up with. But it all has to be done quickly!’ continued Zartaash.
Ashar got up from his chair, went to the board, picked up a blue marker and said, ‘Ok guys! Let’s roll it out. You tell me what to do and I will write it down on the board’.
‘We will not leave the room, until I have written down the recommended prices using this red marker’, Ashar added, lifting the red marker in his left hand.
Suddenly, Uzair relaxed and a grin appeared on his face. He knew that after all the time spent in data collection from different sources, now he would get simple and precise answers to his problems, that is, reserve prices of different ad spots, and whether to sell them to one buyer or many.
Declaration of Conflicting Interests
The author(s) declared no potential conflicts of interest with respect to the research, authorship and/or publication of this case.
Funding
The author(s) received no financial support for the research, authorship, and/or publication of this case.
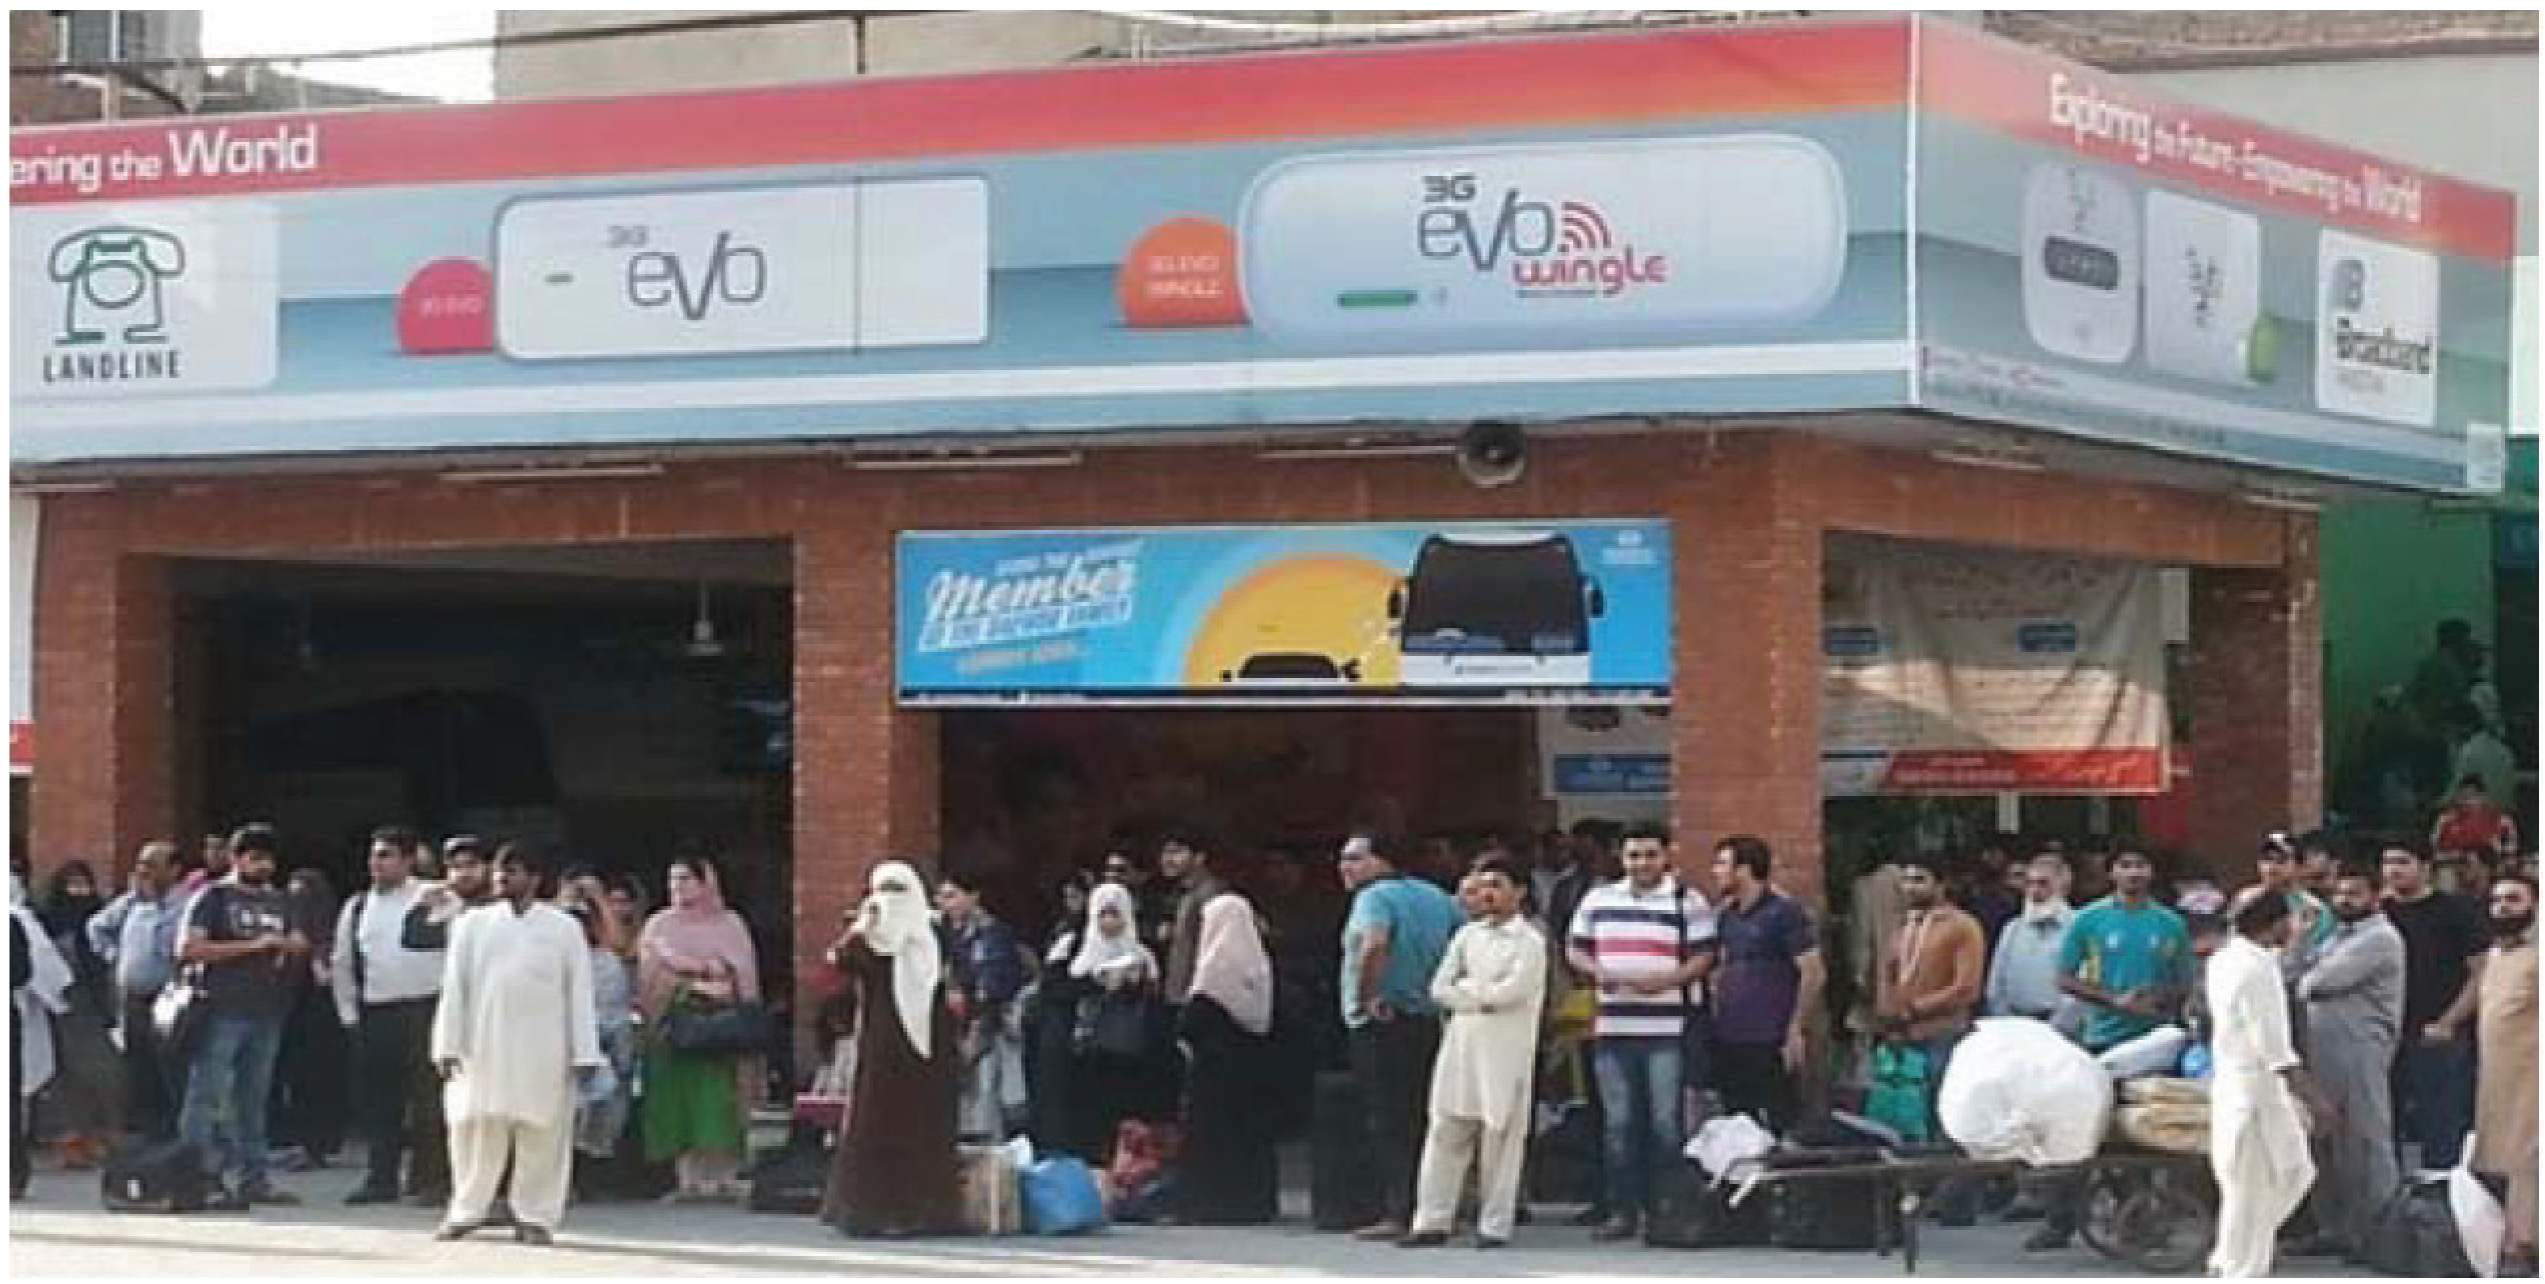
Swift Terminal Advertising Rates for 2014
Swift Intercity Bus Advertising Rates

Swift Intracity Bus Advertising Rates
Comparison of Advertising Rates and NAA Recommendations
Pricing of Car Park Area Ad Spots
Tender Response

PHA Rates (2012/2013)

Billboard Site Data (Site Owners to Site Vendors)
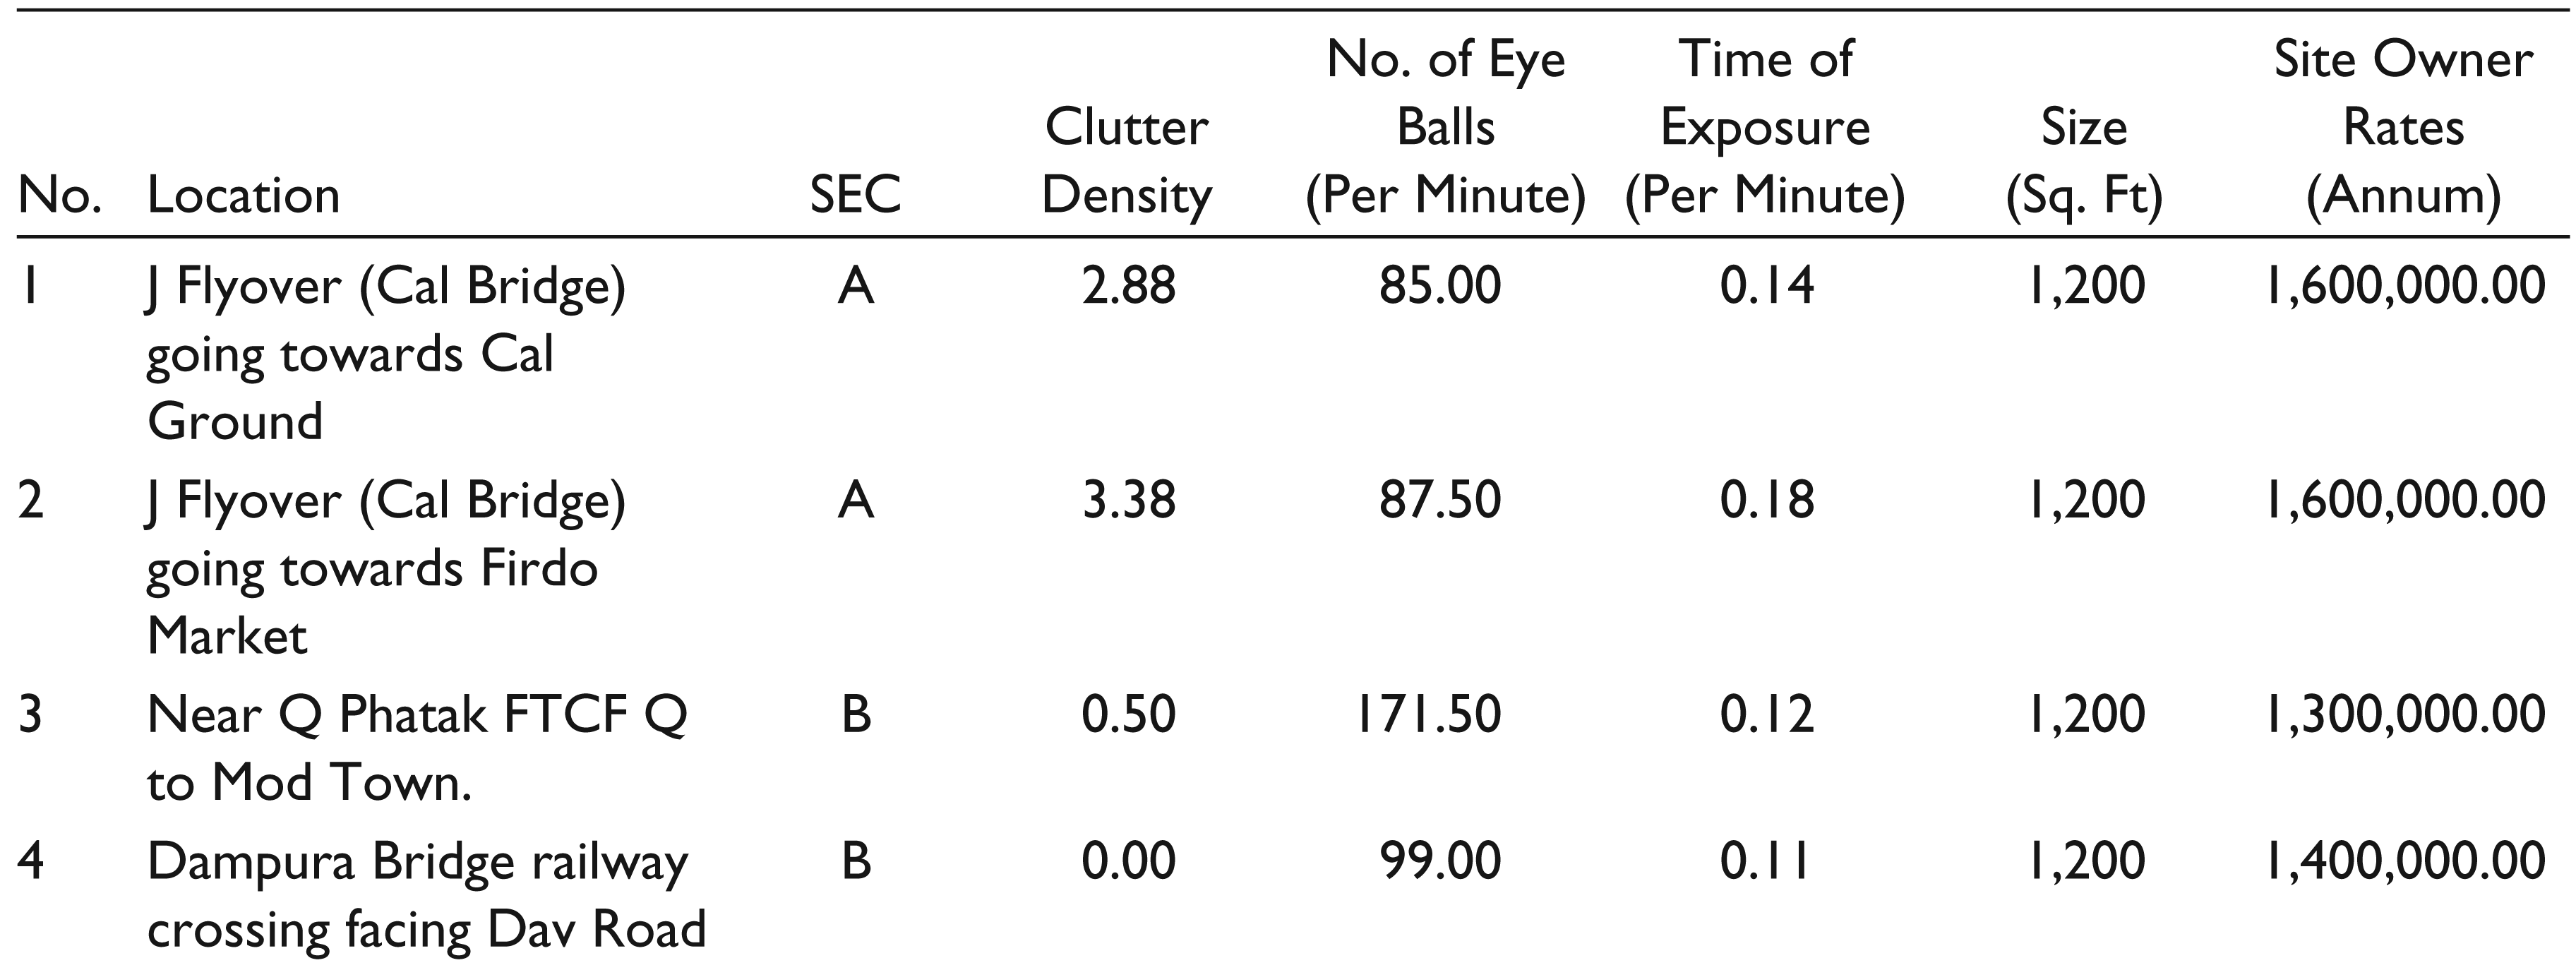
Billboard Site Data (Site Vendors to Advertisers)
Outdoor Advertising Rates in Different Locations