
Abstract
Reliance Industries Ltd. (RIL), the largest private sector company in India, invested in oil and gas fields by winning the bid under New Exploration and Licensing Policy in the year 1999 and aspired to exploit the growing Indian energy market. Though RIL developed the KG-D6 gas blocks in record time, soon after, it was engulfed with some issues like lack of technical expertise, geological complexities and huge capital expenditures. To tackle these issues RIL was hunting for a partner with technical expertise. Meanwhile, British Petroleum (BP) was also grappling with some serious hurdles and eyeing for a new market. India was the best bet for BP as it has recognized the potential of the subcontinent and its earlier stint with RIL inspired BP to invest in India. This case study analyses whether the much-anticipated deal was successful or not. This case study discusses the entire background, issues and difficulties encountered by RIL and BP prior to the deal. Further, we investigate the impact of the deal on RIL by analyzing its operational efficiency, financial performance and stock gains in the pre and post period of the alliance.
This is an analytical case study based on the secondary databases, where it analyses the various pros and cons of the alliance between RIL and BP.
Keywords
Discussion Questions
What is a strategic alliance and how does it matter?
Explain the significance of the energy sector in an economy.
Please discuss the journey of Reliance Industries Ltd.
Discuss the issues and challenges faced by RIL in its exploration and production of oil and gas.
Discuss the reasons behind the interest of British Petroleum in investing in India.
What are the crucial issues and incidents faced by BP before the deal?
Why was this deal crucial for RIL and BP?
Was RIL financially and operationally benefitted from the deal?
What are the post-alliance political and legal problems faced by the partners?
RIL’s Strategic Alliance with BP
‘These guys are the best (in exploration). If you want to climb Mount Everest, make sure you have the best Sherpa with you.’ 1 Mr Mukesh Ambani, CMD, RIL.
Mr Mukesh Ambani, CMD (Chairman and Managing Director) of Reliance Industries Ltd. (RIL) addressed its shareholders after finalizing the landmark deal that British Petroleum (BP). BP was the world leader in deepwater exploration and had the best technology which would help RIL in its oil and gas value chain. The association between both the companies started in the year 2008 and their experience led them to seal their future partnership deal.
The visit of Tony Hayward, Chief Executive Officer (CEO) of BP, in the year 2010 to India was mainly intended towards accomplishing his duties at Tata Steel as a non-executive director. But the lesser known agenda was to meet the CMD of RIL. The meeting was aimed to discuss the shaping of the emerging relationship between RIL and BP. That time, both the companies bided for and obtained an oil block in India. After that, both the companies missioned to have a deeper association with the oil and gas exploration business in India. But the future of their association was not clear in the beginning days and the forcible exit of Tony Hayward from BP after the Gulf of Mexico incident 2 took a different shape in the relationship.
After Tony Hayward’s departure, Robert Dudley took the lead and became the new CEO of BP in the year 2011. He inspected the pros and cons of the deal with RIL by gathering the threads of the deal. Afterward, BP declared its interest in acquiring 30 per cent stake in RIL’s 21 oil and gas blocks, including the Krishna-Godavari (KG) D6 block in 2011. Both the companies also agreed to create a joint venture for sourcing and marketing of gas in India. Further, BP showed its interest to make an investment of $20 billion in the venture. This landmark deal became one of the biggest foreign investments in India. However, the deal was not only the outcome of their previous friendship rather it was the need of the hour for both the companies. Both the companies were looking for a strategic partner to get rid of their respective troubles and it was their best bet to come out of their financial problems.
Reliance Industries Ltd.: Background
‘Growth is Energy; Growth is Value; Growth is Happiness; Growth is Life’
Growth was the buzz word and a deciding factor at RIL. The company had achieved many milestones and proved its incessant growth since its inception. Reliance was incorporated in the year 1966 and the journey of the company started with textile trading in Mumbai and later expanded its business operations in petrochemicals, exploration and production of oil and gas, refining and marketing, retail, telecom and media and entertainment (Table 1). RIL was one of India’s largest energy companies in terms of market capitalization and the first private company placed in the global fortune 500 company list for the last ten consecutive years from India. 3
RIL’s Business Segments
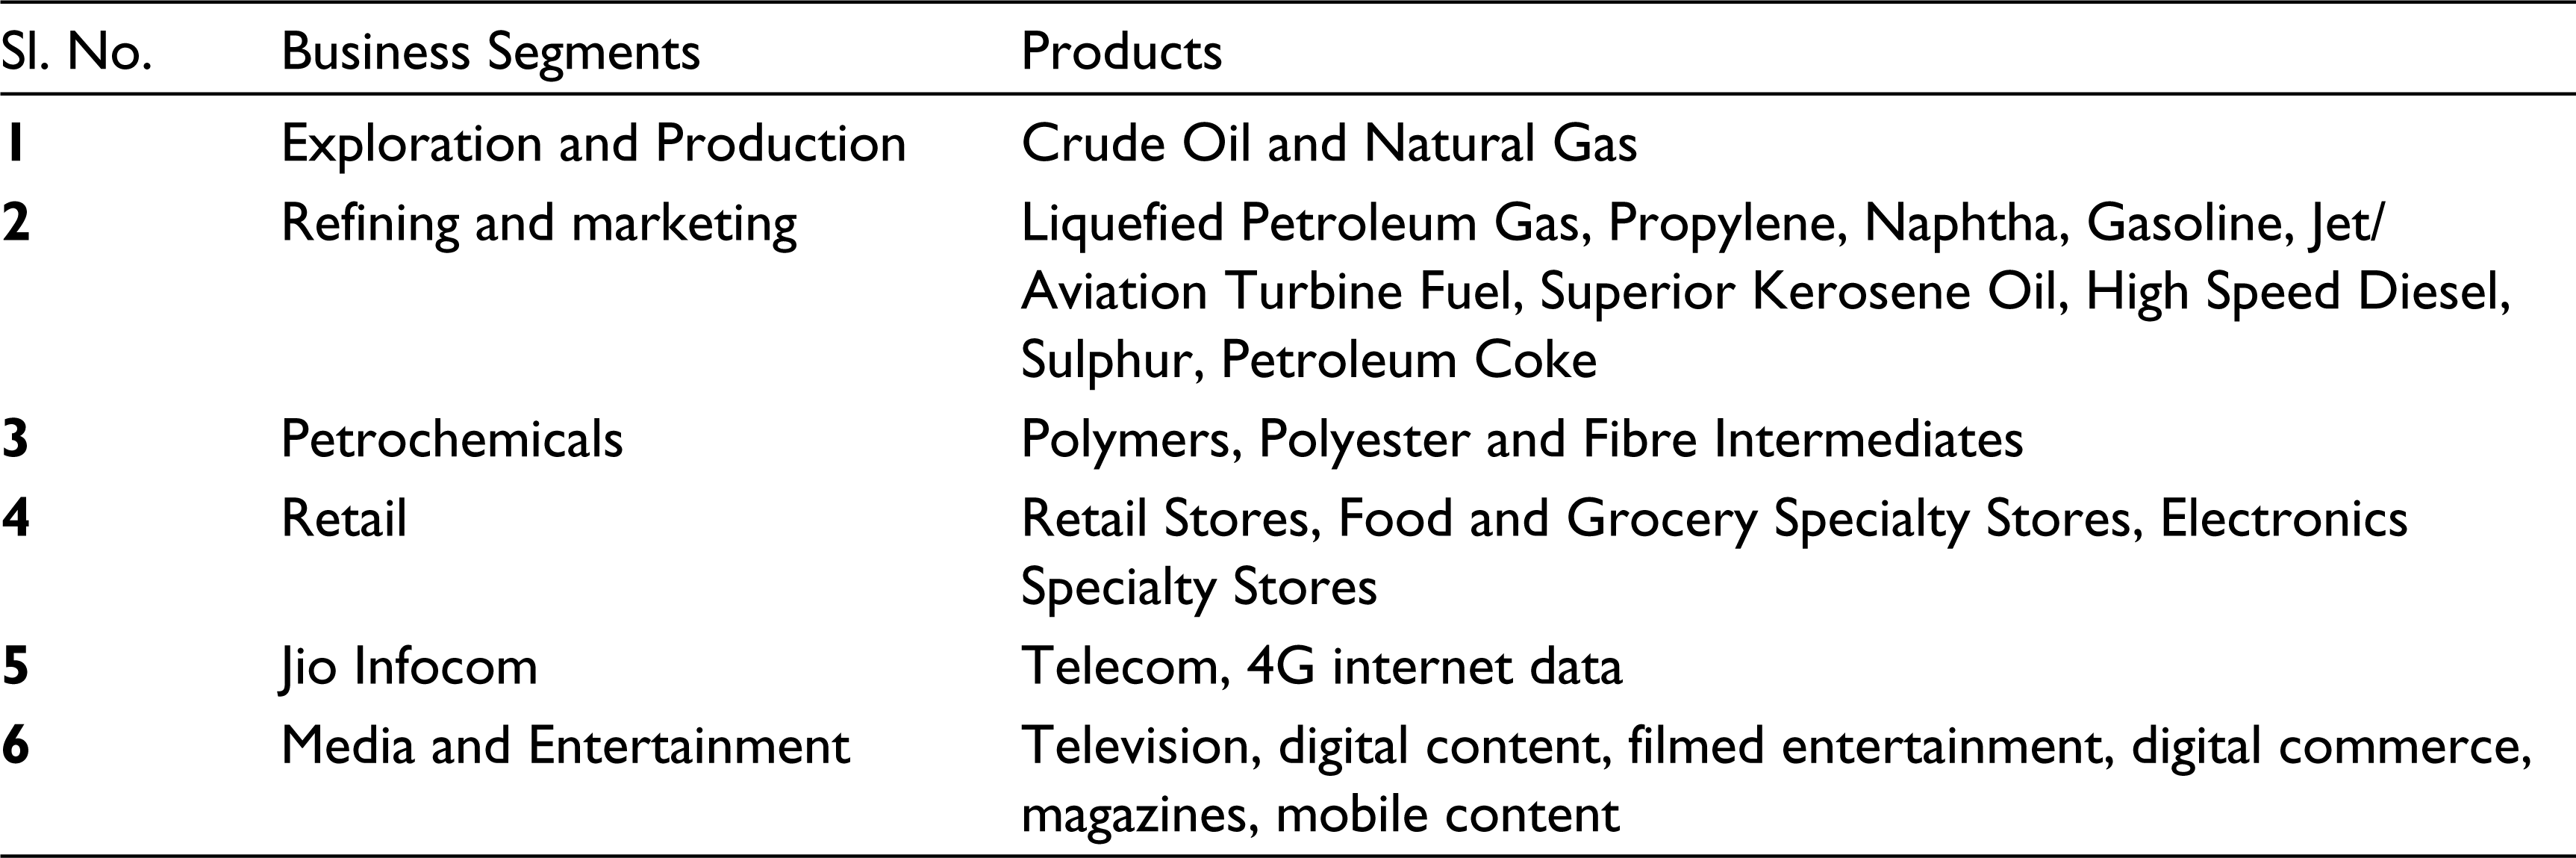
Reliance entered into exploration and production of oil and gas business by establishing a joint venture with British Gas and ONGC. The operation started with the Panna-Mukta and Tapti blocks in India. Since then the company had acquired other five oil and gas fields such as KG blocks, Mahanadi, Cauvery Palar, Gujarat Saurashtra and Cambay Basin to expand its oil and gas business portfolio. It also had two coal bed methane in Sohagpur East and West in Madhya Pradesh. Reliance had offshore oil blocks such as two blocks each in Yemen and Myanmar and one in Peru. Reliance was considered as one of the largest exploration and production company in the domestic market. Figure 1 depicts the oil and gas value chain of RIL.

Reliance’s entry into the refining of petroleum with the establishment of the Jamnagar refining unit in Gujarat marked a milestone for India. Till that, India had heavily depended upon the foreign players for the refining of petroleum. After Reliance’s refining unit, India could be able to export petroleum products. According to the Ministry of Petroleum data, India exported petroleum products of INR 3,70,000 crore in the fiscal year 2014. The huge share of the credit goes to the Reliance’s Jamnagar unit which was the largest refining unit of the world with a processing capacity of 1.24 million barrels per day 4 (MBPD).
India’s oil and natural gas demand had increased rapidly due to the fast urbanization. Hence, to tap the immense potential of the oil and natural gas market, RIL made a number of national and international collaborations. Some of these collaborations were like joint ventures with Chevron, Carrizo and Pioneer in 2010, a strategic alliance with BP in 2011 and with SIBUR in 2012. 5 The partnership with BP was one of the most significant ventures by RIL to explore the opportunities lying in the oil and natural gas market in India and abroad. The company started from textiles in the late seventies to the petroleum refining, exploration, production and marketing of oil and gas till date through various restructuring strategies, which helped Reliance bring new products, technologies and markets to its pocket.
Hurdles with RIL before the deal
Reliance was facing major problems relating to exploration and production before the deal was finalized. The first issue was the delayed production from the Krishna Godavari-D6 block. The KG-D6 block was allotted to the syndicate of RIL and Niko Resource Ltd. of Canada (a partnership of 90:10) in 2000. As per the Initial Development Plan (IDP) of 2004, the block was expected to produce gas by the mid of 2006. But the production from the block started in 2009 which was much behind schedule expected by RIL due to the exploration issues. The average gas production from the block was 48 MSCMD (Million Metric Standard Cubic Meter per Day) in the FY 2010-11, which was much below than the projected production of 70 MSCMD. Further, the output from the RIL’s two largest KG-D1 and KG-D2 blocks plunged due to the reservoir complexities.
The next problem was the massive capital expenditure made by RIL for the development of the gas fields. The capital investment increased from $2.39 billion (as stated in the IDP) to $5.2 billion during the period of exploration in the KG-D6 block. RIL’s debt amount increased due to the augmented capital expenditure made by RIL in its exploration of oil blocks. The pricing mechanism of the gas regulated by the Indian government was low in comparison to the international standard. So the lower gas price issue affected the RIL’s profit margin. Another problem was the absence of subsidies for private players like RIL and surging crude oil prices in 2008 led RIL to shut its petrol pumps and exit from the retail petroleum market in 2008. 6 All these reasons persuaded RIL to look for a strategic deal.
British Petroleum: Background
BP was founded in Iran after an oil discovery there and initially, the company was formed as Anglo-Persian Oil Company (APOC) in 1909. The British multinational corporation was the sixth largest energy company in the world by market capitalization ($ 147.8 billion) and third largest in terms of net income ($ 24.8 billion) as of the year 2014. 7 BP was operating in all the areas of oil and gas value chain including production, exploration, refining, distribution and marketing of oil, gas and petrochemicals. BP was one of the world’s leading energy company with an operation in more than 70 countries. BP was a committed player in the world energy market where it concentrated on the upstream assets in the deep-water horizon, gas value chain and technological advancement to deliver value to its shareholders. BP headquartered in London and primarily listed in London Stock Exchange (LSE).
Problems with BP before the Deal
BP had worked with RIL on KG-D17 basin with a fifty percent share since 2008 and from its previous experience found huge potential in the Indian oil and gas sector. Hence, it made a further alliance with RIL to invest in its oil and gas blocks. BP, the global oil major, was also suffering from some serious problems like volatile oil prices, inelastic demand, maturing oil reserves, policy changes and political issues 8 before its partnership deal with RIL. The Texas City refinery explosion of BP happened in March 2005 killed 15 workers and injured more than 170 workers. BP was charged with several criminal offenses by the environment department of USA and fined with an enormous amount for the safety violations. This incident tarnished the face value of BP in the USA.
In April 2010, BP encountered other serious incidents like the deep-water oil spill in the Gulf of Mexico which was the biggest marine oil spill in the history when 200 million gallons of oil was pumped into the Gulf of Mexico. This incident claimed 11 workers’ life, 17 injuries and leakage of 206 million gallons of oil (Eley, 2011). These two serious incidents led to some severe consequences for BP. It paid a huge cost, fines and was also banned from getting any new contracts from the government of the US. Due to these incidents and issues, BP lost most of its market share and was looking for an emerging market. India was the perfect destination as its demand for energy was growing and suffering from insufficient production.
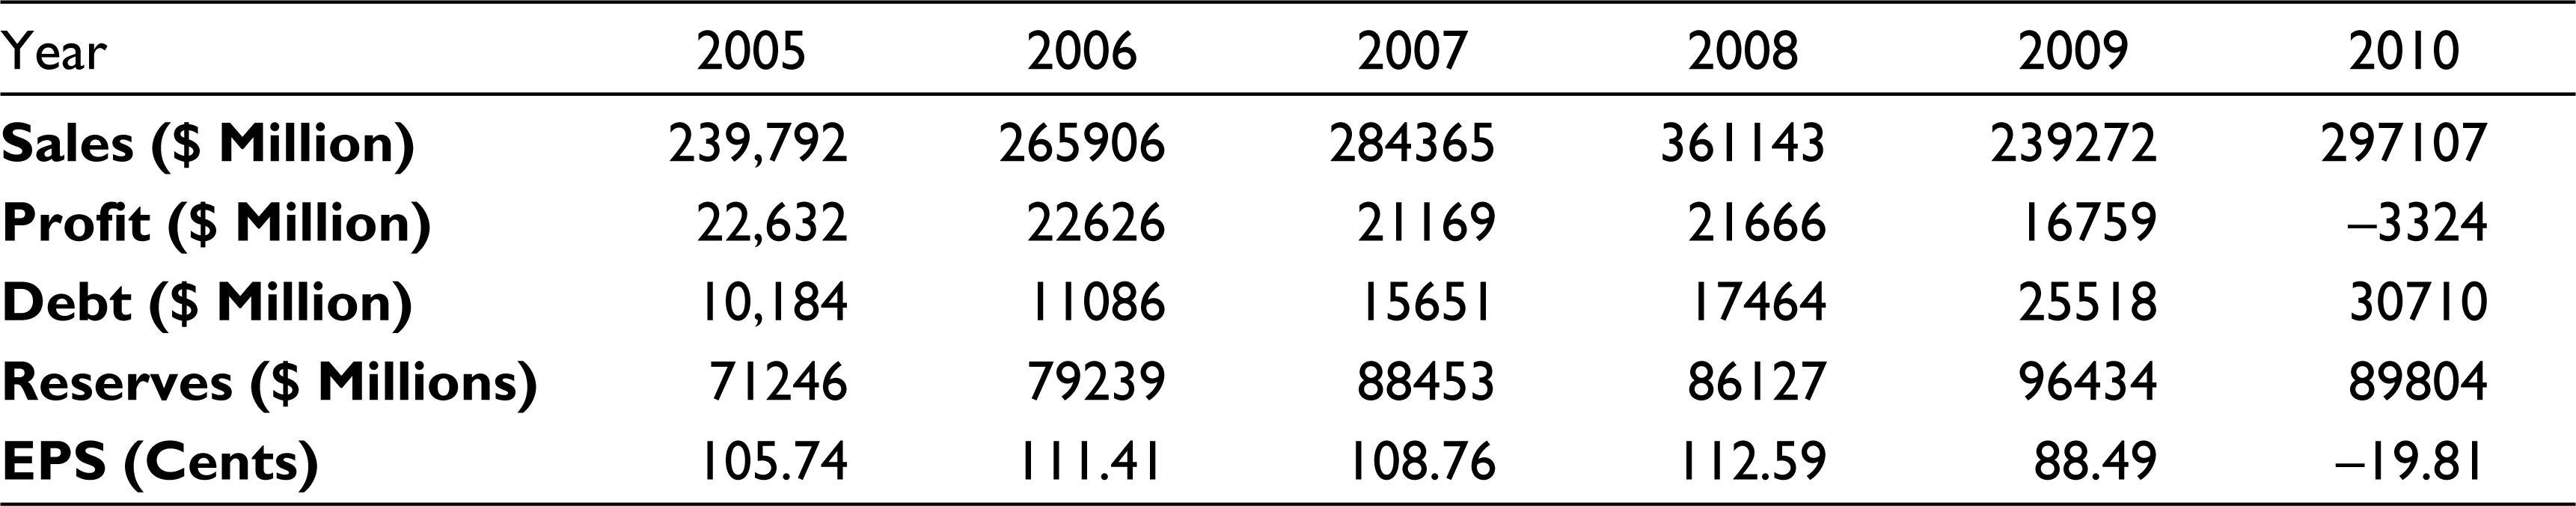
BP’s involvement in the critical incidents between 2005 and 2010 made an adverse effect on its financial conditions. It can be observed from Table 2 that the sales revenue and profitability declined after 2008 and incurred a loss of $3324 million in the year 2010. BP’s loss due to the oil spill in the Gulf of Mexico negatively affected the shareholders’ sentiment. At the same time, the EPS was also declining and became negative in 2010. Similarly, BP’s debt continuously increased and its reserve dropped in 2010. These financial indicators justified that BP was battling with its poor financial condition before the deal in 2011.
BP’s Financial Indicators
Global Gas and Oil Outlook
The global oil and gas sector grappled with certain challenges and opportunities. The global energy consumption levels were increasing due to the rapid urbanization and population growth. The UNO report forecasted that the total population of the world will be 8.9 billion in 2040 from 6.9 billion in 2010 and the growing population will be concentrated mostly in Asia and Africa. Mostly the urban population would increase and the demand for energy would mount, which would create an opportunity for the global energy sector to explore and produce more energy to meet the growing demand.
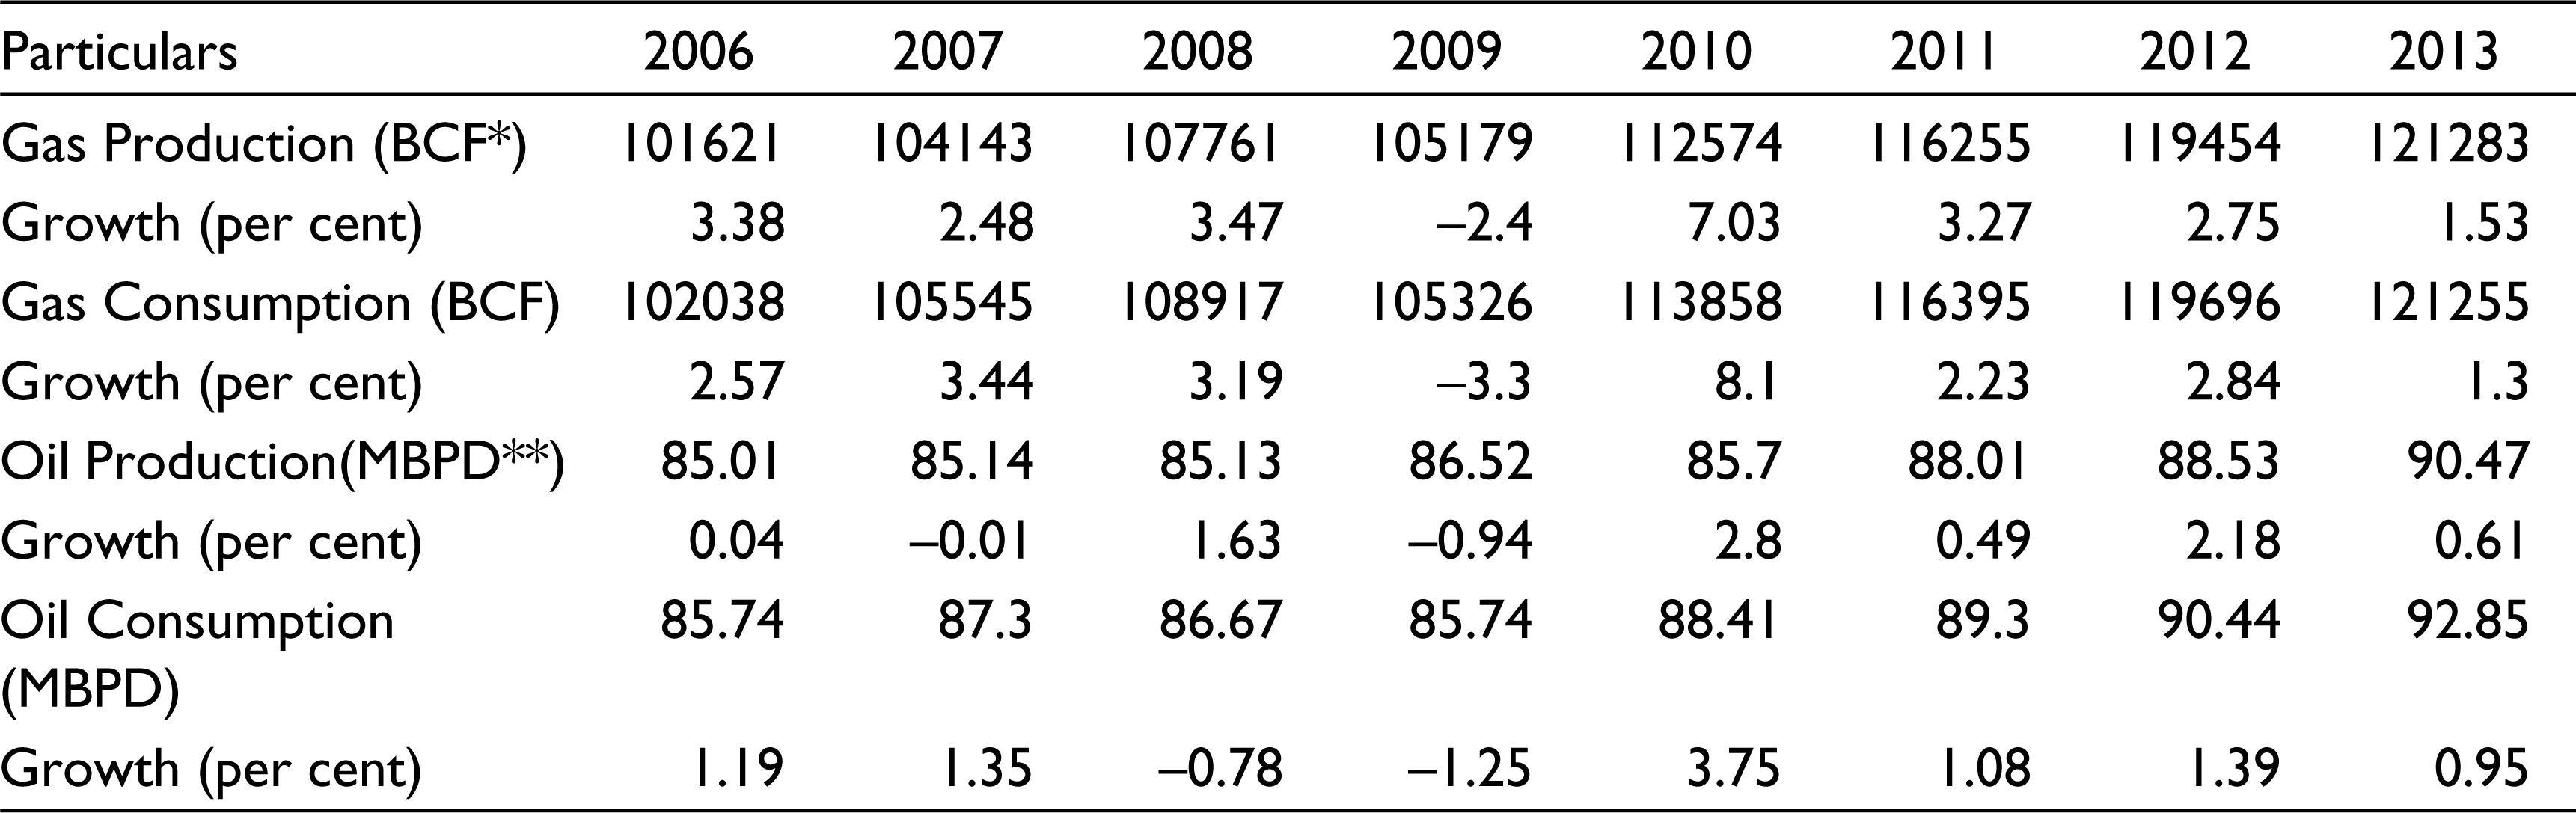
It is quite evident from Table 3 that the consumption of global oil and gas was more than the production. This consumption and production gap was a growth opportunity for global energy companies. The gas consumption growth rate was higher than the oil consumption growth rate, which indicated that demand for gas was high and more gas production was required. The global oil consumption was expected to grow from 93 MBPD in 2013 to 118 MBPD in 2030 with a cagr of only 1.4 per cent. 9 While the demand for natural gas was expected to grow at 1.9 per cent annually (British Energy Outlook, 2035), it was considered as the fastest among the fossil fuels. In the meantime, the demand for global energy was projected to grow at only 1.1 percent annually, which signals that the growth of gas consumption was higher than any other energy resources.
Global Oil and Gas Consumption
It can be observed from Table 4 that the Middle East, North America and Eurasia were the three top oil-producing regions of the world and catered to almost 70 per cent of the total global energy consumption, whereas Asia, North America and Europe were the top oil consuming regions of the world. Similarly, Asia and Europe were the biggest consumers of gas around the globe. But Asia and Europe produced much less oil and gas in comparison to their consumption, which was a problem for these regions. This gap provided an opportunity for the Asian and European energy companies to explore more oil fields and gas basins in their areas to tap the demand because the global oil and gas sector struggled with the poor transport facility, which was another hurdle for the international trade.
Oil and Gas Consumption and Production (continent wise)

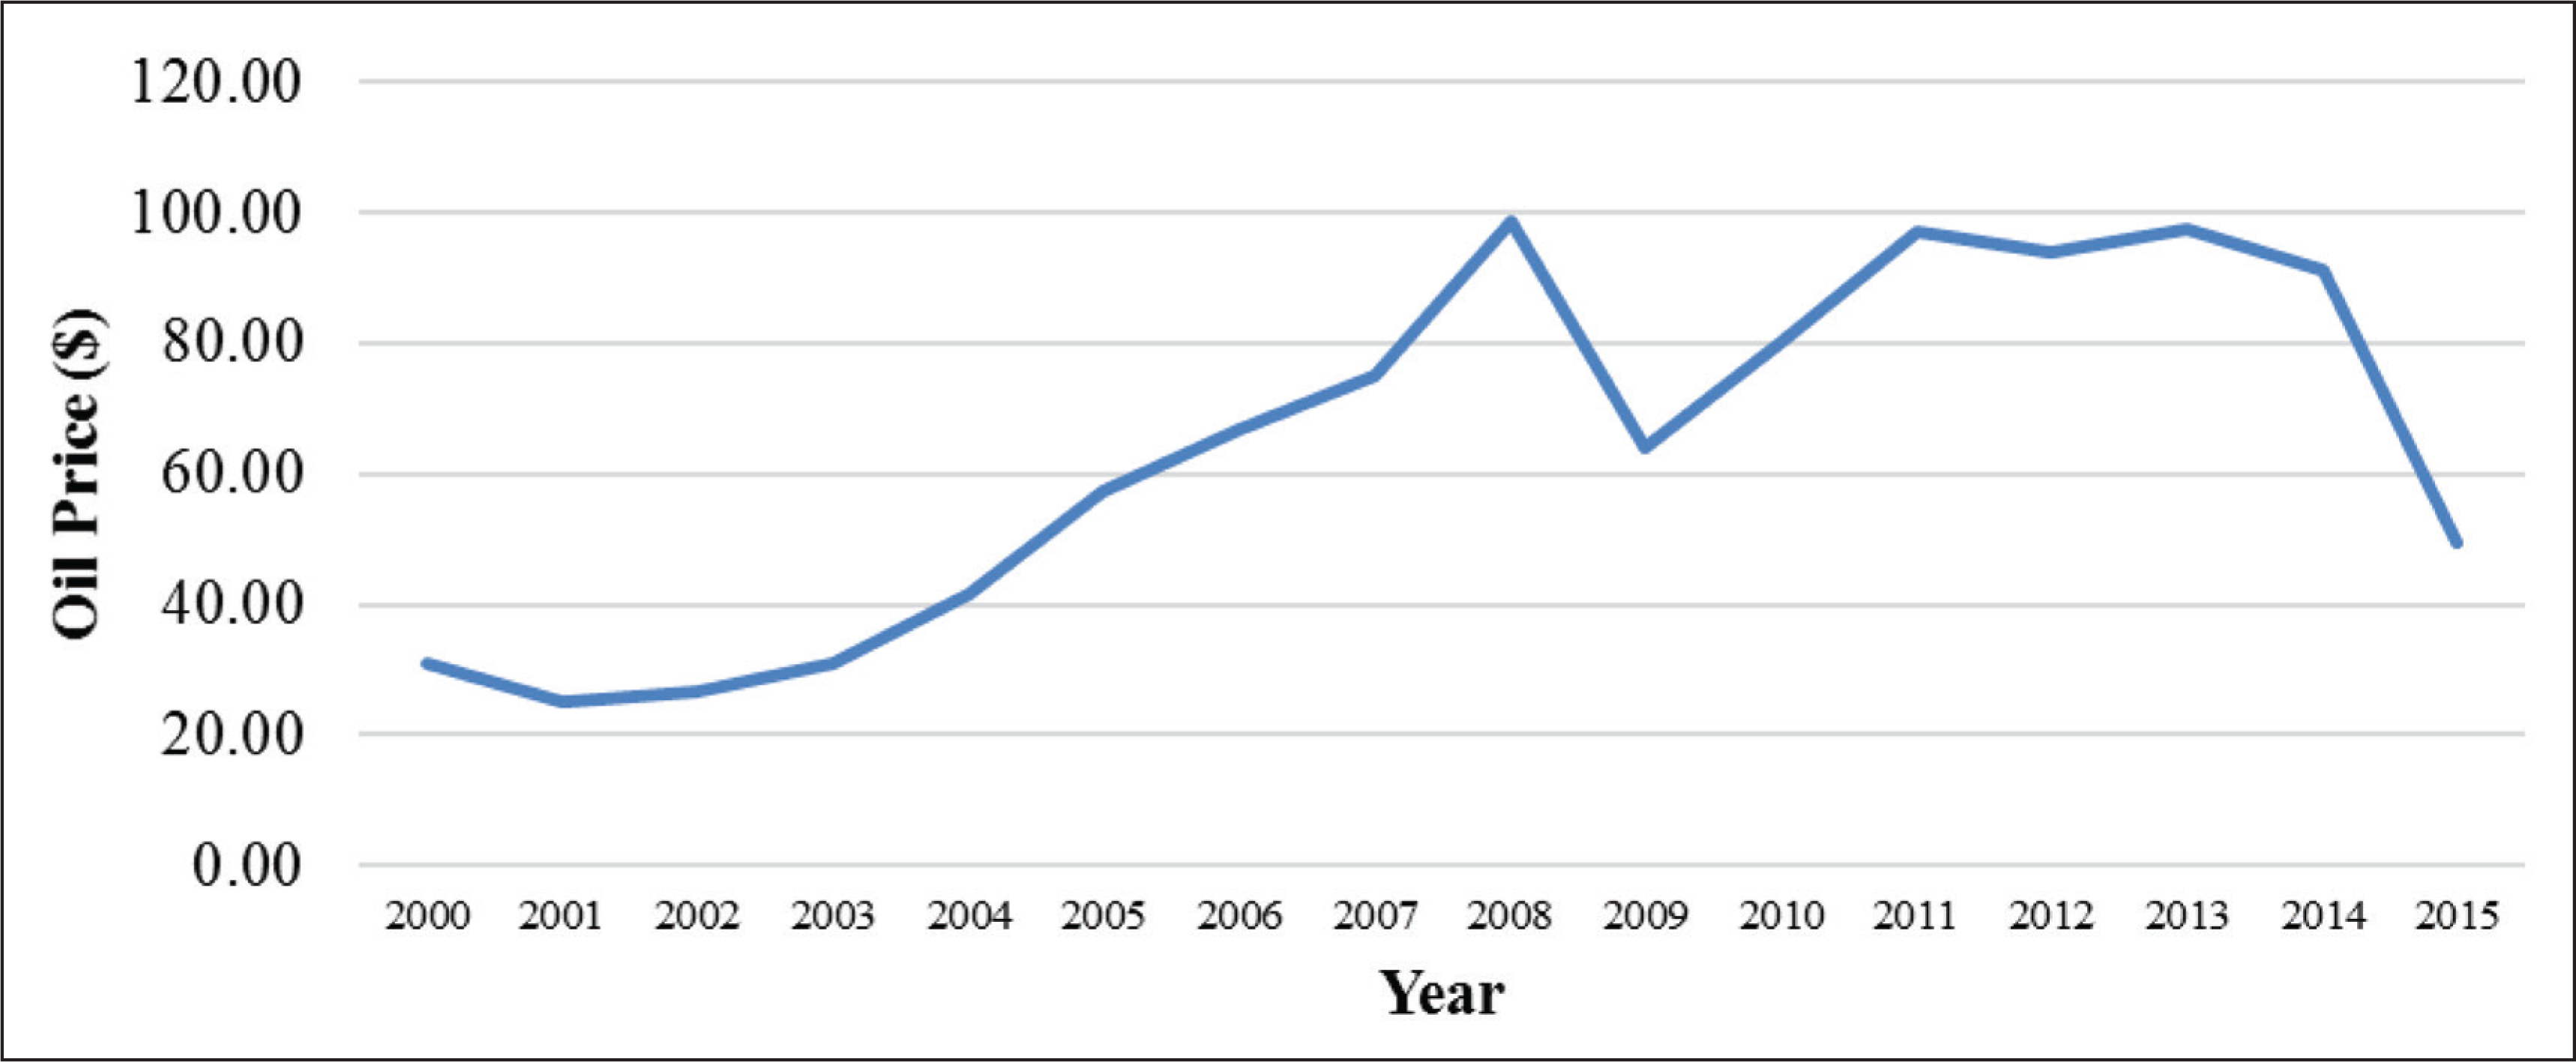
The next issue was the fluctuating global crude oil prices. The global oil crisis in the 1970s and 80s led by market imperfections resulted in the rise in oil prices and the uncertainty about the future of the global oil reserves and consumption was speculated at that time. The International Energy Outlook 2006 forecasted a slow growth for the oil prices, where the prices were expected to go from $31 per barrel in 2003 to $57 per barrel in 2030. The behaviour of the global crude prices was always erratic and it can be witnessed from Graph 2. The profitability of the energy companies was hampered due to the fluctuation in the oil prices and they were under tremendous pressure to curtail their cost. It led the energy companies to concentrate on the latest exploration, production and refining technologies.
The global energy sector was on the rise due to the increased urbanization and rapid industrialization was happening in the emerging markets. The emerging markets had a huge demand for energy but they were short in energy production. Although opportunities were there for the energy companies, they still faced numerous challenges like technical inefficiency, unavailability of technical expertise and services. At the same time, the international energy market also faced problems like deep-water exploration, pursuing development and production firm, energy sector privatization, strategic alliances to mitigate field exploration and development risks, end-product distribution and marketing, information technology for strategic advantage and technological issues.
Indian Oil and Gas Industry Outlook
India witnessed its first oil discovery in 1890 in Assam which provided the first commercial oil exploration. There were numerous onshore discoveries made across the country after 1960. A major offshore water exploration was done on the Mumbai coast in the year 1974, which with other offshore oil fields contribute 66 per cent of the national output. Cairn Energy discovered around 25 gas reservoirs in Rajasthan. After these numerous discoveries, India stood with reserves of 760 million metric tons of crude oil and 1330 billion cubic meters of natural gas as on 1 April 2012 (Government of India, Ministry of Petroleum and Natural Gas Economic Division, 2012). The demand for energy continued to grow rapidly due to the increasing urbanization and industrialization happening in India.
Table 5 demonstrates that there was a huge gap between the production and consumption of oil and gas in India. India could produce on an average 77 per cent of the total gas consumption and 30 per cent of the total oil consumption domestically, which could lead to massive import of oil and gas. The gap in production and consumption of energy was an exploitive opportunity for domestic companies. The production and the consumption gap in case of oil were much higher than gas. The cagr of oil consumption was 5.3 per cent, while the cagr of oil production was 2.04 per cent. Similarly, the cagr of gas production was 3.59 per cent and the cagr of the gas production was 1.71 per cent. It indicates that the growth rate of oil and gas consumption was more than the growth rate of its output, which suggests a massive scope for domestic companies.
Indian Oil and Gas Consumption and Production
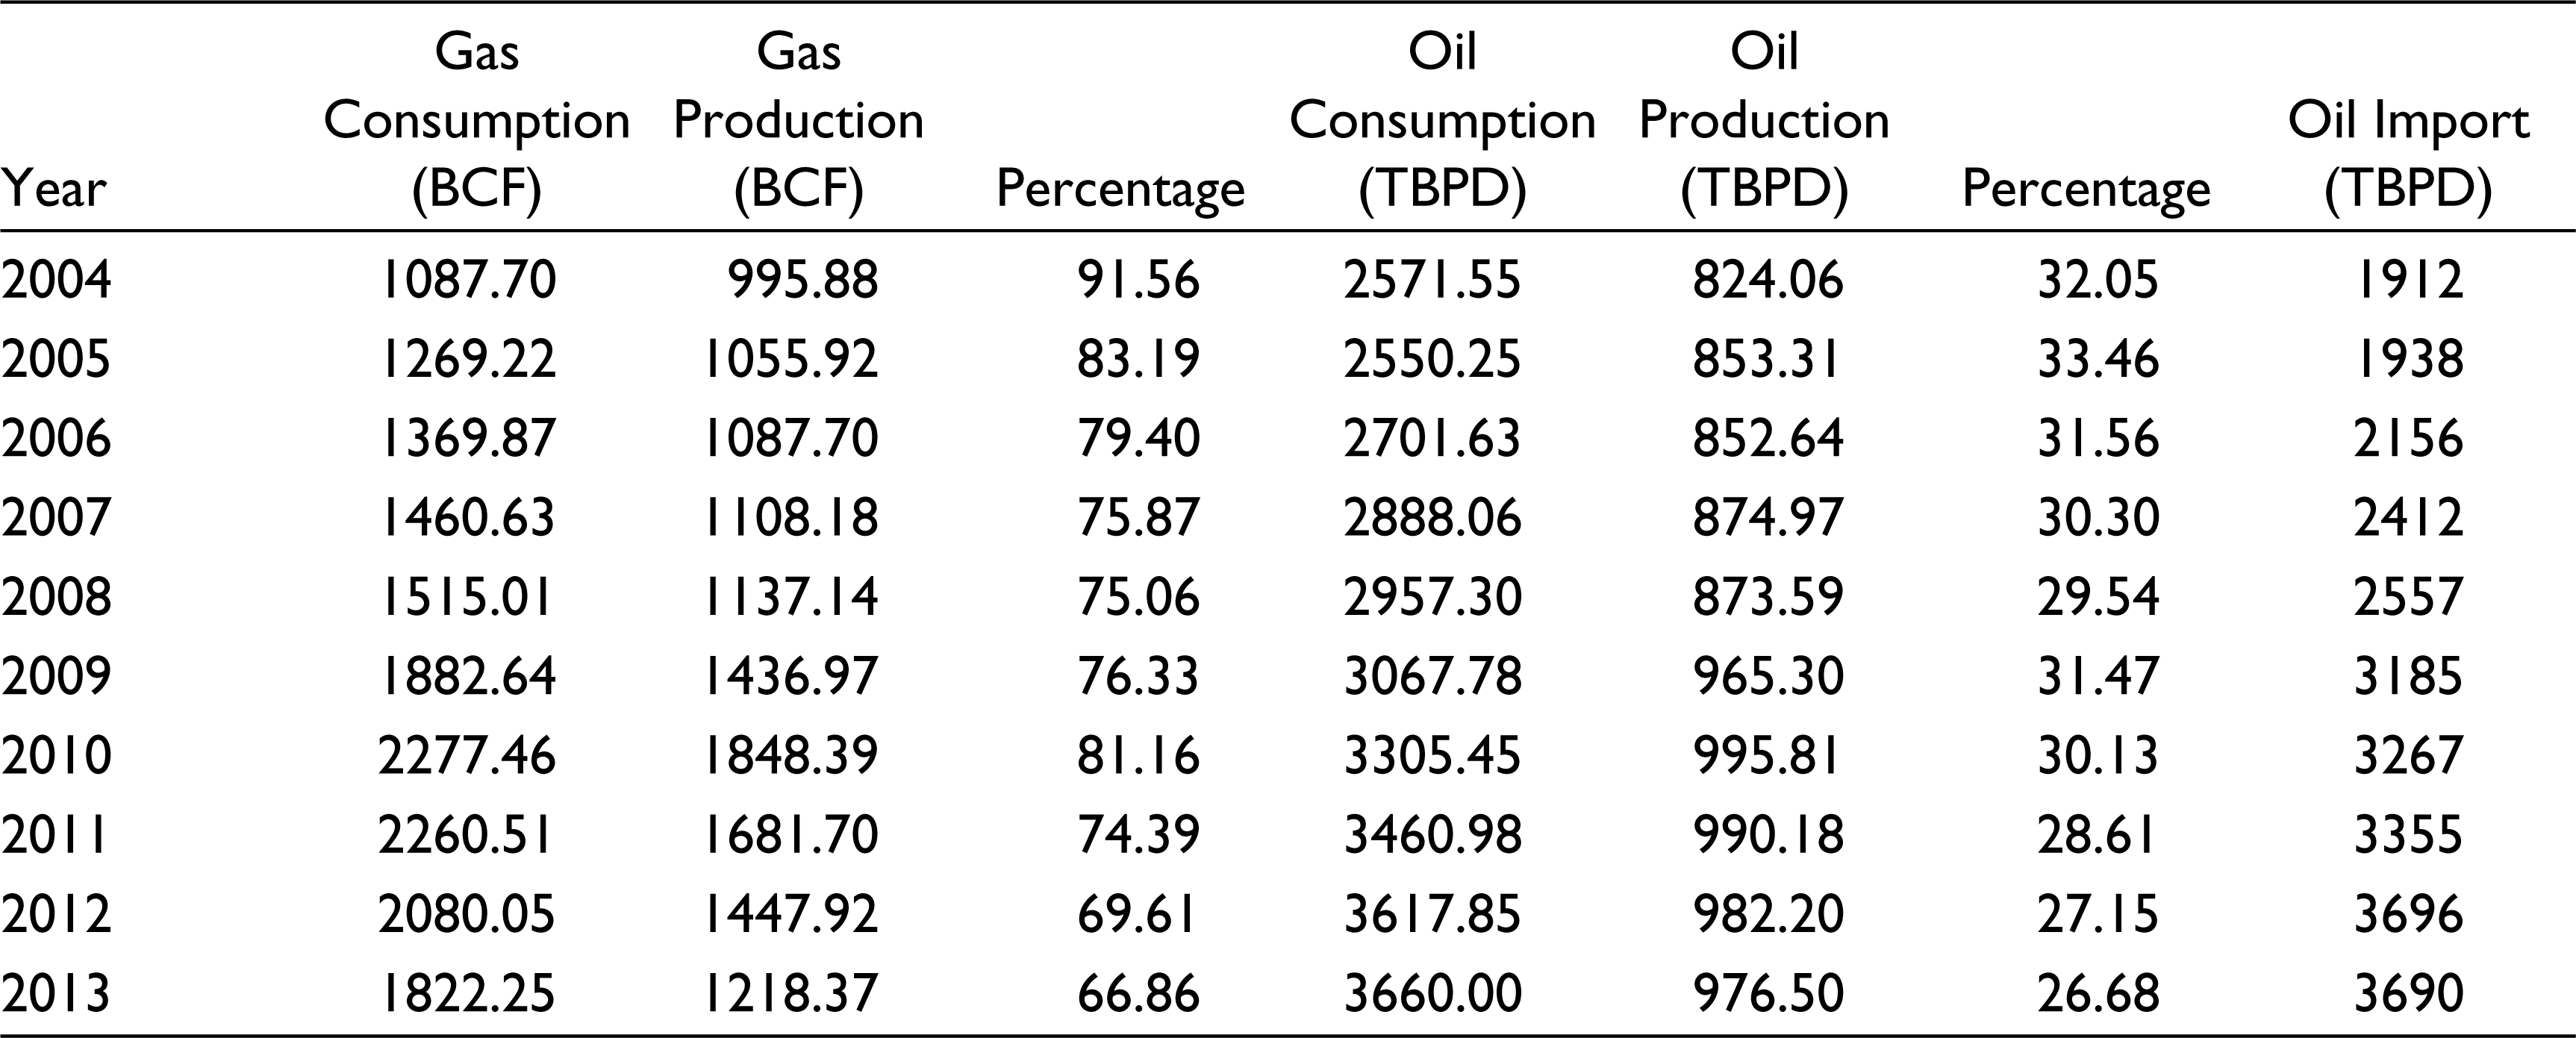
India was the fourth largest consumer of petroleum products after the United States, China and Russia as of 2013. 10 India was an energy deficit market and it imported almost 90 per cent of the oil consumption. Though India had been able to cover its gas consumption from its own production, it miserably depended on imports to meet its oil demand. Due to high dependency on the import of petroleum and gas products, Indian national companies invested in overseas oil fields of Africa, Caspian Sea region and South America. According to the Oil and Gas Journal, 53 per cent of the Indian reserves were from onshore resources, while 47 per cent of the reserves came from offshore resources.
The oil and gas sector was one of the most significant core areas of India, which played a crucial role in India’s economic growth. But India depended mostly on the import of oil and gas to meet its energy needs, which required being curtailed. Therefore, the Indian oil and gas companies needed to explore and produce more oil and gas both in onshore and offshore fields. India as an emerging global powerhouse had towering energy growth opportunities due to its rapid urbanization, industrialization and high economic growth. To cope with the rapid energy requirements, the Indian government had taken some serious policy steps like 100 per cent foreign direct investment (FDI) in sectors like natural gas and petroleum products to boost the production of oil and gas. In spite of the favourable policies, Indian oil and gas companies still faced challenges like delay in government clearance, problems with gas pricing and the decline in gas production, which needed to be taken care.
Details of the Deal
BP and Reliance Industries announced their historic partnership deal and a 50-50 joint venture in February 2011 (Young & Winterbottom, 2011) and completed the deal in August 2011. The partnership deal was the cash deal between RIL and BP. RIL sold 30 per cent stake of its 21 oil and gas blocks to BP. Mr. Mukesh Ambani, CMD of RIL, and Mr. Robert Dudley, CEO of BP, signed the deal in London. Both the companies sealed the deal to source and marketing of the gas and oil worldwide. The partnership was not only limited to the exploration and production, but it also managed a long-term upstream and midstream association to distribute natural gas in India, which is 30 per cent of the total domestic demand. The deal was made to capitalize on the operational and technical expertise of BP and to attract huge funds from abroad by RIL. A team of executives was engaged to execute the functions of the deal and the details of these executives involved in the deal are shown in Exhibit 3 (Annexure), while Table 6 shows the entire information about the deal.
Details of the Deal

Expected Benefits to RIL from the Deal
RIL was facing some crucial issues like under capacity utilization, delayed production, huge capital expenditure and low growth before the deal with BP. So, to solve these matters, RIL was looking for a strategic partner. BP was the perfect match for RIL as it had the technical expertise, advanced technology and extensive marketing channel. Some significant benefits motivated RIL for this deal, which are discussed below:
The deal would facilitate the massive foreign direct investment of $7.2 billion from BP into RIL’s operation. RIL developed the KG-D6 block, but managing a vast area of exploration needed billions of dollars in investment. Hence, the investment from BP would boost the cash position of RIL and would help in maintaining the oil and gas fields. Partnership with BP would fix the technical problems that hindered the production at the KG D6 block. Here, BP could make the difference as BP was equipped with the high-end technology in the subsea exploration. BP had drilled in more than 30 countries across the world and its expertise would aid RIL in discovering more oil and gas fields in India which would expand the RIL’s energy business. RIL could increase its capacity utilization of the oil and gas fields with the help of BP’s experience which would enhance its production capacity. The joint venture would upgrade the RIL’s storage capabilities and the marketing and distribution channel for the natural gas in India. BP was an international energy company which would help RIL in exploring the opportunities in the global energy market.
Expected Benefits to BP from the Deal
This deal was the need of the hour for BP as it was facing some grave problems like Texas City refinery explosion, Prudhoe Bay oil spill, Gulf of Mexico oil spill and loss of contracts from the USA government. After its scope of business reduced in the USA, BP was hunting for a new market where it could gain some momentum. India was the emerging market and BP had already understood the geographical conditions, work culture and government policies of India. BP had forecasted the future growth potentials of India and desired to be a part of the growth story. Some distinctive benefits influenced BP’s decision. They are discussed below:
After the deal, BP would enter into an emerging market like India where the demand for energy was increasing due to rapid urbanization and industrialization. BP’s partnership with RIL would equip BP with efficient project management skill from RIL. The 50:50 joint ventures between Reliance and BP would facilitate BP in revitalizing the energy sources, upgrade the storage infrastructure, distribution of natural gas in India. The investment made by the BP was expected to create a long-term association with upstream and midstream value chain, strengthen its positions in gas basins and exposure in the growing energy markets.
Operating Performance of RIL: Pre and Post Analysis of the Deal
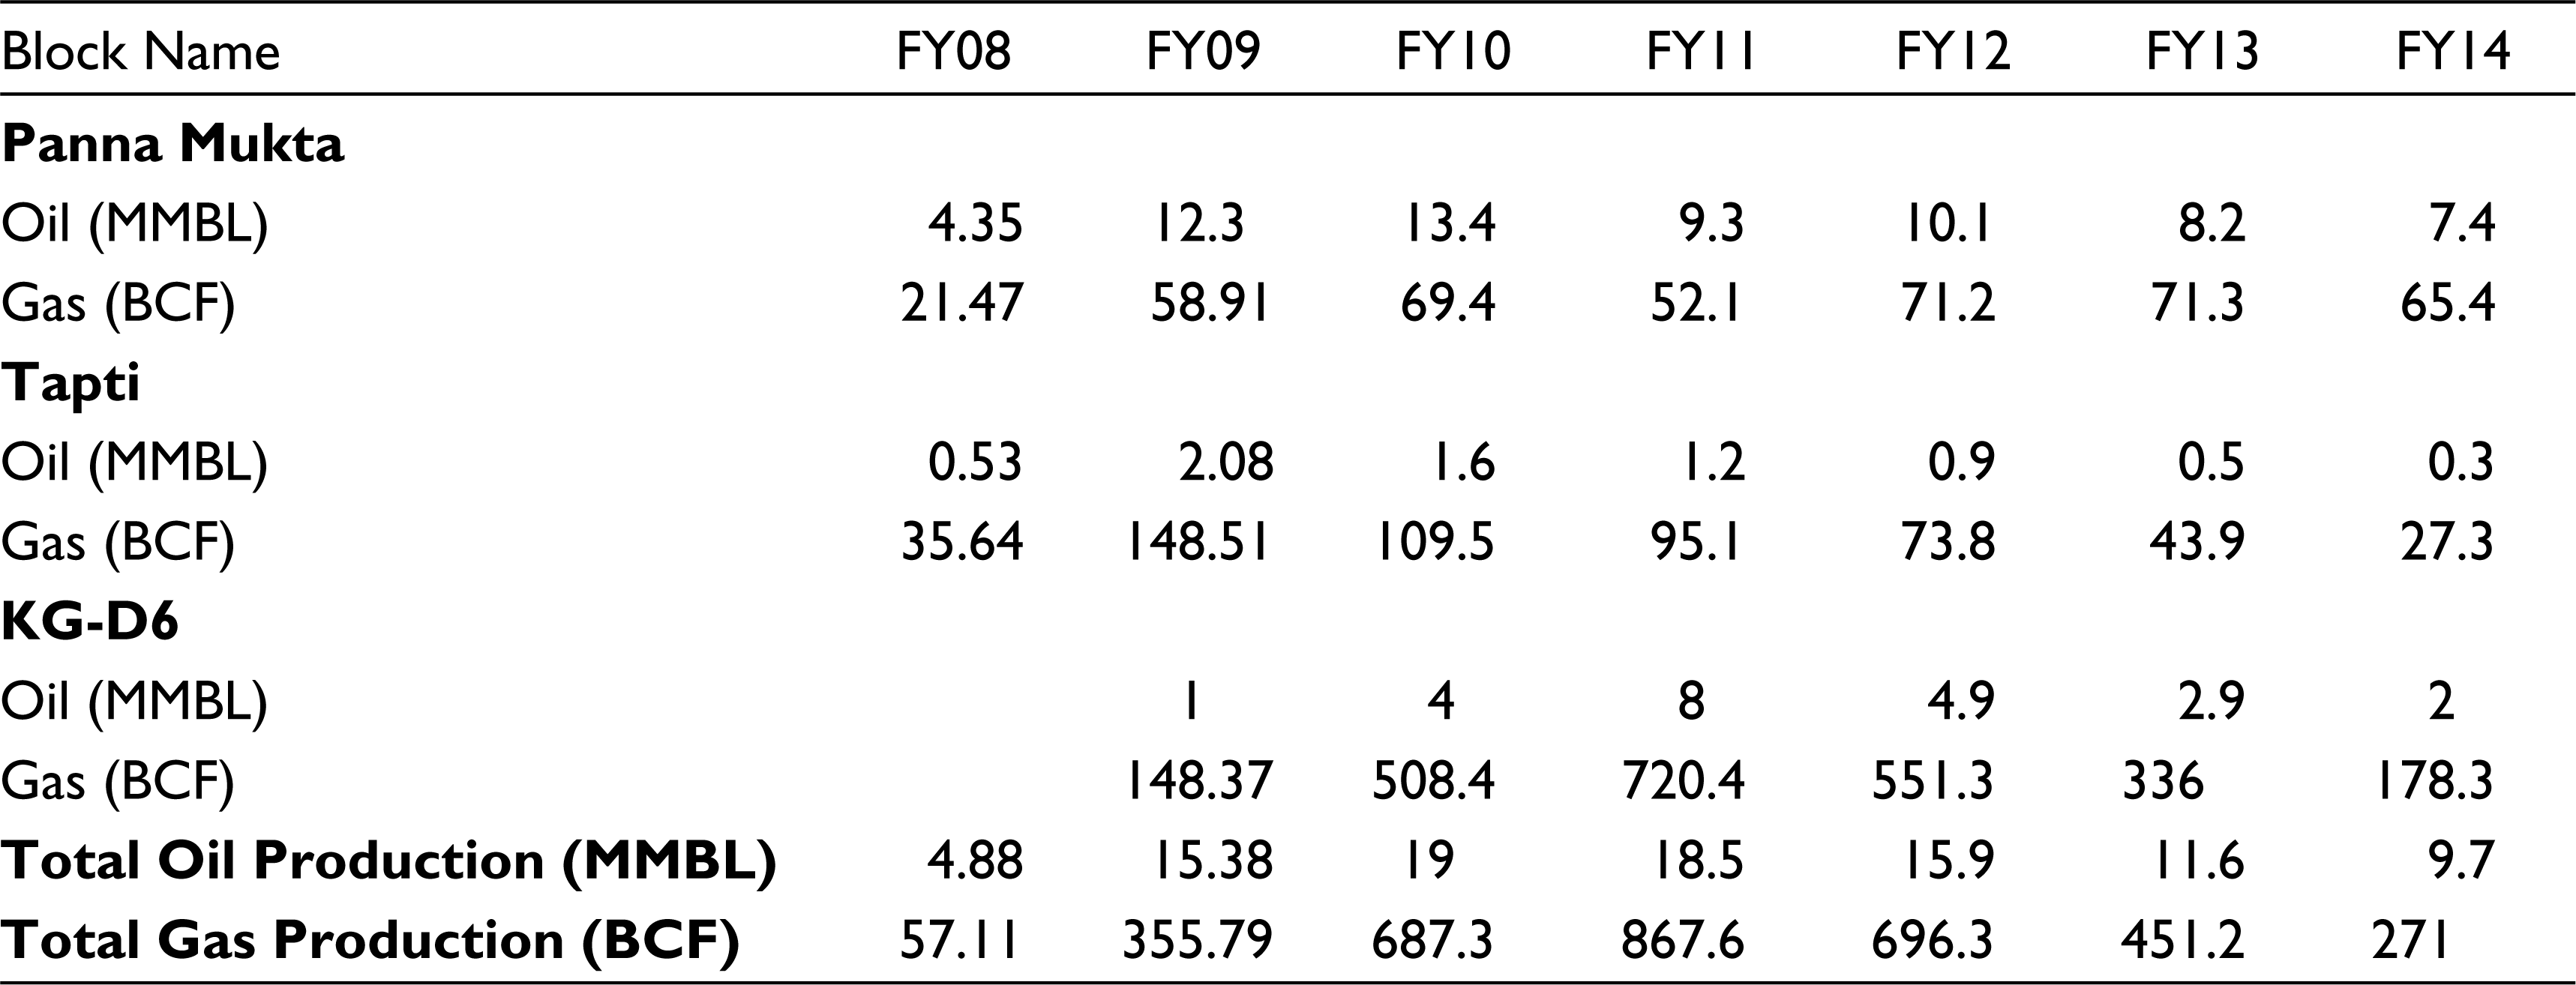
This section will seek the answer whether the strategic alliance with BP had made any impact on the RIL’s performance. For which we are doing an empirical investigation on its pre and post-alliance operating performance. To check the impact of the deal on the operating performance, we considered the oil and gas production from the RIL’s oil and gas blocks. The alliance was made in FY 2011, which was taken as a base year and three years before and after the deal was selected to gauge the performance.
RIL had three major oil and gas blocks as shown in Table 7. Total oil production was at a peak at 19 MMBL (Million Barrels) in the FY 2010. The oil output consistently increased from FY09 to FY11, while the output decreased after FY11. In the same manner, the natural gas production was high in FY 2011 and afterward, it also decreased. If we look at the performance of KG-D6, which was remotely explored by RIL and BP, it also declined after FY 2011. The shrinkage in the output happened due to the geological complexity, water regress and natural depletion, where BP could not help much in this regard. It evidently indicated that the deal with BP could not help much in lifting the production level as expected.
Oil and Gas Production Details
Financial Performance of RIL: Pre and Post Analysis of the Deal
This section deals with the pre and post-alliance financial performance of RIL. The financial performance analysis of RIL will answer the question of whether the deal made any impact on RIL. To gauge the impact of the deal we have taken the various financial measures such as sales revenue, net profit, net profit margin, earning per share (EPS), turnover per share, book value per share and return on capital employed (ROCE) which are depicted in the Table 8.
RIL’s Financial Performance (overall) Details
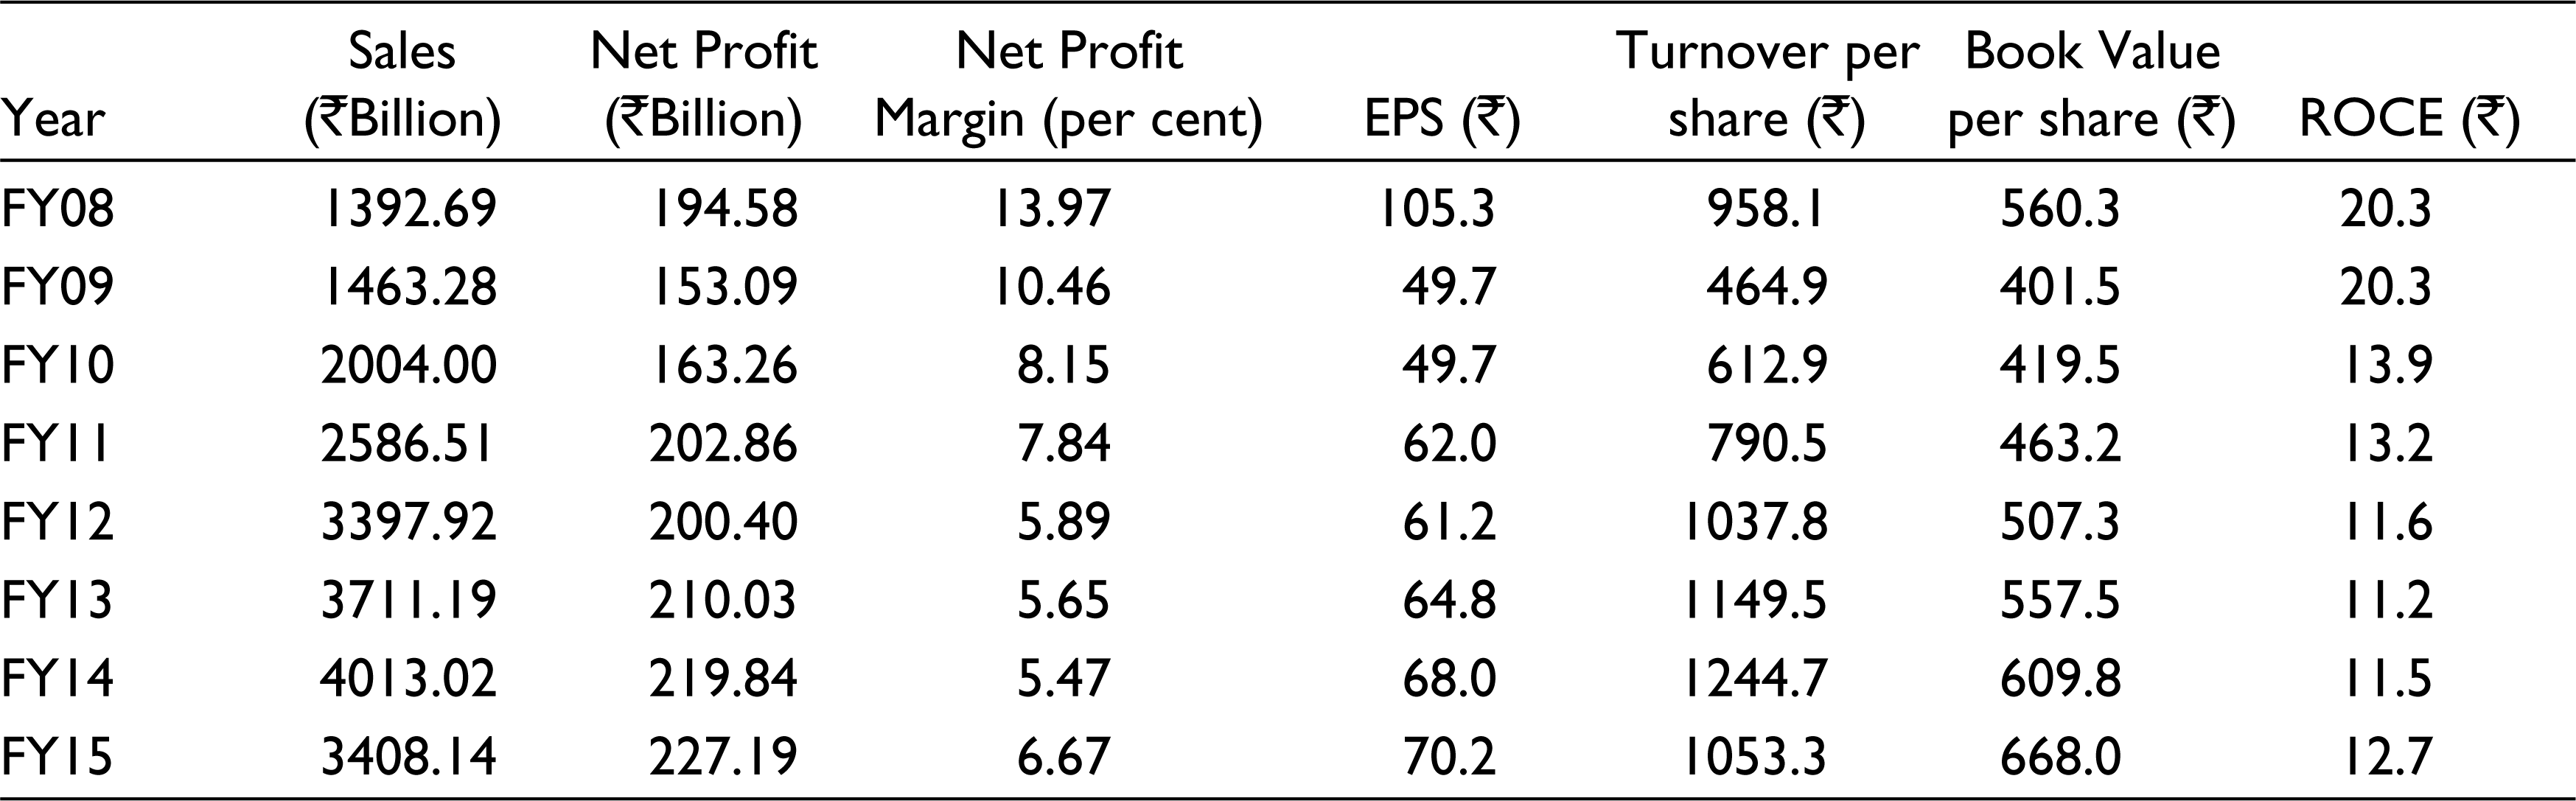
The revenue and net profit of RIL increased with a cagr of 16 per cent and 2 per cent respectively. The net profit growth was meager in comparison to the sales growth. In the same way, the net profit margin had been declining, which indicated that the expenditures had increased. Still, its net profit and EPS had grown year on year basis, but the ROCE had dropped after the alliance which implies that the capital expenditure increased and return declined. FY 2011 was taken as the base year and found that the average sales growth rate before the base year was 21 per cent, whereas during the post alliance it declined to 16 per cent. RIL’s shareholders gained significantly as its book value per share and turnover per share increased positively. The drop in the net profit growth and sales growth post-alliance happened due to the weak refining margin, lower gas prices and increased expenditure. This denoted that the deal did not make any noteworthy impact on the overall financial performance of RIL. However, we can obtain a much better picture of the impact by watching the segment-wise revenues from the operation.
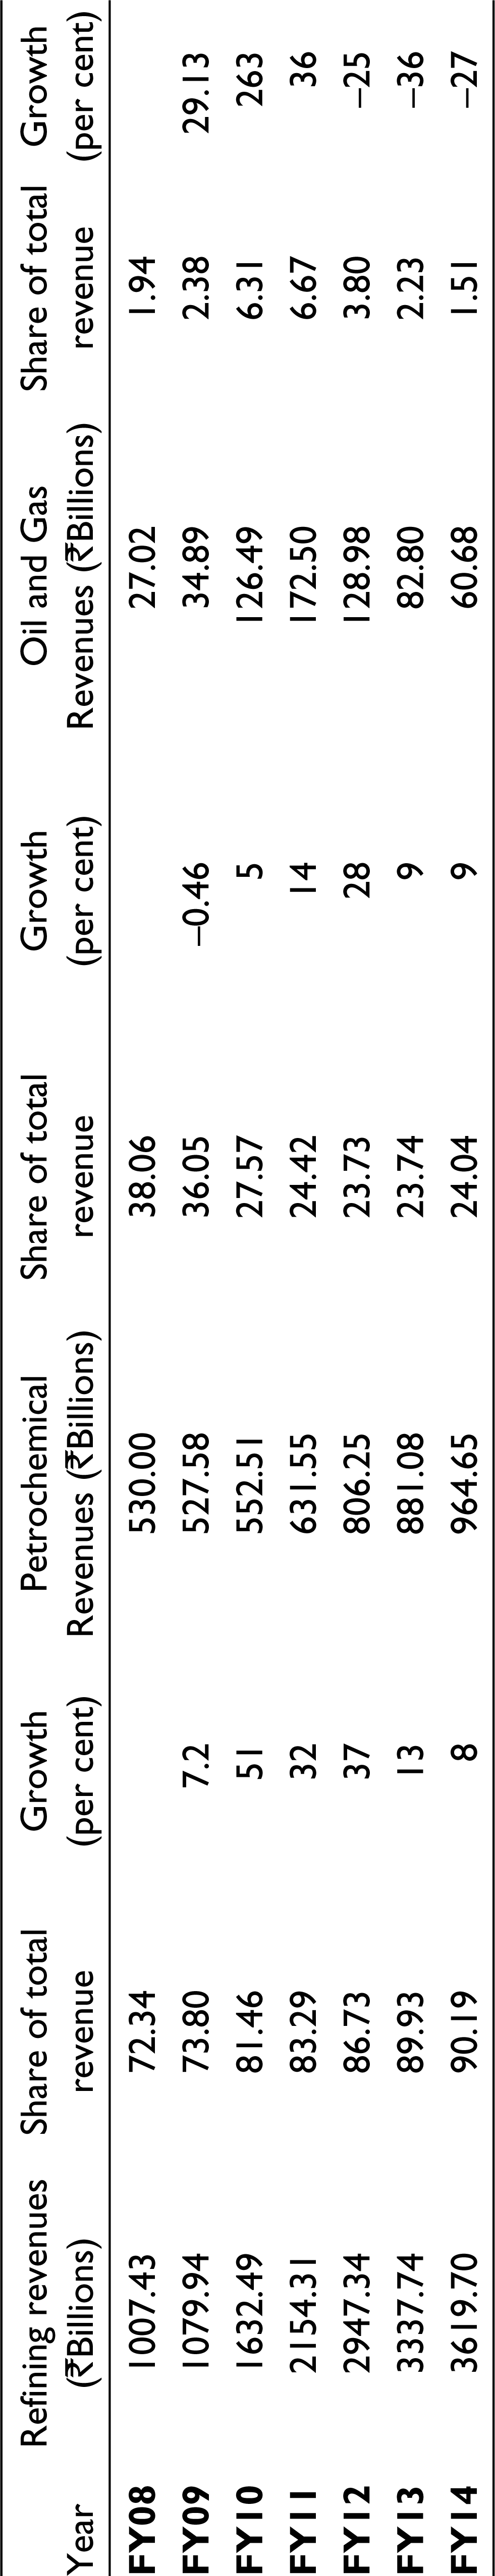
RIL had three segments of operation such as refining, petrochemicals and oil and gas. It can be observed from Table 9 that refining’s revenue share was the largest followed by the share of the petrochemical segment, while oil and gas’s revenue share was the lowest. The performance of the refining and oil and gas segments should be taken into consideration to gauge the impact of the alliance on RIL because the deal was mostly focussed on improvising the exploration, production and marketing efficiency of the oil and gas sector. The refining revenue increased consistently but at a diminishing growth rate. Similarly, the oil and gas industry was struggling since FY 2012 and after FY 2011 the rate of growth of the oil and gas sector’s revenue was negative because of the continual fall in oil and gas output and low gas prices. It meant that the oil and gas segment had not done well after the deal. Hence, it can be inferred that the deal had no significant impact on RIL post-alliance.
Segment Wise Revenue
RIL bagged massive foreign investment from the deal as BP paid $7.2 billion (INR 324 billion), which helped RIL in strengthening its balance sheet position. It can be seen in Table 10 that the company’s net worth and the reserve increased continuously, which meant that RIL improved its wealth. RIL was able to retire debt from its balance sheet due to the huge foreign fund flow from BP. But RIL’s market capitalization and net fixed assets had been stagnant and showed the sign of improvement in the FY 2014. The macro economy conditions like GDP growth rate, the price of oil and gas and interest rate also impacted the RIL’s balance sheet position.
RIL’s Balance Sheet Items

The production performance of the KG-D6 (Table 7) shows that after the alliance the production of both the oil and gas declined. It is noteworthy to mention that although RIL and BP mostly concentrate on the KG-D6, still the output fell. But the overall revenue performance of the RIL increased year on year in those six years. However, when we look at the segment of income wise, it can be found that most of the revenue came from the refining and petrochemical sector. Both the production and revenue from the oil and gas sector declined after the alliance. It showed that no short-term gain was found after the partnership deal and the impact may be realized in the long run.
Stock Return Analysis
Every restructuring activity made an impact on the stock prices of both the bidder and the target. Earlier, ample of studies (Lubatkin, 1987; Hackbarth & Morellec, 2008; Shah & Arora, 2014) had been done on the impact of mergers and acquisitions on the stock prices, but very few studies focus on the incidence of a strategic alliance on the shareholders’ wealth. This section deals with the impact of the announcement of the deal on the stock performance of RIL and BP. We used event study and market model in our case to examine the abnormal gain or loss to the shareholders of both the company. The abnormal return (AR) measures the effect of the announcement date of the alliance on the stock prices. The AR of the security on a particular date (t) can be calculated by using the market model which is shown in Exhibit 3 (Appendix). By employing the market model, abnormal gain or loss and cumulative abnormal gain or loss of RIL and BP was derived and shown in Exhibit 6 and 7 (Appendix).
RIL and BP announced their deal on the 21 of February 2011. Here the 21 of February 2011 will be taken as t = 0 and total 20 days prior to the announcement date, i.e., t = (–20) and 20 days after the announcement date, i.e., t = (+20) was taken to assess the impact of the deal on the stock. The values of α and β for RIL were calculated by regressing the RIL’s share price return (dependent variable) on Market (Sensex) return (independent variable) for an estimation window period of 06 months from the 1 of June 2010 to the 31 of December 2011. Same way BP’s share price return (dependent variable) was regressed on the market (FTSE-100) return for an estimation window period of 06 months from the 1 of June 2010 to the 31 of December 2011 to get the α and β.
RIL’s stock gained 2.98 per cent and 1.15 per cent after the announcement data whereas the benchmark index (Sensex) declined in the same period, which shows the shareholders positively reacted to the deal. The post-deal average stock return of RIL did better than the pre-deal period as shown in Table 11. The average cumulative abnormal return (CAR) for the 40 days (–20-t-20+) window period was 0.69 per cent. It signifies that the RIL’s stock outperformed the market. The mean of CAR for the 20 days before the announcement date was 0.39 while the mean CAR for 20 days post to the announcement date was 0.98 per cent, which vividly indicates that the RIL’s stock performed better in the post-announcement period. Hence, it can be said that RIL gained market value after the deal and shareholders showed confidence in the deal.
Details of the Stock Performance of RIL and BP
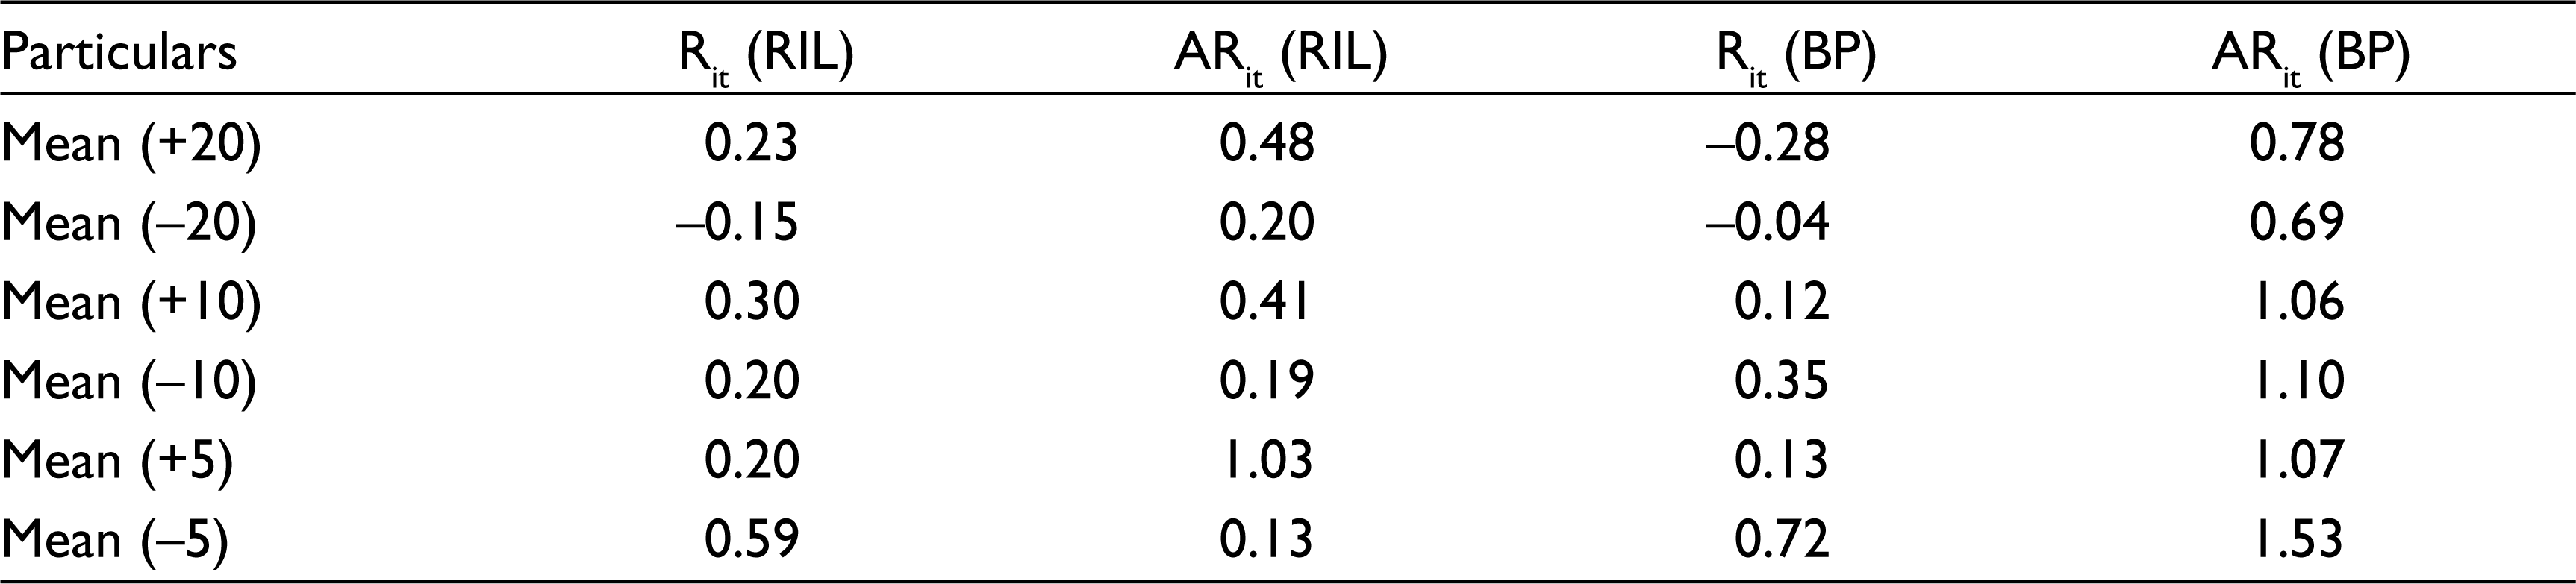
The average stock returns of the BP for the post-deal periods (+20, +10, +5) were lower than the average stock return of the pre-deal periods (–20, –10, –5). In terms of average abnormal return (AAR), BP maintained a positive AR, post the deal, while the market (FTSE-100) return was entirely negative. It indicates that BP’s stock did well in comparison to the market. The average CAR for the 40 days window period (–20 – +20) was 1.51 per cent. It denotes that BP’s stock outperformed the market. The mean CAR for the 20 days before the deal was 1.3 per cent, while the post-deal was 1.63 per cent. It vividly shows that BP’s shareholders gained better in the post-announcement period. Overall, the stock analysis of both companies indicates that they gained from the deal.
Post-Alliance Challenges
The journey of the much-anticipated deal between the BP and RIL had slowly engulfed with problems post-alliance. The political and regulatory problems grew for the RIL-BP partnership since their alliance. The first issue was the RIL’s increased investment to develop the gas fields which raised the question of its recovery of the cost. CAG (Comptroller and Auditor General) raised issues over the cost escalations made by RIL in the KG-D6 block beyond its approved spending limit which became a deep controversy for RIL. The second issue was the charges made by the CAG that RIL violated the norms of the Production Sharing Contract (PSC). Next trouble was the complaint filed by the ONGC (Oil and Natural Gas Corporation) on RIL regarding the stealing of gas from its reservoirs. Further, RIL was also charged for getting some undue favour from the UPA government and bureaucrats. RIL’s failure in reconciling the cost issues with CAG was a problem in recovering its cost.
RIL’s failure in pursuing the Indian government to increase the gas price was another matter that persisted. The revision of the gas price in India was crucial for the RIL-BP deal as they could only recover their cost with the proposed increased gas price. The cabinet approved the Rangarajan Committee pricing formula after much debate in 2013 and was to be effective from the 1 of April 2014. But was not due to the failure of UPA government in revising the gas price of $4.2 per MMBtu (million metric British thermal units) to $8.4 MMBtu as per the Domestic Natural Gas Pricing Guideline 2014 because of the stay order from the Election Commission of India in 2014. 11 It made the contractor group to file an arbitration notice on the Government of India on the 9 of May 2014. 12 Because the delay in the price revision resulted in losses to the partners and they were unable to invest further in developing the new discoveries. The legal battle of RIL with Indian government led to a loss of confidence from the current government.
Conclusion
RIL’s alliance with the BP in FY 2011 was done with many expectations to heal their problems. This case study first investigated the problems and challenges faced by RIL before the deal and furnished that RIL was facing mostly technical issues regarding oil and gas exploration in the deep-water region, which hampered its oil and gas business. Hence, RIL made a partnership deal with BP to get the technical expertise and global marketing and distribution channel. This strategic alliance was mostly justified from both the companies’ point of view before the deal due to the synergies expected. But whether these two companies achieved their expected synergies after the alliance was a matter of question. For which, we made a performance analysis of RIL.
To understand the impact of the deal, we analyzed the benefits derived by RIL in terms of operational efficiencies, financial gains and ARs from the deal. The operational performance of RIL’s oil and gas blocks indicated that their production level did not increase post-alliance. Whereas the overall performance (revenue) of RIL grew consistently, but the segment-wise revenue showed that the performance of the refining segment increased at a very slow pace, while the revenue from oil and gas segment declined post-alliance. The best outcome from the deal was that the stock price of RIL and BP outperformed the market and gained market value after the announcement of the deal.
Post-alliance, both the companies also faced legal disputes, bureaucratic problems, battle with the Indian government to increase the gas price and continual decline in the oil and gas production level. These issues blocked the projected growth rate for both the companies and the deal could not help much in this regard. It can be interpreted that the alliance did not meet their expectations, but both the parties discovered new oil and gas reservoirs in KG-D6 fields 13 to elevate the production level. Besides, the falter in the production level happened due to other reasons like geological complexities, water regress and natural depletion. Further, the oil and gas projects were long-term in nature and the benefits were mostly realized after a long time, so inference in short-term was difficult.
Footnotes
Declaration of Conflicting Interests
The authors of this case declare that there is no conflict of interest.
Funding
This research is funded and supported by the Indian Social Science Research (ICSSR), New Delhi as a part of my awarding doctoral fellowship.
Appendix
Abnormal Return and Cumulative Abnormal Return (BP)

| Day (t) | Date | BP’s share price | Rit | FTSE–100 | Rmt | E(Rit) | ARit | CAR |
| –20 | 1/24/2011 | 497.00 | –0.06 | 5943.90 | 0.81 | –0.13 | 0.07 | 0.07 |
| –19 | 1/25/2011 | 497.00 | 0.00 | 5917.70 | –0.44 | –1.29 | 1.29 | 1.36 |
| –18 | 1/26/2011 | 491.70 | –1.07 | 5969.20 | 0.87 | –0.07 | –1.00 | 0.29 |
| –17 | 1/27/2011 | 486.40 | –1.08 | 5965.10 | –0.07 | –0.94 | –0.13 | –1.13 |
| –16 | 1/28/2011 | 486.80 | 0.08 | 5881.40 | –1.40 | –2.19 | 2.27 | 2.13 |
| –15 | 1/31/2011 | 484.85 | –0.40 | 5862.90 | –0.31 | –1.17 | 0.77 | 3.04 |
| –14 | 2/1/2011 | 491.00 | 1.27 | 5957.80 | 1.62 | 0.63 | 0.64 | 1.41 |
| –13 | 2/2/2011 | 488.00 | –0.61 | 6000.10 | 0.71 | –0.22 | –0.39 | 0.25 |
| –12 | 2/3/2011 | 477.95 | –2.06 | 5983.30 | –0.28 | –1.14 | –0.92 | –1.31 |
| –11 | 2/4/2011 | 476.25 | –0.36 | 5997.40 | 0.24 | –0.66 | 0.30 | –0.61 |
| –10 | 2/7/2011 | 481.45 | 1.09 | 6051.00 | 0.89 | –0.05 | 1.14 | 1.44 |
| –9 | 2/8/2011 | 484.50 | 0.63 | 6091.30 | 0.67 | –0.26 | 0.89 | 2.03 |
| –8 | 2/9/2011 | 476.45 | –1.66 | 6052.30 | –0.64 | –1.48 | –0.19 | 0.71 |
| –7 | 2/10/2011 | 476.70 | 0.05 | 6020.00 | –0.53 | –1.38 | 1.43 | 1.24 |
| –6 | 2/11/2011 | 475.75 | –0.20 | 6062.90 | 0.71 | –0.22 | 0.02 | 1.45 |
| –5 | 2/14/2011 | 480.00 | 0.89 | 6060.10 | –0.05 | –0.92 | 1.82 | 1.83 |
| –4 | 2/15/2011 | 486.20 | 1.29 | 6037.10 | –0.38 | –1.23 | 2.53 | 4.34 |
| –3 | 2/16/2011 | 488.85 | 0.55 | 6085.30 | 0.80 | –0.14 | 0.68 | 3.21 |
| –2 | 2/17/2011 | 489.35 | 0.10 | 6087.40 | 0.03 | –0.85 | 0.95 | 1.63 |
| –1 | 2/18/2011 | 493.00 | 0.75 | 6083.00 | –0.07 | –0.95 | 1.69 | 2.64 |
| 0 | 2/21/2011 | 491.55 | –0.29 | 6014.80 | –1.12 | –1.92 | 1.63 | 3.32 |
| 1 | 2/22/2011 | 492.75 | 0.24 | 5996.80 | –0.30 | –1.16 | 1.40 | 3.03 |
| 2 | 2/23/2011 | 488.50 | –0.86 | 5923.50 | –1.22 | –2.02 | 1.16 | 2.56 |
| 3 | 2/24/2011 | 493.00 | 0.92 | 5920.00 | –0.06 | –0.94 | 1.86 | 3.01 |
| 4 | 2/25/2011 | 494.75 | 0.35 | 6001.20 | 1.37 | 0.40 | –0.04 | 1.81 |
| 5 | 2/28/2011 | 494.70 | –0.01 | 5994.00 | –0.12 | –0.99 | 0.98 | 0.94 |
| 6 | 3/1/2011 | 490.00 | –0.95 | 5935.80 | –0.97 | –1.78 | 0.83 | 1.82 |
| 7 | 3/2/2011 | 484.50 | –1.12 | 5914.90 | –0.35 | –1.21 | 0.09 | 0.92 |
| 8 | 3/3/2011 | 491.50 | 1.44 | 6005.10 | 1.52 | 0.54 | 0.91 | 0.99 |
| 9 | 3/4/2011 | 493.90 | 0.49 | 5990.40 | –0.24 | –1.11 | 1.60 | 2.50 |
| 10 | 3/7/2011 | 497.50 | 0.73 | 5973.80 | –0.28 | –1.14 | 1.87 | 3.46 |
| 11 | 3/8/2011 | 493.80 | –0.74 | 5974.80 | 0.02 | –0.86 | 0.12 | 1.99 |
| 12 | 3/9/2011 | 485.05 | –1.77 | 5937.30 | –0.63 | –1.46 | –0.31 | –0.19 |
| 13 | 3/10/2011 | 476.50 | –1.76 | 5845.30 | –1.55 | –2.32 | 0.56 | 0.25 |
| 14 | 3/11/2011 | 468.40 | –1.70 | 5828.70 | –0.28 | –1.14 | –0.56 | 0.00 |
| 15 | 3/14/2011 | 459.30 | –1.94 | 5775.20 | –0.92 | –1.73 | –0.21 | –0.76 |
| 16 | 3/15/2011 | 451.25 | –1.75 | 5695.30 | –1.38 | –2.17 | 0.42 | 0.21 |
| 17 | 3/16/2011 | 450.30 | –0.21 | 5598.20 | –1.70 | –2.47 | 2.26 | 2.67 |
| 18 | 3/17/2011 | 457.60 | 1.62 | 5696.10 | 1.75 | 0.75 | 0.87 | 3.13 |
| 19 | 3/18/2011 | 462.00 | 0.96 | 5718.10 | 0.39 | –0.52 | 1.48 | 2.35 |
| 20 | 3/21/2011 | 464.60 | 0.56 | 5786.10 | 1.19 | 0.23 | 0.34 | 1.82 |
| Mean | 1.51 |