



Abstract
The Virtual Tutorial Project (VTP) is an e-learning portal, under the Rashtriya Uchchatar Shiksha Abhiyan. Its purpose is to create an online tutorial using a digital platform based on a syllabus and problem-solving content for undergraduate students in bilingual mode (Odia and English). VTP facilitates the availability of digital content to underprivileged rural students, thereby bridging the digital divide amongst Odisha students across disciplines and universities. In this article, the SERVQUAL model along with Feedback Analysis and Google Analytics is used for the participation of the users of the VTP e-learning platform and to evaluate the users’ satisfaction with the quality of service provided by the platform. That will help in providing suggestions on improvements for better service quality. The user suggested improvements in the quality of the services to enhance user satisfaction with the digital content of the e-learning portal.
Keywords
Introduction
DIGITAL inclusion in education is achieved through digital platforms. It is commonly used to bring classroom education to the doorstep of students. Many renowned global educational institutes have started different initiatives for free universal learning using ICT tools. Stanford University has offered learning opportunities through free online courses, online degrees, graduate and professional certificates, e-learning and open courses through a variety of massive open online courses since 2013. There are many global examples, but India also started its free e-learning initiatives in the year 2003 through the National Programme on Technology Enhanced Learning, along with seven Indian Institute of Technologies and the Indian Institute of Science, which is funded by the Ministry of Education Government of India.
Under Rashtriya Uchchatar Shiksha Abhiyan, the Virtual Tutorial Project (VTP), an e-learning platform (
Although the e-learning platform experienced significant growth during the COVID-19 pandemic, not much research has focused on the measurement of e-learning systems service quality, which is crucial for platform users. The work considered in this study includes selecting an e-learning model for measurement, designing a questionnaire for user feedback, conducting data analysis to measure the system’s service quality, drawing conclusions and discussing the results and recommendations. The remainder of the article is organised as follows: The Conceptual Background of Service Quality and the SERVQUAL Model, E-learning Platform Architecture and Feedback Analysis and Google Analytics, Research Methodology, Results of the Data Analysis and finally the Conclusion and Findings of the Research.
Conceptual Background
Providing quality service to customers is essential in today’s competitive business environment. Customers will come back when good service is guaranteed. However, measuring performance against customer satisfaction is paramount. It is also necessary to measure and evaluate the service quality of the e-learning system. The SERVQUAL model, feedback analysis and Google Analytics for measuring the service quality of e-learning systems are the objectives of this study.
Utkal University E-learning Platform Architecture
The e-learning architecture is designed by keeping a search engine in the core, thus the system delivers the content according to the user requirements. It can find the required content quickly, concerning user preferences and choices.
The architecture presented in Figure 1 consists of the different stakeholders in the proposed system and dataflow among entities: Utkal University DDCE Studio, DDCE Pedagogical Team (Creator, Evaluator), Administrator (Web, Media files), Command Control Centre National Informatics Centre (NIC) New Delhi (video on demand [VOD], Media Storage server), Odisha State Data Centre (Web server, Database Server), User (Students, Lecturers and others).
DDCE Utkal University E-learning Platform Architecture.

SERVQUAL Model
The SERVQUAL model is a product of marketing research used to measure customer satisfaction with the quality of service provided. The model is a 5-dimension, 22-item framework. Figure 2 SERVQUAL claims are the five elements called RATER Figure 3 represents 22 items of the SERVQUAL model.
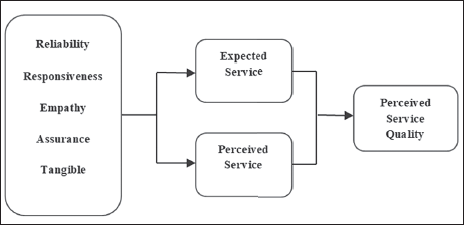

Reliability (5 items): The ability to deliver the promised service consistently and accurately.
Assurance (4 items): The knowledge level and politeness of the employees and to what extent they create trust and confidence.
Tangibles (4 items): The appearance of, for example, the building, website, equipment and employees, physical facilities, equipment and appearance of personnel.
Empathy (5 items): To what extent do the employees care and give individual attention?
Responsiveness (4 items): How happy the staff is to provide prompt service. Authors must convince both reviewers and editors of the scientific and technical value of their manuscript. Evidence requirements are higher when exceptional or unexpected results are reported.
SERVQUAL model with 5-dimension, 22-item framework.
The following equation expresses the SERVQUAL model quality function;

where SQi—perceived dimension quality; Wj—attribute importance factor; Pij—perception of dimension i in relation to attribute j; Eij—expected level of the attribute; and j, which is a normative of dimension i.
Modified SERVQUAL model; the concept of zone of tolerance (ZOT) (which stands for ZOT) to represent customer expectations.
Customers do not have a single level of expectations, but rather a range of expectations, called tolerance (Figure 4), where desired service is provided at the upper end of the scale and adequate service is provided at the lower end. If the service is acceptable, the customer is satisfied with the service, if the service he desires is above the level, he is satisfied and if it is below the acceptable level, the customer is not satisfied with the service.

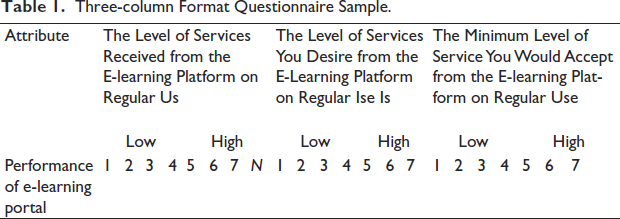
It is important to design and create a suitable questionnaire, to obtain the client’s psychometric score. Parasuraman, Zeithaml and Beny developed the three alternative questionnaire formats, as shown in Table 1 for measurement and validated these questionnaires. In his 1997 publication, they introduced the ZOT SERVQUAL model into the Information System field and defined the model in terms of four dimensions and 18 items: Reliability (5), Responsiveness (4) Assurance (4) and Empathy with (5).
Three-column Format Questionnaire Sample.
Research Methodology
Research Objectives
Using the services of Utkal University’s e-learning platform, expectations and perception gaps and tolerance zones are being investigated by conducting surveys of students and teachers and the results have to be analysed. This article aims to examine the tolerances of various attributes of service in each dimension and examine the gaps in service quality. The next stage is data analysis and discussion of results, which ultimately reveal diagnostic value and suggestions for improvement.
Data Sampling
The sample used for this study consisted of teachers and undergraduate students. Random samples were selected using the non-probabilistic expedient method. There are 420 physical forms were distributed, of which 312 were returned and 286 were helpful. Subsequently, online Forms are made available to capture data on Expectation, Perception and Minimal Service.
Questionnaire
This questionnaire uses a three-column format based on the SERVQUAL model to assess student and teacher expectations and perceptions of service and what is considered adequate or minimal service. The three-column format of Parsuraman et al. is used because of its potential diagnostic value. Items are rated on a 7-point ‘Likert scale’ (Watson and Preedy, 2010). The forms to collect psychometric scores are available at
Data Analysis and Results
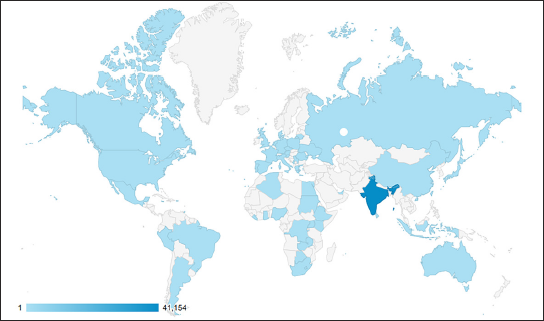
Hitherto 40 thousand users have visited the site and 15 thousand students’ downloaded e-lecturers. Alongside different states of India, the site also receives hits from different corners of the globe, USA, Australia, Singapore and other countries (Figure 5). Therefore, to further improve service quality, it is urgent to measure user satisfaction.
Visitors Statistics Across the World.
Expectations, perceptions and reasonable averages for various respondent attributes within each dimension are shown in Table 2.
Expectation, Perception and Adequate Averages.
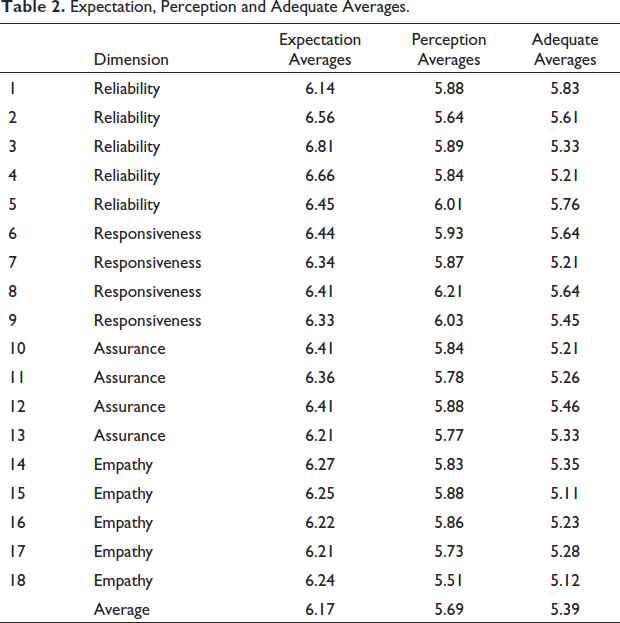
We analysed the data obtained and examined the difference between expected and perceived service for each attribute. Table 2 shows the top 10 traits with the largest gaps between expectations and perceptions. The student/teacher expectations related to questions 5, 4 and 3 of the Reliability dimensions need to be improved by the organisation. In the response dimension for questions 6 and 8, customers expect feedback on their complaints. The gap is large because they expect immediate feedback. In the Assurance aspect of question 10, customers expect the behaviour of each employee dealing with their services to inspire trust, and in the Empathy aspect of question 16, respondents believe that each employee should understand and provide a solution. Reducing these gaps can improve service quality.
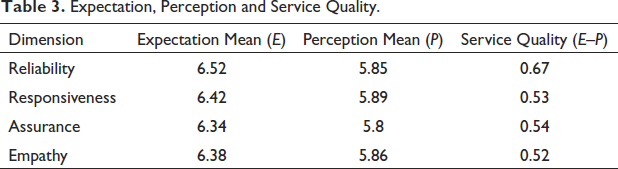
Table 3 shows the quality of service gap for each dimension SQi = ΣWj (Eij − Pij). Reliability has the highest gap, followed by Assurance, Responsiveness and Empathy.
Expectation, Perception and Service Quality.
Zone of Tolerance
Expected and reasonable averages for various dimensions are shown in Table 4. Averages of perception are acceptable. The tolerances (ZOT) for the dimensions of Responsiveness (0.94) and Reliability (1.08) are narrower than the ZOTs for Assurance (0.96) and Empathy (1.01).
Expectation, Perception and Adequate Average.
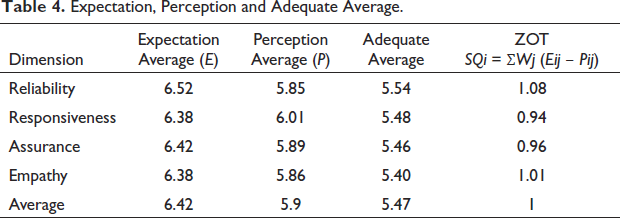
Respondents are less tolerant of Responsiveness and Assurance compared to other aspects, with respect to tolerance gaps. Also, the Responsiveness and Assurance dimensions ranked higher than the other dimensions. This means that respondents place more importance on these two dimensions. The tolerance range was found to be narrow, less than 1.5% of the scale used (7-point Likert scale). The service is acceptable, the customer is satisfied with the service, if the service he desires is above the adequate average level, he is satisfied and if it is below the acceptable level, the customer is not satisfied with the service.
Feedback Analysis
From the user’s point of view, the e-learning system focuses on the service quality of the system rather than the quality of the software product itself, so it is necessary to measure and evaluate the service quality of the e-learning system through Feedback analysis. The purpose of the feedback form is to collect customer satisfaction surveys. The feedback form is available at
Specific and actionable feedback: 23%.
Specific and somewhat actionable feedback: 17%.
Generic and non-actionable feedback: 42%.
Generic and somewhat actionable feedback: 18%.
Hierarchical Coding Framework
Figure 6 shows, that hierarchical frameworks help organise code based on their relationships to each other.

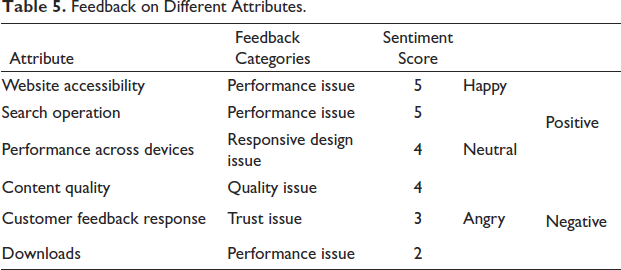
Table 4 depicts, that feedback is collected from the direct users of the platform, that is, students and teachers. It is analysed manually with a pool of 250 feedback data, with a Sentiment score of 1 –5. 1 represents Angry/Negative and 5 represents Happy/Positive (Ben, G. Best Practice for Building a Tagging Taxonomy).
Feedback on Different Attributes.
Searching For Root Causes
Positive, neutral and negative feedback are shown in Table 5. It needs to find the root cause behind it. It’s okay to ignore positive feedback, but you need to value and recognise the people behind positive reviews. For neutral and negative reviews, it is necessary to find the cause of the dissatisfied customer. For example, out of 115 negative and neutral reviews, 76 pointed to delays in downloading the e-learning content. The next step is to analyse exactly what the customers are complaining about and act accordingly.
Plan Action
The feedback root cause is presented before the VTP committee and it is decided to increase the media server storage space. Small-size e-learning files have been prepared and opted for download.
Google Analytics and Service Quality
Google Analytics provides a solid amount of data about the website (
Site Users’ Data
Google Analytics classifies users into two categories: new and returning users. From Figure 7 it is evident that 75% are new visitors and 25% are returning visitors.
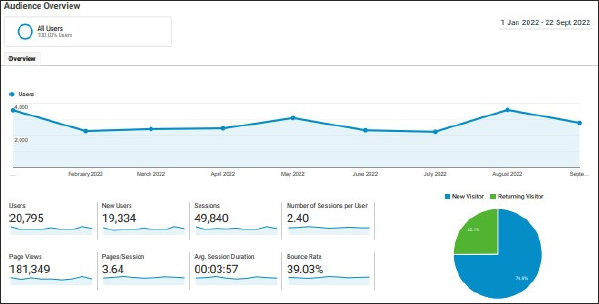
After the early days of hype of the platform, users’ statistics went down sharply and returning visitors reduced to 25%. User negative feedback was reviewed, and it was found larger media files, are one of the major drawbacks of the system. All file sizes were reduced and made available. An awareness campaign was initiated in all colleges and universities to increase student participation.
Device Type Used to Access the E-learning Platform
It was presumed that the platform is to be used by the young population and mobile penetration is very high in this age group compared to other devices. To maintain serviceable quality, Mobile First design and responsive web design were adopted to make the platform accessible to all kinds of devices. Also, ‘WCAG 2.0 “AA” (Web Content Accessibility Guidelines) by W3C (World Wide Web Consortium) (

Active Concurrent User and Quality of Service Delivery
Google Analytics defines a session as ‘a series of user interactions with your website that occur within a specific time frame’. It is a common problem of most web-based applications that the quality deteriorates with the increase of concurrent users reference Figure 9. To mitigate that scenario, session data is analysed and VM server configuration (number of CPU and RAM sizes) is enhanced (Gaur et al. 2016).
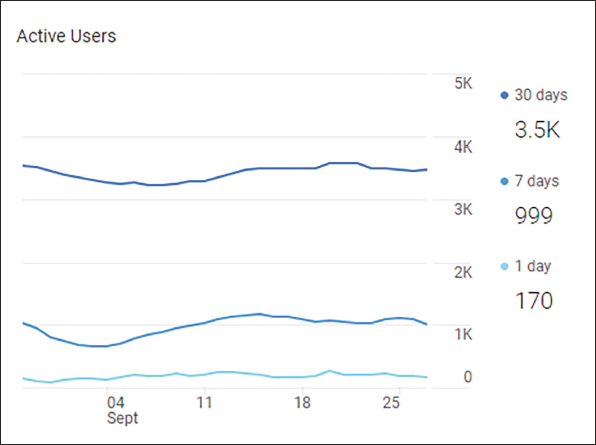
Google Analytics Users Acquisition Overview
The Google Analytics Sources metric relates to where the traffic to your website is coming from. The three traffic media in Google Analytics are measured by default at None, Referrer and Organic. Figure 10 shows traffic through social media is the lowest. A page poster was designed and published through all social media to attract users through the social media channel.
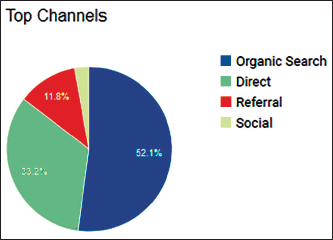
Bounce Rate
The bounce rate is the percentage of all sessions on your site that bounced. Bounce rates can be good or bad depending on the site. If your page is intended to drive traffic to other parts of your site, a high bounce rate (70% or higher) may indicate an opportunity to lower your bounce rate. Referring to Figure 9, the overall bounce rate is 39.03%, so while this scenario doesn’t require much effort, it can be reduced further.
Conclusion and Future Scope
E-learning videos published on YouTube face several issues, including copyright concerns, instances of bullying and inappropriate content. To tackle these challenges, the VTP e-learning portal was created, where all video files are hosted on the Government VOD server of the NIC. This initiative fulfils the mandate of delivering quality education to underprivileged rural areas and bridging the digital divide among rural students in Odisha across various disciplines and universities.
To gauge student satisfaction with the e-learning systems, the ZOT SERVQUAL model, in conjunction with Feedback Analysis and Google Analytics, is employed. Reducing the gaps between user expectations and their perceptions can enhance service quality. Regularly reviewing Feedback Analysis and Google Analytics data will consistently support quality improvement efforts. The feedback received regarding the enhancement of the quality of digital study materials underscores the need for DDCE Utkal University to strengthen the engagement process with proficient educators. Based on feedback and Google Analytics data, the platform is accessed from diverse locations and by individuals from various social backgrounds. Currently, the
Footnotes
Declaration of Conflicting Interests
The authors declared no potential conflicts of interest with respect to the research, authorship and/or publication of this article.
Funding
The authors received no financial support for the research, authorship and/or publication of this article.
