
Abstract
This article combines national input–output tables (1998–1999 to 2007–2008) with World Input–Output Database (1995–2011) to evaluate foreign value-added (FVA) content in India’s exports at aggregate and disaggregate levels. The results confirm rising FVA and declining domestic value added (DVA) in India’s total and merchandise exports across a majority of the commodities. India’s international fragmentation has risen but continues to be lower than that of East Asia and Association of Southeast Asian Nations (ASEAN). Strikingly, a regression-based decomposition analysis shows greater positive impact of rise in FVA on India’s export growth as compared to imports, leading to substantial net gains. Second, India’s DVA content in exports did not decline much during 2007–2011, thereby displaying a sluggish upward trend in its FVA content. This article advocates the need for striking a right balance between the goals of increasing FVA (improving linkages into global value chains) to enhance export competitiveness and maintaining DVA (supporting the ‘Make in India’ initiative) in exports to generate employment opportunities domestically.
Introduction
Today, for an emerging economy, success in international trade is principally about moving up in global value chains (GVCs) and improving export competitiveness. This has become a prime target for many countries in the wake of several ups and downs in world trade since the 2008–2009 global economic crisis. Use of imported intermediate goods has increased substantially over time, and so has the share of foreign value added (FVA) content in exports. Lowering of trade barriers and technology-led reductions in transportation and communication costs have helped. East Asia initiated and expanded GVCs in sectors ranging from textiles to machinery and automobiles and benefited from network trade (Athukorala, 2011). Studies to date have largely focused on and estimated the extent of fragmentation for merchandise exports, but such attempts are on the rise for non-manufacturing exports too. Greater digitalization and use of services in production are making countries ponder on how to get a bigger slice of the rising GVCs pie.
The existing literature addressing GVCs and related aspects is increasingly challenging the use of trade flow statistics for gauging the extent and growth of trade in view of the significant prevalence of GVCs, and the associated phenomenon of double counting of trade flows. The discussions on the cases of Apple iPod (Dedrick et al., 2010), cars (Baldwin, 2009), Barbie doll (Tempest, 1996), etc., in the literature bring out the discrepancy between gross and value-added trade (see also Ali-Yrkkö, et al., 2011 for a discussion on NOKIA N95). Thus, in many recent studies of trade performance, decomposition into value-added contributions from domestic and foreign sources using the input–output (IO) framework help bolster understanding of a country’s exports.
In view of all these considerations, it is important for emerging economies to ask how to garner greater gains from rising imported content. India is an important case to consider in this context due to its low integration into GVCs, but with rising merchandise trade to GDP ratio (a rise of 13 percentage points between 2004–2005 and 2013–2014 when it reached 42%). India’s strong services sector also contributes about 35 per cent to aggregate exports. India’s merchandise exports, as a proportion of GDP, was about 17 per cent in 2013–2014 (up by 5 percentage points from 2004–2005), reaching the highest level of US$314 billion. Although India’s exports came down in the next few years and was about US$276 billion in 2016–2017, India still maintained a decent standing in global merchandise exports as the 20th largest exporter in 2016 (Government of India, 2018; Government of India, 2015, 2017). Till 2017–2018, India’s exports (in US$) remained lower than the level reached in 2013–2014, and only in 2018–2019 did India’s exports (US$330 billion) exceed the 2013–2014 level (Government of India, 2019). It should be mentioned here that the Government of India launched the ‘Make in India’ initiative in 2015 to place India on the world map as a manufacturing hub, boost India’s exports, increase domestic value addition and attain greater technological depth in manufacturing.
Banga (2014b) has drawn attention to India’s declining domestic value-added (DVA) content in manufacturing exports, with just 1 per cent share in global value added created by exports in GVCs in 2009. This is obviously an important issue that needs investigation. This article attempts to analyse Indian exports in terms of FVA and DVA, with the analysis conducted at a disaggregated level. Cross-country comparisons and analysis of network trade are also undertaken. The article combines data from India’s national IO tables (1998–1999 to 2007–2008) and World Input–Output Database (1995–2011) for the analysis.
Over the years, different terminologies have been used in the literature to describe or refer to trade under GVCs prominently in terms of trade in parts and components (popularly called fragmentation trade or international production sharing). The terms used include value-added trade, network trade and vertical specialization (VS), among others. These terms are often used interchangeably, due to their overlapping definitions. For instance, international production fragmentation is defined as ‘cross-border dispersion of component production/assembly within vertically integrated production processes, with each country specializing in a particular stage of the production sequence’ (Athukorala & Yamashita, 2006, p. 223). Hummels et al. (2001, p. 76) mention that VS refers to ‘increasing interconnectedness of production processes in a vertical trading chain that stretches across many countries, with each country specializing in particular stages of a good’s production sequence’. They point out that other terms used for this phenomenon include ‘slicing up the value chain’, ‘outsourcing;, ‘disintegration of production’, ‘fragmentation’, ‘multi-stage production’ and ‘intra-product specialization’ (Hummels, et al., 2001, p. 76). The term VS is used to mark imported content or FVA in exports. In addition, network trade is taken as an overarching and broader term by Athukorala (2011, p. 65) who defines it as ‘trade in parts and components and final assembly within production networks’. However, and according to Banga (2014a, p. 270), ‘GVCs have increasingly been far beyond network trade, including all the activities from research and development activities to product designing, sourcing of primary products, production of intermediate products, final assembly of the product, packaging, branding and marketing of the product. These activities are all currently being split up and undertaken in different countries. A global value chain can be understood as the sequence of all functional activities required in the process of value creation involving more than one country’. She thus focuses on measuring value-added trade (domestically and foreign-based) and gains under GVCs using harmonized international IO tables. Evidently, while GVCs and value added therein have been described by different names in the literature, they all refer to fragmentation of production processes. As in the literature, in this article too, varied terms such as integration into GVCs, imported content in exports and FVA share in exports are used in the course of the discussion of the empirical results and elsewhere; the terms being connected with the fragmentation of the production processes across countries and India’s involvement in these fragmented production processes.
The rest of the article is organized as follows: the second section presents a review of literature on measuring global value-added trade with special reference to research covering context of India, followed by the third section on the methodology and data sources used for the present study. The fourth section presents estimates of domestic and foreign value-added content in India’s exports at the aggregate level and at the sectoral/industry level, especially for network products. It also contains the results of a regression analysis intended to relate changes in level of exports to changes in FVA share. The fifth section compares India’s FVA content in exports with that of other economies, followed by a concluding part summarizing the findings and drawing policy implications.
Review of Literature on Measuring Global Value-Added Trade and Studies Covering India
The literature on measurement of global value-added trade is vast and rapidly growing. Ng and Yeats (2001), Athukorala and Yamashita (2006) and Athukorala (2011) quantify the magnitude of trade in machinery parts and components—P&C (including transport and precision machinery) and final assembly, that is, network trade, by using country-specific United Nations (UN) Comtrade databases. The prevalence of much faster growth in network trade than world manufacturing trade is traced to China’s central role in final assembly. Application of gravity model shows differences in location and service link costs as important drivers for P&C trade in East Asia (Kimura et al., 2007).
In 2011–2012, South Asia recorded comparatively very low P&C exports of 8 per cent as compared to Developing East Asia (39%) and ASEAN (59%). India too continues to have lower share of network products in total manufacturing exports; in India’s case, the share was relatively low at 14 per cent in 2011–2012 as against China (57%), Taiwan and Thailand (66%), Korea (69%), Malaysia (79%), Philippines (88%), etc. (Athukorala, 2014). Sen and Srivastava (2012), Hoda and Rai (2014), and Tewari et al. (2015) have also highlighted India’s low GVC participation, even in Asian production networks. The reasons largely include greater focus on domestic markets than exports, high production and trade costs, low research and development (R&D), poor infrastructure and logistics, limited foreign direct investment (FDI) stock in manufacturing with very low value added, etc. Policy suggestions given in these studies aim to resolve these issues, strengthen micro, small and medium enterprises (MSMEs) and effectively utilize preferential trading agreements for plugging into GVCs.
Interestingly, Athukorala (2014) also reports higher share of India’s P&C imports in 2011–2012 at 22.9 per cent as compared to its exports (10.4%). This suggests India’s comparatively greater involvement in procurement of P&C for manufacturing of final goods rather than becoming a global production base. Tewari et al. (2015) emphasize significant potentials for deepening India’s engagement in ASEAN by expanding network trade in machinery, chemicals, road, vehicle, transport equipment products and telecommunications. GVCs over the years have spread beyond machinery to chemicals, metals, food products, etc.
In another strand of the literature, numerous studies have used a country’s IO transactions matrix for assessment of VS, originally proposed by Hummels et al. (2001), to capture imported intermediate goods and services embodied in exports. VS has been used as a proxy indicator to represent a country’s degree of participation in VS of trade. 1 The use of VS has also been extended further to estimate the domestic content in exports, for instance, in studies by Dean et al. (2007) and Koopman et al. (2014). Further, Jiang and Milberg (2012), using the OECD IO database, link VS with industrial upgrading using a measure which they call Import Content of Export Expansion Ratio (ICEER). The ICEER is intended to capture the magnitude of structural changes in the imported content of exports by separating those changes which are ‘purely due to the change in the propensity to vertically specialize’ after adjusting for export growth. Jiang and Milberg define vertical upgrading as ‘upgrading associated with raising the proportion of export value accruing to the domestic sector’. A negative value of ICEER associated with a decline in VS indicates structural reduction of foreign import content per unit of exports leading to vertical upgrading. They analyse eight sectors in five countries by computing VS and ICEER and find that during 1995–2005, there has been vertical upgrading in four out of the eight sectors in China and in two of the eight sectors in India: office and computing machinery and business-related services.
Similar to the concept of import content in exports, other studies covering India have measured the Import Intensity of Exports (IIE). IO tables have been used in most of these studies (see Table 1), while others have used the Annual Survey of Industries (ASI) and company databases. IIE is calculated as the share of imported inputs in the country’s exports. Bhattacharya (1989) shows a decline in IIE in the 1970s, while Sathe (1995) reports an upward trend. Bhat et al. (2007) find a rise in IIE for manufacturing and the aggregate economy in the late 1990s as compared to the early 1990s. Goldar (2013) finds a substantial rise in IIE for manufacturing between 1993–1994 and 2006–2007. He holds changes in composition of exports towards more import-intensive products as a major reason for the rise in IIE. Burange (2001) and Goldar (2013) have undertaken analysis of import intensity of firms using data on manufacturing companies. Burange finds a rise in import intensity between 1991–1992 and 1996–1997. Goldar similarly finds a rise in import intensity of manufacturing firms between 1999–2000 and 2010–2011, especially among exporting firms. Evidently, the findings of various studies done on IIE and import intensity of manufacturing firms in India manifest gradually rising GVC linkages.
It should be pointed out that IIE trends in India during the decade of the 2000s have not been adequately covered in the literature. Indeed, excluding Goldar (2013), none of the other studies included in Table 1 covers this period. The decade of the 2000s is, however, analysed in a recent study by Veeramani and Dhir (2019), which covers the period from 1999–2000 to 2012–2013. They have computed the value added to gross exports (VAX) ratio, that is, the ratio of DVA to gross exports, for different years during the study period. They have used official IO tables and supply-use tables, and have resorted to interpolation when such tables are not available. They find a fall in the ratio of DVA to aggregate exports (merchandise plus service) from 0.86 in 1999–2000 to 0.81 in 2005–2006 and then to 0.65 by 2012–2013.
Over the years, there has been an increase in the use of harmonized international IO tables to estimate value-added exports; in fact, IO tables are combined with bilateral trade data by using different data sets such as the Global Trade Analysis Project (GTAP). The latter has been used by several studies: by Daudin et al. (2011) who measure value-added trade as equal to global trade minus VS and VS1* (measure of domestic content of imports [consumed or invested]: ‘defined as the exports that, further down the production chain, are embedded in re-imported goods that are either consumed, invested, or used as inputs for domestic final’ [p. 1408]), by Johnson and Noguera (2012a) who use VAX ratio as measure of intensity of production sharing, and by Koopman et al. (2014) while decomposing a country’s exports into DVA and FVA, etc. Johnson and Noguera (2012b) report declining VAX ratio for manufacturing, in contrast to an upward trend in VAX ratio for services and agriculture sectors. Further, according to them, VAX ratio declined for fast-growing countries undergoing structural transformation towards manufacturing. Many countries, at aggregate level, experienced a decline in the ratio during 1970–2009 by more than 10 percentage points, indicating a rise in fragmentation. For India too, the ratio declined by 17 percentage points.
Review of Past Studies on India’s IIE

In the more recent period, the IO tables from OECD–World Trade Organization (WTO) Trade in Value Added (TiVA) database and World Input–Output Database (WIOD) have found frequent use in the studies capturing value-added trade under GVCs, among others. TiVA 2018, the latest version, provides data for the period from 2005 to 2015–2016 for 64 countries involving 36 industries; however, its previous versions of 2013 and 2015 have been used in several studies (covering the period from 1995 to 2009–2011), for instance, Ahmad (2015) for OECD and non-OECD countries including India. Banga (2014a), using TiVA, shows that creation of 67 per cent of value under GVCs was by the OECD, while developing countries (excluding newly industrialized Countries—NICs and Brazil, Russia, India, China and South Africa—BRICS) and least developed countries (LDCs) accounted only for 8 per cent in 2009. She notes that forward to backward linkages in the GVCs 2 ratio for India and other developing nations like Thailand, Vietnam, Malaysia and Philippines are less than 1, indicating negative net value-added gains. The empirical analyses undertaken by Banga (2014b) and Gupta (2015) display declining share of India’s DVA content of exports in its gross exports, falling from 90 per cent in 1995 to 78 per cent in 2009, even in traditional export-oriented industries. Gupta (2016) presents the results for the period 1995–2011 for textiles and machinery industries. These studies assert that there is lack of gainful GVC linkages for Indian manufacturing with falling DVA even for industries where India is locked out of GVCs.
WIOD (Timmer et al., 2015) has wider sector coverage than TiVA and has been gaining more popularity (see, for instance, the study of Johnson (2014), which highlights facts based on the large differences between gross and value-added exports, which are unevenly distributed across countries, sectors and bilateral trade partners). Some studies portray changes in global pattern of GVCs. To give an example, Baldwin and Lopez-Gonzales (2015) show how Factory Asia evolved from 1995 to 2009 and focus on using the concept of ‘Importing to Produce’ than ‘Importing to Export’. Similarly, Costinot and Rodríguez-Clare (2014), using WIOD, find that the magnitude of gains from trade liberalization is impacted by a number of factors, including economic parameters of trade in intermediates. Most of the studies based on WIOD have undertaken research at the global level rather than for particular economies like the emerging ones. WIOD, unlike TiVA, has not been explored much for studying India’s participation in value chains. There are only a few exceptions like Banga (2016) who has calculated India’s FVA content of output and linkages in GVCs at the aggregate level using both TiVA and WIOD.
Banga (2014a) and Gupta (2015) postulate that rising FVA content may displace domestic industries supplying inputs and adversely affect their workers. Banga (2016) further shows the net adverse impact of GVC participation on employment growth in Indian manufacturing. But, Goldberg et al. (2010) and Topalova and Khandelwal (2011) for India, and Amiti and Konings (2007) for Indonesia, show how improved access to imported inputs, through fall in input tariffs, leads to productivity gains in domestic industries, as it enables better usage of technologies embodied in imported intermediates and introduction of new domestic varieties. As per the studies of Bas (2012) for Argentina and Feng et al. (2016) for China, the rising imported inputs help improve firms’ export performance. Feng et al. (2016) mention that the ‘firms that expanded their intermediate input imports expanded the volume and scope of their exports’, and they stress on greater effects when inputs are bought by private Chinese firms or by those who started as non-traders. Bas (2012) underscores higher chances for getting into exports for firms in industries with higher tariff cuts. However, such studies are largely missing for India.
To summarize, our review of the literature points to research gaps on the FVA content of India’s exports, particularly that the trends in the 2000s have not been adequately covered by using national and international IO tables (apart from the similar work of Veeramani and Dhir [2019]). Thus, this article attempts to fill the gap by estimating India’s DVA and FVA content in exports (aggregate and sector-wise), using both national IO and WIOD, and carrying out further analysis based on these estimates, particularly investigating the impact of rise in FVA share. Such an analysis is of value for the Indian economy to get a better understanding of how much India has progressed in moving up value chains in terms of imported (FVA) content of exports and how much of the value added is being generated domestically, some of which are also then exported to other countries. This is so because rising exports do not always mean an equivalent rise in a country’s production. The value-added component then becomes critical, particularly for developing countries like India, which are still stuck at lower stages of GVCs (Banga, 2014a; Gupta, 2015). Second, whether a rise in imported content is benefitting Indian exports is important to quantify to get a handle on India’s exact linkages into GVCs value-added wise. This justifies the need for the present study.
Methodology and Data Sources
Domestic content (DVA) in exports depicts the contribution of domestic sectors to the supply chains and value added of a country, whereas foreign content (or import content/FVA) in exports provides an estimate of the trade between countries participating in global production chains.
In this article, estimates of domestic and imported contents in India’s exports are based on the Hummels et al.’s (2001) approach (HIY approach). For applying this method, three IO tables are used. These are three national (official) benchmark commodity × commodity IO tables (IOT) of 1998–1999 (with 115 commodities), 2003–2004 and 2007–2008 (with 130 commodities), as published every 4–5 years by the Central Statistics Office (CSO), Ministry of Statistics and Programme Implementation, Government of India.
3
IO tables incorporate services too, and hence the FVA content of services exports are also computed along with FVA content of merchandise exports. Under the HIY approach, a value-based IO table shows:
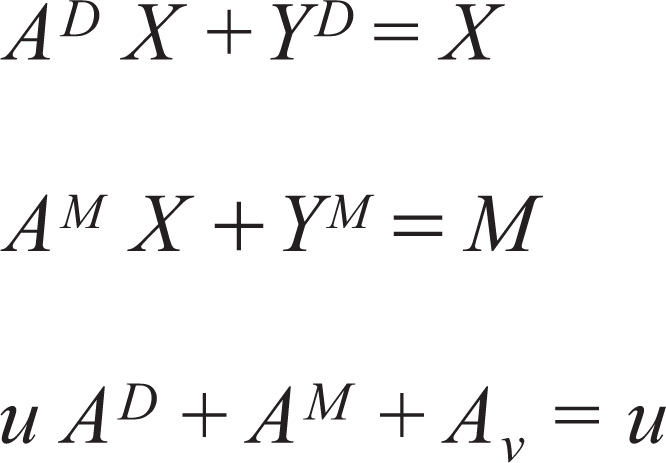
Each IO matrix is split into the flows of domestic production and imports. AD and AM are n × n flow matrix of input coefficients of domestic products and of imported products, respectively. YD is 1 × n vector of final demands for domestically produced products (including usage of gross capital formation, private and public final consumption and gross exports), and YM is n × 1 vector of final demands for imported products (including usage of gross capital formation, private and public final consumption). X and M are respective n × 1 vectors of gross output and imports. Av is 1 × n vector of each sector j’s ratio of value added to gross output, and u is 1 × n unity vector.
To explain the method of computation further, in the first step, total import of each product category was first distributed into intermediate input and final consumption, respectively, using Inter-Industry Use (IIUSE), Private Final Consumption Expenditure (PFCE) and Government Final Consumption Expenditure (GFCE) ratios. Imported intermediate input was then subtracted from total IIUSE to get domestic intermediate input. Thereafter, the commodity × commodity flow IO matrix was split into the flow of domestic production and the flow of imported inputs using imported intermediate input and domestic intermediate input.
Following Equation (1), DVS = {dvsj} is 1 × n vector of share of domestic content, that is, the additional domestic value added generated by one additional unit of final demand of domestic products.

Accordingly, a vector of share of foreign content, FVS = u – DVS, shows the VS of trade as mentioned by HIY approach
4
and can be defined as (using Equation [1]):

For each industry, this is the column sum of the coefficient matrix for total intermediate import requirement.
From Equations (2) and (3), DVS of total exports = =
FVS of total exports =
These are the value-added shares in total exports, where E is n × 1 vector of exports and Ex, a scalar, is sum of exports across the n sectors.
In addition to using the three aforementioned national IO tables for India, this article employs data for India and other emerging economies, particularly China, Brazil and Indonesia, from the WIOD, 5 which helps in making international comparisons. WIOD provides a consistent set of tables of domestic and import flows to facilitate comparison across countries over time. This article uses the 2013 version of WIOD, which covered 40 countries and reported data for different years between 1995 and 2011 involving 35 sectors. 6 Accordingly, IO tables for the years 1995, 1998, 2000, 2003, 2007, 2008 and 2011 are selected for the analysis.
Trends in Value-added Content in India’s Exports
This section presents the estimates of domestic and foreign value-added content in India’s exports, at the aggregate and sector level. Also, trends in India’s trade in network products are analysed.
Domestic and Foreign Content in India’s Exports: Aggregate Level
Based on WIOD, the share of DVS in India’s gross exports has experienced a steady decline from 89 per cent in 1995 to about 78 per cent in 2011 (Figure 1). The foreign content in exports has thus increased by about 11 percentage points, reflecting a trend of India’s rising production fragmentation and integration into GVCs. TiVA database also provides similar results. According to TiVA data, the share of FVS in India’s total exports was 10 per cent in 1995, 13 per cent in 2000, 20 per cent in 2005, 22 per cent in 2009 and 24 per cent in 2011 7 (rise of 14 percentage points during 1995–2011).
Turning to merchandise and services exports, FVS computed on the basis of WIOD portrays an upward trend for both of them, but a relatively much greater rise is there for merchandise exports, by 15 percentage points between 1995 and 2011 (Table 2). This is higher than the rise in the economy’s total FVS. By contrast, the share increased by just 2 percentage points over the same period for services exports, which may be indicative of their lower GVC integration that has not undergone much increase over time.

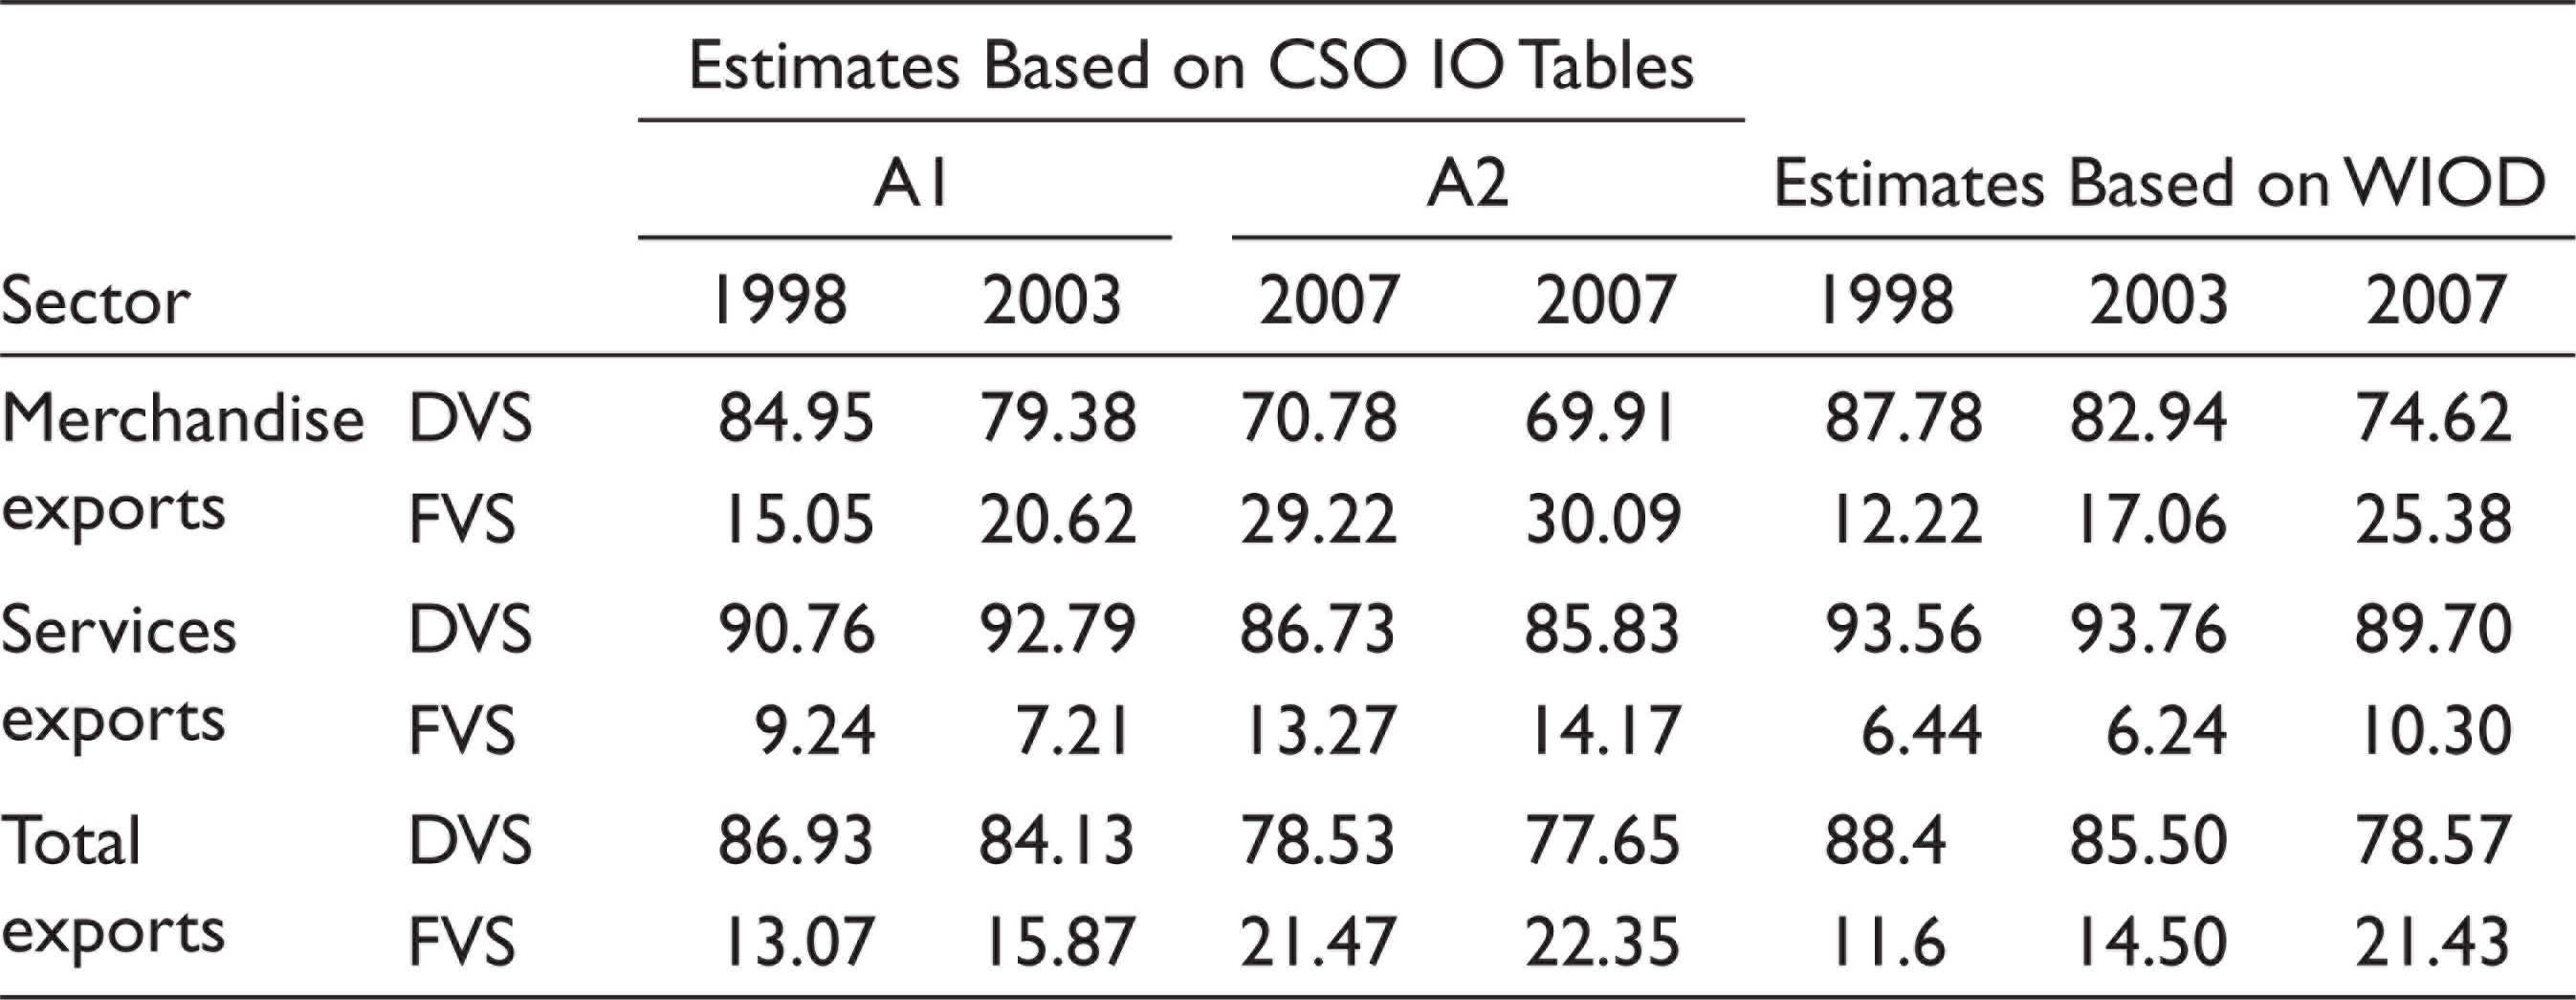
Importantly, it appears that India’s participation in GVCs was affected by the 2008–2009 global economic crisis, prompting domestic enterprises to increase domestic content in their exports of both goods and services. This is reflected in the slight decline in FVS of merchandise and services exports (i.e., rise in DVS) after 2009 and 2007, respectively, by 1.5 and 1.8 percentage points (refer to Table 2, which is based on WIOD). Table 3 specifically shows trends for the selected years 1998, 2003 and 2007 to support the assertion that there was a downward trend in DVS (hence, an upward trend in FVS) till 2007. It is significant to note that CSO-IOT-based results are largely in line with WIOD-based results.
DVS and FVS in India’s Merchandise and Services Exports (%)

Comparison of Estimates of Domestic and Foreign Value Added in Exports (%)
Domestic and Foreign Content in India’s Exports: Disaggregate Level
A disaggregate-level analysis based on India’s IO tables (CSO) also substantiates increasing FVA share (FVS) in India’s exports from 1998–1999 to 2007–2008 for a majority of the sectors, particularly more so in manufacturing as compared to agriculture and services. Second, the analysis reveals a great deal of variations in the extent of fragmentation across commodities (Table A1). In 2007–2008, petroleum products, ships and boat (building and repair), and aircraft and spacecraft had very high FVS in exports. The FVA shares in exports in these cases were well above the average FVS of all commodities. Other products with relatively high FVS included fertilizers, coal tar products, inorganic and organic heavy chemicals, non-ferrous basic metals, electric wires and cables, and communication equipment. By contrast, trade, insurance, computer and related services, fruits, vegetables, milk products and poultry products had relatively low import content in exports (below 5%).
Some commodities like petroleum products are expected to have low DVA share and high FVA share as most countries have deficits in domestic oil production, whereas manufacturing of food products is likely to have relatively low FVA share as most of the intermediate inputs in production process are supplied from local sources. But, India’s FVA share in food products has been increasing over time, which clearly shows pervasiveness of international fragmentation. The DVA share declined even for traditional export-oriented sectors such as textiles, leather and food processing, and a decline in DVS took place also in drugs and medicines and automobile and ancillaries, which are important export items of India. During the period from 1998–1999 to 2007–2008, the largest rise in imported content in exports occurred in ships and boats (65 percentage points increase), followed by petroleum products and fertilizers (increase by 25 percentage points in each case).
Impact of Rise in Foreign Value Added: Regression Analysis
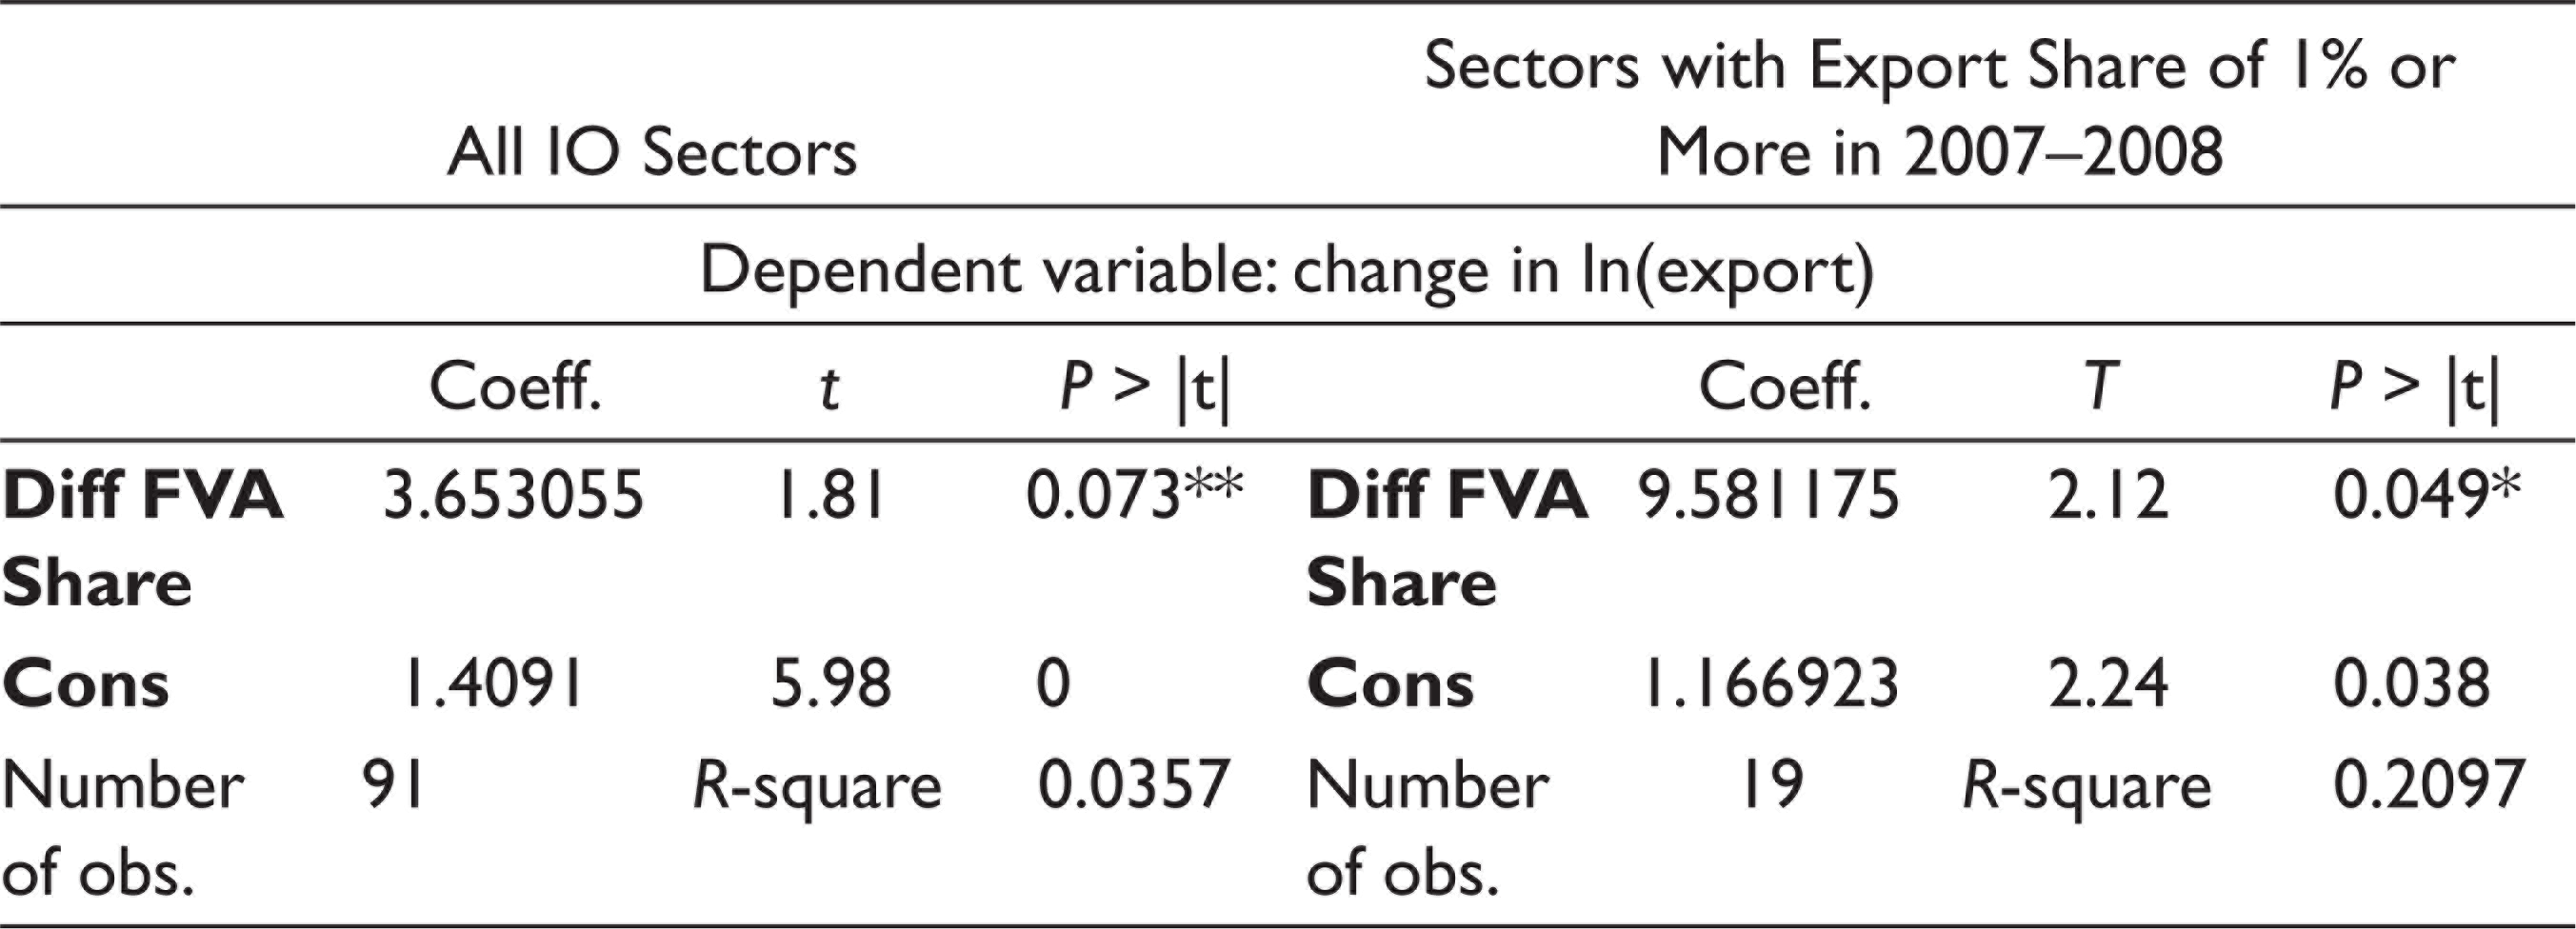
This article undertakes a cross-sectional regression analysis to ascertain whether a rise in FVS content in exports of India is accompanied by an increase in its level of exports, that is, regress changes in exports on changes in FVA (see Table 4). Change in logarithm of exports and change in FVA share in exports between 1998–1999 and 2007–2008 are considered for the analysis. That is, change in exports is taken as the dependent variable and change in FVA shares as the independent variable. This simple regression analysis is adopted as a possible method to use to study and summarize the relation between two variables, FVA hike and export growth, ceteris paribus. It must be recognized that the model specification has severe limitations. The focus is only on FVA, and thus many other important determinants of export growth such as FDI, state of technology, level of skills, etc., have been excluded from analysis, in order to get just a direct bilateral relationship between the rise in FVA shares in exports and consequent rise in exports. The equation used is thus (v is the error term, and α and β are parameters to be estimated):

The cross-sectional regression analysis is done at the two levels: first, for all IO sectors (regression [1]) and then with only those sectors which had export shares of one per cent or more during 2007–2008 (regression [2]). The results of regression (1) presented in Table 4 show a significant positive effect of FVA on India’s exports.
For robust estimates, regression analysis (2) is undertaken (Table 4). This is done with only those sectors that had export shares of 1 per cent or more in 2007–2008. This case presents a stronger positive relation between changes in FVS and changes in India’s exports, that is, the regression coefficient is statistically significant at 5 per cent. Comparing the two regressions, the first shows that a 1 percentage point increase in FVS would lead to an increase in exports by over 3 percentage points, while the second regression, with sectors having greater export potential, show greater impact with more than 9 percentage points increase in exports. All these signal that greater integration into global economy, as reflected in FVA shares, has helped India to increase its exports. Nevertheless, as noted earlier, this is not a comprehensive and econometrically strong result as many other variables such as FDI, technology, etc., have been excluded, but, still, this is perhaps one of the useful ways to judge whether rising imported content has been advantageous for India or not.
Change in FVA Share and Exports: Cross-section Regression Analysis (1998–1999 to 2007–2008)
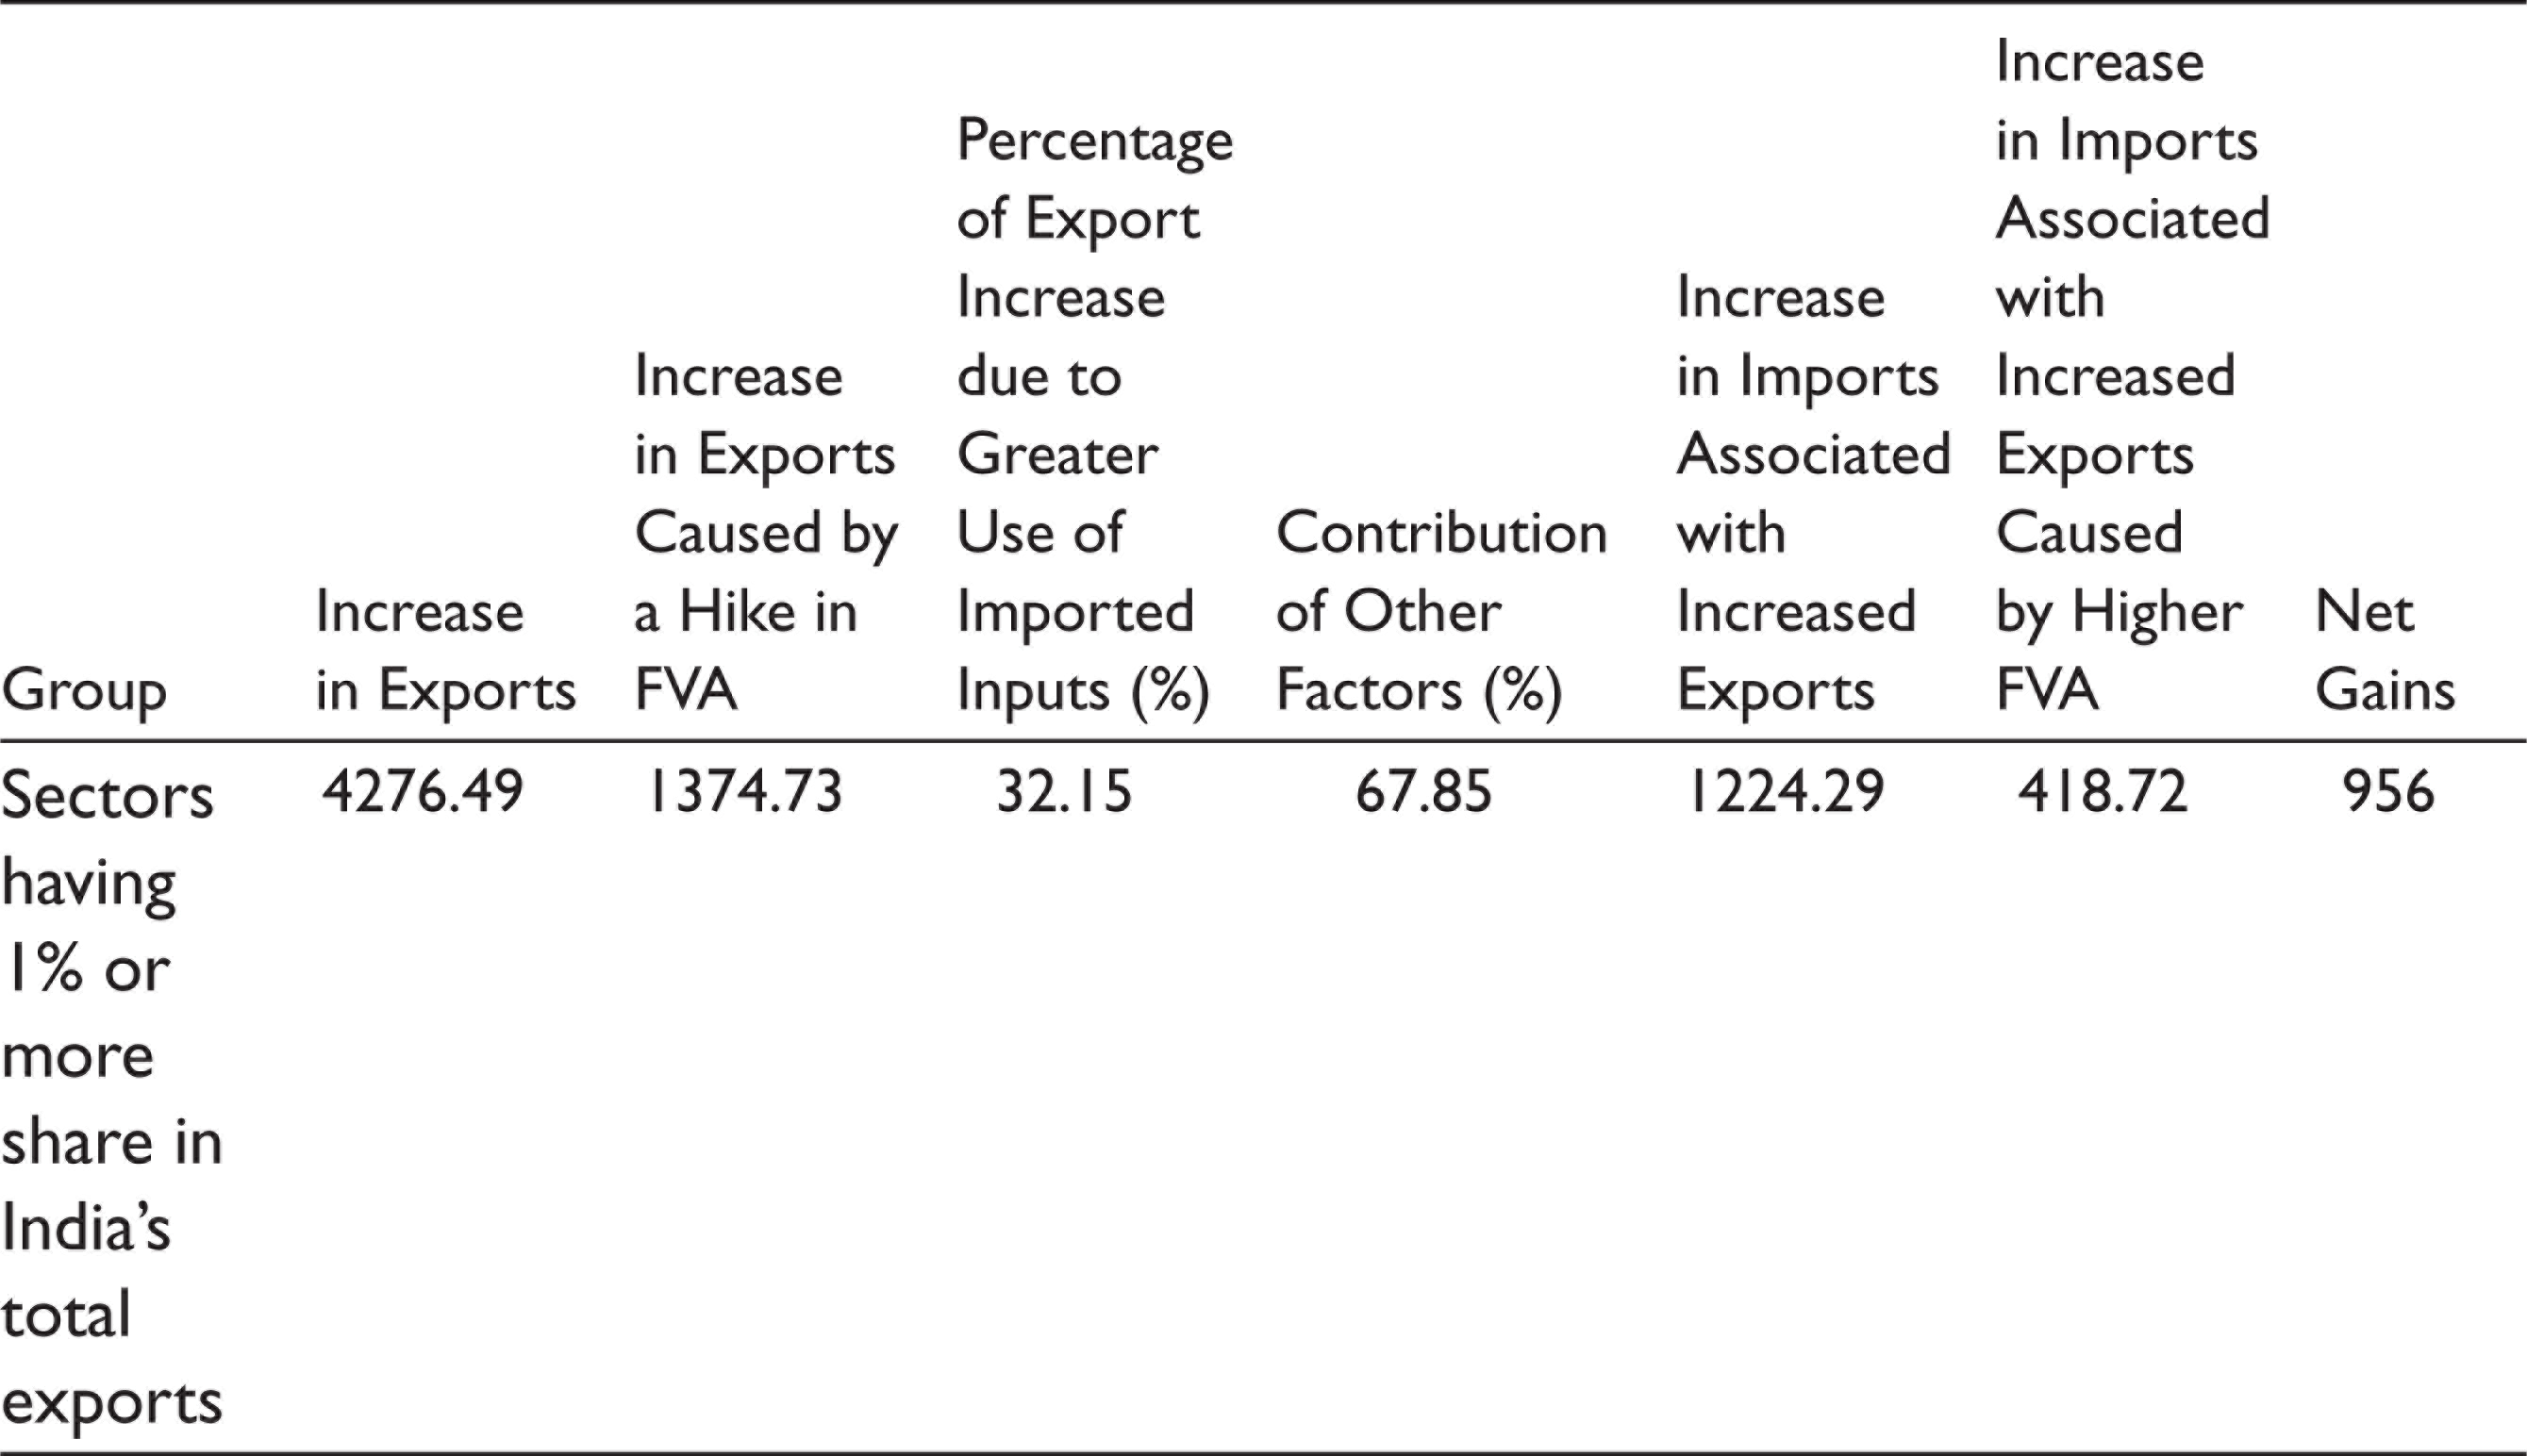
As an interesting exercise based on the results of regression analysis, the article further explores whether the addition to exports associated with a rise (or hike) in FVA content exceeds the increase in imports due to such a rise. If this does not hold true, then the rise in imported content may adversely affect domestic industries and their value-added component in the long run. Accordingly, the article undertakes a decomposition analysis for the period from 1998–1999 to 2007–2008 by taking only IO sectors with relatively greater export potential considered in the aforementioned second regression.
The analysis reveals that, ceteris paribus, greater use of imported inputs has increased exports by ₹1,375 billion (using regression coefficient in Table 4), accounting to a rise of 32 per cent. More exports led to increase in imports, and thus a rise of about ₹419 billion occurred due to the additional exports traceable to the rising FVA. Thus, increase in imports due to FVS hike is found to be much less as compared to the increase in exports caused by the same, thereby resulting in substantial net gains of ₹956 billion. Decomposition analysis thus indicates that benefits for India in terms of increased exports, owing to greater use of imported content, are likely to more than offset the adverse impact on the economy, arising from displacement of indigenous procurement by increased imports of intermediate inputs. The above conclusion, that an increase in FVA content in exports causes the value of exports in India to increase more than the value of related imports and thus leads to a net gain, is crucially dependent on the numerical value of the estimated regression coefficient. Since a rather simple model has been estimated and important determinants of export performance have not been included in the analysis, there is scope to expect a bias in the estimated regression coefficient. Note, however, that if there is a downward bias in the coefficient, or if the bias is positive but small, then the earlier conclusion about the net gain arising from a hike in FVA content will still hold. It is difficult to ascertain with confidence the direction and extent of bias in the estimated regression coefficient arising from the exclusion of important determinants of export growth. But, it seems it would not be wrong to say that despite the limitations of the regression analysis acknowledged earlier, the results of decomposition analysis perhaps point in the right direction.
Change in Exports at an Aggregate Level from 1998–1999 to 2007–2008: Decomposition Analysis (values in ₹ billion)
In this connection, it is important to note that Veeramani and Dhir (2019), in their recent paper, have examined econometrically the impact of change in VAX ratio on the absolute level of India’s exports, taking into account the influence of several other explanatory variables. They have used panel data; IO sector-wise data for different years in the period from 1999–2000 to 2012–2013 are used. They have used an alternate specification of the model and different methods of model estimation. Their results indicate a negative effect of the VAX ratio on the level of exports. The estimated coefficient is found to be statistically significant. This is in line with the results reported in Table 4. Based on their econometric analysis, Veeramani and Dhir (2019) come to the conclusion that a greater participation in the global production system (reflected in a fall in the VAX ratio) leads to higher absolute levels of exports, DVA and employment.
Analysis of Trends in Trade for Network Products
This subsection further analyses the trends in import and export intensity in respect of selected product categories, which have a relatively greater scope for global production sharing and network trade. Following Athukorala (2011), 14 such product categories, hereafter referred to as ‘network product groups’, 8 are selected—mainly concentrated in machinery and transport equipment sectors.
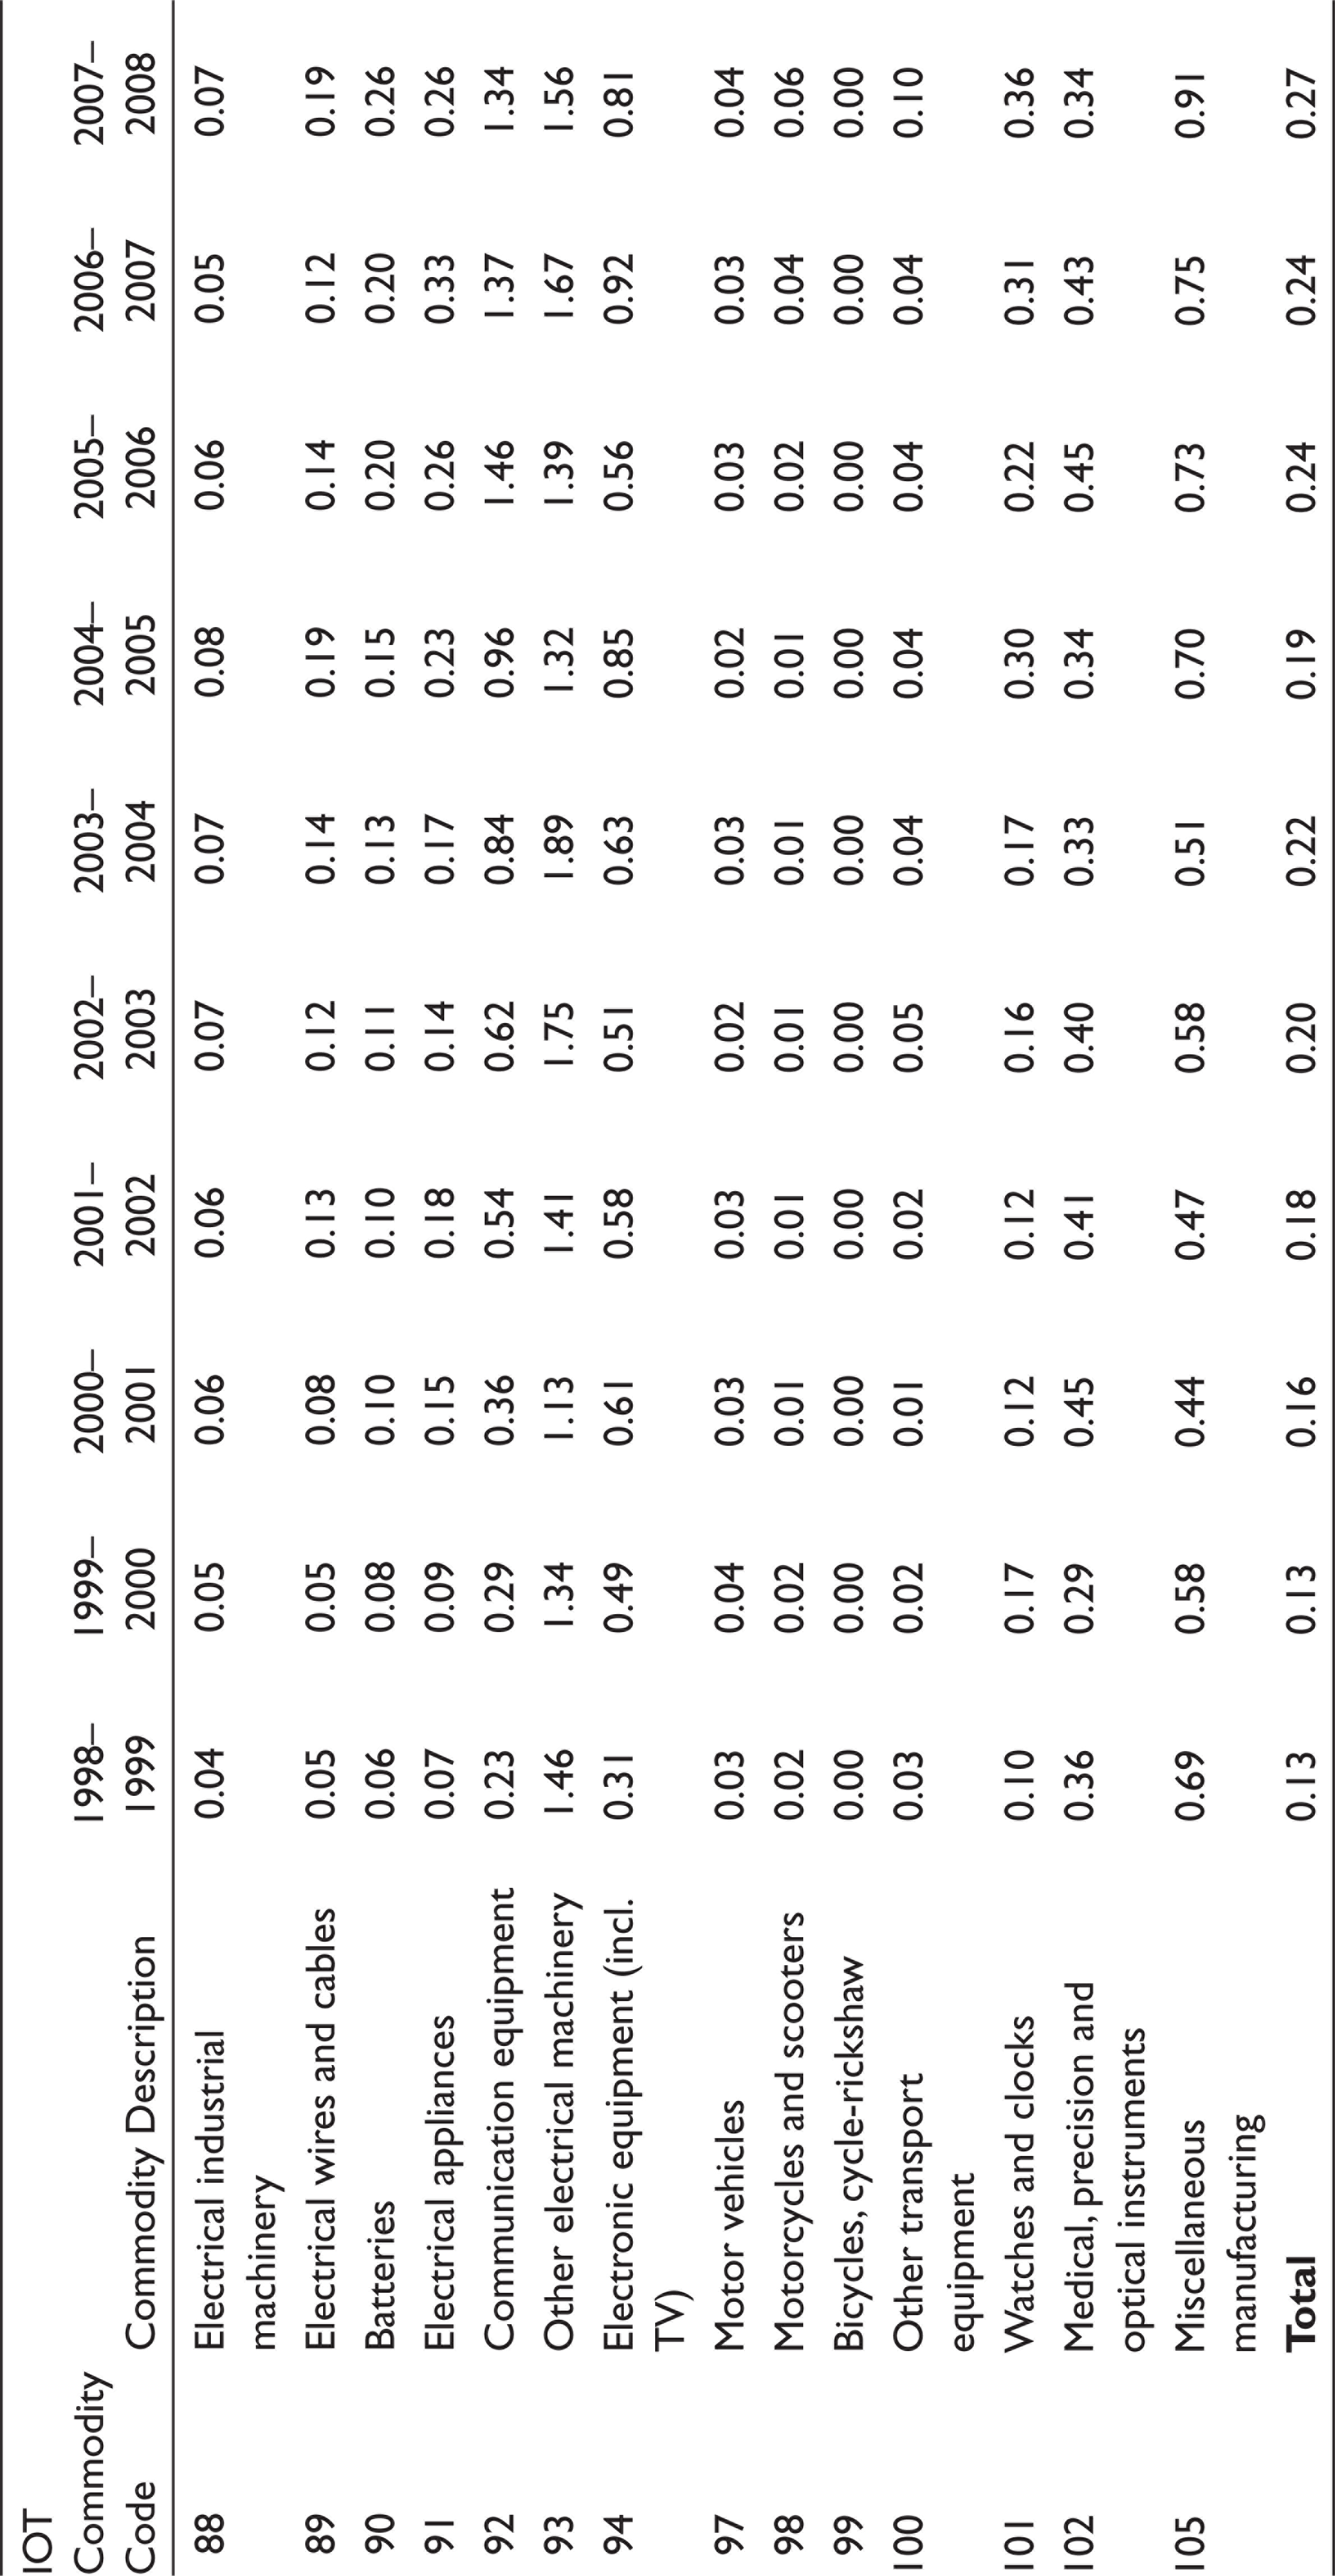
Import intensity of network products at the aggregate level is much higher than their export intensity. During the period from 1998–1999 to 2007–2008, the former has increased sharply from 0.13 to 0.27, while the latter has been quite stable at around 0.10 (Figure 2).
Tables A2 and A3 present the export and import to domestic registered industry production ratios, respectively (as production data are based on ASI data, which cover only registered manufacturing). It may be noted that tables have been prepared using Ministry of Commerce’s Export–Import database (trade data available at harmonized system HS 2007 codes) along with ASI (data available at three-digit level—NIC 2004). As is known, classification of industries in NIC 2004 and ISIC Revision 3 (International Standard Industrial Classification) are the same. Thus, the concordance between HS 2007 and ISIC Revision 3 (provided by World Integrated Trade Solution (WITS) software) has been used to compute export to output and import to output ratios.
Commodity-wise, in recent years (Tables A2 and A3), import to domestic production ratio is considerably high for communication equipment, other electrical machinery and electronic equipment (around 1 and above). But, export to domestic production ratio is about 1 only in case of other electrical machinery, while it is just 0.15 or much lower in case of other product groups. In the case of electrical machinery, as both import and export shares are high, it may be concluded that this industry is more linked with foreign market.

In 2007–2008, the top three network product groups with the highest FVA content (35% or more) were electrical wires and cables, electronic equipment and communication equipment (Figure 3). FVS in exports grew more rapidly during the period from 1998–1999 to 2007–2008 in the cases of communication equipment (by 17 percentage points) and motor vehicles, electronic equipment and other electric machinery (by 12 percentage points each), followed by electrical industrial machinery (11 percentage points).

To summarize the discussion in this section, over time, India’s participation in GVCs has improved. Foreign content in exports has increased for a majority of commodities, even for traditional export sectors and for network products. Regression analysis shows a positive impact of rising FVA on India’s export performance.
Comparison of India’s Foreign Value Added in Exports with Other Economies
This section decomposes India’s FVA by originating region and compares its value-added trade under GVCs with other emerging nations, mainly Asian.
Foreign Value Added in Industry by Originating Region
As FVA in country’s exports is the value-added created in other countries (originating ones), this can be decomposed to analyse the contribution of each one in country’s intermediate imports. This can have ample implications for bilateral trade balance. Table 6 provides contribution of developed and developing regions to FVS in India’s exports in 2011.
Developing economies including China contribute about 75 per cent value-added share to India’s FVA as compared to either developed (25%) or developing excluding China (57%). China as a significant exporter of manufacturing products and epicentre for Asian value chains, on an average, accounts for 18 per cent share across all Indian industries. At the industry level, China’s maximum contribution of 29 per cent to FVS in India’s exports is for post and telecommunication. This is followed by manufacturing nec recycling, textiles, electrical and optical equipment, transport equipment, other community, social and personal services, etc., where more than one-fourth of India’s FVS originates from China.
India’s FVS in Exports in Industry by Originating Region, 2011 (%)

Comparative Statistics on Value-added Exports
In terms of FVA share in exports, India lagged behind many emerging economies of East Asia and ASEAN in GVCs in 2011 (Figure 4). TiVA is used for analysis as WIOD does not provide data for all ASEAN countries and Africa. Importantly, in 2011, India’s FVS was higher than that of Indonesia, South Africa, Brazil and even Philippines.
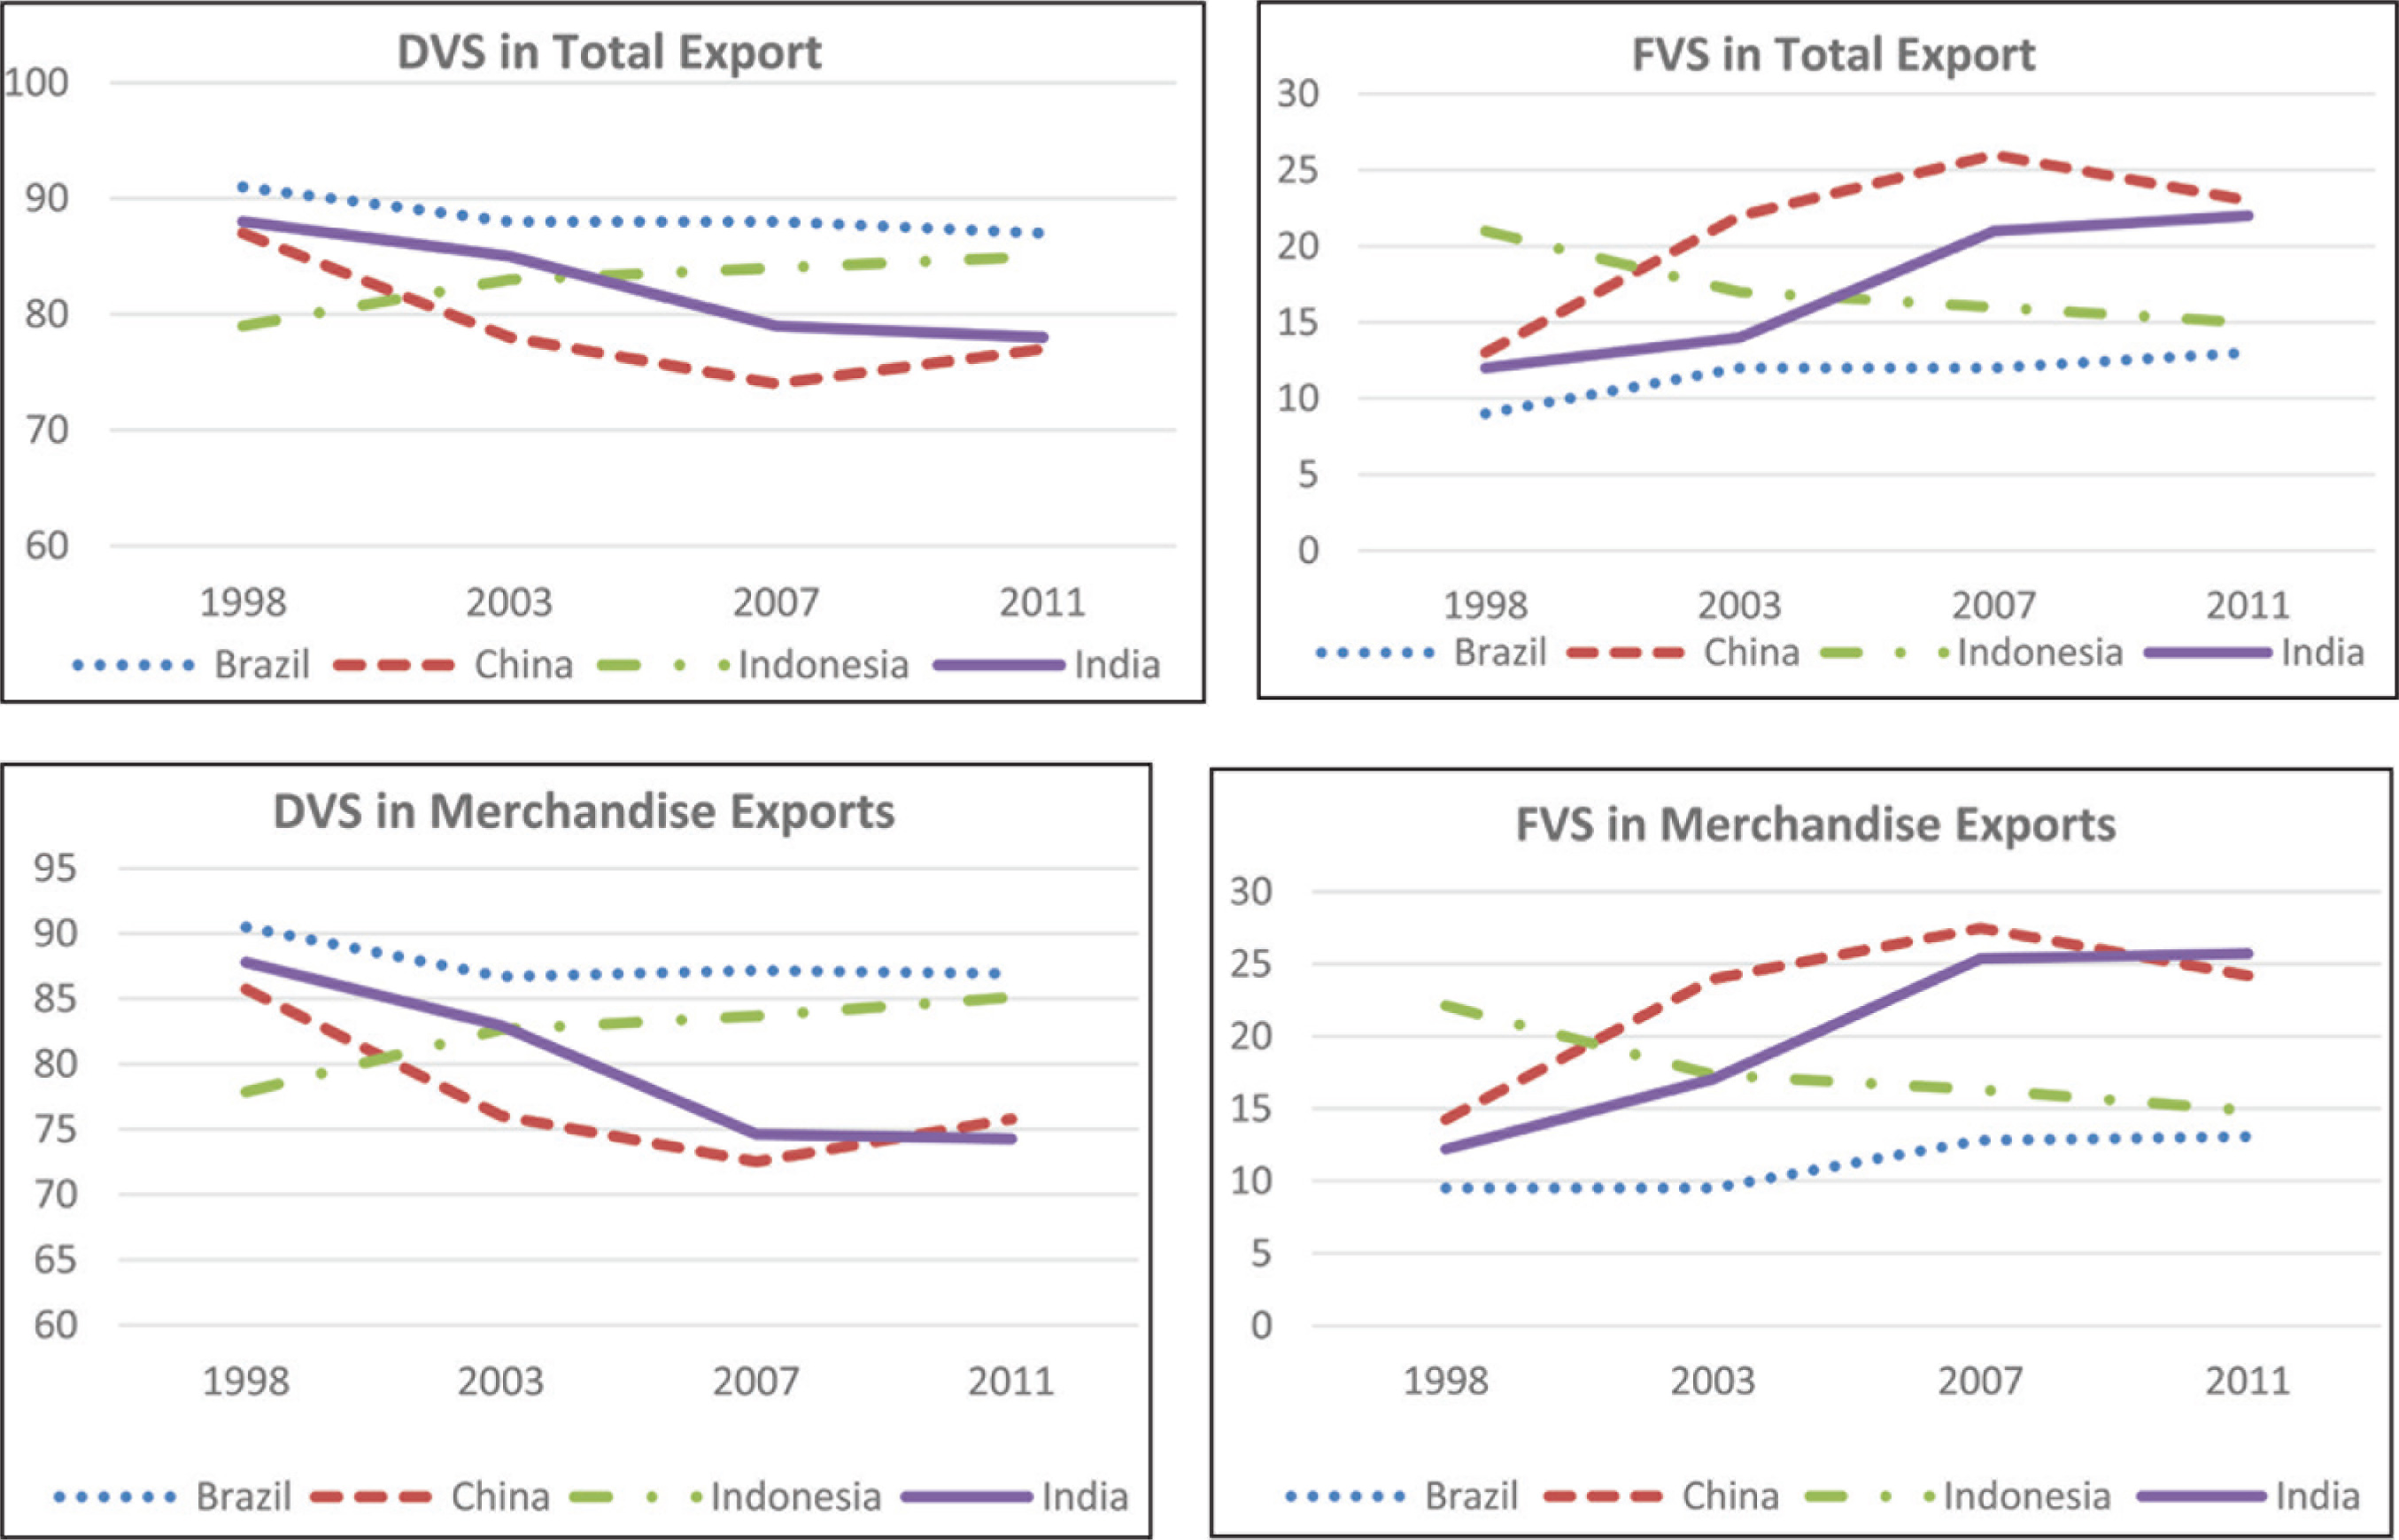
Further, over the period 1998–2011, FVS and DVS changed for many emerging economies. To illustrate, DVS in total exports has declined substantially for China and India (10 percentage points) and marginally for Brazil (4 percentage points), indicating a rise in FVS (Figure 5). However, two different trends are traced too: DVS in total and merchandise exports have been continuously rising for Indonesia during 1998–2011, and China’s DVA shares actually started to rise after 2007 (<1998). Kee and Tang (2016) support this finding in terms of how Chinese exporters are moving up the value chains by substitution of domestic for imported materials and are gaining greater competitiveness in their domestic input industries.
Most importantly, India’s DVS in total and merchandise exports only declined by about one percentage point each during 2007–2011 (Figure 5), that is, FVS rise could not be that rapid, perhaps, due to economic crisis or changes in export bundle. The reasons for India’s recent slowdown in FVA in exports need to be explored, particularly whether India is following the footsteps of countries like China, in order to stay competitive in world trade.

However, at a disaggregated level (Table 7), using WIOD, FVA in exports rose substantially for China in number of products, namely coke and refined petroleum (by 28 percentage points), metals, machinery nec, electrical and optical equipment (above 11 percentage points), followed by chemicals and transport equipment. Brazil’s highest rise in FVA was by 7.5 percentage points in the case of electrical equipment, followed by refined petroleum products and chemicals. But India’s highest rise was in manufacturing nec and recycling (35 percentage points), followed by electricals and textiles (7–8 percentage points). Other industries in which a rise of about 5 percentage points or more took place are basic metals and fabricated metal products, inland transport, and post and telecommunication. The findings from this disaggregated-level analysis with respect to India are, however, different from CSO-IOT-based results (1998–1999 to 2007–2008) according to which FVS rise was relatively high for ships and boats, petroleum products, fertilizers, etc.
A further point to note from Table 7 is that the rise in FVA between 1998 and 2011 was small, or marginal or even negative for Indian industries other than the six mentioned earlier. In fact, DVA has increased slightly in case of pulp and paper, wholesale trade, retail trade and repair of household goods. In contrast, a fall in FVA is not reported for any industry of Brazil. Indonesia’s FVA in exports declined for almost all industries except textiles, inland transport and other social and personal services. Indonesia’s DVA in exports has risen remarkably for metals and transport equipment.
Percentage Point Change in FVA Share in Gross Exports (2011 over 1998)—India, Brazil, China and Indonesia

Comparison of Foreign Value-added Shares in Output of Select Manufacturing Industries
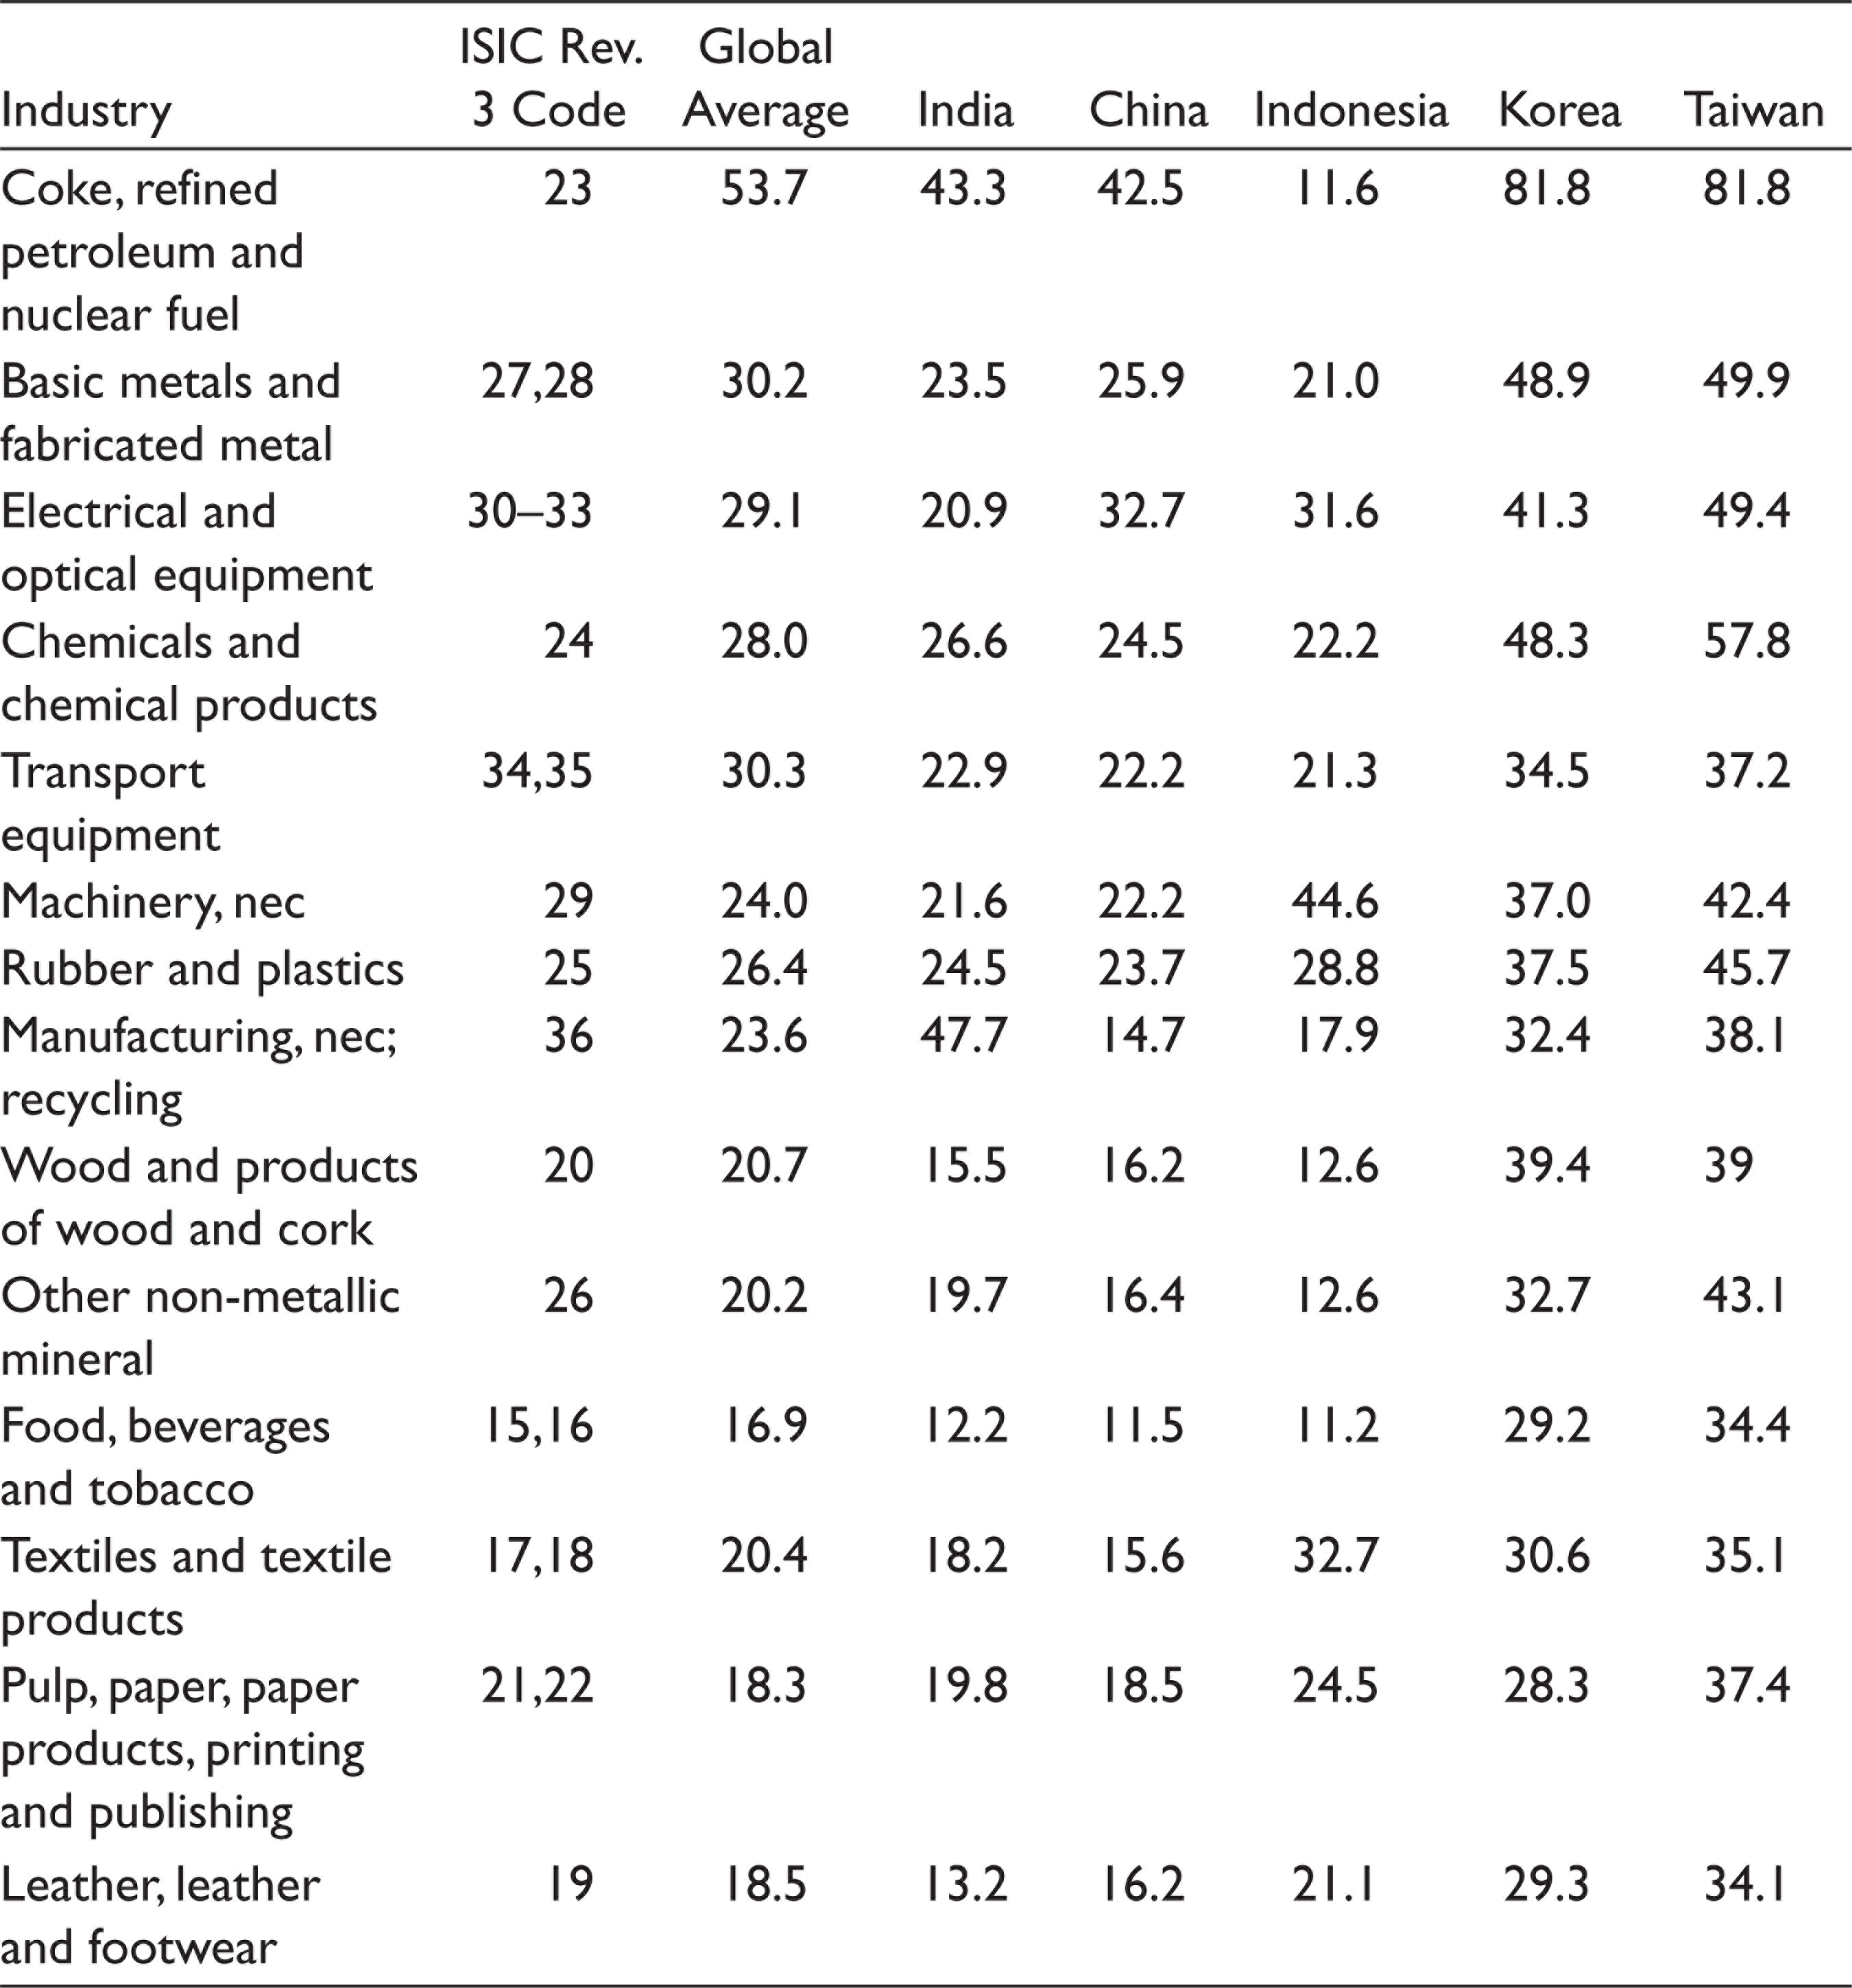
Table 8 presents India’s FVA shares in output of a select set of manufacturing industries in 2008 and compares them with corresponding FVA shares in selected Asian economies for the same year. A comparison with the global average FVA shares in output of final manufactures for the selected industries (and the same year) is also made. 9 The global average FVA shares shown in the table are drawn from Los et al. (2015, Table 2). Global average FVS has been computed by Los and associates by taking weighted averages of foreign value share of 558 value chains, which are categorized into 14 different industry groups. This measure of FVS is based on a different concept than that underlying the computed FVS shown for five countries in the table. The country-level computations of FVS are based on Equation (3) given earlier in the article and follow the Hummels et al.’s (2001) approach (HIY approach). These have been computed from the WIOD database. The approach by Los et al. (2015), by contrast, involves extension of the fragmentation measure introduced by Feenstra and Hanson (1999) in a multi-country setting. This is similar to the extension of the HIY approach made by Johnson and Noguera (2012a). In Los et al. (2015), world IO tables are used, final output value is considered and geographical origin of value added is derived by taking into account all rounds (stages) of production. The global average of FVA share in products belonging to different industries shown in the table is therefore not strictly comparable to the FVA share computed for different industries in different countries based on their respective national IO tables. Nonetheless, the comparison is interesting and useful.
FVS in Output of Final Manufactures by Selected Product Groups (%), 2008
Based on the comparison presented in Table 8, the following points may be made:
India’s FVS has not been markedly lower than that for China in 2008. Rather, this was relatively higher in the case of manufacturing nec, followed by sectors like textiles, non-metallic mineral products and chemicals and chemical products. In the cases of coke and refined petroleum products; rubber and plastic products; transport equipment; food and beverages and tobacco products; and pulp, paper, paper products and printing, India had a slightly or marginally higher FVS than China. India’s FVA share in output has been higher than global average in only two sectors: manufacturing nec and recycling, and pulp, paper, paper products and printing. In the other 12 industry groups, FVA share in India is lower than global average. For textiles and leather, traditional export-oriented industries, India’s and China’s FVA share in output have been lower than the global average in 2008, while the other three countries considered for comparison have much higher FVA shares. India’s FVA shares in all product groups, except manufacturing nec, have been much lower than that for Korea and Taiwan, which are among the most globally integrated countries (as reflected in the relatively high global FVA share in the cross-country comparison presented in Los et al. [2015], Table 3). Indonesia is found to be more globally integrated than India in the cases of electricals and optical equipment, machinery nec, rubber and plastic, and textiles and leather industries. For India, China, Korea and Taiwan, the FVS for different industries shown in the table are highly correlated with the global average FVS. The rankings of industries in terms of FVS have considerable similarity. However, the correlation is rather weak in the case of Indonesia (even when the coke and petroleum products industry is not taken into account).
Conclusion and Policy Implications
This article focuses on India’s integration into GVCs via greater use of FVA in exports. Novelty lies in combined use of India’s national IO tables and international-level WIOD for trend analysis. The article first substantiates India’s rising imported content in exports and declining DVA shares during the period 1995–2011, particularly marked for merchandise exports. Commodity-wise, during the period from 1998–1999 to 2007–2008, using India’s national IO tables, pervasiveness of fragmentation has been observed. Ships and boats, petroleum products and fertilizers achieved marked rise in FVS in exports, along with traditional sectors like textiles, leather, food processing, etc. But very small increase in FVS occurred in trade, insurance and computer services, fruits, vegetables and milk products, where domestic markets continue to dominate.
Analysis based on WIOD data revealed that developing countries contributed a large part of FVA in India’s exports, with significant contribution being made by China. As compared to Brazil, China and Indonesia, India’s FVS in exports (1998–2011) has been higher for manufacturing nec and recycling, textiles, post and telecommunications and inland transport services.
India’s scope for getting involved into GVCs is relatively greater in case of network product groups, mainly for electrical machinery, communication equipment and motor vehicles. India’s imports to domestic production ratio for network products has risen substantially; the increase has been more than that in the ratio of exports to domestic production. This may also suggest that their imports are more likely being used to meet the domestic demands in India rather than in exports. However, Veeramani and Dhir (2017) have emphasized India’s huge potential for emerging as final assembly hub in network products, mainly electronics and electrical machinery. India can harness strength in importing parts and components and making final network goods, which can then be exported.
Nevertheless, an important positivity is India’s better integration (higher FVS) than South Africa, Indonesia and Brazil. Second, regression analysis (based on data for the period from 1998–1999 to 2007–2008) show significant positive effects of increase in FVA share on India’s export performance. Also, it appears from the decomposition analysis undertaken that hike in FVS helped India to capture a greater rise in exports as compared to the growth in imports, thereby leading to substantial net gains for the economy. This is an important finding of this article. This potential should be tapped effectively and timely. The necessity for action in this regard becomes greater in view of the relatively lower linkages of India into GVCs as compared to many East Asian and ASEAN countries, particularly Korea and Taiwan.
However, there is also a parallel trend in recent literature where DVS of emerging nations are gradually rising such as that of China’s after 2007. India’s FVS rise has also slowed down as DVS in exports declined only by 1 percentage point between 2007 and 2011. It could be that the crisis has forced countries to look inwards to boost their domestic content in exports. It is yet unclear whether this is due to the reorganization of GVCs or use of more services content or due to changes in export–import bundle, etc. This is crucial particularly for emerging economies such as India.
All these further accentuate the policy debate on whether to enhance FVA in exports (for greater backward linkages into GVCs) or to increase forward linkages, that is, DVA content entering into other countries’ exports. Some literature focuses on benefits of imported inputs for export growth. On the other hand, there are apprehensions over continuously falling DVA in exports with respect to probable loss to domestic economy.
Accordingly, it may be argued that the concern is not how large a proportion of growing world exports can be captured. Rather, it needs to be recognized that the rise in imported content and integration into GVCs is beneficial when they result in greater growth of exports. Second, such increases in exports must also incorporate significant amount of high-quality domestic content, which would require competitive domestic input industries. This is necessary to move in line with the government’s ‘Make in India initiative, which also demands ease of doing business, greater export competitiveness and domestic value addition, and more FDIs. India’s forte in producing finished products also cannot be underestimated. Industrial sub-sectors (including services) must be accordingly identified as per requirement of competitive imported inputs and potential for domestic production. Massive efforts, may be through public–private partnerships, are essential for better logistics and infrastructure development in the country. Assured supply is critical for value-added growth.
Simultaneously, one needs to take note of small size of many Indian manufacturing firms and consider appropriate solutions for enabling them with sufficient scale economies, while effectively adding values in imported inputs or developing own value chains. Easing of regulations for small and medium enterprises (SMEs) and proactive formation of their clusters can encourage them to grow bigger in GVCs. These suggestions need to be considered without delay. To conclude, India’s trade policy should strike a right balance between the goals of increasing FVA content in exports and steeping up domestic value-added exports. This way, India will not only be able to capture larger share in enlarging exports and GVCs pie but also make its mark in leading certain industry-specific value chains.
Footnotes
Acknowledgements
This article is based out of a research project ‘Estimating Domestic Value added and Foreign Content in India’s Exports’, undertaken at ICRIER, New Delhi and financially supported by the Ministry of finance, Government of India. The authors gratefully acknowledge the research work by Ms Sreerupa Sen Gupta for the project. The authors would like to thank Dr Arvind Subramanian, Dr H. A. C. Prasad and Shri R. Sathish for comments and inputs in the Report prepared under the project. The authors thank Mr Devender Pratap for providing domestic flow and import flow matrices. The usual disclaimers apply. All the views expressed are personal.
Declaration of Conflicting Interests
The authors declared no potential conflicts of interest with respect to the research, authorship and/or publication of this article.
Funding
This article is financially supported by the Ministry of finance, Government of India.
Appendix
Commodity Composition of Import to Domestic Production Ratio for Network Product Groups: 1998–1999 to 2007–2008
| IOT Commodity Code | Commodity Description | 1998–1999 | 1999–2000 | 2000–2001 | 2001–2002 | 2002–2003 | 2003–2004 | 2004–2005 | 2005–2006 | 2006–2007 | 2007–2008 |
| 88 | Electrical industrial machinery | 0.04 | 0.05 | 0.06 | 0.06 | 0.07 | 0.07 | 0.08 | 0.06 | 0.05 | 0.07 |
| 89 | Electrical wires and cables | 0.05 | 0.05 | 0.08 | 0.13 | 0.12 | 0.14 | 0.19 | 0.14 | 0.12 | 0.19 |
| 90 | Batteries | 0.06 | 0.08 | 0.10 | 0.10 | 0.11 | 0.13 | 0.15 | 0.20 | 0.20 | 0.26 |
| 91 | Electrical appliances | 0.07 | 0.09 | 0.15 | 0.18 | 0.14 | 0.17 | 0.23 | 0.26 | 0.33 | 0.26 |
| 92 | Communication equipment | 0.23 | 0.29 | 0.36 | 0.54 | 0.62 | 0.84 | 0.96 | 1.46 | 1.37 | 1.34 |
| 93 | Other electrical machinery | 1.46 | 1.34 | 1.13 | 1.41 | 1.75 | 1.89 | 1.32 | 1.39 | 1.67 | 1.56 |
| 94 | Electronic equipment (incl.TV) | 0.31 | 0.49 | 0.61 | 0.58 | 0.51 | 0.63 | 0.85 | 0.56 | 0.92 | 0.81 |
| 97 | Motor vehicles | 0.03 | 0.04 | 0.03 | 0.03 | 0.02 | 0.03 | 0.02 | 0.03 | 0.03 | 0.04 |
| 98 | Motorcycles and scooters | 0.02 | 0.02 | 0.01 | 0.01 | 0.01 | 0.01 | 0.01 | 0.02 | 0.04 | 0.06 |
| 99 | Bicycles, cycle-rickshaw | 0.00 | 0.00 | 0.00 | 0.00 | 0.00 | 0.00 | 0.00 | 0.00 | 0.00 | 0.00 |
| 100 | Other transport equipment | 0.03 | 0.02 | 0.01 | 0.02 | 0.05 | 0.04 | 0.04 | 0.04 | 0.04 | 0.10 |
| 101 | Watches and clocks | 0.10 | 0.17 | 0.12 | 0.12 | 0.16 | 0.17 | 0.30 | 0.22 | 0.31 | 0.36 |
| 102 | Medical, precision and optical instruments | 0.36 | 0.29 | 0.45 | 0.41 | 0.40 | 0.33 | 0.34 | 0.45 | 0.43 | 0.34 |
| 105 | Miscellaneous manufacturing | 0.69 | 0.58 | 0.44 | 0.47 | 0.58 | 0.51 | 0.70 | 0.73 | 0.75 | 0.91 |
|
|
0.13 | 0.13 | 0.16 | 0.18 | 0.20 | 0.22 | 0.19 | 0.24 | 0.24 | 0.27 |