
Abstract
In migration and mobility studies, the availability of scientifically reliable data remains a persistent challenge. The recent move towards harnessing mobile and big data has also been unable to resolve the data issues due to accessibility, privacy, as well as ethical and methodological intricacies involved with such data sets. In this paper, we explore a new set of data known as visitor location register (VLR) and roaming data, which is recorded and reported by mobile service providers. The reporting model of VLR data used and presented in this paper is not only free from privacy and ethical concerns but also methodologically sound and simple to compute as compared to any previous approaches. Drawing on VLR data, this paper finds direct evidence of unusually high interstate net reverse migration during the first and second COVID-19 lockdowns in India (44.13 and 26.3 million, respectively), and thereafter quick return migration back to cities during unlocks. The findings from this paper also provide insights into evolving migration directions, precarity, pockets of origin and destination and state policies in containing reverse migration during lockdowns in India. We anticipate that the data presented in the paper have the potential to fill a major data gap in migration and mobility studies in other countries too if VLR and roaming data are made available at the required spatial and temporal levels.
Introduction
Internal migrants or so-called India’s unsettled settlers (de Haan, 1994) have long been neglected at government levels and among policymakers (Rajan, 2020a). The neglect begins with the invisibility of migrants in the available data. The lack of credible data also makes migrants’ precarity and vulnerabilities invisible (de Haan, 2020). The official decennial censuses and National Sample Survey (NSS) fail to capture circular, seasonal and semi-permanent migrants, which constitute the largest pool of internal migrants in India and are mostly a vulnerable group on the cusp of exploitation (Deshingkar & Akter, 2009; Rajan, 2020b; Srivastava, 2012).
Historically, this data gap has also led to a consensus view among demographers and researchers that Indians are less mobile due to caste-based hierarchical division in society, apart from linguistic and cultural diversities (Bell et al., 2015; Davis, 1951; Munshi & Rosenzweig, 2016). Those views might have had an element of truth during the colonial period and initial years of independence. For example, post-independence domicile-based state policies and sub-national politics against interstate migrants in some states were also impediments to internal migration in India (Kone et al., 2018; Weiner, 2015). In spite of those barriers, especially since the early 1990s with the beginning of liberalization of the Indian economy and improvements in communication and transportation infrastructure, long-distance interstate migration has been continuously on the rise (Bhattacharjee, 2020). The discussion on migration further suggests that migration increases with development (de Haas, 2007). Therefore, with the rapidly growing Indian economy, the further intensification of internal migration in India is inevitable.
The available data and discussions on interstate migration in India suggest some unusual characteristics but also almost linear directions between migrant origin and destinations states (Census of India, 2011; Economic Survey of India, 2017). Scholarly literature further highlights the increasingly circular, seasonal and semi-permanent nature of internal migration in India, primarily due to the inefficient and highly informal labour market, lack of portability of social security benefits, exclusionary urbanization, uneven regional development and environmental and economic distress in certain rural pockets (Bhagat & Keshri, 2021; Bharadwaj et al., 2021; Kundu & Saraswati, 2012). Those complex and fragmented processes not only make India’s largest pool of internal migrants and their precarity invisible to researchers and media but also provide excuses for policymakers and government for devising a coherent policy on internal migration.
The lack of understanding on internal migration in India became more pronounced when the COVID-19 pandemic first struck, emanating in abrupt policy responses by the government such as the imposition of a stringent lockdown during the first wave of COVID-19, suspending all non-emergency offline employment activities and means of travel without prior notice (Ministry of Home Affairs (MHA), 2020a). This led to millions of internal migrants in India thronging the roads and railway stations to find means of transportation, but in the absence of any such arrangements they resorted to walking on foot and bicycle to reach home, sometimes travelling more than 1,000 kilometres with several dying on the way (Indian Express, 2020; Kapri, 2021; Pandey, 2020). In this digital and social media age, the whole of India witnessed and visualized the desperation, precarity and plight of internal migrants walking on the wide and smooth highways, the very emblem of modern India. Some observers even compared this exodus of internal migrants to the mass migration and plight of people during the extraordinary turbulent days of the partition of India, leading to independence in 1947 (Petersen & Chaurasia, 2020; Tumbe as cited in Chishti, 2020a). The response of internal migrants during the COVID-19 lockdown was totally unanticipated among power circles and surprised policymakers at government levels. Even some state governments made unsuccessful attempts to prevent the reverse migrants from travelling to their home states, calling trains carrying migrants ‘corona express’ and forcing the Indian railways to cancel the special trains scheduled for migrants (Rajan, 2020b). This kind of policy vacuum exposes successive governments’ apathy towards acknowledging the extent and breadth of internal migration in India.
There are no reliable data on the reverse migration process as a consequence of the COVID-19 lockdowns in India. What is available are anecdotal opinions, expert views and some fragmented administrative data (Chishti, 2020b). The government of India estimates the number to be 10.2 million including migrants who walked on foot (Lok Sabha, 2020). This is a significant underestimation as it captures only people who returned home using the official means or availed state services, such as ‘Shramik’ special trains or quarantine centres. The visible plight of millions of internal migrants during the COVID-19 lockdowns in the first wave should have been an eye-opener and sufficient to produce concrete pro-migrant policies. However, when the more brutal second wave struck between March and May 2021, a large number of migrants, who had just returned back to work, reverse migrated again. But during the second wave, due to the availability of means of transportation, the migrant exodus became totally invisible. There are neither numbers on reverse migrants nor acknowledgements of the severe financial and social implications of back-to-back reverse migration.
The kind of abrupt policy responses to lockdowns that emanated during the first wave of COVID-19 in India stems primarily from the lack of credible and consistent data on different kinds of migration (Kumar et al., 2020; Rajan et al., 2020a). As there are no migration-specific surveys at the national level, there is a lack of consensus on the number of internal, interstate, circular, seasonal and short-term migrants in India. Official data such as Censuses and NSS fail to provide a complete picture of migration movements in India. As per their definition and methodology, circular, seasonal, and temporary migrants are excluded apart from long time intervals involved in conducting such exercises and releasing the data (Datta, 2020; Deshingkar & Start, 2003). In some states, state-specific migration surveys have been carried out. Among those surveys, the most consistent Kerala Migration Survey helped the state government in Kerala during the first wave of COVID-19 to contain the reverse migration successfully (Rajan, 2020a). Other than a few states’ specific surveys, some scholars have also tried to estimate labour migration using data such as the India Human Development Surveys and National Health and Family Survey (Keshri & Gaur, 2015; Nayyar & Kim, 2018).
In the absence of any credible pan-India migration data sources, scholars and researchers of migration studies have had to rely on various kinds of estimation and field surveys, sometimes combining data from multiple sources of different time lags. For example, the 2017 Economic Survey of India used two innovative methods, namely, ‘Cohort-based Migration Metrics’ (CMM) and unreserved railway ticket booking data for general class to project the number of long-distance or interstate migrants. The survey using the CMM method estimated 60 million interstate migrants between 2001 and 2011, whereas railway data showed an annual average flow of around 9 million people between states during 2011–2016 (Economic Survey of India, 2017). Some scholars have questioned the validity of such calculations citing methodological issues and unreasonable assumptions (Chandrasekhar et al., 2017; Kundu, 2018). There are some other estimates based on a mix of different data sources. Srivastava (2020), based on Census of India (2011) data, estimated 52 million interstate vulnerable circular migrants as of 2018. Rajan (2020b) projected 200 million interstate and inter-district migrants out of the total estimated 600 million internal migrants as of 2020. As per his projection, 140 million or two-thirds of the total 200 million interstate and inter-district migrants were migrant workers, most of them engaged in exploitative informal, vulnerable and temporary jobs (Gupta, 2020).
In the absence of scientifically reliable real-time data on migration in India, this paper introduces a new scientifically reliable data set in migration studies by computing active mobile subscribers’ interstate movement as reflected in telecom subscribers monthly peak VLR and focuses on reverse migration processes during the COVID-19 and thereafter return migration. We further use quarterly interstate roaming data to estimate the overall number of interstate migrants in India. The paper is divided into six sections, following an introductory section. The second section briefly reviews the literature on innovative big data sources in migration studies. The third section introduces an overview of the telecom sector and its growth in India to understand the results better. The fourth section presents data and methodology with limitations. The fifth section presents the results and discusses the scale, speed and numbers of net interstate migrants during the two waves of COVID-19 and thereafter return migrations through tables, figures, maps and trendlines. In this section, we also estimate the number of interstate migrants using interstate roaming data. In the final section, we conclude the study and suggest the scope of further improvements in VLR and roaming data architecture for migration and mobility studies.
The Use of Innovative Data in Migration Studies
The paucity of reliable data on migration is not only a persistent issue in India but in most countries (IOM, 2018). Due to the data vacuum, increasing digitalization and the use of mobile phones, which captures human digital footprints, have become important for many purposes including migration studies. This has opened new avenues for migration researchers to harness innovative data sources, such as big data generated by various digital sources or combining traditional data sources with big data to estimate different categories of internal and international migrants (IOM, 2018). In mobility studies, researchers have been trying to detect movements of people primarily using Call Detail Record data (CDR data) and geotagged social networking site data for almost two decades (Lai et al., 2019; Lu et al., 2012). In fact, IOM and the European Commission have jointly established the ‘Big Data for Migration Alliance’ by setting up the Global Migration Data Analysis Centre to harness the possibilities of new data sources and methodologies in migration studies (IOM, 2018). Mobile network data have also commonly been used during disasters and epidemics in many countries to track and trace the movement of people, starting with the earthquake and cholera outbreak in Haiti, the H1N1 outbreak in Mexico, the Ebola outbreak in West Africa, Dengue in Pakistan and the Cyclone Mahasen in Bangladesh (Bengtsson et al., 2011, 2015; Frias-Martinez et al., 2011; Lu et al., 2016; Wesolowski et al., 2014, 2015). Further, a few telecom service providers (TSPs) in some countries had revealed anonymized CDR data for harnessing societal benefits under the Data for Development challenge in Ghana, Senegal and Ivory Coast, the Data for Refugee challenge in Turkey and the Big Data Challenge in Italy (Barlacchi et al., 2015; Blondel et al., 2012; Salah et al., 2019). This led to many innovative and interesting findings in deciphering some internal mobility and commuting patterns in some cities and regions. During COVID-19, successful collaboration between governments and mobile network operators in countries, such as Ghana, Argentina, Brazil, Colombia, Ecuador, Germany and Spain, aided the government agencies in decision-making (Arai et, al., 2021; de Alarcon et al., 2021; Li et al., 2021a). Li et al. (2021b), by integrating the China National Statistics report and Baidu Migration data, showed how inter-provincial migration in China reduced by 63% during the COVID-19 restriction between January and May 2020. Based on CDR data, Arai et al. (2021) have shown an initial migrant exodus from urban regions with reduced mobility in rural regions of Gambia during COVID-19 lockdowns. Earlier, Blumenstock (2012), observing CDR data for four years, found a high level of temporary and circular migration in Rwanda, discovering significant heterogeneity in the movement of people.
Another important form of big data is Google’s COVID-19 ‘Community Mobility Reports’ (CMRs). The CMRs show percentage change of footfalls or activities at particular locations compared to the baseline period on seven-day rolling average basis, which is of immense help especially for epidemiologists strategizing for COVID-19 control. Sulyok and Walker (2020), while studying the relationship between community movement and COVID-19 confirmed cases in 135 countries, found a negative relationship between mobility and the incidence of COVID-19 in most of the industrialized countries of North America, Western Europe and among all the continents except South America. This supports the hypothesis that lockdowns or mobility restrictions curb the spread of COVID-19. Analysing the effectiveness state-level lockdowns in India in containing the growth rate of COVID-19 during the second wave of COVID-19, Tumbe (2021, p. 10) found that the ‘sustained mobility reduction of 40 percent over two weeks’ had a positive impact on reducing the COVID-19 caseload.
Food security may also play an important role in restricting the mobility of migrants during pandemics, such as COVID-19. Choudhury et al. (2020), using innovative Facebook mobility data have analysed the variation in implementation of portability of ‘ration cards’ in Indian states—a subsidized food security scheme run by central and state governments—and its impact on intrastate/interstate migration. The authors found 12% reduction of intrastate mobility in states which have fully implemented the ration card portability scheme inside their states whereas there is no effect on interstate migration as interstate ration card portability was launched only in 2020, and it is still at the implementation stage (Choudhury et al., 2020).
The trend of using a different kind of big data for real-time modelling of mobile subscriber movements is continuously increasing. This has proven helpful in extending humanitarian support during crises and disasters. However, using this kind of indirect data and modelling has its own limitations (Sîrbu et al., 2021). The limitations with CMR or Facebook data concern its low level of temporal and spatial coverages, which at most can help in crowd control and mobility control at different places. The major limitation of CDR-based modelling and projections are methodological difficulty with increased chances of sampling and linking biases in the ‘noisy data environment’ (Blondel et al., 2015; Ranjan et al., 2012). Data accuracy and fragmentation are also unknown in such kinds of data (IOM, 2018). Further, most of the studies using CDR data have helped detect mobile subscribers’ mobility at low spatial and temporal levels, which does not help much in detecting long-distance or circular kinds of internal migrations. Moreover, accessibility, reliability, data cost, legal and ethical concerns surrounding privacy remain a significant challenge with mobile and big data (de Montjoye et al., 2013). Of all the issues associated with CDR data, the most important are privacy and ethical concerns. Even anonymized and aggregated CDR data have enough potential to be de-anonymized using other data sources, revealing the privacy of individual mobile users (de Montjoye et al., 2018).
The Telecom Sector in India: An Overview
Since early 2000, India has witnessed rapid growth both in the geographical coverage of wireless mobile services and in the number of subscribers. The affordability and availability of mobile handsets, cheap call rates and data packs have brought a digital revolution to the country. Presently, the entire country is covered by all the TSPs, and teledensity stands at 87%, which has been almost stable since early 2017 Telecom Regulatory Authority of India (TRAI, 2018, 2021a). Any citizen of India having a valid government identity card can subscribe to a mobile connection in any state and move and live anywhere within India with the same mobile connection. However, technically their movement from one state to another is called ‘roaming’. This is because of the division of telecom services in India into 22 Licensed Service Area (LSA) out of 28 states and eight union territories (TRAI, 2013). Previously, along with costly call and data tariffs, domestic roaming was also very costly, and roamers had either to pay hefty call charges or purchase a new Subscriber Identity Module (SIM) card in their destination states. Yet, since 2012 roaming charges have been on the decline due to the slashing of inter-LSA connectivity charges by the government to facilitate national roaming (Public Information Bureau, 2013). However, the real change came in 2017, when all the service providers started offering free domestic roaming services, pronouncing the ‘death of national roaming’ in India (Turner, 2017). Furthermore, with the introduction and overhaul of inter-TSP and inter-LSA Mobile Number Portability, India is witnessing a consolidation of telecom subscribers (Economic Times, 2019). Now mobile subscribers do not have to purchase a second SIM while moving to another state or change the TSP to avoid roaming charges. Subscriber stability and consolidation are also evident from subscriber numbers, which peaked at 1,186 million in June 2017 and remained at 1,186 million in August 2021, with some fluctuations in between (TRAI, 2017b, 2021a). The median number of subscribers in that period is 1,165 million, and the activity rate of subscribers has been on average 85.2%, with a standard deviation of 1.69% giving a sense of prolonged stability.
Despite increased affordability and massive changes brought out by the telecom revolution in India, some fault lines still persist. The rural–urban divide in teledensity (140% for urban and 60% for rural), varying teledensity between the economically well-off states and economically poor states (54% for Bihar and 131% for Kerala), and large non-smartphone users (309 million 2G subscriber base) may reflect existing divergences in India’s development trajectory. In the case of differential teledensity between rural and urban, between well-off and economically poor states, an explanation may be the very migration story we are discussing in this paper. The differential teledensity between economically poor and well-off states and urban–rural may not be as wide as it looks from the teledensity data because of the following factors. First, teledensity data includes the 23 million wireline connections in India, which mostly exist in metro cities and urban regions having high economic activities. Second, the states having the lowest teledensity are also the largest migrant sender states, and states having high teledensity are also the largest migrant-receiving states. Therefore, it is very likely that the differential teledensity is because of migration, as the migrants are becoming subscribers by purchasing handsets and SIMs in the destination states after migrating and earning money. This is more apparent from the fact that teledensity in most of the migrant origin states is on the decline. For example, between 2017 and 2021, Bihar has witnessed a further decline in teledensity of almost 10% despite an increasing subscriber base at all-India levels (TRAI, 2017a, 2020). This may also be true in the rural–urban divide as most rural people became mobile subscribers or mobile phone purchasers in their migrated urban areas or small towns, automatically making them urban subscribers as their urban regions become their Home Location Register (HLR). Migration has the potential to affect the official data as Tumbe has shown in the case of Udupi and Ratnagiri districts where due to high male out-migration, sex ratio increased in favour of females in the censuses data of those districts (Tumbe, 2012).
Data and Methodology
Data
Each month, the telecom market regulator in India TRAI releases subscription data and reports on the telecom sector performance. The data contain the number of subscribers and percentage of active subscribers in VLR in each LSA and at all-India levels (annexures I and II of the subscription reports). The subscription reports are based on reporting of the TSPs data and follow a methodology and definition of calculation prescribed by the Department of Telecommunication (DoT), Government of India, which is mandatory as per licensing agreements (DoT, 2005; TRAI, 2017b). The release of monthly reports is eagerly awaited, widely circulated, scrutinized and discussed in the business media and market, as it provides the growth trajectories of the telecom operators in the Indian market. All three private TSPs or their parent companies are listed on the stock exchanges; therefore, their scripts on bourses also react to the release of the subscription reports. Sometimes some parts of the data have errors and mistakes, which upon timely identification and indication, are rectified by the TRAI issuing corrigendum (Economic Times, 2021; TRAI, 2021c). Though data are continuously released for several years, due to mergers, acquisitions, cancellations of licences and inter-TSPs roaming (as some TSPs were only operating in a few LSAs, etc.) data from before 2019 are very noisy and unstable at LSA levels. However, since 2019 the telecom market in India has been quite stable and only three pan-India private players along with two state players are operating in all the LSAs eliminating any need for inter-TSP roaming. Thus, since 2019 consistent TSP-wise reliable data are available for all TSPs both at LSA and all-India levels. The VLR data used and presented by the authors do not reveal any individual or group attributes because of its design of reporting, therefore privacy is intact. It is not the case that VLR data are fully unknown. HLR–VLR is a major component in every mobile networking system as VLR keeps a record of visitors, and active subscribers in mobile networks always having communication with the parent HLR (Hadachi et al., 2020). The major issue is the pooling and recording of VLRs at required spatial and temporal levels. This is possible in India because of its division into 22 LSAs with separate licensing and reporting for each LSA. Therefore, inter-LSA movers become roamers and are captured in the VLR at LSA levels.
As per TRAI definition and methodology, peak VLR is recorded each month at LSA levels with purge time not more than 72 hours by each TSP (TRAI, 2021b, pp.17–18). Subscribers found in peak VLR are counted as active subscribers and the rest as ‘inactive’. ‘Inactive subscribers’ are defined as ‘not found in the coverage area’ or ‘switched off etc.’ during the peak VLR recording period of the month (TRAI, 2021b). Each base station in the network is served by exactly one VLR, hence a subscriber cannot be present with more than one VLR at the time of VLR recording (TRAI, 2021b). This eliminates any chances of double-counting of active subscribers (TRAI, 2021b).
The other different set of data used in this study denotes all-India mobility through domestic roaming, and it is different from the above discussed VLR data. It has been obtained from TRAI quarterly and yearly performance indicator reports providing the percentage of quarterly and yearly interstate (inter-LSA) roamers. TRAI collects roaming data to calculate revenue from roaming (TRAI, 2017c, 2021c).
This kind of data aggregation might not be the case with other countries and regions where a single national LSA exists having no domestic roaming or recording, and reporting is not mandatory for TSPs as mandated in India; otherwise, there would have been studies using VLR data like much used CDR data. The only study we found using VLR along with CDR data in mobility studies was conducted in Estonia (Hadachi et al., 2020), but the availability of VLR–CDR data only at the lowest Base Transceiver Station (BTS) tower level made the study limited to modelling daily commuting patterns between two BTS location or at the agglomeration of some BTS locations.
Methodology
Based on the available data, the current method computes the net month-on-month change in the active subscribers in LSAs without changes in active subscribers at all-India pooled or total levels. This indicates net redistributing of active telecom population into LSAs each month, signifying mobility or migration of active subscribers. To calculate this, we are using the indirect method of calculating net migration also known as residual or simply bookkeeping method (UN, 1970, p. 24). According to this method, if no births and deaths are happening (or net-birth and net-death are subtracted fully) in a population, and the population is subject to change at two points of time, it is only because of net migration.

where I is in migration, O is out migration, Pt is the population at time ‘t’ (here ‘active mobile subscribers in months ‘b’ in LSA1–22), P0 is the population at time ‘0’ (here active mobile subscribers in months ‘a’ in LSA1–22), B is births (addition in inactive subscriber), and D is deaths (deletion in inactive subscriber).
We are computing only ‘active’ subscriber population by using the above formula in multiple months, and all the components are available in the data for each month. However, the data are subject to two known effects producing biases that need to be cleaned and standardized. First, every month, some new ‘subscribers’ are added/deleted in each LSA, which directly increases/decreases the active subscriber population ‘Pt’ without affecting the activity rate in the LSAs. For example, each newly added subscriber increases both the subscriber and active subscriber populations by ‘one’, having a net-zero effect on the activity rate in an LSA, as activity rate depends on inter-LSA movement and net addition/deletion in inactive subscribers. However, not deducting the extra net added/deleted active subscribers can disproportionately affect the population of active subscribers in LSAs, making the results biased in favour of some LSAs in the calculation period. Second, (B − D), which is subject to minor increase/decrease each month, is not discoverable at each LSA level separately, because of continuous inter-LSA movement of active subscribers, but can be discovered at all-India total levels each month.
First, to offset the effect of net addition/deletion of subscribers on ‘Pt’ we deduct the newly net added/deleted subscribers each month in each LSA before discovering ‘Pt’ in the subsequent months. To find the added subscribers in the month of b to z, we deduct subscribers each month (b – a, c – b…z – y for each LSA). Doing this exercise each month automatically makes month ‘a’ (February 2020) subscriber population constant in each LSA throughout the calculation period, as our calculation starts from March 2020 onwards. Starting calculation from March 2020 onwards also leads to making the February 2020 active subscriber population at all-India level as the base subscribers (‘sum of ‘P0’ of month ‘a’) for calculating net migration. This standardization of data leads to tracking movement of only 1,160 and 986 million mobile subscribers and active subscribers respectively in India throughout the calculation period (out of 1,166 and 996.4 million in October 2021). The 1,160 million subscribers are also near the median subscribers in the calculation period.
To offset the second effect, following the above first exercise, we now know the month-on-month number of active subscribers in each LSA and at all-India levels (‘Pt’ in the months of b to z and ‘P0’). Therefore, we can discover the net addition/deletion of inactive subscribers at all-India total levels by deducting ‘sum of Pt’ each subsequent month from ‘sum of P0’. Hence, after discovering the total net addition/deletion of inactive subscribers at all-India total levels each subsequent month, we choose a redistributing method. We redistributed all-India sum of net addition/deletion of inactive subscribers into each LSA as per their percentage share of active subscribers in their all-India total in each subsequent month. This method led us to discover (B − D) each month in each LSA during the calculation months. After the above standardization, the main formula has been used to calculate the month-on-month net movement of active subscribers.
The only assumption in using the redistribution methods is that LSA-wise there is no significant change of ‘inactive subscriber’ numbers than the relative changes reflected at all-India total levels during the calculation months. This assumption is justified, firstly because of the nature of the definition of the inactive subscriber in an LSA as given (either ‘switch off’ or ‘out of coverage area’) makes it a technicality spread equitably. Second, we observe only minor changes in the percentage of active subscribers at all-India levels and even at each TSP level separately; therefore, any large-scale change in any LSA or TSP must be reflected in all-India total which did not happen in the calculation period. Third, only a large-scale service disruption in any particular LSA or with a TSP can cause a significant change in the activity rates using the redistribution method applied by us, affecting disproportionately to other LSAs. This we detected once during the pre-COVID-19 period. To test the assumption, we conducted the same calculation exercise with the VLR data back up to February 2019. The only aberration we found was the complete service disruption in one LSA due to security issues for two months when a large number of the subscribers in a particular LSA suddenly became inactive but no such disruption happened during our calculation period with any TSP or in any LSA.
Triangulation
We triangulated the results presented in this paper in three ways. First, we made the lowest June 2020 subscribers and active subscribers in each LSA as the base month (1,140 million and 958 million, respectively) and computed using the same method till October 2021. The result reflects the same trend, direction and scale with a three percent reduction in the number of net migrants in June 2020 as there is a 3% difference between February 2020 and June 2020 subscriber numbers. Second, we also computed each TSP data separately using the same method up to June 2020, and upon adding together all the TSPs data, we found similar results hence we stopped. Third, we took Bharti Airtel subscribers as a sample for all TSPs as it has the most stable and inclusive subscriber base with the highest percentage of active subscribers, and we compared its active subscriber growth between February and June 2020 in all the LSAs and at all-India level with our results. We found more than two million additional reverse migrants at all-India levels than the results presented in this paper, but we found a similar direction of movement at LSA levels with varying numbers in some of the LSAs than our results presented in this paper. There are many issues with using one service provider as a sample. All the TSPs are not inclusive at all-India levels and in states. Different service providers have a different presence in different states and are not equal in serving all segments of society. For example, 309 million 2G or non-smartphone users cannot subscribe to Reliance Jio, having the largest subscriber share in India as Reliance Jio offers 4G LTE services only. Further, all the three major TSPs have a surprisingly large heterogenous subscriber share at LSA levels despite having relatively equal subscriber share at all-India levels. Therefore, using one service provider as a sample has the potential to create biases in the results and is avoidable.
Data Error Reporting and Solution
Despite telecom subscription and VLR data being released by the TRAI and scrutinized by the business market players, we discovered significant overlapping of active subscribers in the month of June, mainly between Madhya Pradesh LSA and bordering Maharashtra, which fully got reversed in the next month of July 2020. The error was only with one TSP’s data (Vodafone Idea), mainly in both the states but also minorly with neighbouring LSAs (this overlapping did not affect their all-India active subscriber numbers). Consequently, to solve the error we used another TSP’s (Bharti Airtel) ‘active subscriber’ percentage change between March 2020 and June 2020 as a sample in those two states for the calculation. Bharti Airtel was selected because it serves both smartphone and non-smartphone 2G subscribers. This exercise solved the error generating (−1.6 million) excess migrants in favour of net reverse sending states which we adjusted with the Maharashtra and other two bordering states as per their ratio of subscribers.
Dual and Multi-SIM Effect
There are subscribers who use dual or multi-SIMs that lead us to question whether we should claim active subscribers as ‘unique individual migrants’ or not. As per the survey conducted by Nelson (2019), there were 15% dual SIM users in India in 2015, with the upper-income class having the largest share. The report also indicates a correlation between dual SIM use and inactivity rate (Nelson, 2019). There is no recent survey available, especially after the consolidation of the telecom market in India since 2017. However, market discussions on dual SIM suggest that numbers are coming down significantly with the ‘death of roaming’, as all TSPs are offering similar tariffs with the option of port-out-in from one TSP to other in case of unsatisfactory services (Economic Times, 2018, 2020). Almost 4% decline in teledensity in the last three years further indicates a trend of discarding of second SIMs by subscribers. However, there is also a high possibility of dual SIM use among subscribers availing services of state-run TSPs (BSNL and MTNL) having 10% subscribers share but the lowest activity rates. But at the same time, 309 million—or around 25% of non-smartphone or 2G subscribers in India—are mostly single SIM users (Sahu, 2020).
For the purpose of this study, we are only tracking 986 million active subscribers (February 2020), which is around 15% less than the total 1,160 million subscribers. In all probability, those 15% inactive subscribers are also moving like their 85% peers. They are still subscribers but are inactive just by virtue of being found out of coverage area or switched off during the VLR recording period. We could have added those movers in our final numbers separately, but to avoid and discount the dual SIM effect on our results, we are not adding them in our final calculation. Similarly, if some of the reverse migrants are using double SIMs, some of them may also be not having individual SIMs. For example, family members of migrants moving together may not individually own mobile phone connections. Therefore, we assume that 44.1 million and 26.3 million reverse migrants calculated by us during the two waves of COVID-19 are ‘unique individual migrants’ out of a total of 1,160 million subscribers and 986 million active subscribers in India.
Limitations
The major limitation of the current results based on VLR data is that it cannot reveal the gross migration but only net migrations. For example, if 100 subscribers moved to Delhi from Mumbai and 80 moved to Mumbai from Delhi in the same month, the net migration will only show the surplus (+20) in Delhi and (−20) in Mumbai in that month. Further, it does not account for intrastate or inter-district migrant, which forms the majority of internal migrants in India (Bhagat & Keshri, 2021). Additionally, VLR or roaming data does not reveal demographic and social attributes, such as age, gender and occupation, which are very important parts of any migration study.
In the result section, we use ‘state’ instead of using the technical term ‘LSAs’, as 22 LSAs are less than 28 states and 8 Union Territories in India, signifying more larger LSA boundaries than states and long-distance migration.
Results and Discussion
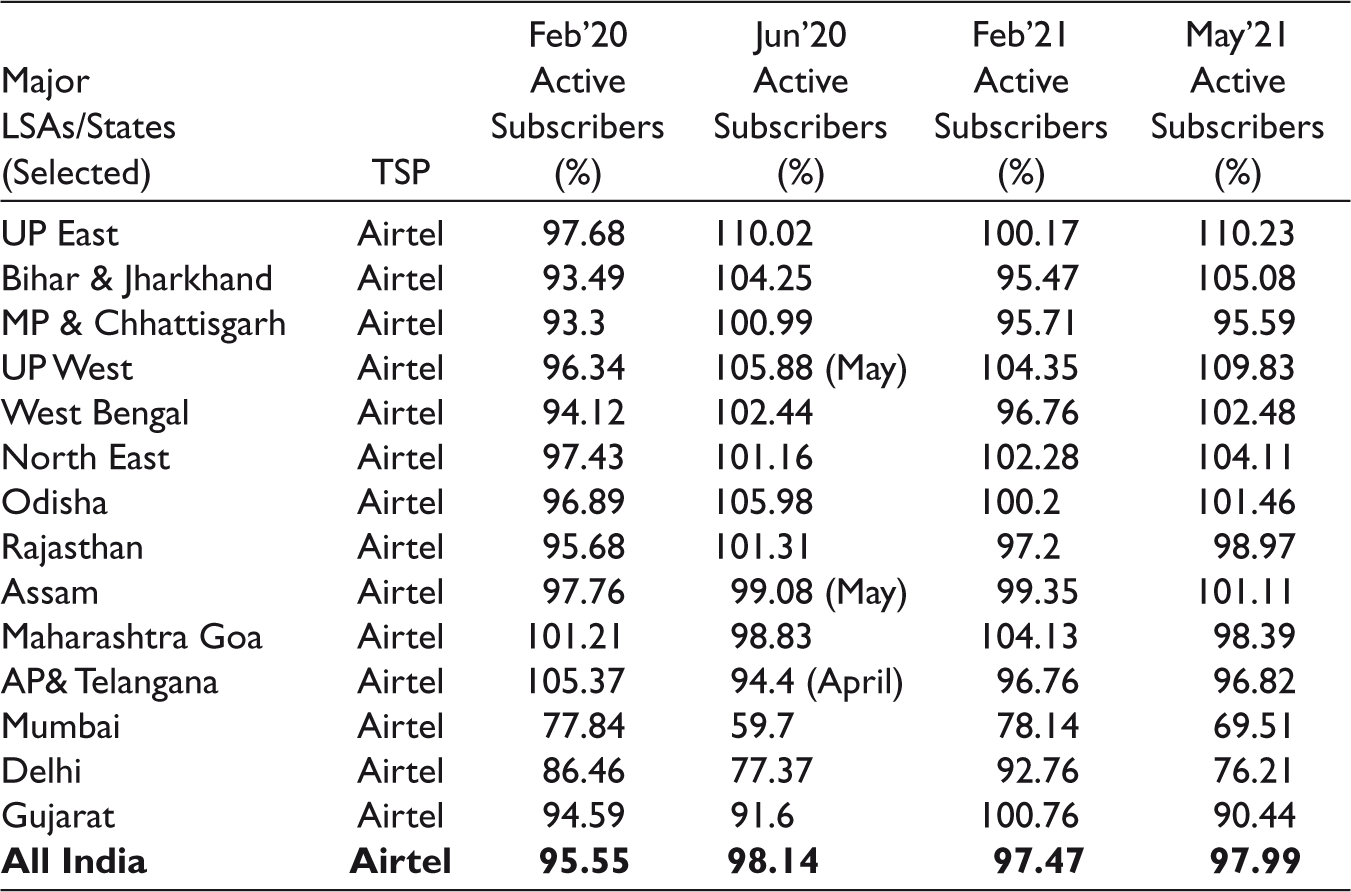
The speed, intensity and numbers of net reverse migration during the first and second COVID-19 lockdowns in India are depicted in Tables 1 and 2. Table 1 shows the percentage of Airtel’s active subscribers in the selected states and at all-India total level, out of its total subscriber base in those states during the different months of COVID-19 lockdowns including pre-COVID-19 February. Ideally, the percentage of active subscribers in a state cannot change month-on-month and at any point of time it can never reach beyond 100% unless there is in-roaming or in-migration. Increase in percentage in some states is happening at the cost of a percentage decrease of active subscribers in other states due to out-migration. Therefore, a large-scale change in the percentage among the states as shown in Table 1 shows migration or redistribution of subscribers among states, whereas at all-India total level it almost remains the same during the lockdown months and thereafter. Both tables show the scale and intensity of migration through percentage changes in active subscribers among the states. The pre-COVID period from December 2019 to February 2020 shows normal movement, whereas intensity and speed increased from March 2020 onwards. The large migration in March also includes the annual reverse migration during the festival of Holi, apart from COVID-19–led reverse migration or exodus during the penultimate week of March.
Speed and Intensity of Reverse Migration in India During COVID-19: A Glimpse
Monthly Flow of Interstate Net Reverse and Return Migration in India Before and During the Covid-19
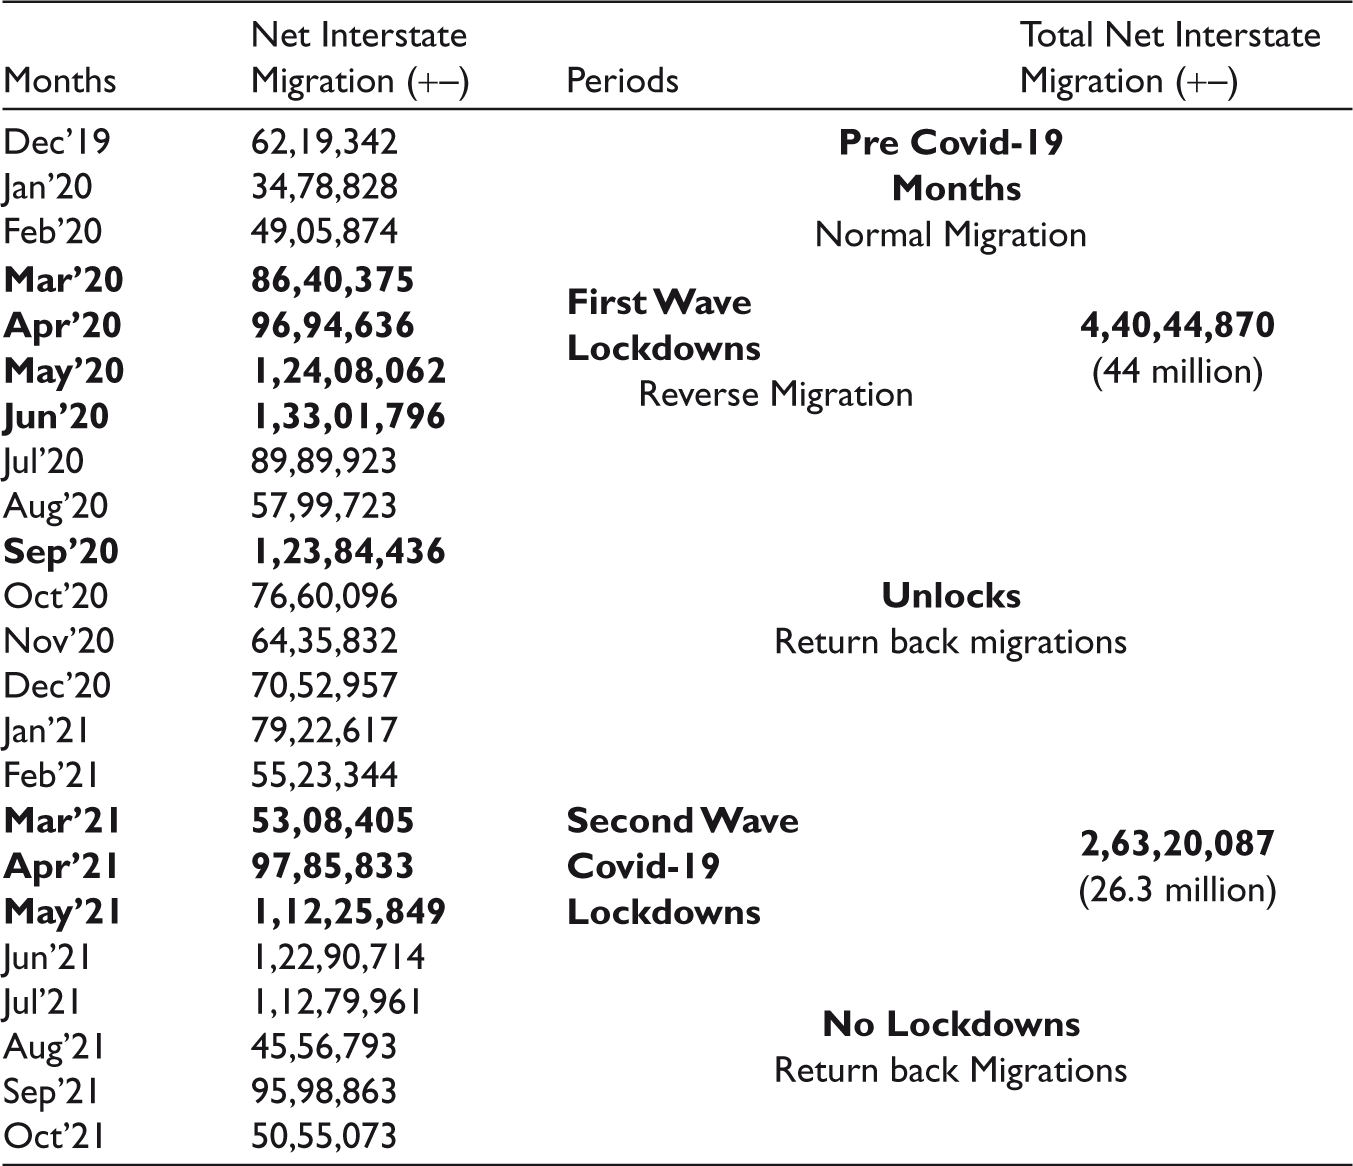
The net reverse movement of 44.1 million people (Table 2) during the short duration between March and June 2020 is unprecedented and unparalleled in the migration history of India, given the fact that most of this period also coincided with the world’s most stringent lockdown during which all the means of public transport were suspended (Ministry of Home Affairs, 2020a, 2020b). Ideally in this period the movement should have become zero but instead it got intensified. The finding suggests an exodus of 44.1 million migrants during the first wave. This shows a stark underestimation of COVID-19 lockdown reverse migration numbers in India in any of the available estimates. Further, even if we exclude the 6.3 million migrants who travelled by Shramik special trains between 1st of May 2020 and 31st August 2020, the 3.8 million who used flight services in June 2020 after partial resuming domestic flights (Airport Authority of India (AAI), 2020; Lok Sabha 2021,) and the net migrants in the month of March 2020 (as the lockdown was imposed on 25th of March) from our data, at least 35 million net interstate migrants moved using unconventional means and arduous routes to reach home, such as walking on foot, bicycling and other unusual means. Table 2 further shows the quick return movement of migrants back to cities, starting from July 2020 itself, with the return movement to cities peaking in September 2020 (12.3 million) after the first wave unlocks and again in June 2021 (12.1 million) after the second wave unlocks (trendline Figures 3 and 5 better reflect reverse and return migration between the months).
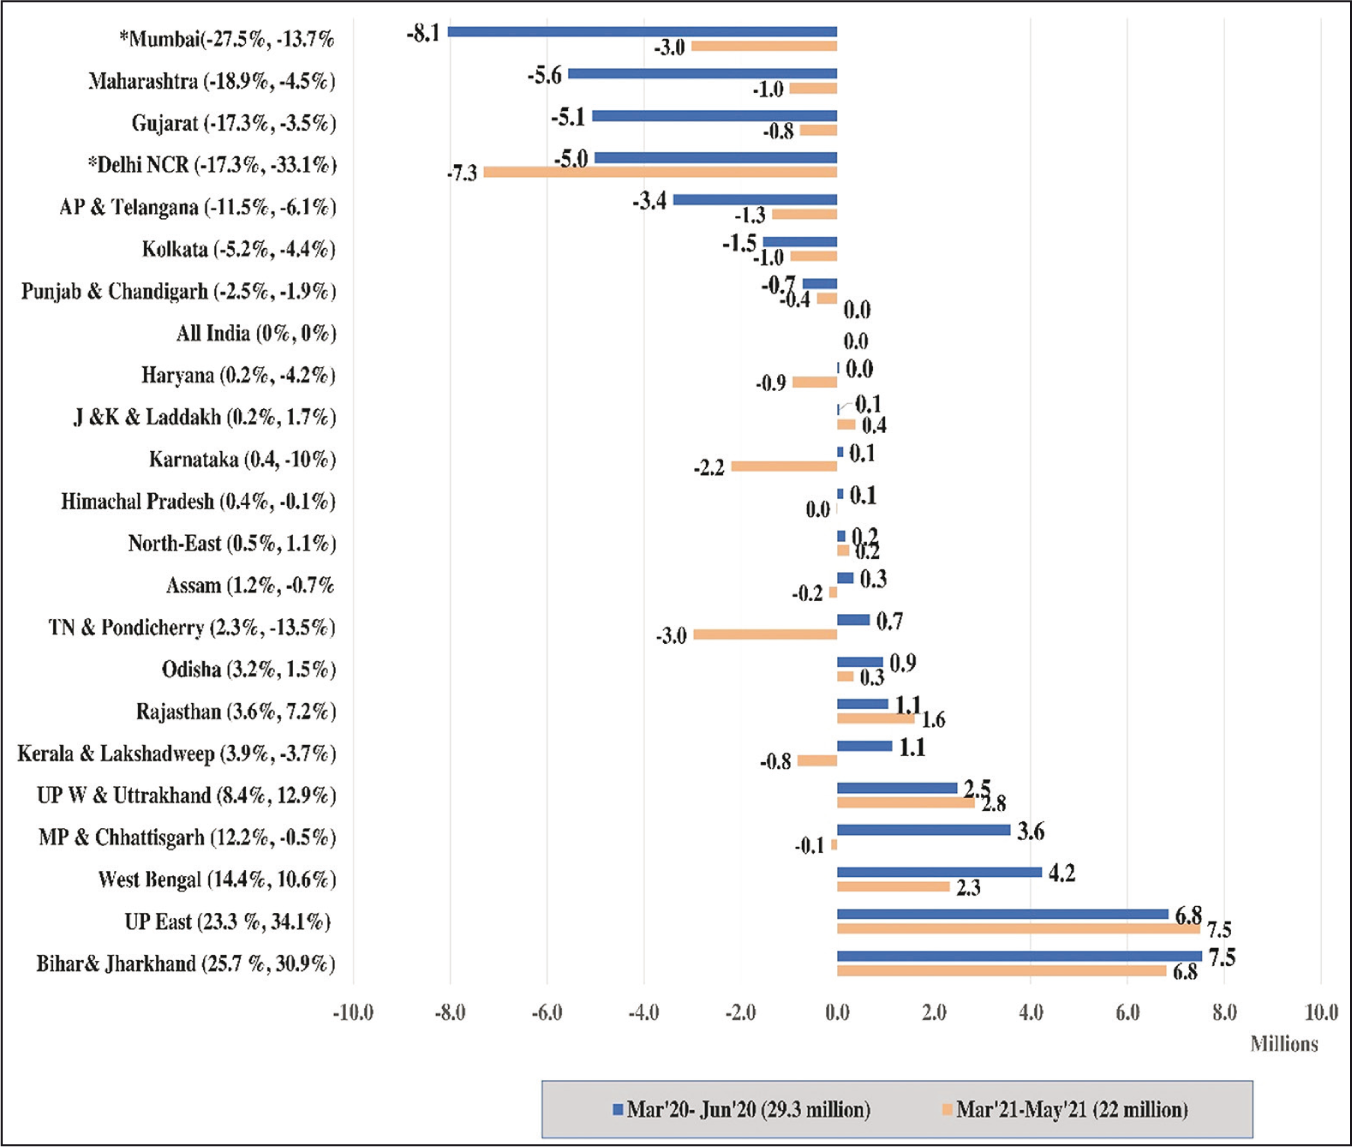
We further analyse the direction and number of circular migrants in India during the two waves of COVID-19 in Figures 1 and 2. Both the figures show less than total net migrants compared to those shown in Table 2 because of net adjustment between out- and in-migration in a few states between the calculating months (in-out migration adjustments between March 2020 to June 2020 and March 2021 to May 2021).
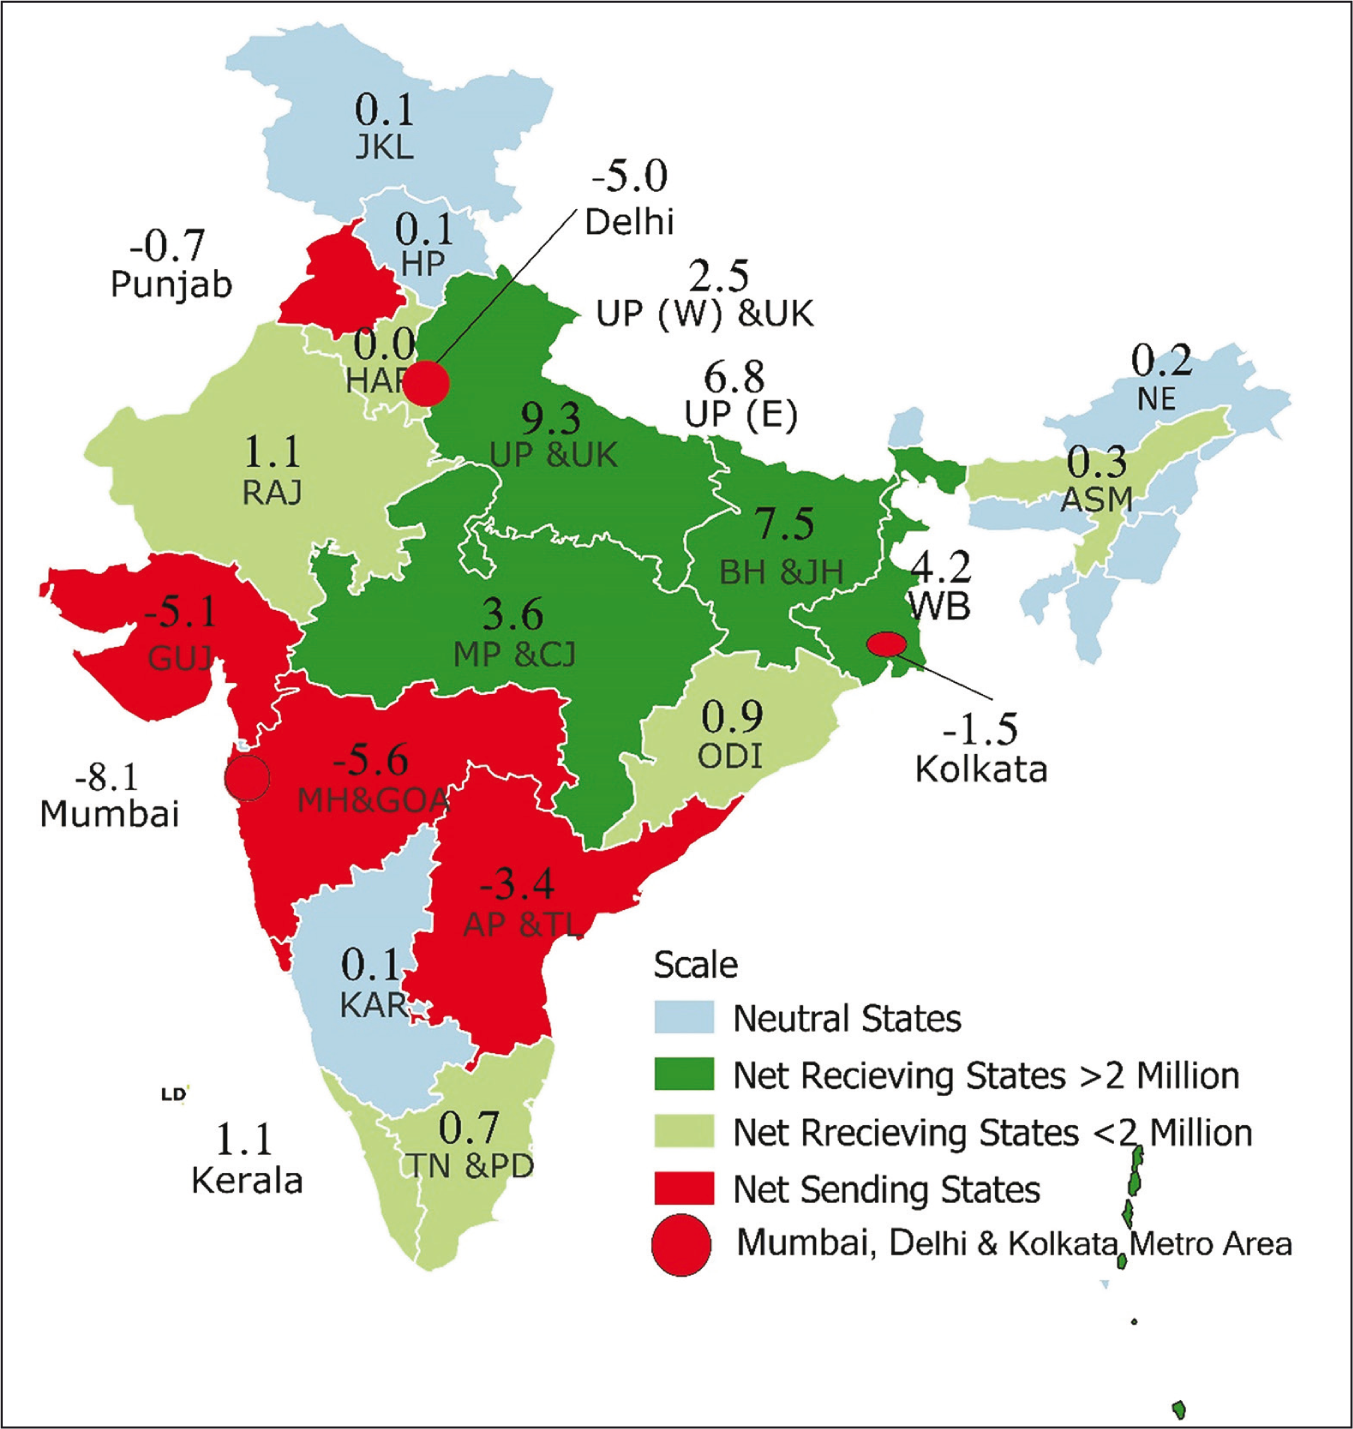
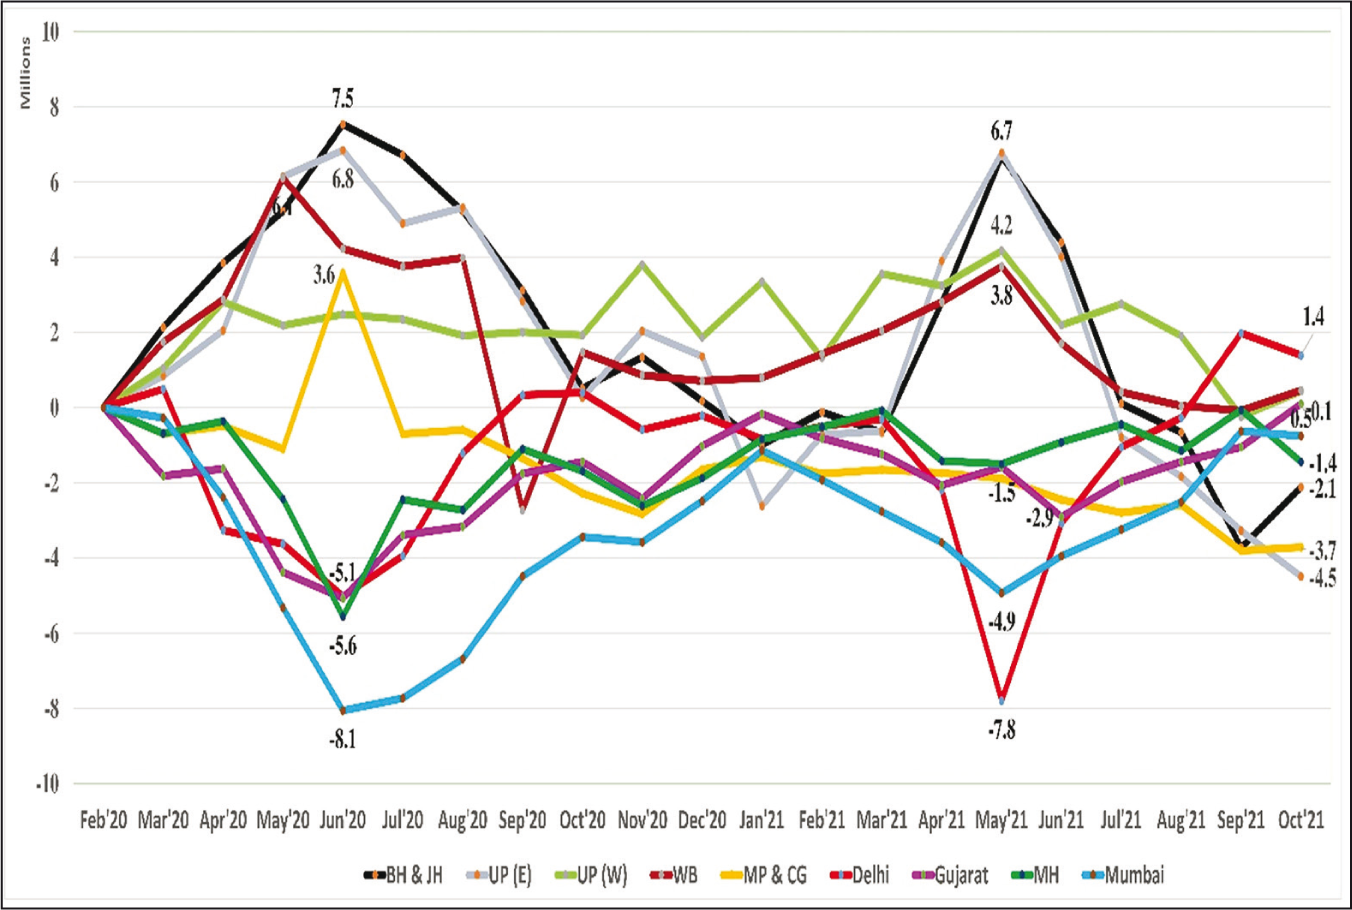
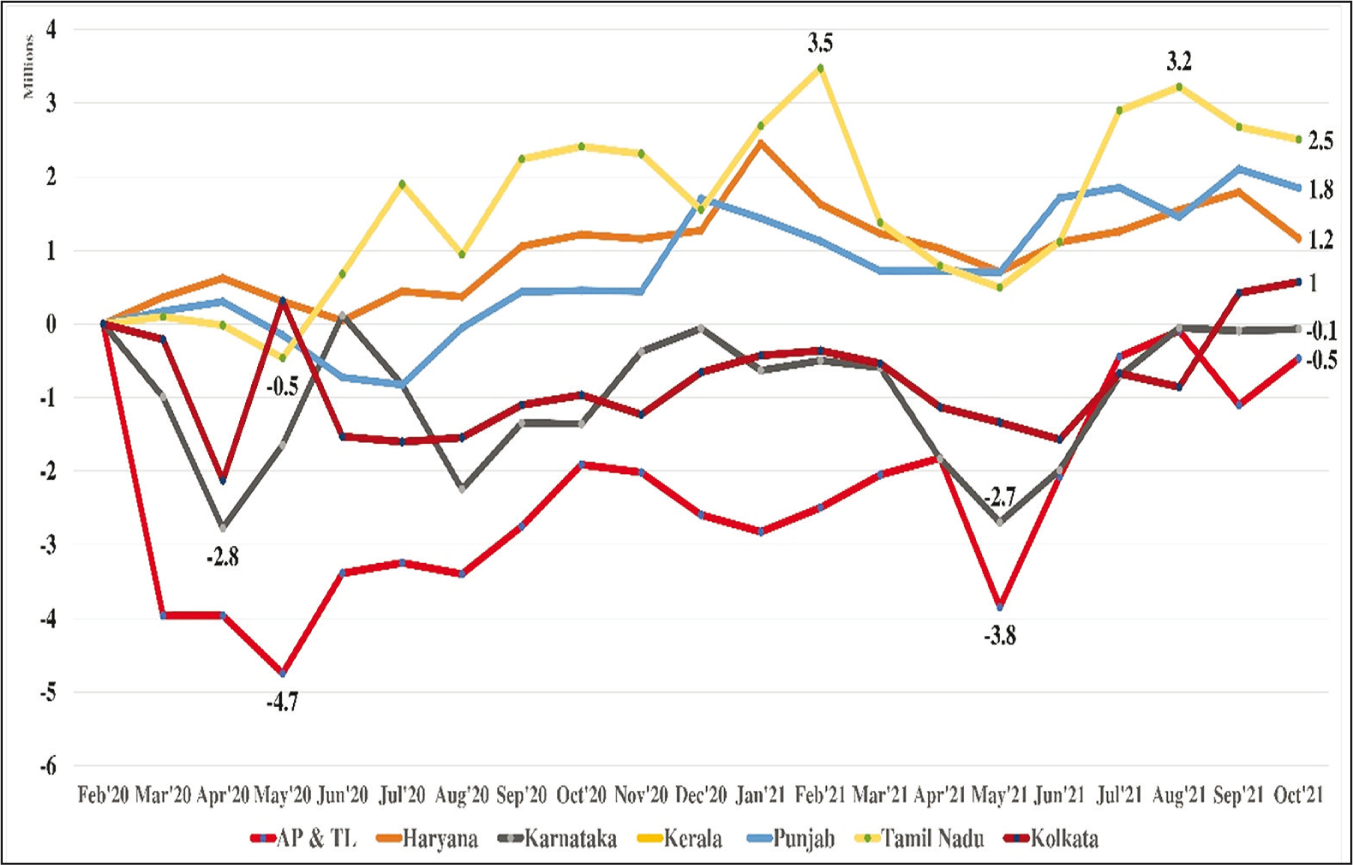
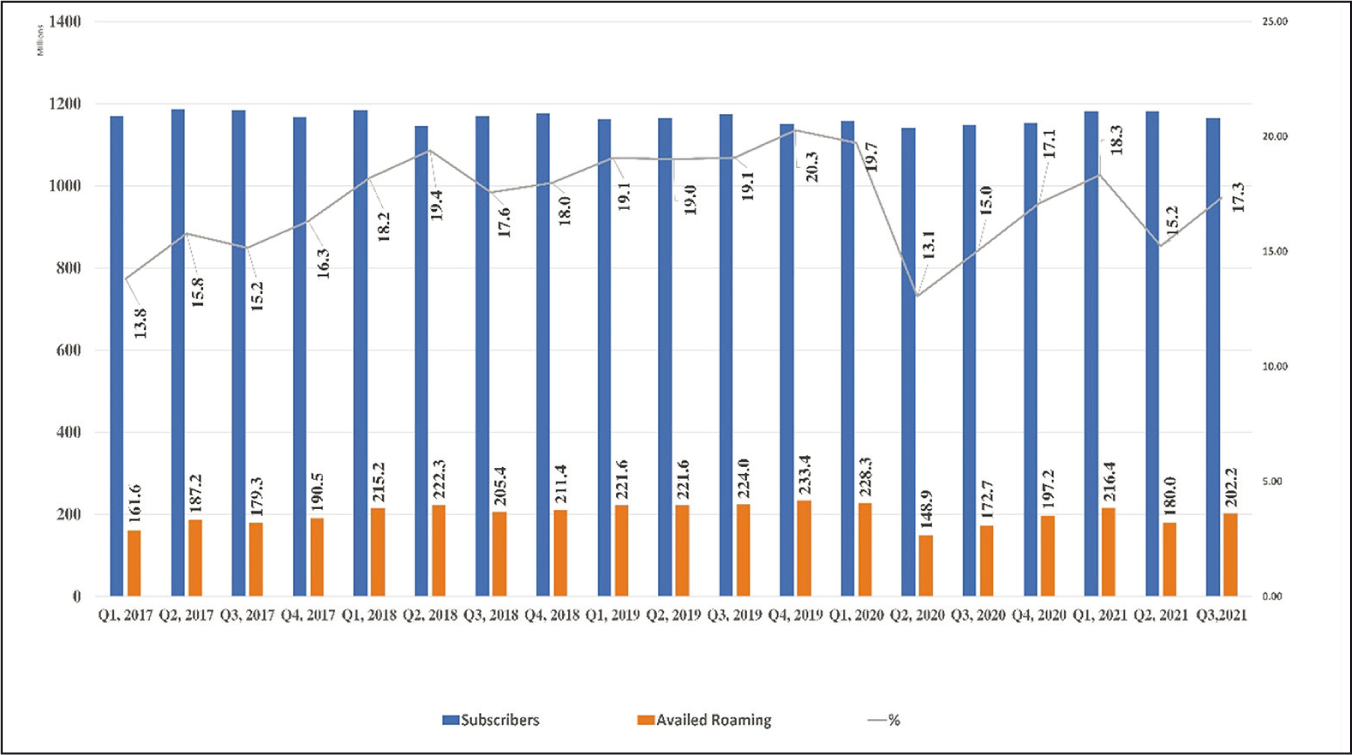
Figure 1 shows the number of migrants during two waves of COVID-19 lockdowns (29.3 and 22 million, respectively) and the direction of the movement, whereas Figure 2 shows the numbers of migrants and their direction during the first wave of lockdowns only. States shown in negative numbers are migrant-sending states whereas states in positive numbers are migrant-receiving states. Percentage in negative and positive numbers in Figure 1 shows each state’s percentage share in all-India total number of migrants during the two waves of lockdowns.
The direction of migrant movement is not different from all the other available data sources, including censuses, as the usual net reverse receiving and sending states remain the same (Bhagat & Keshri, 2021). The difference is only in scale and intensity of reverse migration. The data in the figures do not reflect all the interstate migrants in India as they only show migration during the lockdown periods. They reflect that those migrants are only a part of the total migration flows, that is, the circular, temporary, vulnerable and distressed migrants working in precarious and exploitative conditions, especially in the informal sectors or as self-employed in small enterprises. The figures also reveal some of the hostile urban agglomerations and pockets, where migrants found it difficult to sustain and feed themselves during the lockdowns and from where they preferred to reach home by walking rather than to stay, despite themselves significantly contributing to the development of those very agglomerations, cities and states.
Further, Figures 1 and 2 also show the differential role of distance and state policies in containing reverse migration during the two waves. During the first lockdowns, most of the reverse migration happened from the western and northern states mostly to the eastern region and central states. It was not only difficult for migrants in southern states to reverse migrate to eastern states without any means of transportation due to the long-distance but also migrant policies in states such as Kerala were helpful in containing the reverse migration. However, this trend changed during the more brutal second wave of COVID-19, mainly due to the availability of means of transportation. During the second wave, again, some of the urban agglomerations, such as Delhi, failed to retain the migrants, and therefore, more migrants (7.3 million) net reverse migrated than during the first wave (5 million) from Delhi. One similarity, despite some changes in net reverse sending state, between both the waves of the COVID-19 lockdowns, is the same set of net reverse receiving states. This signifies that the migrants originating in the eastern region such as Eastern Uttar Pradesh, Bihar and West Bengal are more circular and vulnerable, hanging on the margins of survival and lacking the capability to cope with livelihood shocks, such as pandemics and lockdowns.
Figures 3 and 4 show the trend of month-on-month net movement of migrants (in million) between March 2020 and August 2021 in two different clusters of states and metro cities. Both trendlines highlight the dominance of circular migration in India, the distressing scenario in many origin states in case of interstate migration and the emerging trends in some of the states. As unlocking started with the gradual reopening, migrants slowly started returning to their destinations. The trendline (Figure 3) shows that reverse migration peaked in June 2020, but from as early as July 2020, migrants started to return back to their destination cities. Migrants belonging to larger sending regions, such as Eastern Uttar Pradesh, Bihar and West Bengal, were very quick to return, and by November–December 2020, most of the migrants had returned. Both trendlines (Figures 3 and 4) further show the intensification in migration during the first wave of COVID-19, given that by February 2021 more people had migrated from the origin states than the number of reverse migrants, suggesting the negative effect of COVID-19 on the rural economy. In the case of West Bengal, the large reverse migration in October 2020 reflects the effect of the prominent annual Festival Durga Puja in late October when a large number of people return home, including those from the Kolkata LSA to celebrate the festival.
Both trendlines also clearly show a striking story in India’s internal migration trajectory: The presence of only a few destinations in a country with a billion-plus population. Instead of having a choice of destinations, migrants are compelled to migrate to a limited number of hostile pockets or agglomerations, irrespective of the availability of decent work in those places. The most densely populated three metro regions receive the largest share of internal migrants in India, which may also be the case for other big cities in India for which separate VLR data is not available. Megacities such as Delhi–NCR, Greater Mumbai and Kolkata have organically grown beyond their coping capacity. Some of these cities also host some of the world’s largest slums and slum populations in Asia, though those slums may also be functioning as an entry point for millions of low-skilled migrants in Indian cities, given the costly rentals outside. This skewed choice of the migrants provides a fertile ground for their exploitation, denial of decent living and basic citizenship rights. The concentration of industries and developmental activities in a few growth centres further leaves out the vast labour force living in far-flung areas such as the central-eastern tribal belt and eastern states, which may be ready to make the transition from agriculture but fear moving given the precarious labour markets and wage conditions in those few agglomerations.
Data further indicate that migrants were not returning to the same places as usual, where they faced the harshest conditions during the two COVID-19 waves. This is evident from the fact that cities and states such as Mumbai, Kolkata, Gujarat and Maharashtra did not receive back all the migrants they sent home during both COVID-19 waves up till August 2021. This is because of more migrants returning back to work from their states of origin, such as Bihar, East UP and MP to destination states. The trend from the date (Figure 3) further indicates that some migrants may be changing their destinations too. For example, Gujarat still has a deficit of 1.4 million from its February 2020 level, whereas AP has a 1.1 million deficit. Mumbai has half a million deficit from its February 2020 level. Among metro cities, the data from Mumbai suggest that it failed to bring back all the migrants it sent out during the lockdowns and is increasingly becoming an unattractive city for new migrants. The unattractiveness of Mumbai may be because of many reasons, including the precarity experienced during the COVID-19 lockdowns, saturation of developmental activities and other regions such as southern cities becoming more attractive.
Figure 4 indicates the different migration landscapes of the southern states such as Karnataka, Tamil Nadu and Kerala. Those states are not only large recipients of migrants from other states but are also migrant-sending states, especially among themselves and neighbouring states such as Maharashtra. This is clearly reflected by the volatility in the trend of movement during the lockdown months in those states. For example, Karnataka is not only a favoured destination for highly skilled migrants, as the data from the second wave reverse migration show, but it also received a large sum of lower-skilled reverse migrants during the lockdown months (May and June 2020) from states such as Maharashtra. Further, the trendline Figure 4 suggests that some states, especially Tamil Nadu (2.6 million) and Kerala (2.5 million), are receiving more migrants from eastern India, apart from Punjab (2.1), Haryana (1.7) and Delhi (1.9). This possibly hints to a COVID-19-induced change of direction in destination choices that might account for the loss of migrants to mega cities and states like Mumbai and Gujarat.
Figure 5 is possibly the most important figure for pondering on the current migration landscape in India. The figure shows the number of total subscribers and the number of subscribers availing interstate roaming services on a quarterly basis out of the total subscribers. The percentage line in the figure shows the percentage of subscribers availing roaming services and its quarterly changing trend. It highlights interstate mobility of Indians, which debunks the traditional view, originating from previous data and estimations, of limited mobility of Indians. As many as 233 million Indians use roaming services. The number was significantly reduced to 149 million during the first wave of COVID-19-led lockdowns between April and June 2020. This signifies an 80 million reduction in mobility, which was limping back to pre-COVID levels by the end of the fourth quarter of 2021.
The roaming numbers raise questions as to why as many as 233 million people were availing of roaming services in India during the pre-lockdown quarters? And how many of them belong to tourists and the usual commuter category? There was a reduction of only 80 million roamers during the second quarter of 2020 (April, May and June 2020), a period in which all tourist, travel and non-emergency visits were suspended and became almost impossible. The present roaming data are subject to interpretation, as now roaming exists only technically because of free domestic roaming services. Our interpretation would be that in all probability, the 149 million subscribers who availed of roaming during the lockdown months were interstate migrants of different kinds and duration, and among the remaining 80 million, a good number may be tourists, regular visitors and very short distance interstate migrants (who stopped roaming during the first wave of COVID-19 lockdowns or in the second quarter of 2020). This interpretation is based on the hypothesis that in practically roaming-free India, most of the migrants are availing of roaming services in the following ways. First, migrants are using roaming services in case they take mobile connections at their destination places, and whenever they return to their origin states, they continue to use roaming. Second, migrants who take mobile connections in their origin states and move to destination states continue to use roaming. This is evident from the further declining teledensity in some of the migrant origin states such as Bihar who are already having the lowest teledensity in India (TRAI, 2018, 2021b). Further, there is almost no rationality behind permanent residents or permanent migrants purchasing SIMs in other states and availing of roaming services unnecessarily. This interpretation also suggests that the reverse migrants presented through VLR data in this paper are the most vulnerable circular migrants, who are only a part of the total population of interstate migrants.
Conclusion
The data presented in this paper provide scientifically reliable numbers bringing clarity to the spread and breadth of interstate net reverse and return migration during the two waves of COVID-19 lockdowns and the subsequent return migration in India. The migrant exodus, quick returns and the direction prove that a large number of internal migrants in India are circular, coming mostly from economically underdeveloped regions. The migration crisis during COVID-19 further reveals the paradoxes of developmental goals and achievements in modern India, where the state and market seemingly failed to take care of such invisible internal migrants despite their contributions to the economy. The policy dimensions of addressing such distressed populations should not be limited to interim relief, such as providing rations or travel support.
Given the spread and breadth of India’s geographical landscape, roaming data reveal numbers of interstate migrants that are much higher than those reported in any other surveys or censuses, reflecting the increased mobility of Indians and significant underestimations of such mobility to date. The VLR and roaming data presented in this paper open up new uses of big data on migration that have the potential to at least detect the flow, direction and intensity of mass movements during extraordinary situations, such as pandemics, cyclones and other disasters on a real-time basis. Moreover, the strength of VLR and roaming data lies in detecting migrant flows without the sedentary biases found in other data sets in its coverage of the population in terms of number of active mobile subscribers. There is further scope for improving the reporting of VLR and roaming data, such as providing average VLR and median VLR data along with peak VLR data in the subscription reports, which would further aid the decoding of migration processes. Aggregating and reporting real-time roaming data on interstate movement would be easy for TSPs to provide as they already report quarterly roaming data but currently only at all-India levels. Mobile roaming data have huge potential to reveal more about internal migration in India. For example, providing roaming data of roamers about the duration of their stay in states, seasonality of movements, directions of circularity and corridors of movement, etc. can lead to a better understanding of the migration landscape and help in extending services to vulnerable and needy groups of migrants. Other countries and regions too can better utilize their TSPs’ existing HLR–VLR and roaming network architecture, following the improved data aggregation and reporting models used in India, while avoiding the privacy issues associated with much used CDR, social networking sites and GPS data. We hope that making this kind of data available will transform the future understanding of migration processes and expand the scope for evidence-based and evidence-backed policy framing mechanisms.
Footnotes
Data Availability Statement
The datasets has been aggregated from TRAI’s monthly/quarterly reports and are publicly available on TRAI website. Data analysis tables are available from the corresponding author on reasonable request.
Declaration of Conflicting Interests
The authors declared no potential conflicts of interest with respect to the research, authorship and/or publication of this article.
Funding
The authors received no financial support for the research, authorship and/or publication of this article.