
Abstract
The COVID-19 pandemic significantly impacted Bangladesh’s economy, leading to disruptions in supply chains and a decline in business activities. To counter these effects, the government introduced stimulus packages aiming to aid business recovery. This article evaluates the impact of these measures using a unique dataset from the Business Confidence Index survey conducted by the South Asian Network on Economic Modeling in April 2021. This survey covered 503 firms across eight divisions in Bangladesh. Using the Propensity Score Matching technique for causal estimation, findings suggest that firms that availed the stimulus packages demonstrated around 9 percentage points higher recovery than those that did not. Such insights are instrumental for future policy design and strengthening evidence-based policymaking.
Keywords
Highlights
By March 2021, firms restored 57.4% of pre-COVID business levels.
Stimulus packages were deemed effective by 83% of recipient firms in supporting business.
Manufacturing, export-oriented and large firms were more likely to get stimulus packages.
Firms that received stimulus packages recovered 9 percentage points more than those who did not.
Stimulus packages aid economic recovery but reveal gaps in implementation and sectoral focus.
Introduction
The onset of the COVID-19 pandemic caused a massive shock to private sector businesses worldwide, undermining recent strides made in poverty reduction and economic growth (Raihan et al., 2021; World Bank, 2020). The pandemic’s restrictive measures, including global shutdowns, limited mobility and economic activity and increased transaction costs, particularly in cross-country trade. Such measures also disrupted resource allocation within countries and across sectors, impeded efficient economic allocation and suspended production (CRS, 2021; World Bank, 2020).
Empirical studies have painted a grim picture of the pandemic’s fallout on global businesses and employment. Common themes include depressed demand, liquidity crises, wages cuts, layoffs, extensive business closures and widespread income loss (Adams-Prassl et al., 2020; Balleer et al., 2020; Bartik et al., 2020; Dai et al., 2020a, 2020b; Fairlie, 2020; Humphries et al., 2020; Raihan et al., 2020). Small and medium enterprises (SMEs), in particular, faced intense financial challenges due to plummeting revenue (Apedo-Amah et al., 2020; Bartik et al., 2020; Raihan, et al., 2020; Zhang, 2020).
In light of these challenges, countries across the world invested trillions of dollars in the form of stimulus packages. These interventions, both fiscal and monetary, targeted sectors including health care, agriculture, manufacturing and services. While the intent was universal, rejuvenating lives, livelihoods and businesses, the magnitude of support varied (Bayer et al., 2020; Cheng et al., 2020; Gourinchas, 2020). Advanced economies often allocated over 10% of their GDP, while developing nations earmarked between 1% and 3%. Notably, developed countries channelled about 40% of these funds to businesses, a figure that stood at 25% for developing nations (Cirera et al., 2021).
Bangladesh, reflecting global trends, faced several repercussions from the pandemic, affecting its population’s lives, livelihoods and the business sector’s confidence, leading to reduced investment (Raihan et al., 2020). To mitigate these adverse effects, the Government of Bangladesh (GoB) announced 23 support measures by April 2021, totalling approximately BDT 1,222 billion or 4.46% of the GDP. A significant 79.12% of this sum was dedicated to business firms as liquidity support, equivalent to 3.53% of the country’s GDP (BB, 2021). These interventions aimed to facilitate business recovery, a topic this article seeks to delve into, examining the efficacy of these packages and discerning disparities in recovery between recipient and non-recipient firms.
To assess the impact of the stimulus packages on business recovery, we leveraged data from the fourth round of the Business Confidence Index (BCI) survey, executed in April 2021 by SANEM. This survey captured insights from top managers of 503 firms across Bangladesh. Crucially, it incorporated a subjective question on business recovery, prompting respondents to evaluate, in percentage terms, how their business had rebounded compared to pre-pandemic levels (March 2020). For clarity, ‘business recovery’ in this context encapsulates a holistic view, encompassing elements such as profitability, employment, investment, sales or exports, wages and overall business cost. This subjective assessment offers a comprehensive gauge of the business climate in the aftermath of the pandemic.
Large policy interventions require careful assessment and evaluation. Such evaluations can provide insights into the policy’s impacts on specific communities, thereby illuminating the strengths and limitations. Empirical evidence can inform decisions concerning the modification and expansion of existing interventions, as well as the planning of future ones. The evaluation’s findings, thus, catalyse advocacy for behavioural, attitudinal, policy and legislative adjustments across all levels. In this study, we assess the impact of stimulus packages on business recovery—this will serve as a gateway for a discussion about several aspects of the COVID-19 policy response.
This article is structured as follows: The second section reviews the related literature. The third and fourth sections provide an overview of the COVID-19 landscape and the GoB’s stimulus packages, respectively. The fifth section details the data sources, and the sixth section briefly highlights descriptive insights from the data. The study’s empirical framework is articulated in the seventh section, while the eighth section delves into the PSM technique and the findings. Finally, the ninth section concludes with recommendations.
Literature Review
Several studies (Baldwin, 2020a, 2020b; Baldwin & di Mauro, 2020; Chetty et al., 2020; Cui et al., 2020; Ferguson et al., 2020; Gaspar & Mauro, 2020; Georgieva, 2020; Granja et al., 2020) examined a range of emerging policy responses to COVID-19 and offered recommendations on how policy frameworks should emerge. However, their major attention was on the advanced economies perspective and particularly focused on the impact of the specific programme on businesses.
For instance, Chetty et al. (2020) and Granja et al. (2020) examined the United States’ Paycheck Protection Program (PPP) targeting public firm borrowers. Chetty et al. (2020) used daily statistics on consumer spending, business revenues, employment rates and other important indicators, leveraging difference-in-difference estimates. Their findings underscored that while PPP significantly increased consumer spending for low-income households, its effect on small business employment was modest at best, boosting it by only 2%. Similarly, Granja et al. (2020) observed that the immediate employment impact of the PPP was minimal, especially when considering the extensive scale of the programme.
In a study centred on China, Cui et al. (2020) investigated the ramifications of a payroll tax cut initiated in response to the pandemic. Their findings highlighted that this fiscal incentive presented immediate and substantial relief to businesses, especially benefiting vulnerable businesses facing labour-intensity challenges.
Looking beyond the immediate context of COVID-19, previous crises offer pertinent insights. De Mel et al. (2012) examined the impact of humanitarian assistance and access to finance taken after the Tsunami of December 2004 on the recovery of Sri Lankan micro-firms using panel data through a randomized experiment. They found that enterprises that receive support randomly restored profit levels nearly two years before other affected firms. They also pointed out that business recovery was significantly slower than widely imagined and emphasized the importance of targeted aid in accelerating recovery for micro-enterprises after disasters.
Similarly, drawing from the 2008 financial downturn, Bruhn (2020) examined the impact of a wage subsidy programme in Mexico on employment in durable goods manufacturing firms through Euclidean distance matching and a difference-in-difference technique. The study revealed that wage subsidies had a beneficial effect on employment during the programme’s tenure, with magnitudes ranging from 2.7% to 8.7% based on the specification. After the programme ended, the extent of the effect increased to around 18%, and the statistics showed that employment in eligible industries rebounded quicker than in ineligible industries. The results suggested that the Mexican wage subsidy programme was an effective instrument for addressing unemployment in the aftermath of a recession.
Based on the insights from the literature discussed above, it is evident that crisis-induced policy measures often yield positive outcomes, particularly in the areas of employment and profitability restoration. Notwithstanding, no particular study analysed the impact of stimulus packages on business recovery using micro-level data, especially in the context of COVID-19. This article filled the literature gap, focusing on the impact of the stimulus packages on business recovery in the context of Bangladesh, employing the PSM technique.
Overview of the COVID-19 Scenario in Bangladesh
Bangladesh confirmed its first COVID-19 case on 8 March 2020. In response to the rising number of cases in the following days, the country announced public holidays starting 26 March 2020 to curb the spread of the pandemic. These holidays then turned into a countrywide lockdown as cases continued to rise. Due to the imposition of the lockdown and other stringent measures, the business firms faced several difficulties such as a decline in sales or export orders, an increase in input prices, disruption of the supply chain, a decline in product demand, inadequate governmental support and increase in shipping and freight charges (Raihan et al., 2021).
Though the lockdown was extended multiple times, it was eventually lifted on 30 May 2020. Offices and public transportation resumed even as case numbers were still increasing. Subject to maintaining compliance with health and safety guidelines, workplaces were permitted to operate on a limited scale. By 18 June 2020, the confirmed cases crossed 100,000 and within one month it doubled. The confirmed cases exceeded 300,000 with the death toll reaching 4,100 by 26 August 2020. However, all restrictions on public movement and activities were lifted on 1 September 2020.
From December 2020 to February 2021, the country experienced a gradual decline in infection rates. The positivity rate dipped below 5% for the first time from mid-January 2021 and remained so until early March 2021 (Figure 1). In the meantime, the country started mass vaccination on 7 February 2021.
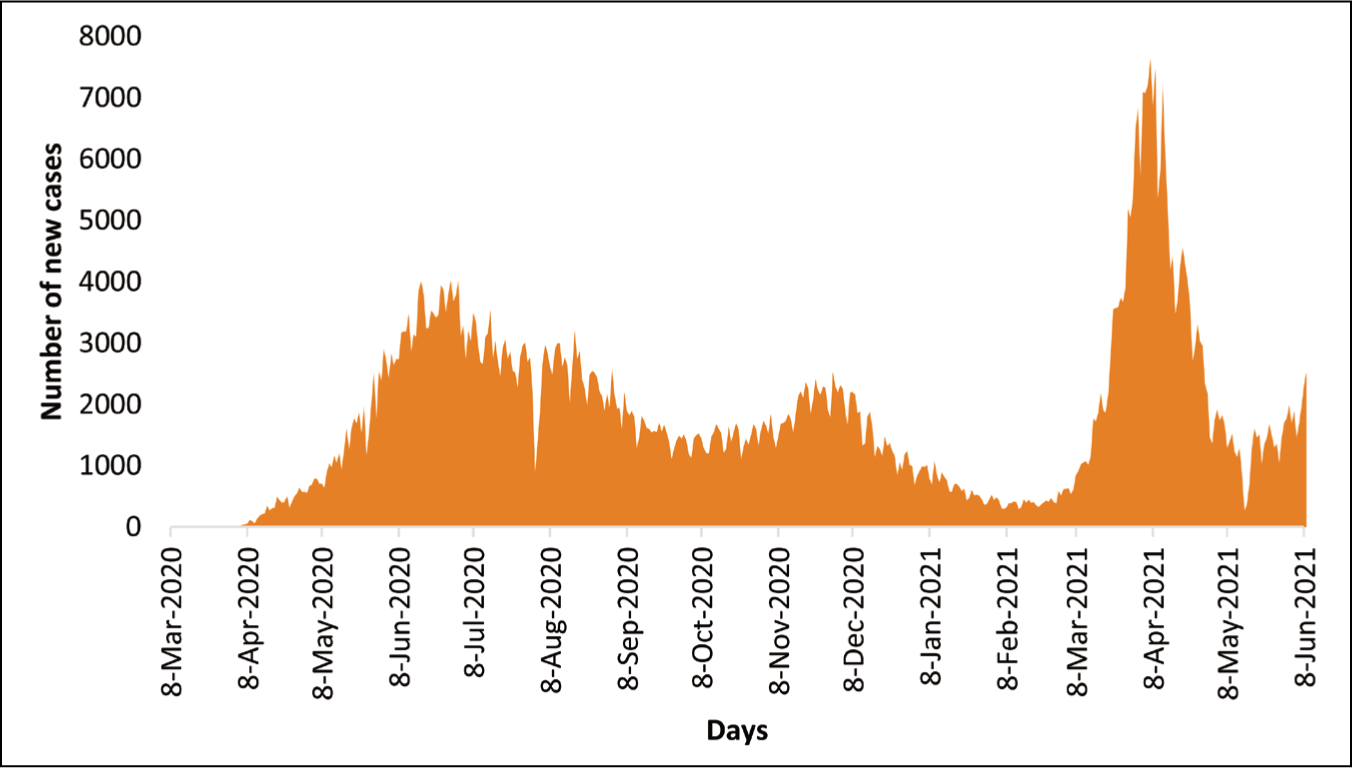
Nonetheless, a second wave of the pandemic emerged in mid-March 2021 and lasted until early-May 2021. In response to this resurgence, a second countrywide lockdown was instituted on 5 April 2021, which was also extended several times. As the study’s time frame encompasses March 2020 (pre-pandemic) to March 2021 (after one year of the pandemic), development beyond this period is deemed outside its scope and, thus, is not detailed in this section.
Overview of Bangladesh’s Stimulus Response to COVID-19
In response to the devastating effects of the pandemic, the GoB announced its first stimulus package on 31 March 2020. By April 2021, the GoB introduced a total of 23 support measures, combining both liquidity support and fiscal stimuli. These programmes had a total value of BDT 1,222 billion accounting for 4.46% of the country’s GDP. Out of these 23 support measures, 13 were cash transfers and food assistance (fiscal stimulus packages) and the remaining 10 packages were government-supported bank loans at subsidized interest rates (liquidity supports) (Table 1).
Stimulus Package to Address COVID-19 and Economic Recovery.

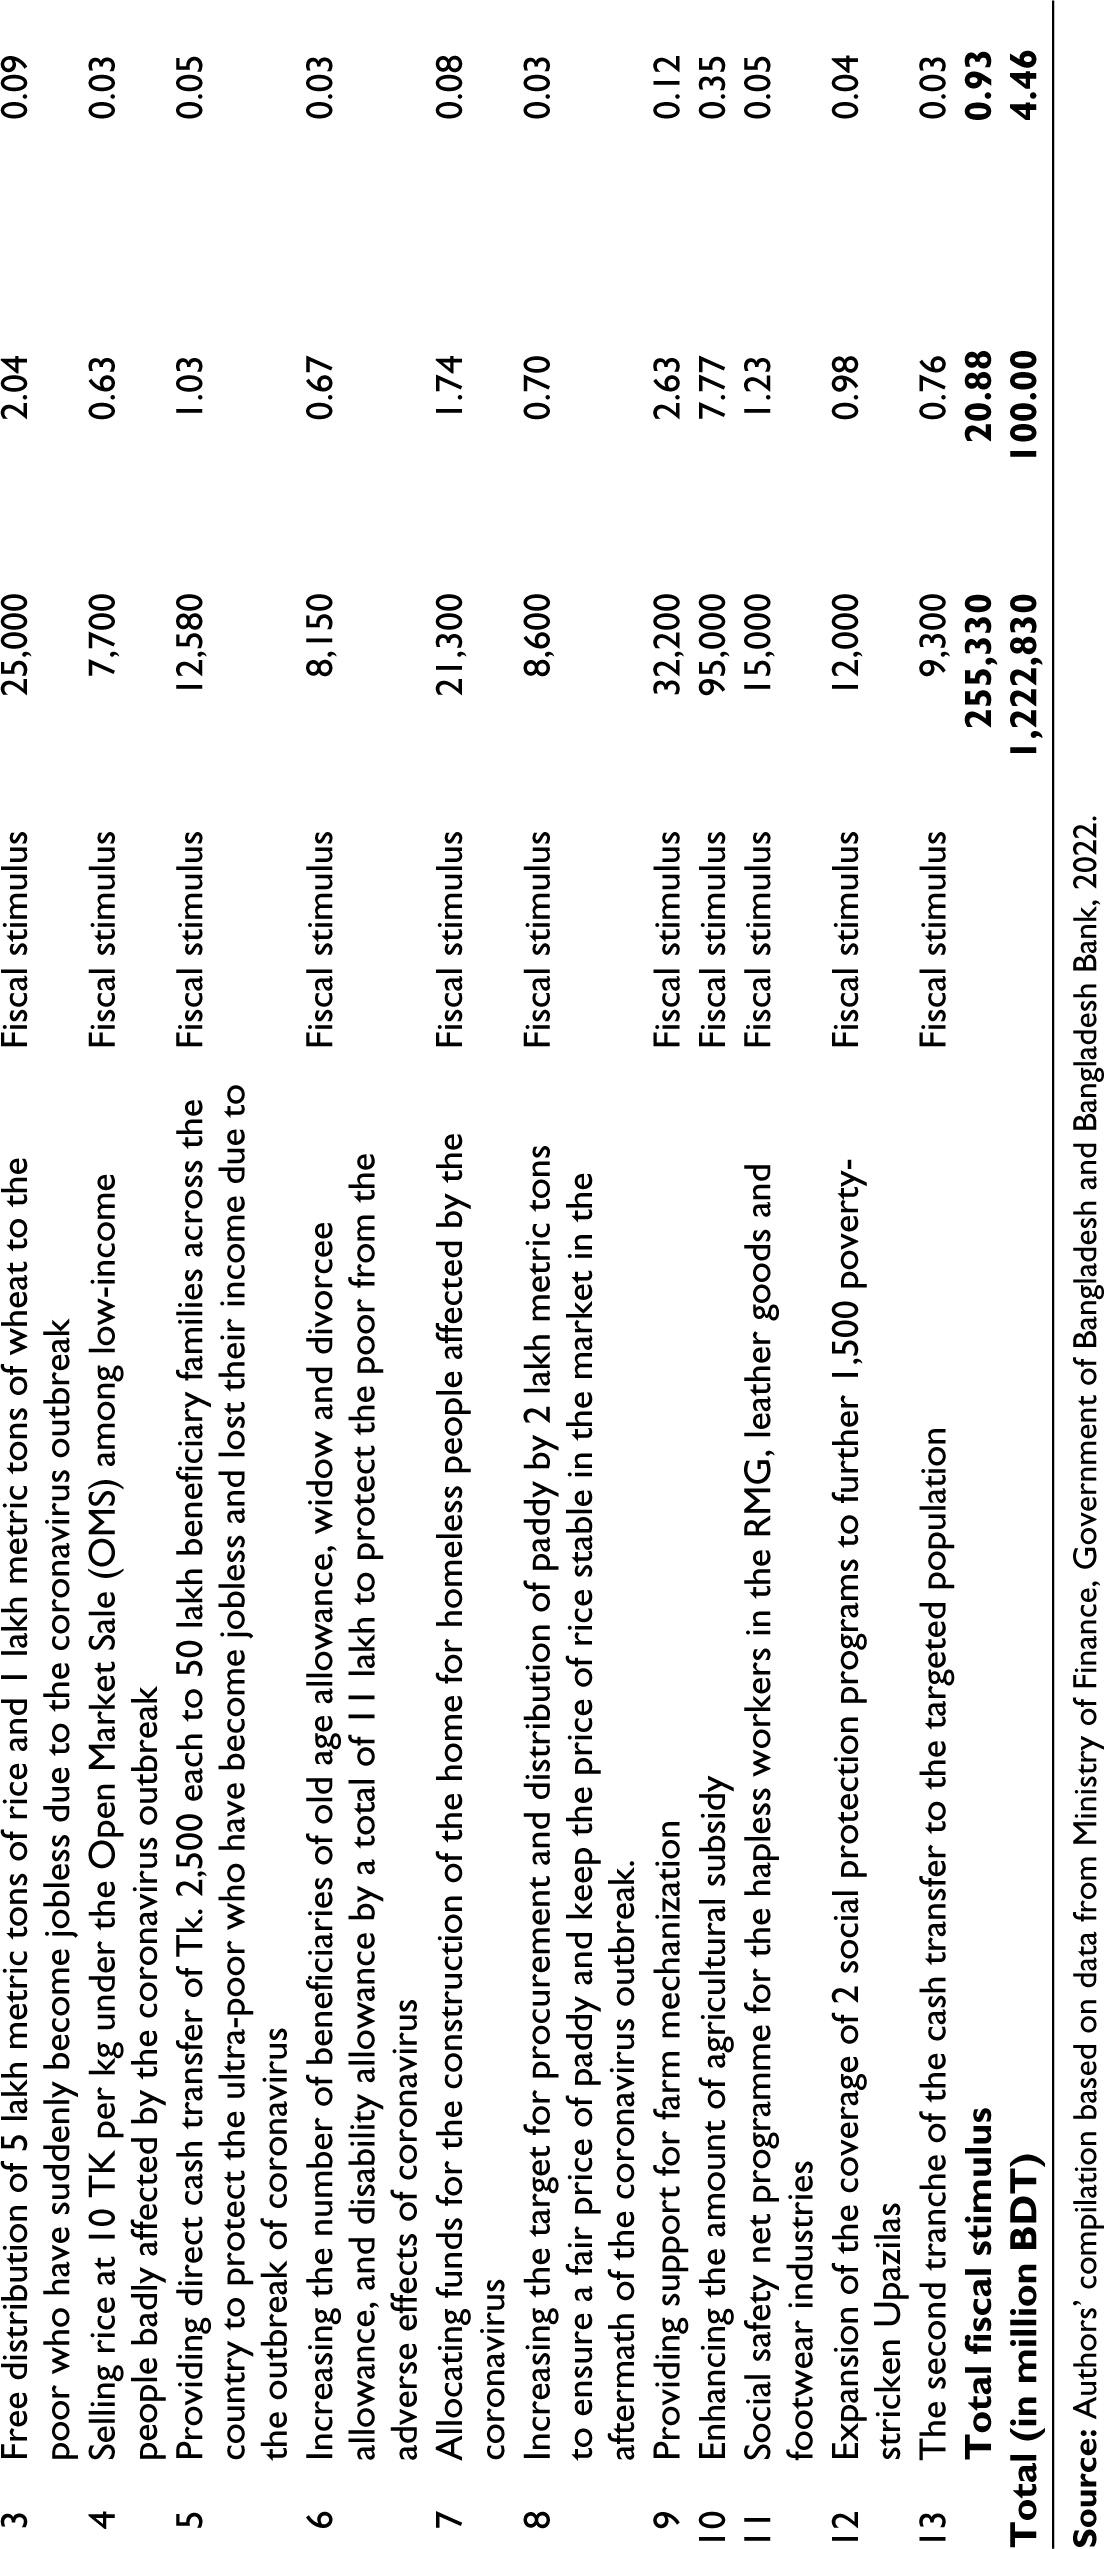
The liquidity support aimed at business sustenance amounted to BDT 967.5 billion, which is 79.12% of total stimulus and 3.53% of GDP. The major liquidity measures taken by April 2021 are as follows: (i) an allocation of BDT 50,000 million to cover three months of wages for workers in export-oriented industries. This support was structured as a two-year loan for factory owners, carrying a 2% interest rate; (ii) a provision of BDT 400,000 million for banks to extend as working capital to sectors impacted by the pandemic. These loans carried a 9% interest rate, of which the government subsidized 4.5%; (iii) a BDT 200,000 million facility for banks to offer as working capital loans to the micro, cottage, SMEs. Though these loans had an interest rate of 9%, the government bore 5% as a subsidy; (iv) a BDT 127,500 million enhancement to the Export Development Fund of the Bangladesh Bank under the back-to-back letter of credit arrangement to increase raw material imports. These funds carried a 2% interest rate; (v) the launch of a BDT 50,000 million pre-shipment credit refinance scheme to promote local products and exports. End users faced an interest rate of 6%, while banks incurred a 3% interest rate when borrowing from the central bank.
The Bangladesh Bank was tasked to implement and monitor all the liquidity support measures. As of April 2021, they had disbursed approximately 70% of the total allocated funds (BB, 2021).
Data: Survey Approach and Coverage
This article utilizes the fourth-round data of the BCI survey, conducted in April 2021 by the South Asian Network on Economic Modeling (SANEM) in collaboration with the Asia Foundation. While multiple rounds of the BCI survey were available, the study used only the fourth-round data for three reasons. First, it followed a year after the announcement of the stimulus packages and, thus, captured short-term causality. Second, it captured all the dynamics of the first wave of the pandemic. Third, it included a new subjective question: ‘Compared to the pre-pandemic situation (March 2020), to what extent has your business been able to recover?’ This subjective response 1 served as the study’s outcome variable, facilitating the assessment of the stimulus packages’ impact on business recovery.
Sample and Sampling Technique
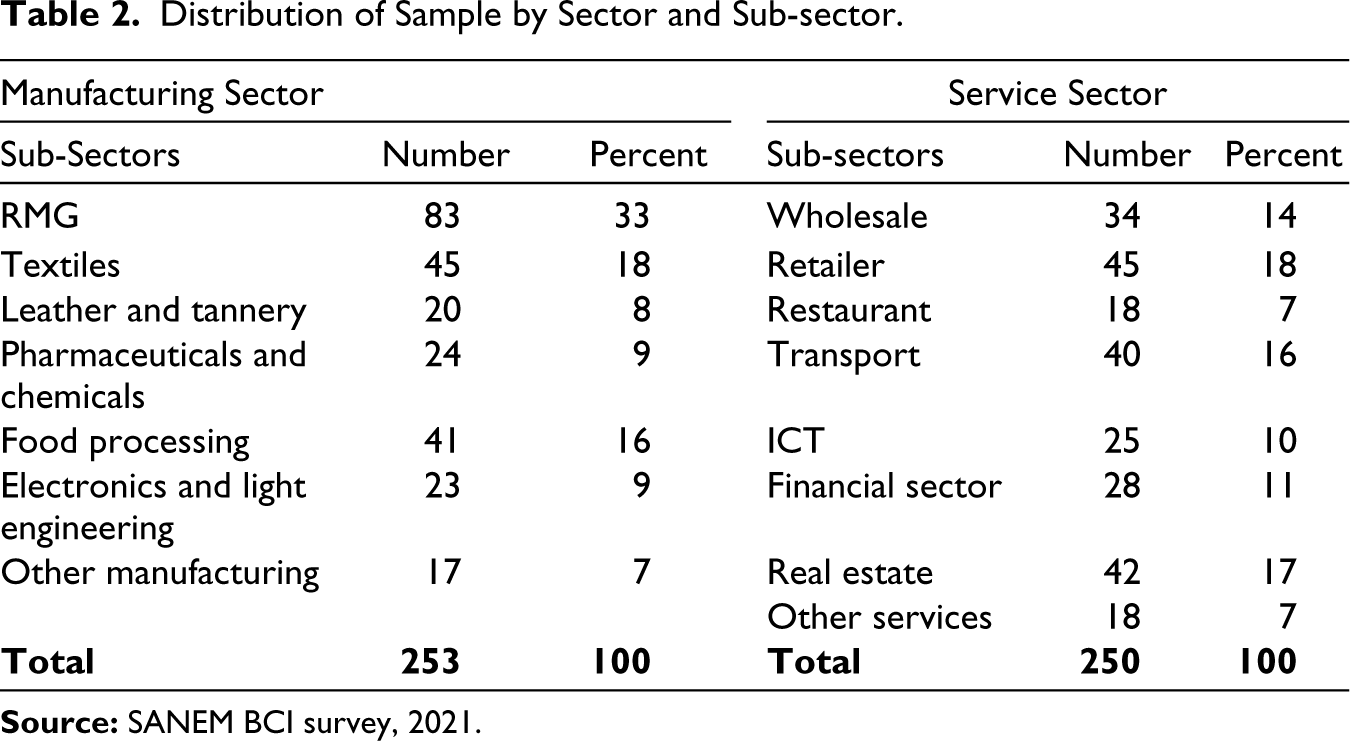
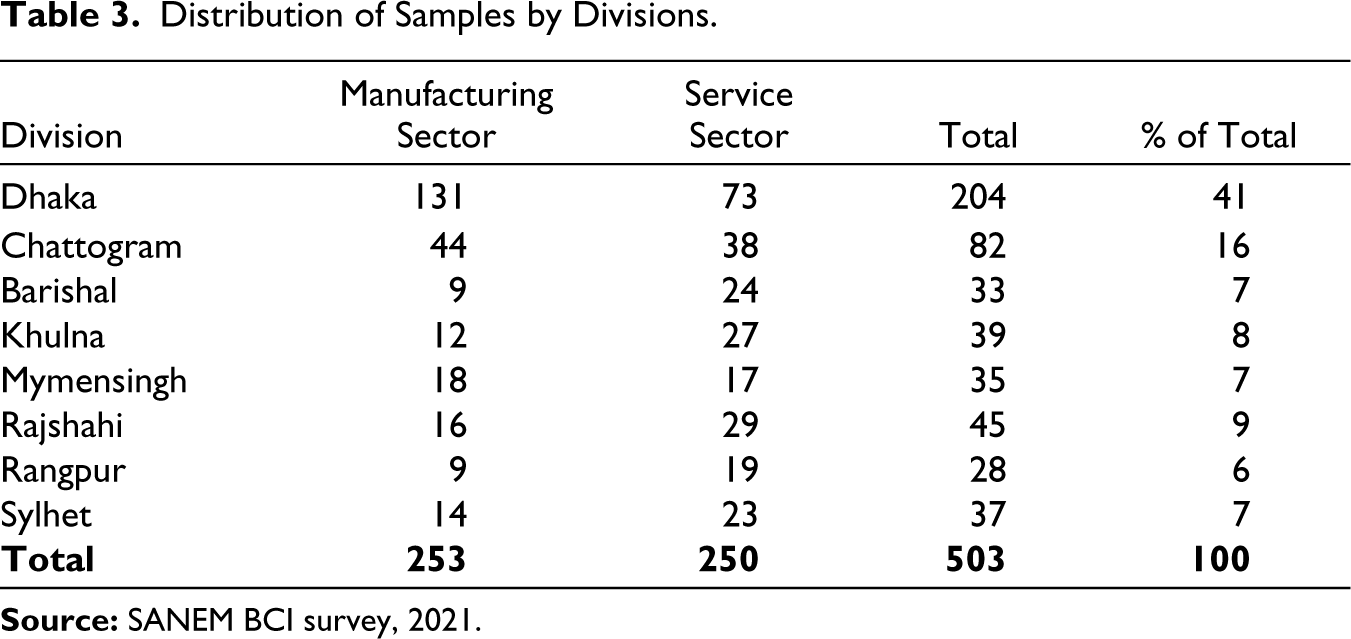
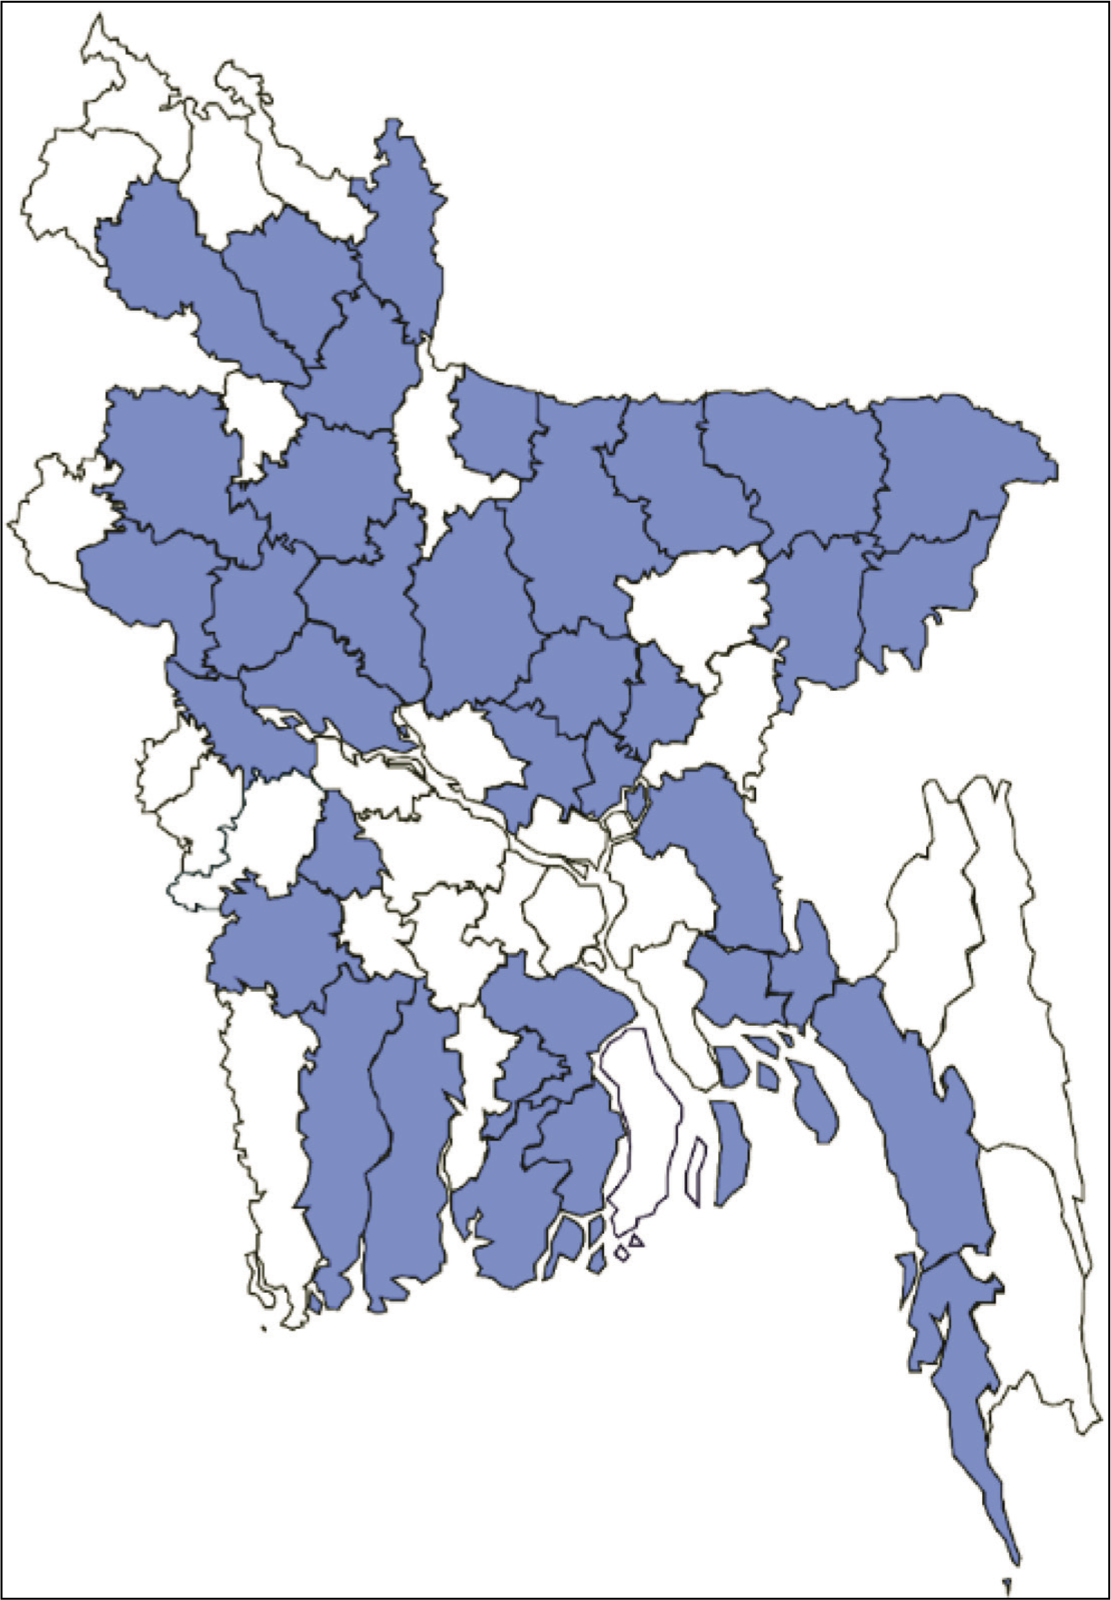
The survey interviewed the top managers of 503 firms across 8 divisions in Bangladesh over the phone. The sample size was determined through stakeholder consultations and expert opinions. It covered firms from both manufacturing and services sectors. 2 Notably, half of the firms represented the services sector, reflecting its proportionate contribution to the national GDP. In determining the sample sizes within the intra-industry context, a systematic approach was employed. It is worth noting that Bangladesh predominantly concentrates its economic activities within a limited number of industrial sectors. 3 Therefore, choosing samples only based on the relative shares of the sectors’ gross value addition would lead to a highly concentrated sampling in only a few sectors. Hence, a two-step sample selection procedure 4 was followed to ensure an appropriate representation of the major subsectors (Table 2). The survey’s design also prioritized geographical representation, distributing sub-sectors across the divisions (Table 3) based on their weights on industrial concentration 5 . Firms within each division were chosen randomly. 6 The randomly drawn samples covered 37 districts of Bangladesh (Figure 2).
Distribution of Sample by Sector and Sub-sector.
Distribution of Samples by Divisions.
Key Findings of the Survey
While there were setbacks due to the countrywide lockdown since March 2020, the GoB timely initiated several incentive packages to boost economic activities and thereby support businesses in the recovery process. Many businesses sought to benefit from these packages. Yet, by March 2021, the 4th round of the BCI survey revealed that only 22% (110 firms out of 503) of the surveyed firms received stimulus packages. Among these recipients, a significant 83% acknowledged the effectiveness of the packages in aiding their business operations.
The survey found that, by March 2021, firms had, on average, restored 57.4% of their pre-pandemic operational levels. This implies that both firms that received stimulus and those did not experienced some degree of recovery. Notably, firms that benefited from the stimulus saw a more marked recovery of 72.4%, compared to the 53.1% recovery of non-recipient firms.
Several other factors including geographic location (division), sectoral classification, operational location (inside or outside EPZ), female ownership, export status, firm size and operational tenure, also influenced business recovery. Table 4 presents the recovery percentages from the aspect of these factors. Geographically, firms in the Sylhet division experienced the highest recovery of 71%, followed by Dhaka (61%), Rajshahi (59%) and Chattogram (58%). Firms from these divisions surpassed the overall average recovery of 57.4%. As to major economic sectors, the manufacturing sector showed a greater rebound as opposed to the services sector. While the recovery in the manufacturing sector stood at 61%, it was only 53% for the services sector. Delving deeper into sub-sectors, the financial sector had the largest recovery of 73%, followed by pharmaceuticals (72%), ready-made garment (RMG) (69%) and textile (68%), amongst others.
Business Recovery with Several Indicators.
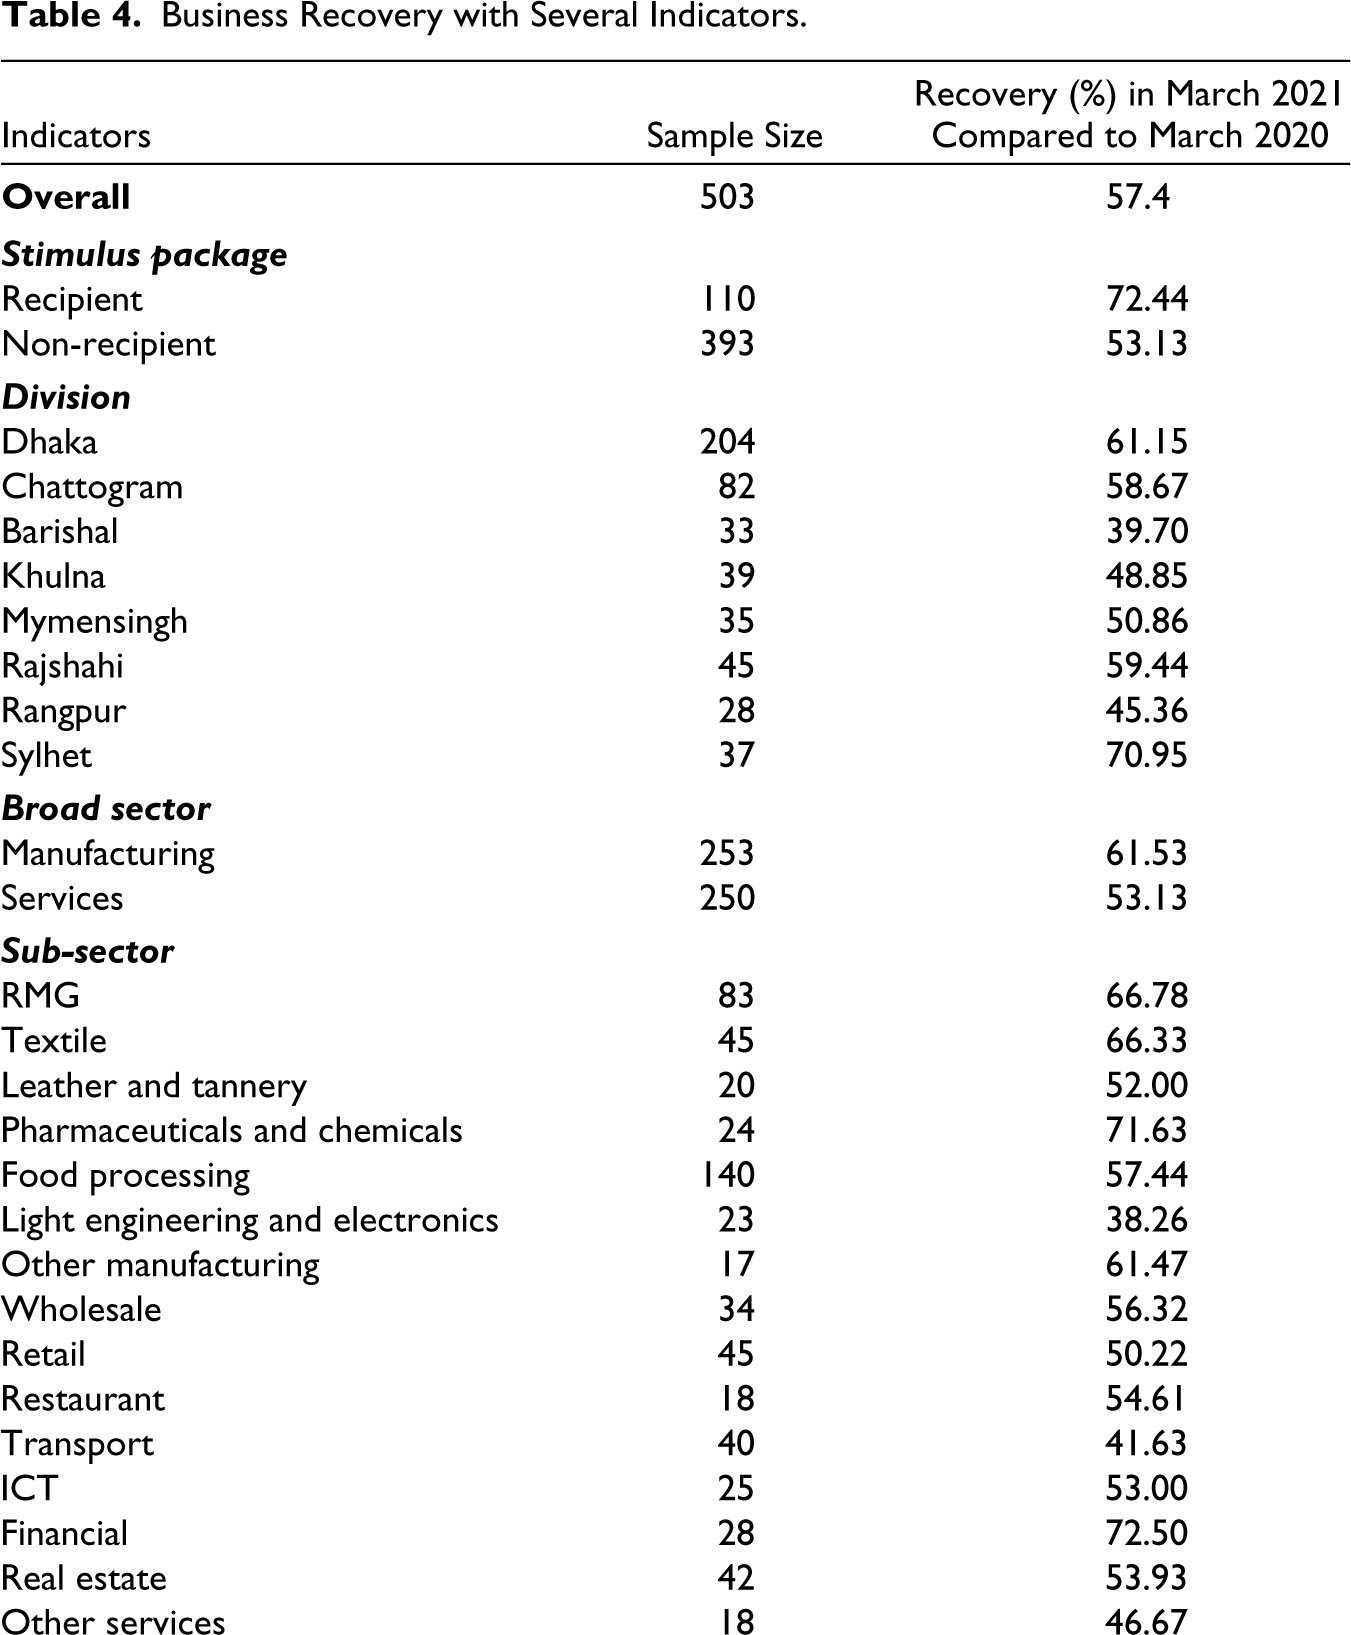

The survey also observed that firms within export processing zones (EPZ), special economic zones (SEZ) or industrial areas fared better in terms of recovery compared to their counterparts operating outside these zones. While firms within EPZ, SEZ or industrial areas reported a 69% recovery, firms outside these zones lagged behind at 54%. Moreover, exporter firms (69%) were well ahead compared to the non-exporter firms (50%). Furthermore, the recovery of large firms (77%) was higher than that of the micro (43%), small (57%) and medium (64%) firms. Lastly, firms’ operational longevity was found positively associated with the recovery percentage.
Empirical Frameworks and Analysis
OLS Regression with Treatment Dummy
As mentioned earlier, the objective of the paper is to identify whether there are any significant differences in terms of business recovery between the stimulus package recipient and non-recipient firms. The very first step in this assessment involves running a simple ordinary least square (OLS) regression
7
with a treatment dummy (T), structured as

where Y denotes the recovery percentage firms attained by March 2021 compared to March 2020, and T represents the stimulus package receipt status.
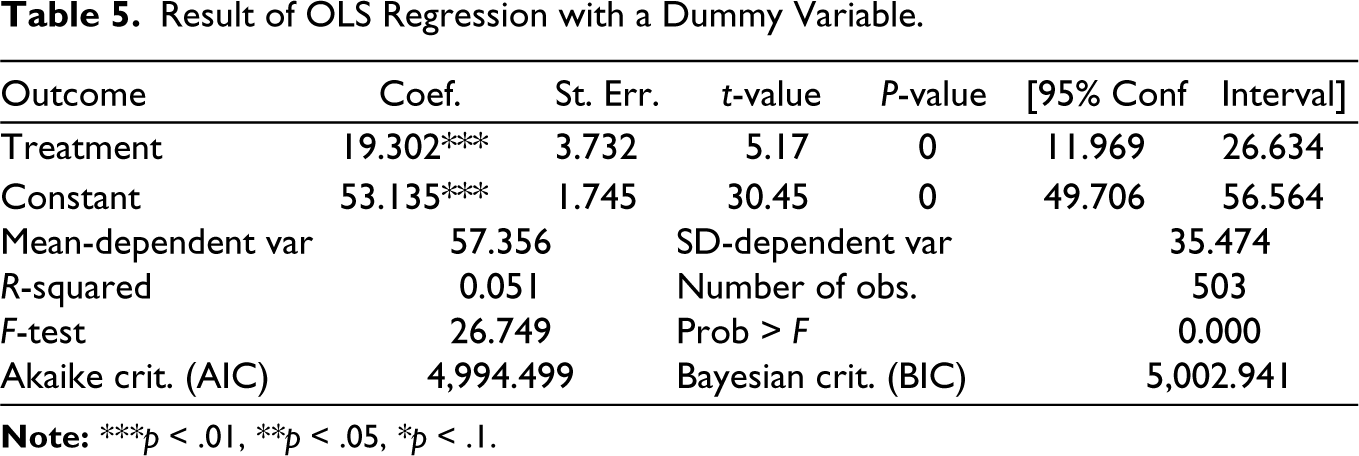
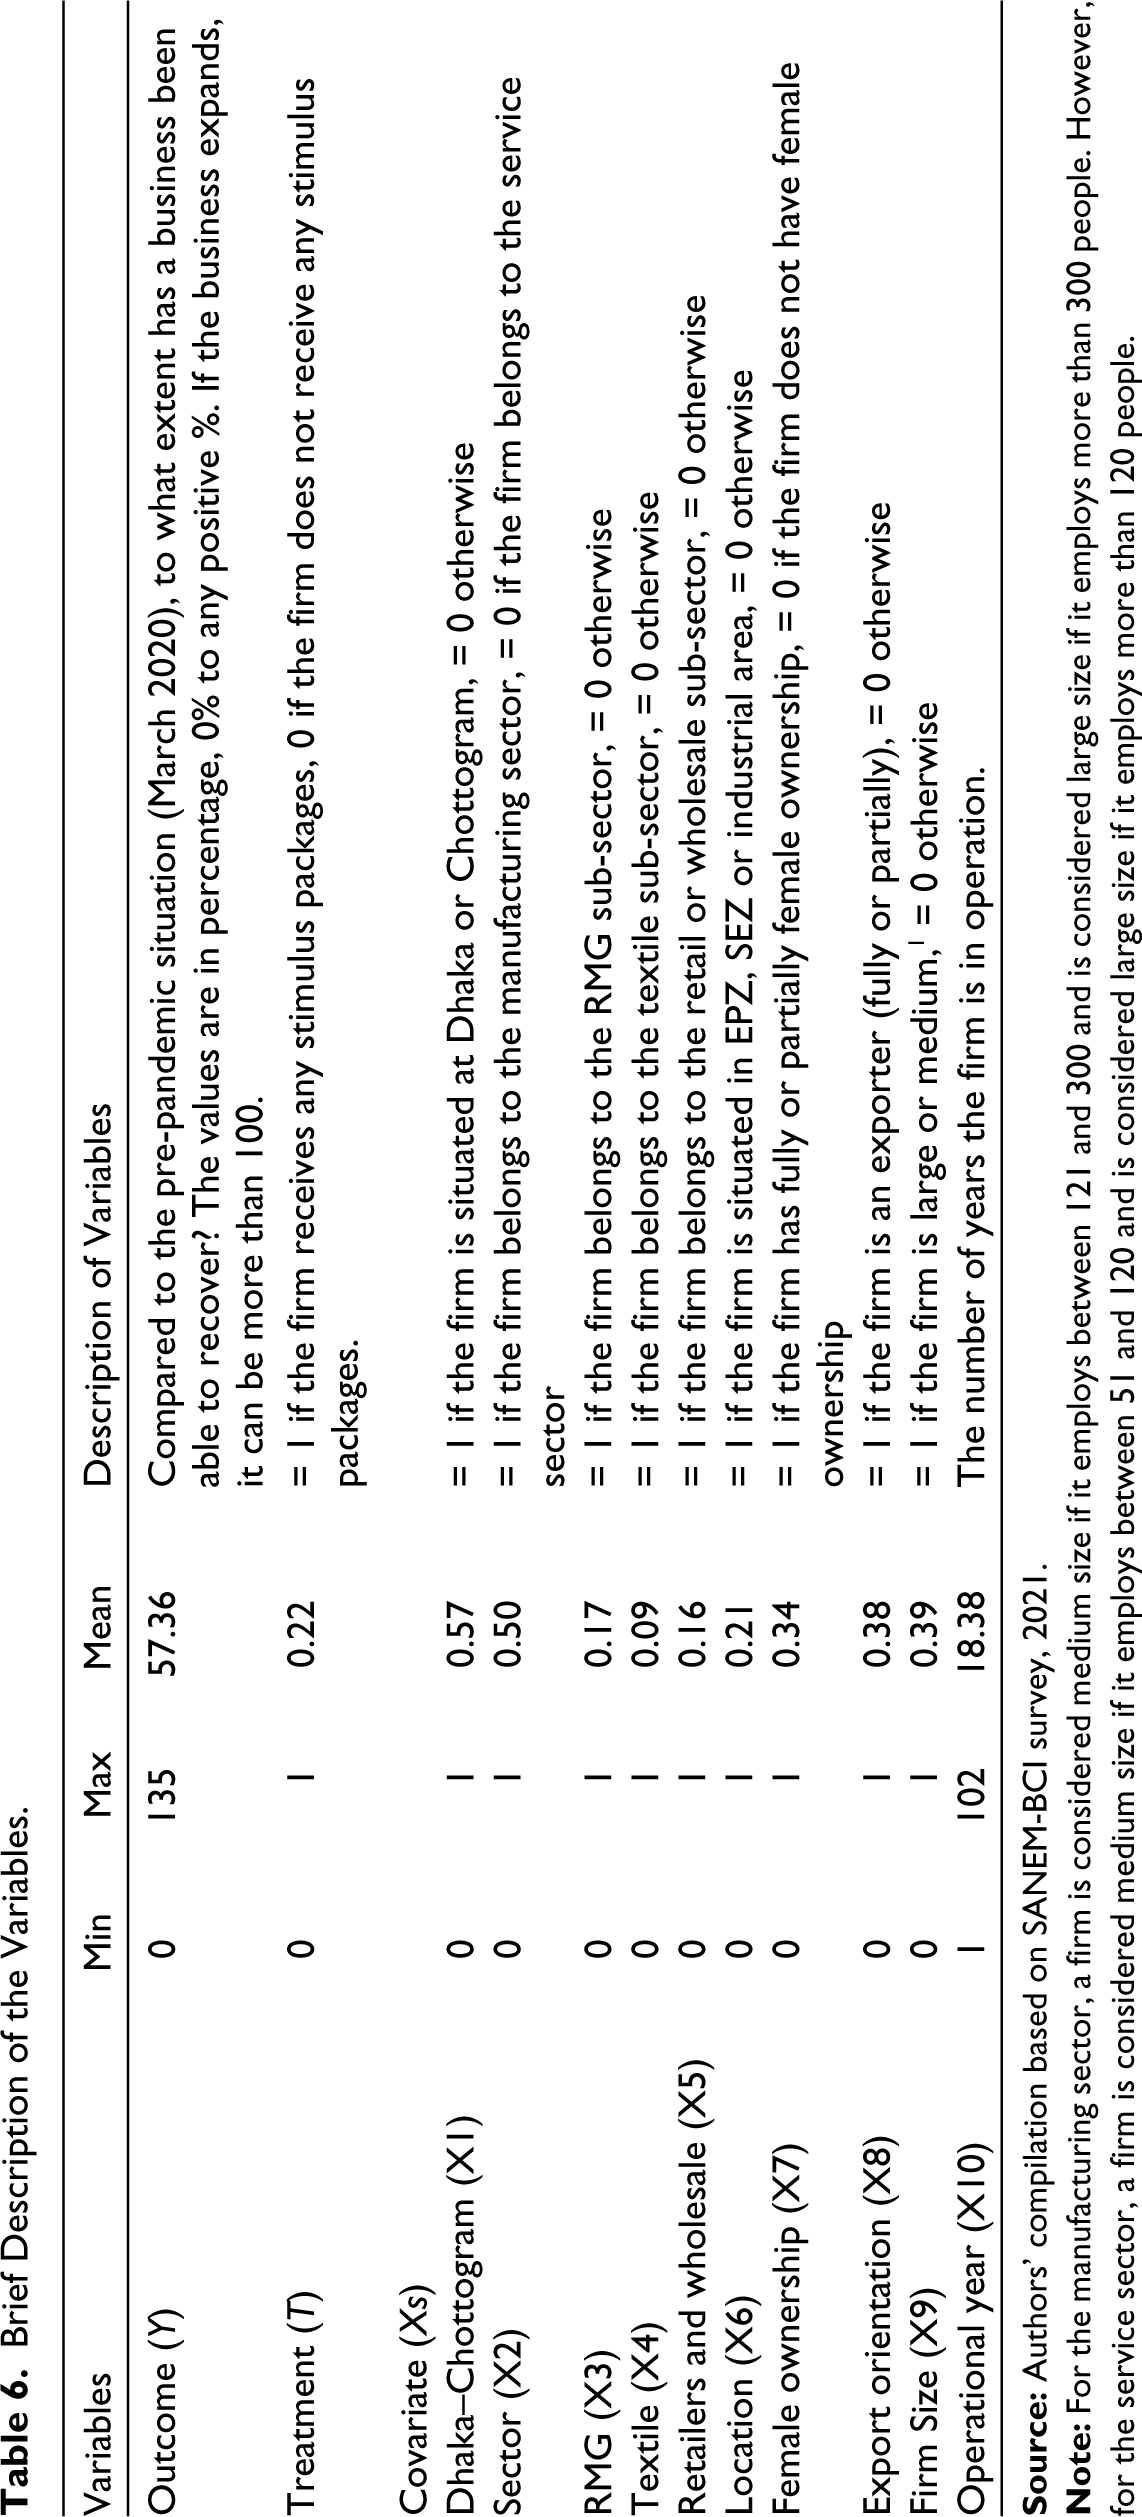
Table 5 presents the result of the regression model. The result shows that the firms that received stimulus packages on average attained 19.3 percentage points higher recovery than those who did not. Nonetheless, the result might be highly biased as there are some other covariates affecting the firms’ recovery trajectories (Gail et al., 1984). For instance, inherent characteristics, such as the size of a firm, could determine its recovery pace, irrespective of the status of the stimulus package received. Therefore, it is important to identify the covariates, as they reduce biases through the selection of treatment and thereby capture the impact of unobserved heterogeneity across entities in the data (Li & Donnell, 2020). To identify the potential covariates that may have an impact on firms’ recovery, this study thoroughly reviewed literature and the dataset. Table 6 presents a brief description of the variables identified for the analysis.
Result of OLS Regression with a Dummy Variable.
Brief Description of the Variables.
Choice of Variables
When analysing firm productivity, heterogeneity is observed across industry dimensions and geographic locations (Maré & Graham, 2013). Consequently, this study incorporated industry-specific variables such as sector (X2), RMG (X3), textile (X4), retailers and wholesale (X5), female ownership (X7), export orientation (X8), firm size (X9) and operational year (X10) to capture heterogeneity effects across firms. Manufacturing firms in the country rely heavily on imported supplies, and during the pandemic, their imports were restricted (Barua, 2020). In contrast, manufacturing firms received a greater share of the stimulus packages compared to services firms (Raihan et al., 2021).
Among sub-sectors, RMG (X3), textile (X4) and retailers and wholesale (X5) are the major value-added sectors in the country (SMI, 2019). Of these sectors, RMG and textile are highly dependent on imported inputs, whereas retailers and wholesale are SMEs that are the primary drivers of the nation’s labor market. Thus, during such a crisis, these sectors might be affected in a different way than any other sectors. During the pandemic, Bangladesh’s export orders fell sharply (WTO, 2020). Consequently, RMG firms received special attention (such as the Export Development Fund, special stimulus packages, continuing production facilities even when all other firms stopped their production, etc.) and got the highest share of the stimulus packages among sectors that might help these firms in the recovery process.
Female ownership has a direct effect on the innovation behaviours of firms (Belitski & Desai, 2021; Bruhn, 2009; Liao et al., 2019; Rosa & Hamilton, 1994). The innovational behaviours from the status of female ownership might affect the recovery process of firms.
The competitive landscape for both small and large firms has been transformed by the pandemic (Wenzel et al., 2020). The COVID-19 pandemic has brought to the fore the vulnerabilities of SMEs in Bangladesh. Hossain and Chowdhury (2022) explore the vulnerabilities that have been exacerbated by SMEs’ limited access to stimulus packages. They found that as production decreased by more than 50% for all firms during the first phase of the lockdown (March–May 2020), the small firms were affected the most. A firm’s performance might also be associated with its years of operation (Littunen, 2000).
To capture regional heterogeneity impact, the study used two variables [such as Dhaka–Chattogram (X1) and location (X6)]. Dhaka and Chattogram divisions are considered mainly for greater industrial agglomeration and stronger flow of outward international migration, which could be the two of the main factors behind a faster fall in poverty rates in the eastern regions than in the western regions (Hill & Endara, 2019). Hence, firms in these regions might have a greater ability to cope with a crisis compared to other regions. Again, whether a firm is in an EPZ or SEZ or industrial area is also considered in this study as a covariate, namely, location (X6). This is primarily because firms in those areas are more organized, export-oriented and well established than in any other areas (Aggarwal, 2019).
Multivariate Regression Model
To address the potential specification bias in the OLS regression as presented in Table 5, a multivariate regression was applied, incorporating a treatment dummy variable and controlling for identified covariates (Xs). Mathematically, this is represented as
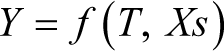
where Y denotes the recovery percentage firms attained by March 2021 compared to March 2020, T represents the stimulus package receipt status, and Xs denotes the pivotal covariates anticipated to influence recovery.
The regression result shows that, after controlling the covariates (Xs), firms that receive stimulus packages on average attained 8.89 percentage points higher recovery than those who did not (Table 7). This percentage is substantially lower than the previous regression (regression with a treatment dummy only).
Result of OLS Regression with a Dummy Variable Controlling for Xs.
Nonetheless, the result might still be biased due to potential endogeneity problems (Antonakis et al., 2014). It is plausible, for example, that large firms might have a higher probability of receiving stimulus packages than small firms. The larger recovery rates observed in large firms can be attributed to their greater access to financial resources, economies of scale and diversified portfolios. Additionally, differences in awareness and information access may also influence the recovery outcomes, especially for smaller firms. Similarly, the RMG firms as opposed to non-RMG firms might have a higher likelihood of availing of the stimulus packages. The higher likelihood of RMG firms to access stimulus packages could be attributed to the specific economic importance of the RMG sector in the context of Bangladesh. RMG is a major export industry, and its vitality to the country’s economy may have led policymakers to prioritize support for these firms during the pandemic. Additionally, the global nature of the RMG sector may have made these firms more aware of available support mechanisms, enhancing their chances of benefiting from stimulus packages compared to non-RMG firms with a smaller global footprint.
Moreover, as the stimulus recipients were not chosen randomly and the nature of participation in the intervention (availing stimulus packages) was kind of voluntary, there might exist selection bias (Heckman, 1990). Therefore, in the context of non-experimental design, it is necessary to take care of the endogeneity problem and account for and adjust for differences between treated and untreated groups to estimate the impact of the stimulus packages properly (Duncan et al., 2004).
Identification of Credible Impact Assessment Methods
In empirical research, a crucial aspect is the determination of a credible impact, which necessitates the construction of the counterfactual outcome: the hypothetical scenario describing what would have transpired for participants in the absence of the intervention. Given that this counterfactual outcome is never observed, it necessitates estimation via rigorous statistical methodologies. Within the domain of impact evaluation, the propensity score matching (PSM) technique has found extensive application across diverse fields. For instance, Heckman et al. (1998), Lechner (1999), Dehejia and Wahba (2002) and Smith and Todd (2005) utilized PSM to estimate the impact of the labour market and training programmes on income dynamics. Similarly, Jalan and Ravallion (2003) explored the efficacy of anti-poverty workfare programmes; Trujillo et al. (2005) investigated the impact of health insurance on medical-care participation; Lavy (2002) delved into the effect of performance incentives for teachers on student outcomes and Persson et al. (2003) scrutinized the consequences of electoral reform on the prevalence of corruption. In light of its widespread applicability and proven efficacy, this study has employed the PSM technique to estimate the impact of stimulus packages on business recovery.
Propensity Score Matching
PSM is a statistical method that leverages data from a pool of units not involved in an intervention to infer potential outcomes for those participating, had they not been exposed to the intervention (Rosenbaum & Rubin, 1983). The underlying idea is that intervention effects can be identified by comparing the outcome discrepancies between participants and their observationally similar non-participants. A salient challenge in this approach is the complexity of matching non-participants with participants based on multifarious observable characteristics. However, PSM streamlines this by collapsing the multi-dimensional matching conundrum into a single dimension—the propensity score. This score encapsulates the effects of various observed covariates X on intervention participation. Then, outcomes from both participating and nonparticipating units with proximate propensity scores are compared to ascertain the intervention’s effect (Caliendo & Kopeing, 2008). In this process, units lacking a corresponding match are excluded, as they offer no foundational basis for a valid comparison.
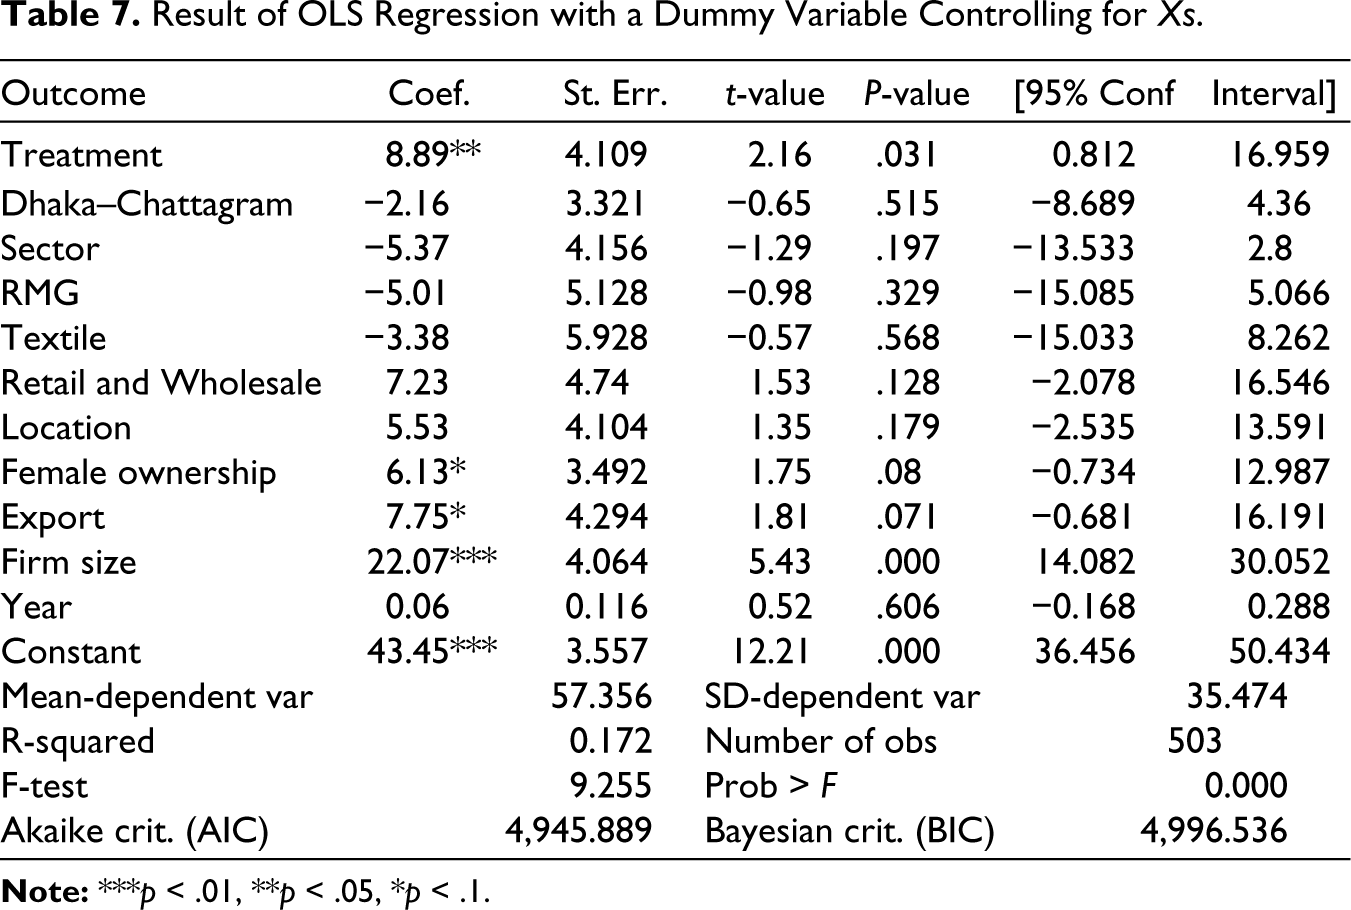
Estimation of Propensity Scores Using the Probit Model
Specifically, PSM constructs a statistical comparison group (propensity score) by modelling the probability of participating in the treatment T, conditional on observed characteristics. Mathematically, this relationship can be presented as
Given the binary nature of the treatment variable, the propensity score is usually derived through a Probit model. Table 8 presents the participation equation, predicting the likelihood of a firm receiving the stimulus package, as estimated by the Probit model.
The Result of the Estimated Participation Equation by the Probit Model.
Interpreting the coefficients from the Probit model shows that the firms situated in the Dhaka and Chottogram divisions exhibit a higher probability of availing stimulus packages. Similarly, manufacturing firms, notably those in the RMG sector, export-oriented, as well as those belonging to large and medium firm categories, display a significantly greater probability of availing of stimulus packages compared to their counterparts.
Under certain assumptions, matching based on P(X) is as good as matching on X (Rosenbaum & Rubin, 1983). Consequently, matching the stimulus recipients with the non-recipient, leveraging the estimated scores, facilitates the extraction of the true impact engendered by the stimulus packages.
Testing the Accuracy of the Propensity Scores
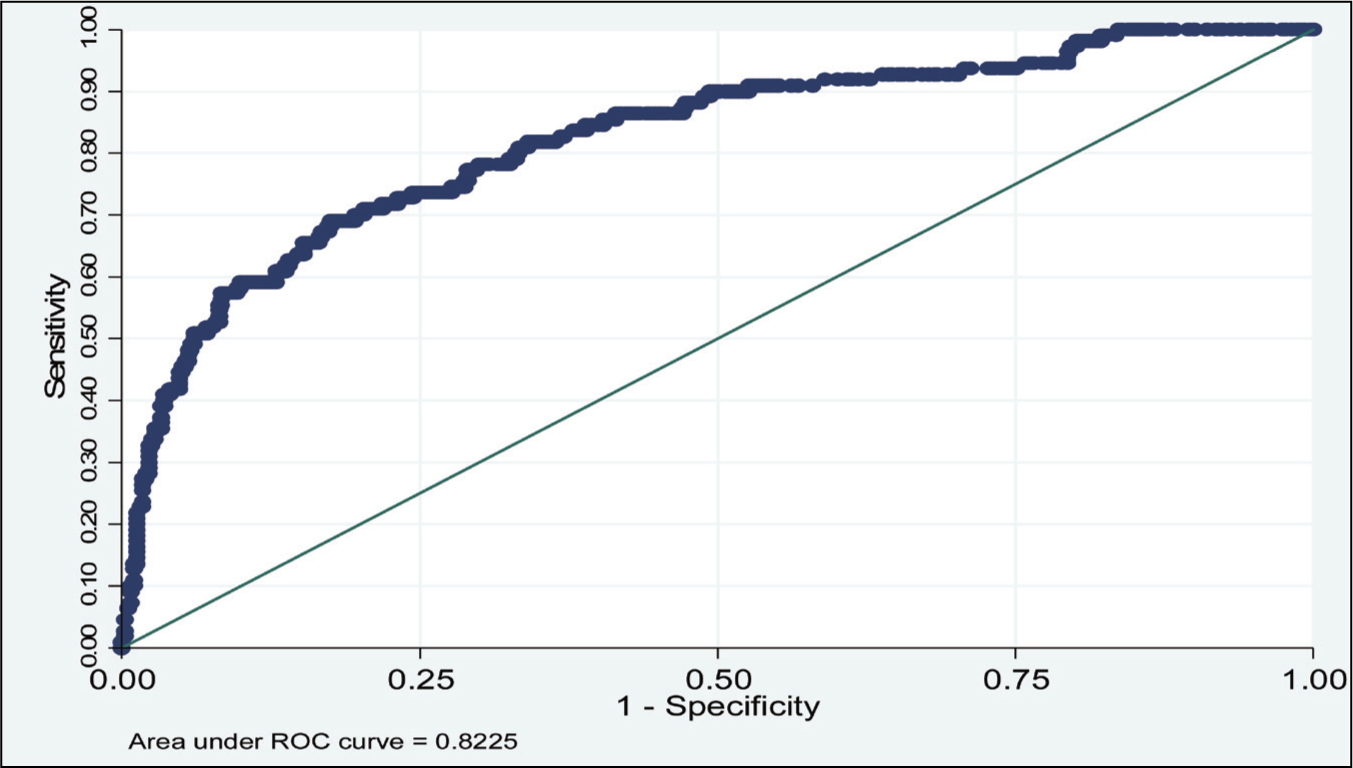
In generating the propensity scores, it is imperative to note that only observable variables were employed. Given the inherent constraints, accounting for unobservable variables remains unfeasible. Such unintended omission could potentially introduce bias into the estimated propensity scores. Therefore, it is essential to validate the accuracy of the scores. One widely accepted method for such validation is the receiver operating characteristics (ROC) curve.
The ROC provides insights into the capacity of the propensity scores to correctly classify subjects based on their actual exposure groups (Lobo et al., 2006). It displays the efficacy of a diagnostic marker in distinguishing between two dichotomous groups: treatment and controls. Let us designate T = 0 as controls and T = 1 as treatment. Assuming, for argument’s sake, that larger values of Y are more indicative of a subject belonging to the treatment group, the ROC curve for a marker, Y, plots the true positive rate, TPR(c) = P [Y ≥ c | T = 1] against the false positive rate, FPR(c) = P [Y ≥ c | T = 0]. This is visualized across varying thresholds for the criterion ‘Y ≥ c’ where c varies from −∞ to ∞ (Pepe et al., 2009).
Figure 3 depicts the ROC curve corresponding to the estimated Probit model. Observations from this ROC curve reveal that the Probit model, as detailed in Table 8, accurately identifies a commendable 82.25% of the exposure events, signifying a robust accuracy in the derived scores.
Moreover, the effectiveness of PSM in discerning programme impact is anchored to two pivotal assumptions: (a) conditional independence and (b) the presence of sizeable common support.
Assumption of Conditional Independence
The principle of conditional independence posits that given a set of observable covariates (X) unaffected by treatment, the potential outcome (Y) remains independent of the treatment assignment (T) (Morgan, 2018). If YTi denotes the outcomes for participants and YCi denotes the outcomes for non-participants, then conditional independence can be illustrated as

Note that conditional independence is a strong assumption and is not a directly testable criterion. Its verifiability depends on the specific features of the programme itself. If unobserved characteristics determine programme participation, this assumption becomes invalidated, rendering PSM an inappropriate methodology (Guo et al., 2020). However, concerning the stimulus packages under discussion, we assume that conditional independence holds true. Thus, after controlling for Xs, the treatment assignment (i.e., receipt of stimulus packages) is as good as random.
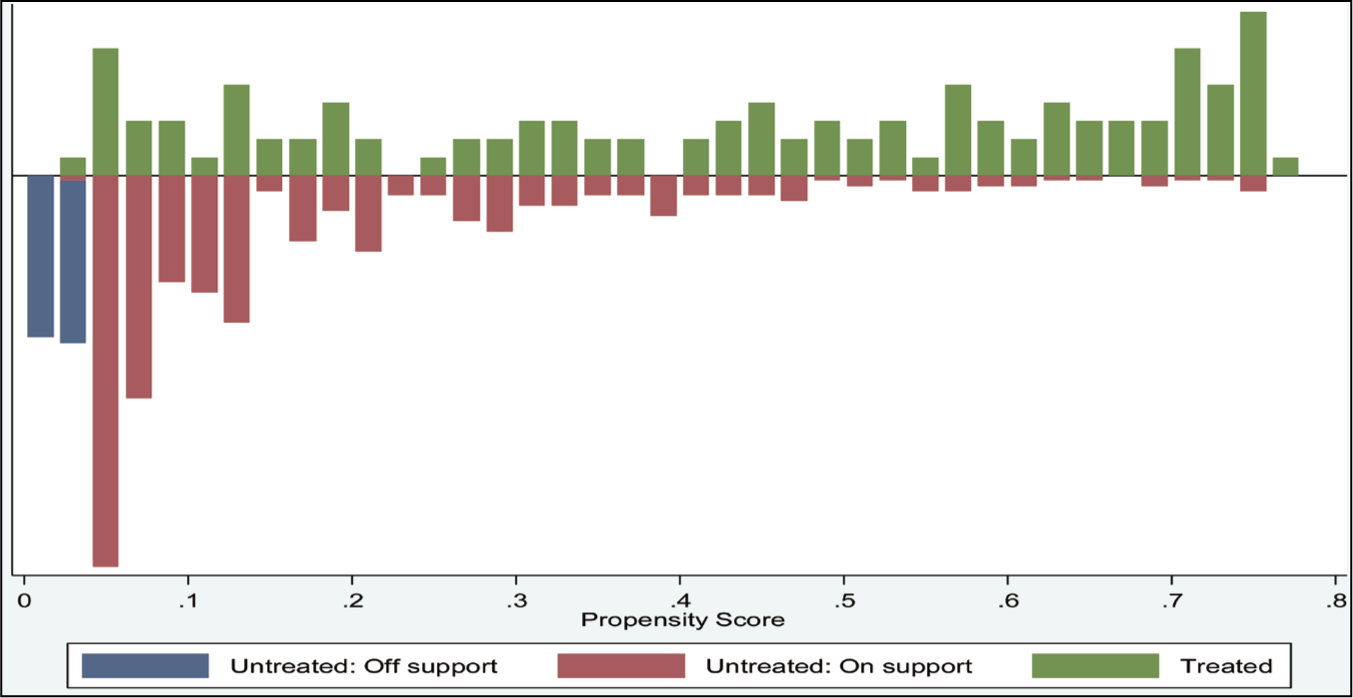
Assumption of Sizeable Common Support
The second assumption is the presence of sizeable common support. This condition ensures that observations under treatment have comparable observations in close proximity within the propensity score distribution (Heckman et al., 1999).
If P (Xi) is the probability of firm i availing of the stimulus package, then the relationship can be illustrated as

Figure 4 provides a visual representation of the common support zone for both the stimulus recipients and non-recipient firms. In this context, the region of common support ranges from 0.03967689 to 0.76413079, which can be claimed as sizeable common support. To ensure comparability, non-treated firms outside the common support areas have been dropped.
Balancing Test
While a treated group and its matched non-treated counterpart may process the same propensity scores, they are not necessarily observationally similar if there is a misspecification in the participation equation (Caliendo & Kopeinig, 2008). To check the potential existence of such misspecification, a balancing test proves instrumental. The test examines whether, within each quantile of the propensity score distribution, the mean propensity score remains statistically indistinct (Austin, 2007). For the efficacy of PSM, it is imperative that the distributions of both the treated group and its comparator align closely. Formally, this necessitates verification of

Upon leveraging the estimated propensity scores, firms have been classified into four distinct blocks. Table 9 presents the mean propensity score for both the control and treatment firms, accompanied by the level of significance of their mean differences.
Mean Propensity Score.
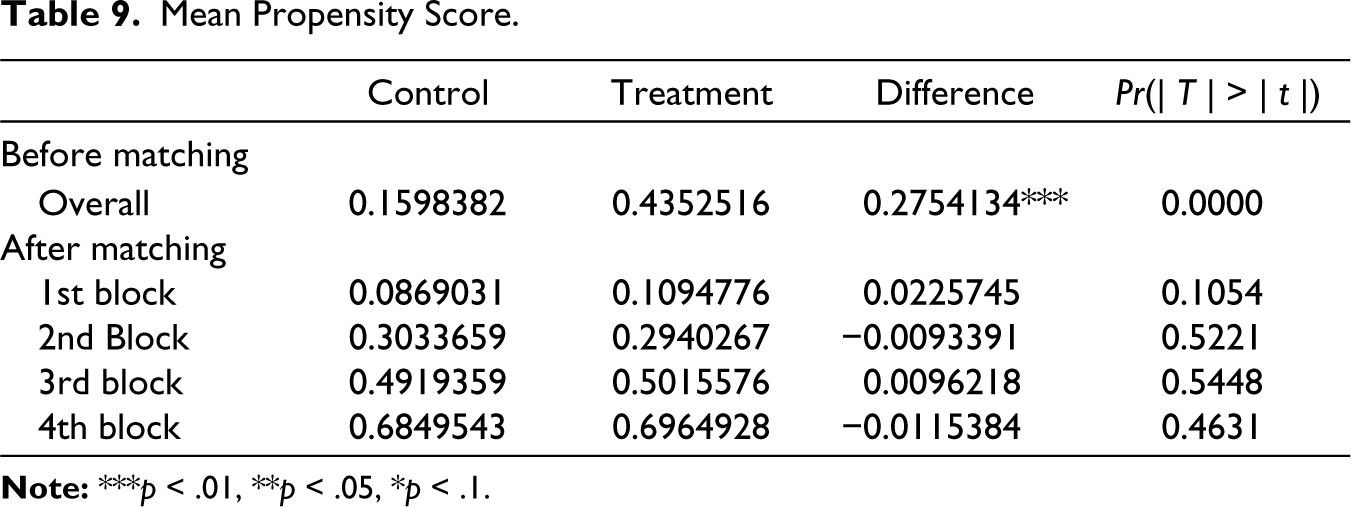
Observations reveal that prior to the matching procedure, the mean propensity score for treated and non-treated units diverged significantly. However, post-matching, the mean differences between the two groups across all blocks were not statistically significant.
Average Treatment Effect
When the assumption of conditional independence is met, and sizable common support is found between participants and non-participants, the PSM estimator for the treatment effect of the treated (TOT) can be specified as the mean difference in the outcome, Y, over the common support (Rosenbaum & Rubin, 1983). This can be articulated using a standard cross-section estimator as

Here, Ep(X) | T = 1 represents the expected value over the common support for the treated, YT and YC are the potential outcomes for the treated and control groups respectively, and P(X) is the propensity score given covariates X.
PSM employs multiple techniques to align participants with non-participants. Nearest-neighbour matching links treatment units with their closest comparison units, but can yield poor matches if substantial differences in propensity scores exist between paired units. Calliper or radius matching addresses this by imposing a threshold on the permissible difference in propensity scores, ensuring better matches but potentially limiting the analysis by excluding certain treated units (Caliendo & Kopeinig, 2008). Stratification or interval matching segments the common support into intervals, evaluating the treatment effect within each and then averaging for an overall impact. This method is particularly beneficial when propensity scores for treated and untreated units overlap considerably. Kernel matching, on the other hand, employs a weighted average of all non-participants to establish matches, thereby making use of more data (Guo et al., 2020).
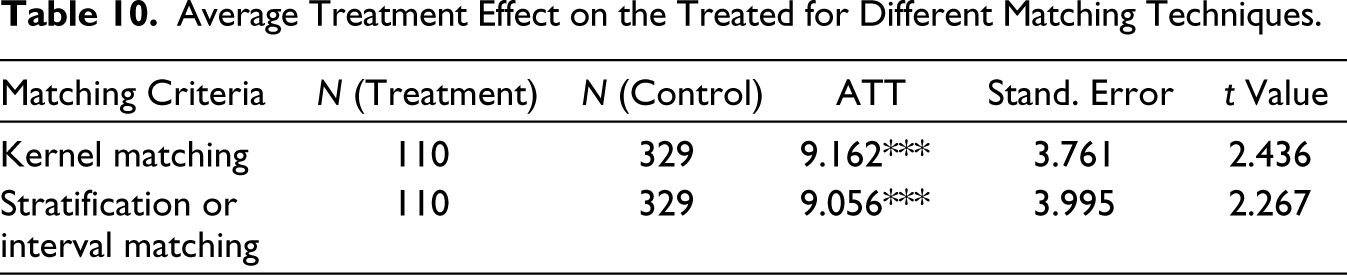
While nearest-neighbour and radius matching are generally more effective in larger datasets due to a higher likelihood of finding proximate matches, kernel and stratification matching can be beneficial for smaller datasets (Caliendo & Kopeinig, 2008). Specifically, kernel matching’s utilization of weighted averages across multiple controls becomes invaluable when pinpoint matches are scarce in limited datasets. Given our dataset’s modest size, encompassing only 110 treatment units, both nearest-neighbour and radius matching appear unsuitable. Consequently, our analysis predominantly relies on kernel matching, supplemented by stratification matching for robustness checks.
Table 10 presents the average treatment effect on the treated (ATT) for both kernel and stratification matching techniques. The ATT, when utilizing kernel matching, is determined to be 9.162. A slight variation is noted in the ATT, amounting to 9.056, when stratification matching is employed. The t-values corroborate the statistical significance of the treatment effect in both instances. This suggests that firms benefiting from stimulus packages exhibited a recovery rate, reverting to their pre-COVID status, which was approximately 9 percentage points higher than their counterparts who did not avail of such packages.
Average Treatment Effect on the Treated for Different Matching Techniques.
Robustness and Efficacy of PSM
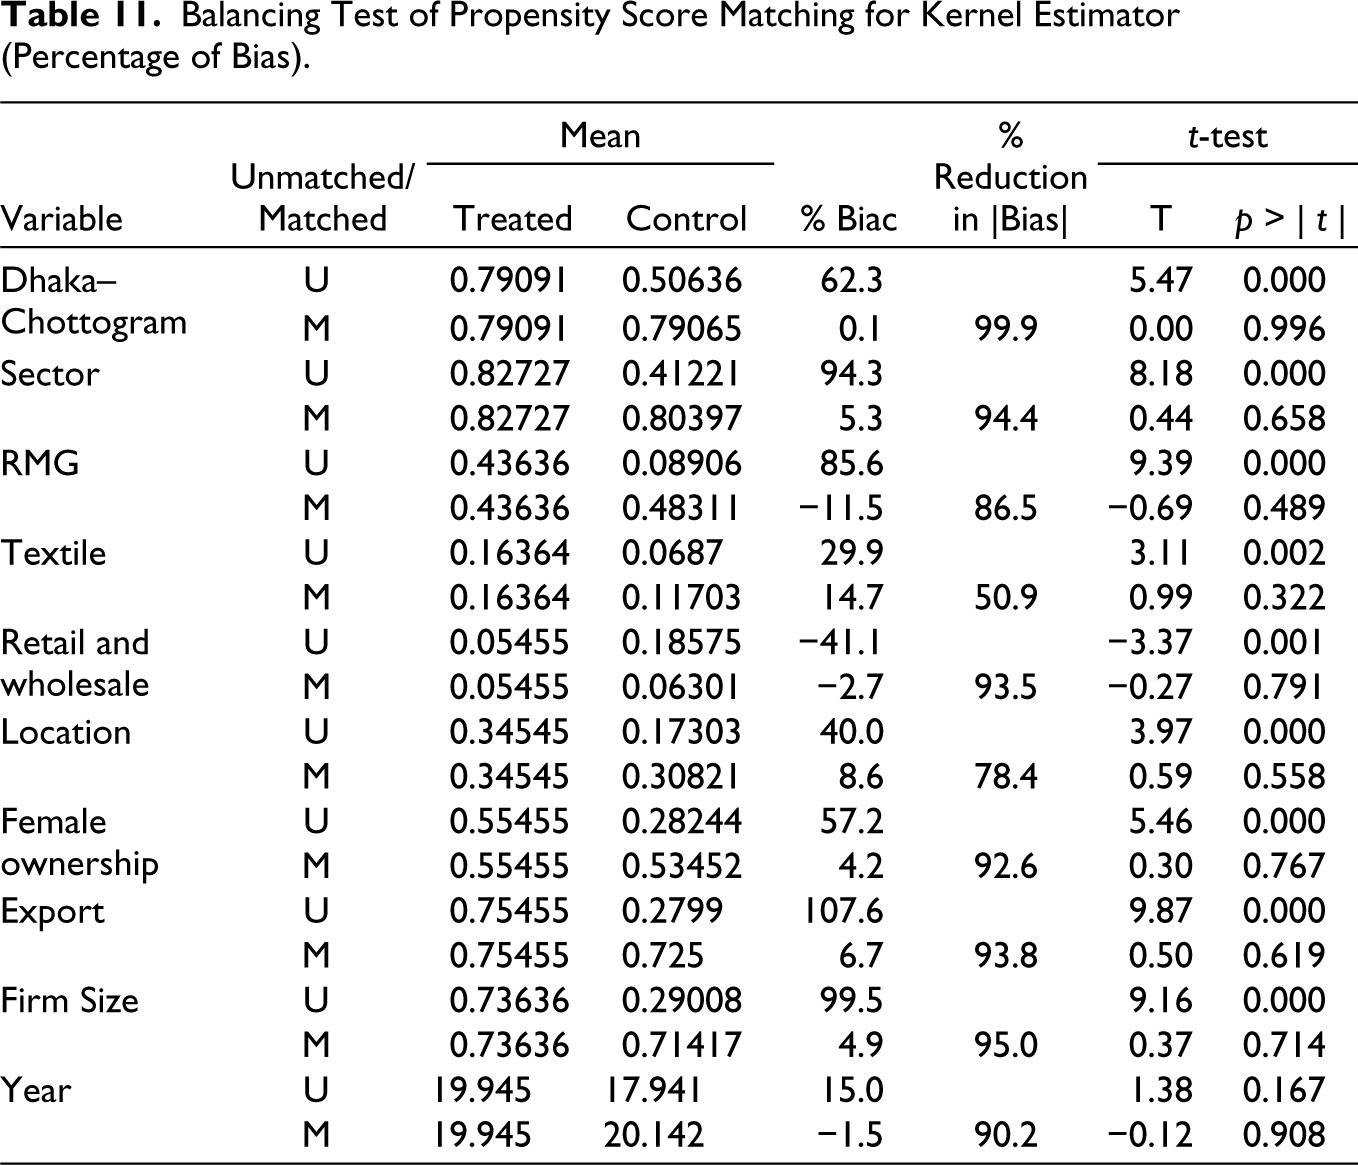
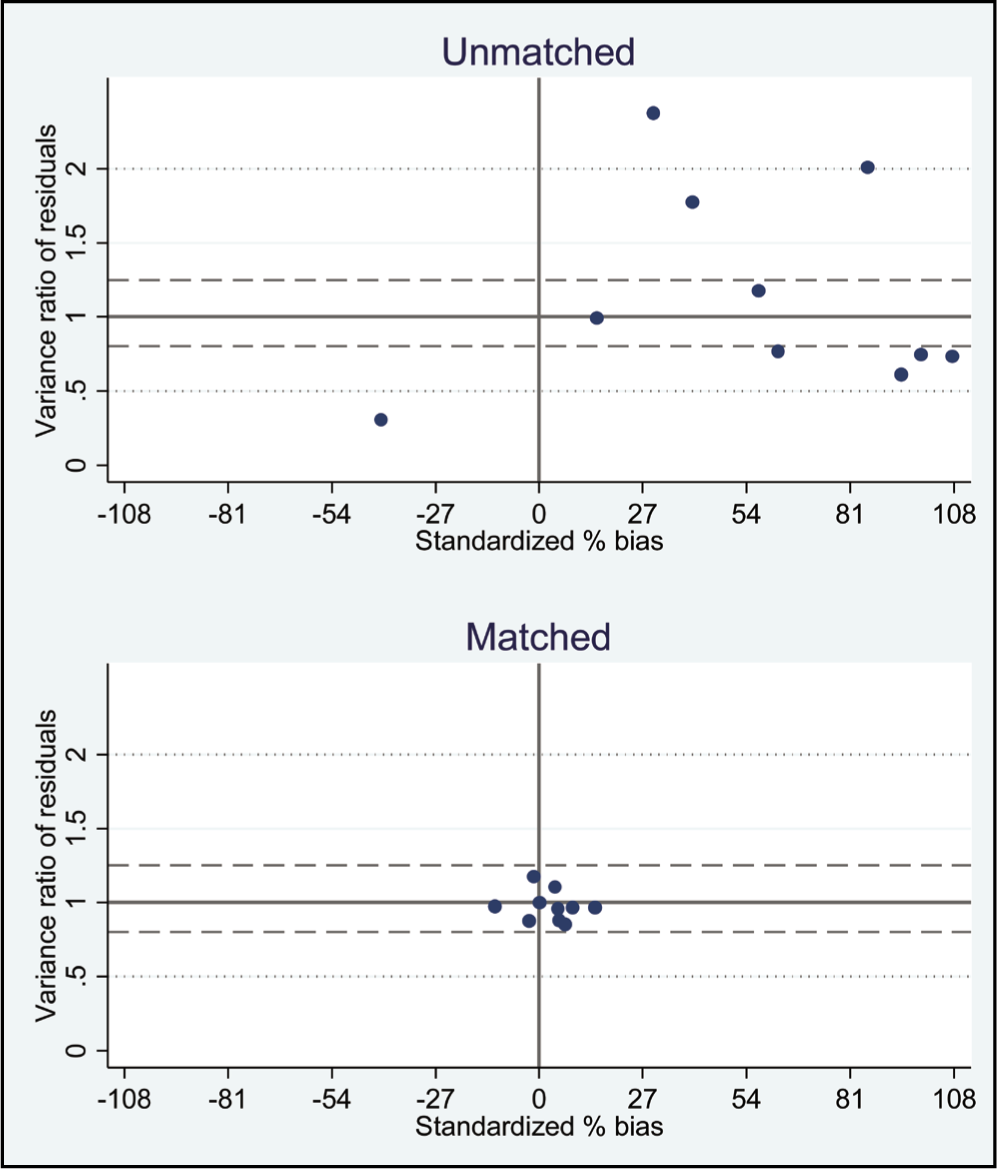
The proximity of kernel and stratification matching estimates underscores the robustness of the estimation. However, it is essential to tread with caution. Oster (2019) posited that many results with ‘stable coefficients’ might not necessarily exhibit genuine robustness. Complementing this perspective, King and Nielsen (2019) highlight the importance of addressing any remaining bias and model dependence after PSM beyond just reporting treatment effects. As illustrated in Table 11, post-matching, the bias between treated and control groups for most variables has been markedly diminished. Specifically, an initial mean bias of 64% among exogenous variables is dropped to 6%, reflecting an approximately 90% reduction. Further, t-tests indicate that the notable mean differences in most variables between the two groups have been mitigated post-matching. This validates the efficacy of the matching process in balancing covariates between treated and control groups. Corroborating this, the matched scatterplot in Figure 5 demonstrates that most covariates align closely with the zero bias, and the variance ratio nearing one indicates harmonized variances, underscoring the effectiveness of the matching process.
Balancing Test of Propensity Score Matching for Kernel Estimator (Percentage of Bias).
Standardized % Bias and Variance Ratio for Matched Versus Unmatched Data.
Potential Bias from Unobservable Variables
Our PSM methodology effectively addresses the selection of observables. However, a critical concern in empirical research is the potential bias introduced by unobserved heterogeneity. Given that less than a quarter of the firms in our sample benefited from treatment, this concern becomes even more pronounced. Prominent literature offers methods to gauge the extent of such biases, but they do not fully solve the problem. Altonji et al. (2005), for instance, introduced a method which hypothesizes that if observed variables lead to a certain amount of selection bias, unobserved variables might exhibit a similar trend. Our unmatched multivariate regression (the seventh section) reveals an average treatment effect of 8.89 percentage points, while the PSM kernel estimation yields 9.16 percentage points. The negligible disparity suggests that controlling for observed biases largely preserves the treatment effect. Following the Altonji et al. (2005) approach, we can infer that the bias from unobserved variables might be minimal. A consistent treatment effect is also seen across subgroups defined by observable characteristics. For instance, the RMG firms exhibit a treatment effect of 8.65 percentage points, non-RMG firms at 9.06, firms in Dhaka or Chittagong at 9.42, exporting firms at 9.68 and large to medium-sized firms at 7.8. Such consistency supports the notion that unobservable, if controlled for, might have followed a similar pattern and the overall average treatment effect might not be significantly different.
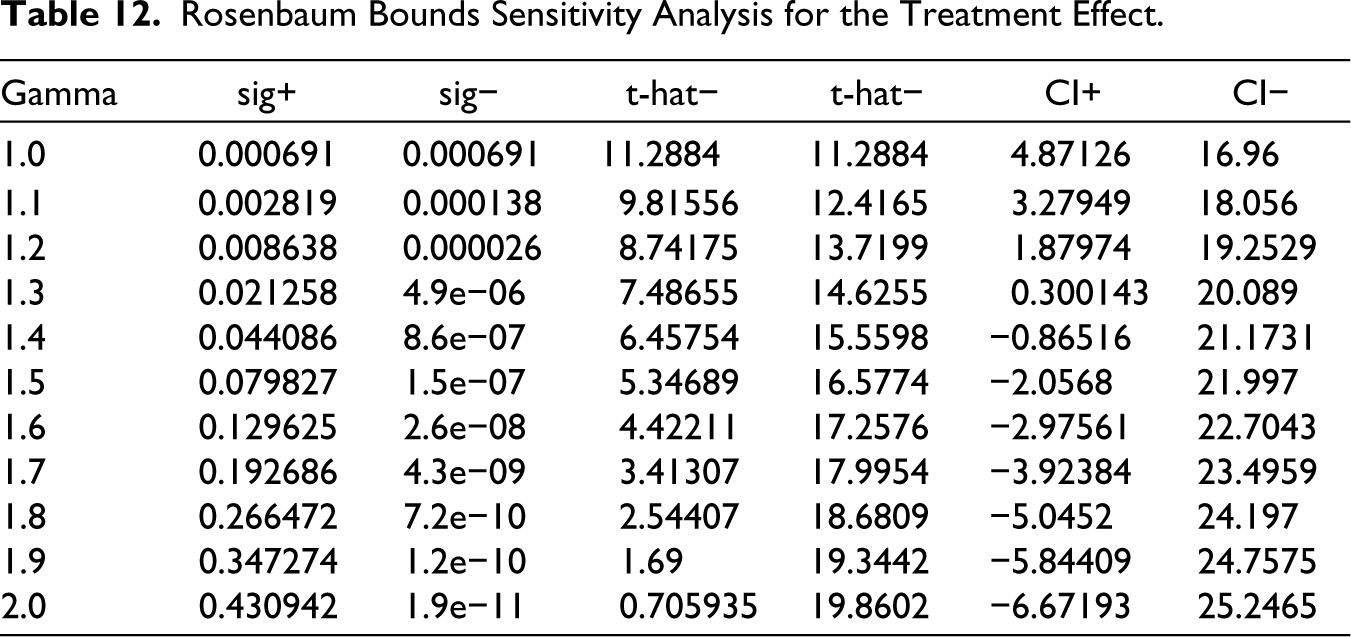
Additionally, to offer a comprehensive understanding, we explored Rosenbaum’s bounds, which offer insight into the sensitivity of results to the potential influence of unobservable (Keele, 2010). The parameter ‘Gamma’ denotes the log odds of differential assignment attributable to these biases (Table 12). In the absence of such biases (Gamma = 1), the Hodges–Lehmann point estimate for the treatment effect is 11.3 percentage points. However, as Gamma ascends from 1 to 2, indicative of increasing potential for hidden biases, both the point estimate and its confidence intervals exhibit significant fluctuations. This suggests potential uncertainties in the direction of the treatment effect. The associated significance levels underscore a move towards statistical insignificance with increasing biases, suggesting that pronounced unobserved heterogeneity could undermine our conclusions. Yet, during the COVID-19 crisis, unobserved factors—possibly tied to firms’ preferences or intrinsic capabilities—might not be significantly heterogeneous across subgroups defined by observable institutional and policy-related criteria. Hence, while caution is warranted, potential biases from unobservable might not significantly distort our interpretation.
Rosenbaum Bounds Sensitivity Analysis for the Treatment Effect.
Conclusion and Policy Implications
This study has tried to understand the impact of stimulus packages announced by the GoB during the COVID-19 pandemic on business recovery. Given the non-experimental nature of these interventions and the absence of pre-interventions data, achieving a causal estimation poses significant challenges. Nevertheless, within the confines of the cross-sectional framework, the PSM estimation method provides a lens to analyse the impact of these stimulus packages. The PSM results indicate that after controlling for potential biases and endogeneity concerns, firms receiving stimulus displayed a markedly higher recovery from their pre-COVID state than those that did not. The magnitude of the average treatment effect is around 9 percentage points, vindicating the efficacy of the stimulus packages.
Given the symbiotic relationship between business and economic recovery, it can be inferred that the stimulus packages significantly contributed to the nation’s economic resurgence. However, experts have pointed out certain inefficiencies—a less effective implementation process, operational hurdles and lapses in transparency and accountability—that might have curtailed the full benefits of these packages. The absence of a structured mechanism to access the needs of affected firms led to self-selection bias, as firms autonomously pursued stimulus benefits. Additionally, complex banking procedures could deter eligible firms from availing of the benefit. Inadequate monitoring mechanisms and proficient management further hamstrung the packages’ potential (Raihan, 2020). Moreover, in the examination of stimulus disbursements, it is observed that apart from the RMG, the disbursement of the stimulus packages towards other sectors, i.e., MSMEs, has been notably slow. Thus, the rate of availing of stimulus packages by the non-RMG firms remained very low. This disparity reflects the RMG-centric bias in the policy decisions.
It is, thus, imperative that future policies reflect the challenges faced by many other sectors more holistically. The institutional issues mentioned herein should be taken care of properly to better equip the nation for analogous future crises. To ensure effective monitoring and accountability for such initiatives in the future, there will be a need for the formation of a national monitoring committee comprising representatives from government agencies, NGOs, civil societies, business communities and labour organizations.
Moreover, this article provides valuable insights for both academia and policymakers. Its methodology serves as a blueprint for empirical research probing the impact of government support on business enterprises in developing countries, especially given the similarities in stimulus strategies, and overcoming the challenge of reaching MSMEs. The policy suggestions here, especially those addressing institutional challenges and advocating a broader industrial policy, hold profound implications for developing countries.
Footnotes
Declaration of Conflicting Interests
The authors declared no potential conflicts of interest with respect to the research, authorship and/or publication of this article.
Funding
The authors received no financial support for the research, authorship and/or publication of this article.