



Abstract
Decent work is considered to be crucial in the process of inclusive development and poverty alleviation in economies dominated by informal employment. This study is an attempt to understand decent work achievements of rural and urban informal workers of Hooghly district, West Bengal, India. The study uses the theoretical framework of seven work-based security dimensions from People’s Security Survey (by International Labour Organization) and constructs seven individual-level sub-indices and one composite individual-level decent work index using primary survey data. Then, it investigates the effect of the supply-side parameters on decent work using simple OLS regressions. The findings indicate ineffectiveness of education to improve decent work condition of informal workers in the absence of adequate skill-building initiatives. It also reveals the poor work condition of rural informal workers and self-employed workers in general. The study emphasises the need of vocationalisation of education and upgrading the quality of informal employment to achieve decent work.
Keywords
Introduction
The 2030 agenda for sustainable development lists “decent work and economic growth” as goal-8 of the 17 sustainable development goals (SDGs). Introduced by International Labour Organization (ILO) in 1999, “decent work” is argued to be a necessity for poverty reduction and an inclusive and fair globalisation where “no-one is left behind” (ILO, 2019). The essence of decent work is a shared focus on the quality of employment besides creating maximum quantity of jobs. Therefore, decent work agenda is particularly relevant in developing and underdeveloped world, where the presence of unemployment, underemployment, disguised unemployment and informal employment 1 is widespread and often the quality aspect of jobs (like minimum wage and healthy work-environment) are foregone to create jobs for maximum people.
This article attempts to understand the different components of decent work achievements at individual-level for the rural and urban informal workers using seven work-based security dimensions based on People’s Security Survey (PSS) (Anker, 2002). Here we consider seven sub-indices and ultimately construct one composite decent work index (DWI) based on primary survey of 542 informal workers of Hooghly district, West Bengal, India. Then the impact of the relevant supply-side factors on overall DWI of the workers will be investigated. The section that follows discusses the theoretical and practical issues of the concept of decent work. The third section narrows down the main research objectives. The section afterwards describes the methodology of analysis. The fifth section gives an overview of the decent work dimensions measured in this article. The penultimate section investigates and discusses the effect of factors influencing decent work for the present sample of informal workers. The last section concludes.
A Brief Overview of Decent Work in Theory and Practice
The Concept and Measurement of Decent Work
ILO’s decent work agenda stands on four broad central ideas—employment, social security, workers’ right and social dialogue. The mix of strictly work-related dimensions and dimensions regarding workers’ social relations under a single framework makes “decent work” conceptually ideal for every form of employment and inclusive to the maximum number of working population (Ghai, 2002). But in practice, translating a broad concept like this into quantifiable and comparable policy instruments for a diverse world has been a tedious and never-ending process. Among the earliest studies on quantifying the concept of decent work, Anker et al. (2002) identifies 11 broad groups of statistical indicators to measure decent work. Bescond et al. (2003) carries out an international comparison of 40 nations with a single-valued index based on seven macro indicators of decent work. Bonnet et al. (2003) provide a more detailed analysis of measuring decent work at macro (population aggregate), meso (firm/enterprise) and micro (individual) levels. They use seven work-based securities and corresponding indicators and constructed a composite index at each level. The theoretical and analytical framework of the seven work-based securities also has been the base of PSS by ILO initiated in mid-2000 (Kantor et al., 2006; Standing, 2002). This framework is adaptive to regional/local needs and appropriate for getting an overview as well as a horizontal (dimension-wise) disaggregation of decent work at different measurement levels. Our study adapts this theoretical framework for a micro-level analysis and horizontally explores the decent work conditions for the group of responders.
Achieving Decent Work Conditions for Informal Workers
Characterised by extremely heterogeneous activities, precarious working condition and concentration of working poor (Chen et al., 2004), informal economy has been a constant reality in developing and underdeveloped world. Hence some researchers have suggested upgradation of informal employment to be a more effective strategy towards decent work instead of the popular policy-suggestion of formalisation (Stuart et al., 2018). But the inclusivity and detailed nature of the concept of decent work (especially at micro-level) make it particularly difficult to be effectively implemented in case of informal employment. 2 Factors preventing desirable employment outcomes can be clustered into demand-side factors like employment programs, governance, etc., supply-side factors like human capital formation, favourable community environment, etc. and factors regarding mismatch of demand-supply like fragmented labour market information and network, mismatch due to distorted job expectations, etc. (Directorate-General for International Cooperation and Development, 2018). While demand-side factors effect firms/employers, supply-side factors influence the labours. Since our study is a micro-level analysis, it discusses the individual-specific supply-side factors only with a focus on education. Education and skill-building are among the most important components of human capital formation (Samans et al., 2017). But if the policies fail to promote formal education and vocational education simultaneously and in tune with market demand that coordination failure leads to mismatch of demand-supply (Raihan and Uddin, 2018; Sparreboom and Staneva, 2014).
Research Objectives
The present article is an adaptation of the study of Kantor et al. (2006) in the case of Hooghly district, West Bengal. Though West Bengal is considered among the Indian states with labour friendly laws (Chowdhury, 2014), a recent report by ILO (2018b) reveals the poor wage condition of the state compared to the national average. Among the few studies carried out so far investigating decent work condition of informal workers in West Bengal, the study of Chowdhury (2014) follows a holistic approach like Kantor et al. (2006) and investigates decent work conditions in all the seven security dimensions. But one drawback of these studies is that they discuss the decent work indicators in disaggregated manner and fail to provide an overall picture of the decent work condition of workers. Our study overcomes this drawback by constructing a DWI besides providing overview of different indicators.
Hence, the two main research objectives of this article are as follows:
Evaluating decent work achievements of informal workers at individual-level to understand the pattern of decent work conditions of the group of responders. Finding out how supply-side factors like education influence decent work conditions of informal workers for the present study.
Methodology
Survey Design
The survey was conducted at individual level in Hooghly district of West Bengal, India. Hooghly is a colonial settlement situated at the bank of Ganges river with a historically evolved industrial sector, geographically favourable agricultural sector and a large supply of informal labours. It is consisted of 13 corporations/municipalities and 18 village blocks. Bhandarhati-I and Dasghara-II villages from Dhaniakhali block (18 village panchayats) and Chandernagore municipal corporation were randomly chosen as the rural and urban survey areas, respectively. A complete population enumeration of the survey areas could not be done due to lack of micro-level secondary data on informal workers. Therefore, constructing a random sample was not feasible for this study. Instead, the quota sampling method was applied for a predefined sample size. The main informal activities and their compositional structure of the survey areas were identified by consulting with local NGOs, local government bodies (such as labour office, gram-panchayats, or village councils) as well as available data on the beneficiaries under different government social security and employment schemes for informal workers. 3 However, these data were non-exhaustive and suffered from inconsistency across rural and urban areas. Quotas or proportions for each informal activity in the sample were determined for 22 main informal activities. The final questionnaire was prepared after an extensive pilot survey. It contained a set of structured questions about responders’ demographic profile and decent work condition relevant to them. While selecting the responders, it was made sure that the responder’s household is primarily supported by informal economic activities and the responder is a regular contributor in household expenditure. No two responders were selected from a same household. A total of 550 informal workers (350 from urban area and 200 from rural area) were interviewed face-to-face over September 2016 to March 2017. A total of 542 final interviews are considered in this study after data cleaning.
Description of the Sample
Majority of the responders are male (74.4%), Hindu (68.5%) and general caste (60.3%). The sample has only two religious groups—Hindu and Muslim, and only three caste groups—general, schedule cast (SC) and other backward classes (OBC). The responders are aged between 16 and 76 years, median age being 38 years and average age being 39 years approximately. At the time of survey, 84.65 per cent responders were married and living with their spouse and 47.23 per cent responders had children. Approximately 35 per cent of the responders never have gone to school. While the percentage is 25 per cent for rural responders, for the urban counterpart the number rises to 40.5 per cent. Table 1 presents the distribution of education level across gender and residing areas.
Categorisation of Informal Activities
The definitions of 68th round National Sample Survey (NSS) of India has been used for the categorisation. The 22 main occupations have been categorised under three broad groups—self-employed, regular wage-earner and casual labour using “usual principal activity status” approach, i.e., what has been the main economic activity of the responder in last 365 days or one year (NSSO, 2015). Self-employed are defined as people engaged in own farm or non-farm activities independently on “own-account” or with other few partners, also “self-employed in household enterprises.” Self-employed is mainly characterised by the professional autonomy, i.e., their ability to independently decide everything about the production/operation. Regular wage-earners are people who work in others’ farm/non-farm enterprises full-time or part-time and get paid in a regular basis and not on the basis of any short-term periodic contract (i.e., daily, monthly). Lastly, casual labours are those who work in others’ farm/non-farm enterprises under short-term periodic contracts. Following this classification, self-employed, regular wage-earner and casual labour 4 consist 36.53 per cent, 33.39 per cent and 30.07 per cent of the total sample, respectively. A more detailed classification is given in Table A1.
Distribution of Education Level across Gender and Residing Areas

Gender and the Work-categories
Overall majority of male responders are engaged as self-employed and majority of female responders are engaged as regular wage-earners. The pattern is same for urban area. But in rural area majority of men are employed as casual labour and the percentage is high for women workers as well. Large existence of agricultural labours can be a possible reason for such working pattern. Table 2 presents the distribution of work-categories across gender and residing areas.
Education and the Work-categories
Responders with zero years of schooling are primarily employed as regular wage-earner, followed by self-employed. The pattern is similar for responders with 1–4 years of schooling as well. For responders with 5–10 years of schooling, majority work as self-employed followed by regular wage-earners. For responders with schooling of more than 10 years, the pattern again becomes similar as the first two groups with a lower percentage for casual labour (20.8%). Table 3 presents distribution of work-categories across education levels.
Distribution of Work-categories across Gender and Residing Areas

Distribution of Work-categories across Education Levels

Description of the Indicators
Our study mainly follows the methodological framework of Kantor et al. (2006) for choosing the initial micro-level decent work indicators. The study of Kantor et al. (2006) is mainly an individual-level study based on the seven work-based securities of PSS, specifically the work of Anker (2002), Standing (2002) and Unni and Rani (2003). These securities, namely labour market security, employment security, work security, job security, skill-reproduction security, income security and representation security, have been defined and conceptualised in the following manner (Bonnet et al., 2003; Dasgupta, 2002; Kantor et al., 2006). Labour market security deals with one’s “ability” to find a decent job given the market conditions. Employment security is about having a secured and sustaining job post-employment. Work security considers having a healthy and safe working environment. Job security considers how appropriate and meaningful the job is for the worker. Skill-reproduction security assesses skill-developing and ease of skill-transfer. Income security is about getting adequate remuneration from a job to sustain a decent living. Lastly, representation security talks about workers’ voice and their representation in social dialogue. In order to conduct a more relevant study given the local conditions of informal economy, Kantor et al. (2006) put more emphasis on employment security and less importance on the job security aspect. Our study uses primary survey data collected using limited resource within a short time frame. Since the sample is small but diverse in nature, incorporating both rural and urban responders, the indicators have been selected with the aim to accommodate this diversity across all the seven dimensions of decent work. Hence, even if they lack in giving an in-depth analysis, they are enough to provide a comprehensive overview of the decent work conditions of the responders. Table 4 gives an overview of the micro-level indicators taken for the study.
Micro-level Decent Work Indicators across the Security Dimensions

Here is a brief description of the indicators mentioned above 5 :
Labour market security has the following indicators.
Potential underemployment: Two indicators have been used together to construct this composite indicator: whether the responder is working more than the standard decent working hour, i.e., 48 h per week, and whether the responder is willing to work extra hours given their present working hours. If one is working not more than 48 h per week and does not want to work for more hours, it can be said that their present working hours is within the standard work-time and enough remunerative for their livelihood needs. For those who is working less than 48 h per week and wants to work more, or working more than 48 h per week and do not want to work more, it can be said that they are not able to find enough remunerative work-hours within the decent work-time standard that will be sufficient for their livelihood needs. Hence, there can be potential underemployment. But if one is working more than 48 h per week and still wants to work for more hours, then their work-time not only exceeds the decent work-time standard but also poorly rewarded for their livelihood needs. This is the worst case of potential underemployment. These three cases are scored 3, 2 and 1, respectively, 1 being the worst case of potential underemployment.
Employment security has the following indicators.
Type of contract: Contract for payment/profit-share can be in written or verbal form if there is any contract at all. Though written contracts are often made informally, therefore no better than verbal contracts, we assume written payment contracts give the worker more bargaining power in case of any irregularity. 6 Type of contract is scored as 2 implies written contract, 1 implies verbal contract, 0 implies no contract.
Having license/registration/legal recognition: Although license or permit applies mainly to self-employed business owners or own-account workers, a legal professional recognition is often mandatory for an informal worker to access different government benefits. 7 Having license/registration/legal recognition is scored in binary: Here 1 implies “yes,” 0 implies “no.”
Having social security: Social security system gives a safety net against income vulnerability caused by occupational mishap, health, or other exogenous reasons. Social security is very relevant for informal workers who are particularly vulnerable towards income uncertainty as they often work on no-work-no-pay basis. This is also scored in binary: 1 implies “yes,” 0 implies “no.”
Fear of losing job/being out of work*: Fear of being jobless reflects the perceived market uncertainty as well as how likely a person can keep their job. It is reverse-scored in binary: 0 implies “yes,” 1 implies “no.”
Job security has the following indicators.
Satisfaction with present job: Measured with a four-point scale, satisfaction with present job implies workers’ perceived sense of meaningful/quality job. The scores are as follows: 4 implies “very satisfied,” 3 implies “satisfied,” 2 implies “not satisfied,” 1 implies “not at all satisfied.”
Can the present job help get a new job?: This reflects the degree of skill-transfer the present job offers. But it also implies a possible professional growth of worker, i.e., they are not stuck in a dead-end job. It is scored in binary: 1 implies “yes,” 0 implies “no.”
Willingness to stay with present job: Willingness to stay in present job implies agreeability and desirability of the job. It is scored in binary: 1 implies “yes,” 0 implies “no.”
Work security has the following indicators.
Job affecting health*: An indicator of the job perceived as hazardous, it is reverse-scored in binary: 0 implies “yes,” 1 implies “no.”
Relationship with co-workers/professional acquaintances: Amicable relation with co-workers, business-owners, employers, partners and other professional acquaintances (like suppliers, contractors, local administrative personnel and law-enforcers) indicates a cooperative and stress-less work environment. This is scored over a four-point scale: 4 implies “very good,” 3 implies “good,” 2 implies “bad,” 1 implies “very bad.”
Harassment faced during work*: This further indicates upon safety of the working place. It is reverse-scored in binary: 0 implies “yes,” 1 implies “no.”
Feeling lack of time in a day*: Feeling lack of time in a day indicates probable presence of time poverty and adverse effect on work–family balance. It is reverse-scored in binary, 0 implies “yes,” 1 implies “no.”
Access to basic amenities: Basic amenities at working place, i.e., adequate availability of food, water and sanitation facility is a precondition of a healthy working environment. But working places for informal workers range from own home to public places like road, field, or public transport. For workers operating outside home, the informal enterprises often lack steady settlements or scale of operation big enough to be provided with these facilities cost-effectively. Therefore for workers outside home, 8 access to food and water during work is ranked as follows: 3 implies “accessed from working place” (from own work settlement/provided by employer), 2 implies “accessed from public facilities,” 1 implies “brought from home,” 0 implies “inadequate access.” Access to sanitation facility is coded as follows: 2 implies “from working place,” 1 implies “public facility,” 0 implies “inadequate facility.” In case of multiple access, average of the access codes is taken, giving equal weightage to all the sources. For example, if the responder accesses food from working place as well as from home, then the score for access to food will be average of 3 and 1, i.e., 4. In case of home-based workers, 9 the three basic amenities scores are taken to be the average scores of rest of the responders belonging to the same profession. Score for “access to basic amenities” is the sum of all three scores for food, water and sanitation.
Skill-reproduction security has the following indicators.
Received any vocational training for present job: Receiving formal vocational training is an indicator of skill-development. It also enhances ease of skill transfer, i.e., being treated as a skilled professional 10 while searching for new job. It is scored in binary, 1 implies “yes,” 0 implies “no.”
Income security has the following indicator.
Hourly income: The earning rates and payment schedule of informal workers vary hugely across professions. To avoid the problem of comparability all incomes have been converted to hourly wage rate. Scores: 1 implies “less than ₹25 per hour,” 2 implies “₹25 to ₹50 per hour,” 3 implies “₹50 to ₹75 per hour,” 4 implies “₹75 to ₹100 per hour,” 5 implies “more than ₹100 per hour.”
Having personal debt*: Personal debts (excluding business loans) are an indicator of inadequate earning. It is reverse-scored in binary, 0 implies “yes,” 1 implies “no.”
Having non-wage benefits (for casual labour/wage-earner) 11 : Among non-wage benefits, having paid leaves, getting bonus and having sick leave/medical assistance/other assistance have been considered separately. All three are scored in binary, 1 implies “yes,” 0 implies “no.”
Representation security has the following indicator.
Member of any union/association related to present job: Being member of a professional union or association not only helps a worker voicing their rights but also help them build network of information dissemination. It is scored in binary, 1 implies “yes,” 0 implies “no.”
Constructing Decent Work Index
For each responder, the sub-index for a security dimension has been calculated by taking simple arithmetic mean of the indicator scores under that dimensions. Since some indicators may not be applicable for some particular work-group, only the average of applicable indicators has been taken to avoid negative bias
12
due to “not applicable” indicator scores. The seven sub-indices are normalised
13
using the following formula to nullify the effect of different scales of measurement: For the ith responder:
The final DWI is calculated by taking the sum of all the seven normalised sub-indices.
Overview of the Decent Work Conditions of Responders
Description of the Sub-indices
Labour Market Security
The sample average for hours of work per day is 8.6 h and the average for hours of work per week is 50.3 h. For 54.6 per cent of all responders, hours of work exceed the standard decent weekly working hour, i.e., 48 h per week. In total, 12.9 per cent of the total responders want to work for more hours even after working excessive hours, i.e., they face the worst case of potential underemployment. The percentage of facing worst case of potential underemployment is highest for self-employed worker in both rural and urban areas (25.2% for urban workers and 10.4% for rural workers). Table 5 presents a summary of labour market security indicators.
Labour Market Security Indicators

Since only the potential underemployed has been used as a composite indicator of labour market security for this study, labour market security index is nothing but the indicator value. It is an ordered variable taking three values—3, 2 and 1, respectively. Table 6 presents an overview of the labour market security index.
Employment Security
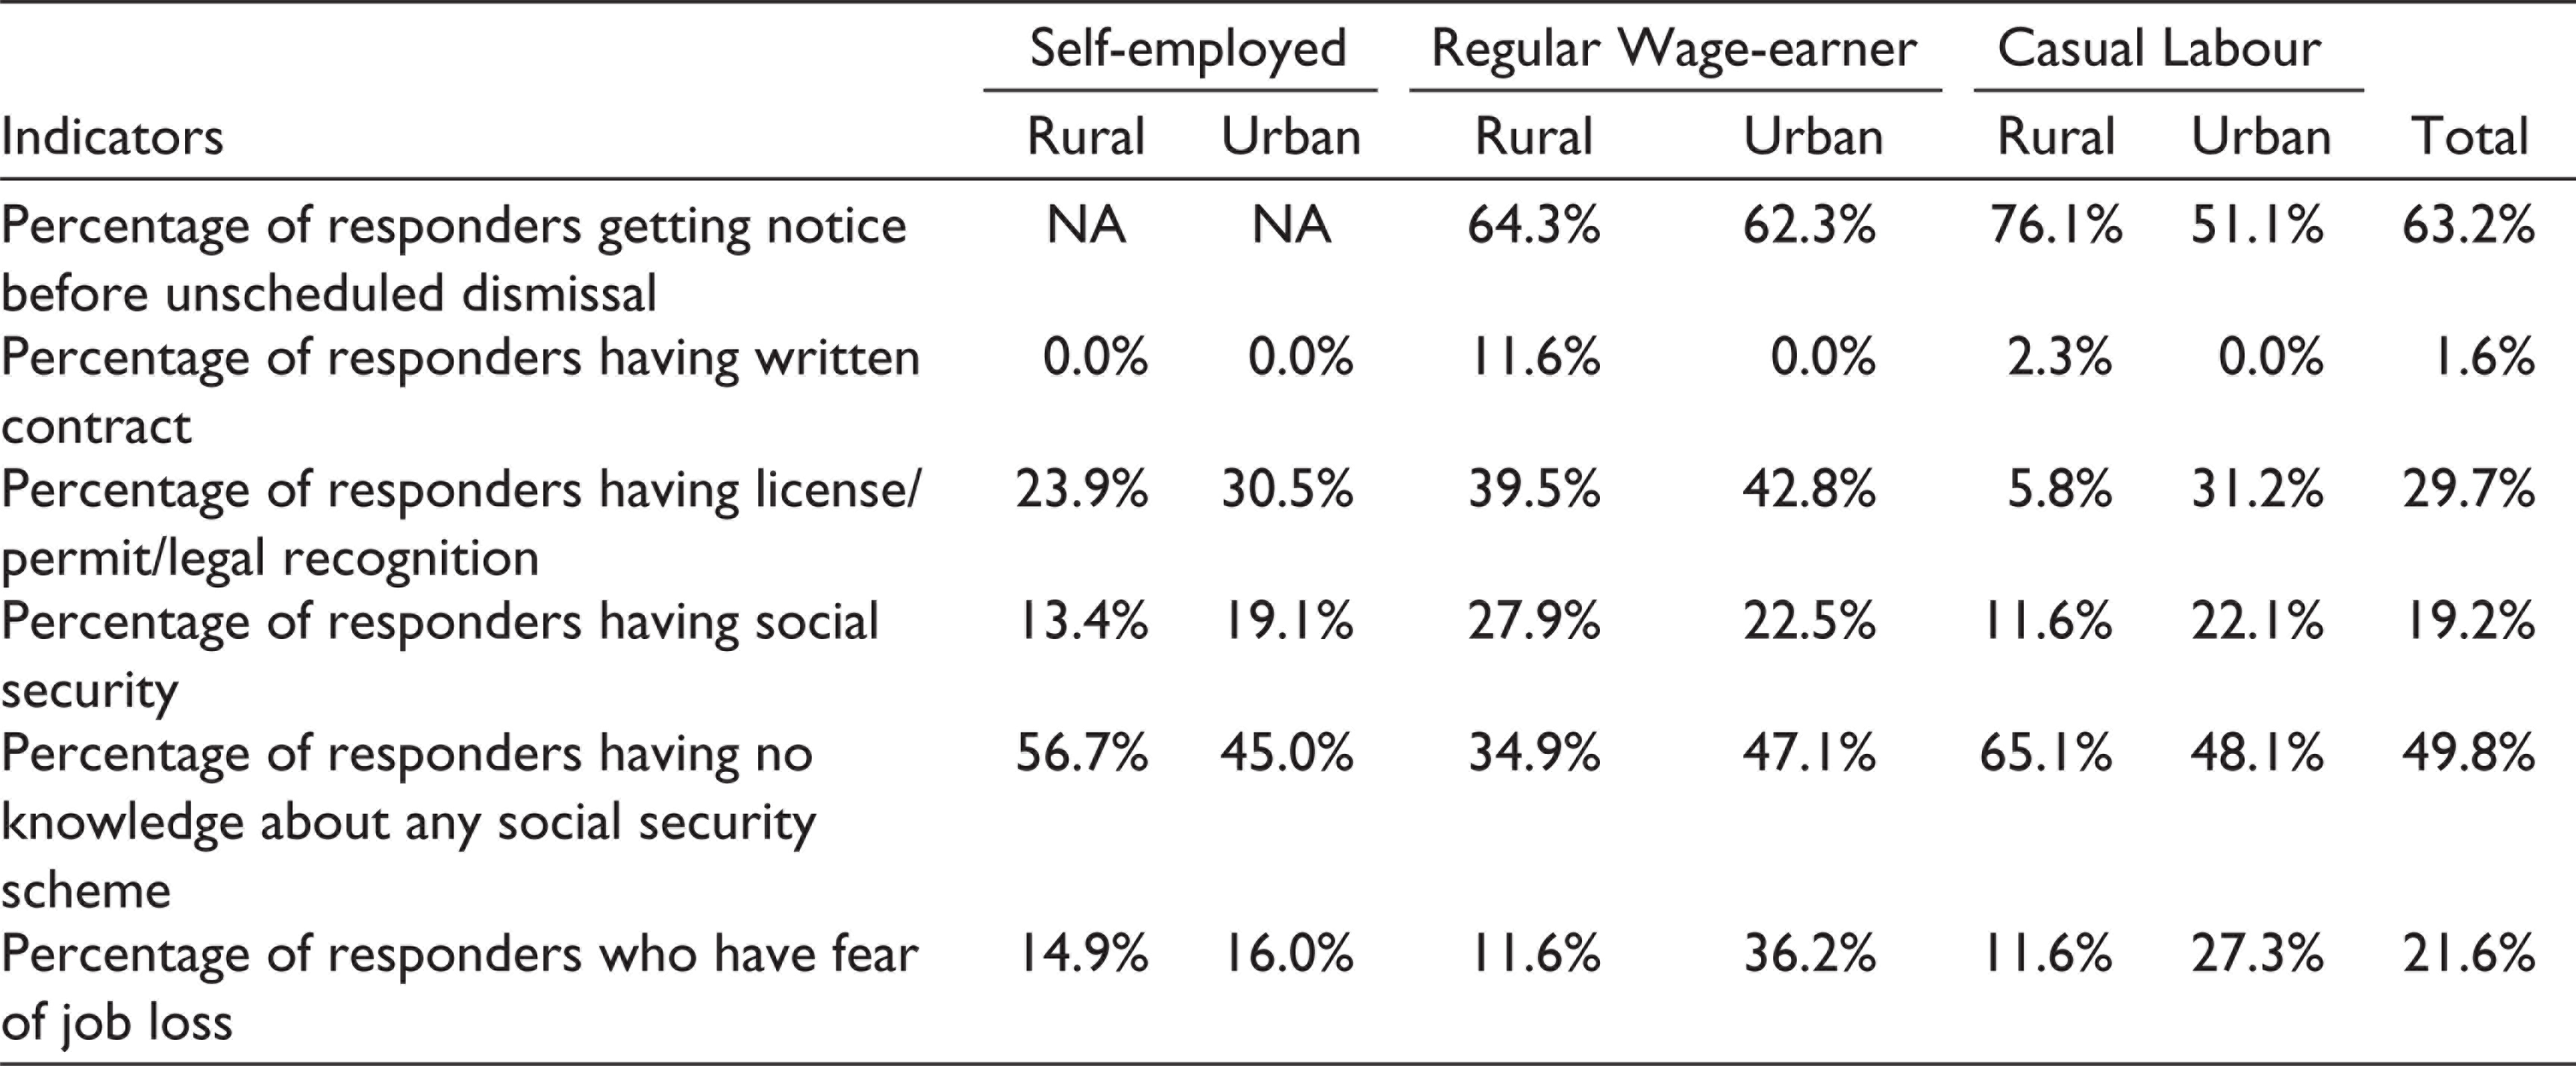
Contracts with employer or work provider are particularly important for wage-earners, casual labour for a secured employment. Excluding self-employed working without any partnership, only 1.6 per cent of workers have a written contract. In case of prior notice before an unscheduled dismissal, 63.2 per cent of workers (excluding self-employed) have reported of getting notice from employer/work provider. Legal recognition of any form, i.e., license of practicing own profession or running a business, registration of a business, professional identity cards, is another contributor to a secured employment. Only 29.7 per cent of responders have some kind of legal recognition (lowest for rural casual labours—5.8%). In total, 19.2 per cent of responders are registered under at least one government social security scheme. The main problem of government social security schemes is their lack of outreach. In our study 49.8 per cent of the responders have reported to have no knowledge of any social security schemes. Fear of job loss indicates the perceived sense of secured employment. Here 21.6 per cent of responders have reported fear of job-loss or being out of work. Table 7 presents a summary of employment security indicators.
Overview of the Labour Market Security Index

Employment Security Indicators
Overview of the Employment Security Index

Employment security index is an arithmetic average of all the applicable indicator scores. Table 8 presents an overview of the employment security index.
Job Security
Job security tells about whether the person is employed in a profession that is appropriate and meaningful for them, i.e., it talks about the non-monetary and non-material reward one gets from their job. Among the responders 75.3 per cent have reported to be satisfied with their present profession (“satisfied” or “very satisfied”) and 62.5 per cent responders want to stay in their present profession. But a fraction of these people decides to stay because changing profession is not a feasible option for them. Overall, for 9.6 per cent of responders changing job is not a feasible option, lack of alternatives, old age and lack of health to be the main reasons. On the other hand, a number of people who are satisfied with their present job want to change job for better prospect. Among the reasons for changing job, low earnings for present job have emerged to be the primary cause. And lastly, 37.7 per cent of responders believe their present job will help them get a new job, i.e., it is not exactly a dead-end job. Table 9 presents a summary of job security indicators.
Table 10 presents an overview of the job security index.
Job Security Indicators

Overview of the Job Security Index

Work Security
Due to a widely varied working places, job description and lack of organisation, informal workers are often compelled to work in unhealthy and even dangerous condition. In total, 45.9 per cent responders feel their job is affecting their health. When the combined scores of basic amenities (food, drinking water and sanitation) are considered, 57.4 per cent of the responders have scored below average while rural workers have consistently scored poorer than their urban counterparts. In total, 96.3 per cent of responders have reported to share a good rapport with their co-workers and other work acquaintances. Around 36.3 per cent responders have reported to face some kind of harassment during work from employers, co-workers, work acquaintances, police. Lack of contract, license or legal recognition aggravates these problems further. For example, a number of urban street-hawkers have reported working under regular police harassment and threat of dislocation since their business licenses are delayed and caught within in red-tapes and clientelism. On an average 52.8 per cent of responders have reported that they feel lack of time during a general working day and the percentage is consistently higher for urban workers than rural workers. Table 11 presents a summary of work security indicators.
Table 12 presents an overview of the work security index.
Work Security Indicators

Overview of the Work Security Index

Income Security
The hourly income of the responders shows a wide range of variation. Overall the hourly income varies from ₹0.91 to ₹357.14 with average ₹28.85 per hour. Only 45.4 per cent of responders reported to have savings per month and 29.5 per cent of responders reported of having personal debt at the time of survey. Among non-wage benefits from employer, only 8.7 per cent of the workers (excluding self-employed) enjoy paid leaves, 24.3 per cent receive bonus and 10.0 per cent receive medical and other assistances. Table 13 presents a summary of income security indicators.
Table 14 presents an overview of the income security index.
Income Security Indicators

Overview of the Income Security Index

Skill-reproduction Security and Representation Security
Overall 17.5 per cent of responders have received formal training for their present job and 13.3 per cent of responders are member of a professional union. Percentage of receiving formal training is highest for regular wage-earners, while percentage of being part of a union is highest for self-employed workers. Both skill-reproduction security and representation security have only one indicator each. Therefore, the sub-index values are just the indicator score. Sub-index values range from 0 to 1. Table 15 presents an overview of the skill reproduction index and the representation security index.
Overview of the Composite Individual Level Decent Work Index
Table 16 provides the average contributions of the seven sub-indices in the final composite individual-level DWI (as percentage of the final index). It also presents the range, average value and dispersion of the final index for different work-categories and for the overall sample. For the present study income, skill-reproduction and representation security have the minimum contributions (21.3% together) and labour market security has maximum contribution to the overall DWI (22.3%). The pattern is consistent across each work-category. Table 16 presents average contribution of the seven security dimensions in the final index.
Table 17 presents the distribution of DWI across the different work-categories. Self-employed workers have maximum percentage of people having highest values of index (9.6% having index values more than 4). But they also have maximum workers having the lowest values of index as well (24.2% having index values less than 2). This is consistent with the previous table that shows that self-employed workers have the highest coefficient of variation (33.8%). Regular wage-earners have the maximum percentage of workers having index values of 3 and above. Table 17 presents distribution of DWI across work-categories and residing area.
Overview of the Skill-reproduction and Representation Security Index

Average Contribution of the Seven Security Dimensions in the Final Index

Distribution of Decent Work Index across Work-categories and Residing Area

Checking the Effect of Supply-side Factors on Decent Work for Informal Workers
Econometric Analysis
In this part of the article, we have tried to understand the effect of individual-specific supply-side factors on the decent work condition of informal workers. For this study, formal education (years of schooling) has been considered as the primary supply-side factor. In the present sample, around 54 per cent of responders have crossed the barrier of primary school education (see Table 1). But only 17.5 per cent of the total responders have received any kind of vocational training (see Table 11). Therefore, the effect of years of schooling may indicate what kind of return formal education can yield in terms of decent work if there is not adequate support of vocational training and skill building. Additionally, two other supply-side factors have been considered—property ownership (asset_holding) and dependency ratio (number of household member 14 per earning member). Ownership of property (house or land) improves one’s wealth endowment and can provide additional stream of income, reducing financial vulnerability. On the other hand, a high dependency ratio reduces the ability of worker to bargain over the “quality” of job. Overall decent work condition has been measured by the composite DWI, and education has been measured by the years spent in formal schooling. Two sets of OLS models have been constructed to see whether the effect of education 15 differs across rural–urban (ILO, 2013) and across male–female (Bailey and Ricketts, 2003). The first set of models investigates the effects for the entire sample, combining all the three work-categories. The models are described as follows:
Model 1A (effect of education across work-categories and residing area):

Model 1B (effect of education across work-categories and gender):

The second set of models tests the effects for each of the work-categories separately. The reduced models become the following:
Description of the Explanatory Variables Used in the Regressions

Regression Results of the Combined Models (1A and 1B) and Reduced Models (2A and 2B)


*p < .10, **p < .05, ***p < .01.
Model 2A (effect of education across residing area):

Model 2B (effect of education across gender):

Table 18 provides the descriptive statistics of the independent variables used in the models.
Table 19 presents the regression results of all the models described above. Since the F-statistic of model 2B for wage-earners is statistically insignificant, it has been rejected and not shown here.
The coefficient of schoolyear is negative and significant in model 2A-3 and 2B-3 and coefficient of (schoolyear) 2 is positive and significant for model 2A-3, 2B-3 and model 1B. The signs of coefficients suggest that DWI decreases at an increasing rate with years of schooling. Coefficients of wageearner and casuallabour are positive and significant for both model 1A and 1B, but the combined effect of work-category and years of schooling is significant and negative for both work-categories and both models. Therefore, although belonging to wage-earner, casual labour and piece-rate worker category results in a slightly higher value of DWI, more years spent in formal schooling reverse that positive effect. Coefficient of rural is consistently negative and significant for model 2A (all groups). For the combined model (model 1A), the negative coefficient of rural is not significant, but when the combined effect of work-category is considered with residing area, rural workers are worse off for both wage-earners and casual labours though the effect is significant only for casual labours. Therefore the results suggest that overall rural informal workers have lower DWI than urban informal workers though higher years of schooling in rural area results in higher DWI than urban area (model 1A and model 2A-2). Coefficient of asset_holding is significant and negative in model 1B, model 2A-1 and 2B-1, indicating a negative impact of owning property on DWI for this study.
For the present group of responders, gender and dependency ratio do not have any statistically significant impact on DWI. Models investigating the effect of education on decent work across residing areas (1A and 2A) have better explanatory power that the models investigating effect of education across gender (1B and 2B). Among the three work-categories, the models work best for the group of casual labour.
Discussion
The results strengthen the idea that for the people who are likely to end up in unskilled and semi-skilled employment sectors, the short-run cost of acquiring formal education exceeds its long-run benefits (especially where highest years of schooling for maximum of the responders lie within eighth standard). Policies and schemes to promote basic education in India 16 have been targeted mainly toward proper mental and physical development of children and curbing child exploitation. Therefore, separate initiatives 17 have been taken to education at secondary and higher-secondary school-level. But even these schemes would have been able to cover only 23 per cent of the responders who have attended school after eighth standard (see Table 1).
Consistent with the trend found from Table 17, the results show that rural workers are worse-off than urban workers. Higher concentration of agriculture and allied activities in rural area than in urban area can be a possible reason behind this result. Self-employed workers are the most disadvantageous among the three work-categories. Though they are likely to have more freedom and autonomy over their job and remuneration, working excessive hours with low return, precarious working condition and lack of protection against job uncertainty supersede those benefits. Contrary to the literature (like Samans et al., 2017), property ownership is found to have a negative impact on decent work. Though asset-holding increases bargaining power of workers, the workers may become reluctant to utilise that regarding better work condition due to reduced financial vulnerability and dependency on present job. The effect of reduced financial vulnerability resulting from property ownership can further be countered by additional debt-burden to acquire the asset.
Conclusion
The article first evaluates the decent work condition of the informal workers at individual level following seven work-based security dimensions. It constructs seven sub-indices and one composite DWI for each responder. Then it investigates the effect of the supply-side factors on the DWI using regression analysis. This article is a preliminary study to get an overview of decent work condition of the group of responders. The findings indicate comparatively low achievement in income, skill-reproduction and representation security among all the dimensions. The regression analysis reveals that rural workers are worse off than urban workers and self-employed workers are likely to have the lowest values of DWI compared to the other two work-categories. The most surprising finding of this study is the negative impact of education (years spent in formal schooling) on DWI of informal workers. Low incidence of vocational training and an apparent mismatch between demand and supply-side of labour market can be possible explanations for this result. But finding out the exact reasons of ineffectiveness of formal education in improving decent work condition of informal workers in this case is beyond the scope of this article. The findings suggest a general lack of skill-building initiatives in the survey areas. A more in-depth causal analysis can be carried out in future with additional information on the local education system and market condition to go beyond that and understand the more effective ways of vocationalisation of education targeted for the poorer section of society.
Footnotes
Declaration of Conflicting Interest
The authors declared no potential conflicts of interest with respect to the research, authorship and/or publication of this article.
Funding
The authors disclosed receipt of the following financial support for the research, authorship and/or publication of this article: This work was supported by the Centre for Advanced Studies, Department of Economics, Jadavpur University, to carry out the primary survey.
Appendix
Categorisation of Individual Informal Activities

| Name of Profession | Categorisation |
| Integrated child development services or ICDS worker (anganwadi) | Regular wage-earner |
| Driver (auto/toto) | Self-employed |
| Driver (private cars) | Regular wage-earner, casual labour |
| Transport worker (driver/helper – truck, lorry, bus, etc.) | Regular wage-earner, casual labour |
| Paddler (rickshaw, van) | Self-employed |
| Aya or caregiver | Regular wage-earner |
| Grooming professionals (barber, beautician) | Self-employed, regular wage-earner |
| Carpenter | Self-employed, regular wage-earner, casual labour |
| Head-load worker, labour | Casual labour |
| Construction workers (including plumber, electrician) | Self-employed, regular wage-earner, casual labour |
| Factory labour | Regular wage-earner |
| Shop worker | Regular wage-earner |
| Security guard | Regular wage-earner |
| Mechanic | Self-employed |
| Tailor | Self-employed, regular wage-earner, casual labour |
| Street hawker/vendor | Self-employed |
| Housemaid | Regular wage-earner |
| Potter, clay idol maker | Self-employed |
| Fisherman | Self-employed, casual labour |
| Farmer | Self-employed, casual labour |
| Bookbinder, printing press worker | Self-employed, regular wage-earner |
| Worker in catering business | Self-employed, casual labour |
| Cobbler | Self-employed |
| Other employment (laundry, dungcake-making, thread-making, fishnet, leaf-plate making, garment-beads and glitter setting, decorative flower making, gardening, priest, cable rent collector, tutoring etc.) | Self-employed, regular wage-earner, casual labour |