



Abstract
This article attempts to examine the coverage and labour market outcomes of the Mahatma Gandhi National Rural Employment Guarantee Act (MGNREGA) in Kashmir. It is based on a cross-sectional mixed-method study of 200 households, 40 bureaucrats and local political representatives conducted in Kupwara, one of the poorest districts of Jammu & Kashmir. The article argues that MGNREGA is poorly implemented and is not functioning as a guaranteed safety net for the poor households that suffer from job scarcity. Considerable benefits are directed towards the non-poor, while several poor and deserving households are excluded. This bias is a result of rationing in local distribution by middlemen in collusion with bureaucrats to further their political and economic interests. In addition, the administration’s orientation towards MGNREGA as a development policy instead of a social protection, supply shortage in the provision of MGNREGA work and administrative delays in project operationalisation are some of the key bottlenecks. The article contends that the policy has enormous scope and potential to achieve its anticipated objective of acting as livelihood protection for job scarce workers in rural Kashmir, if it is implemented as a social protection policy following its provisions in its true spirit.
Background
The labour market is very dynamic; therefore, changes are inevitable with the entry of a new, or exit of an existing, source of livelihood from it. Examining these changes is important in order to understand the new directions of the labour market. The Mahatma Gandhi National Rural Employment Guarantee Act (MGNREGA) entered into the rural labour market as one such new source of livelihood in 2005 and was extended to the entire India by 2008–2009. The act is a universal Social Protection Programme (SPP), with the aim of providing unemployment security to overcome the livelihood crisis in the rural labour market. As a Public Work Program (PWP) it guarantees 100 days of employment per household in a year. Unlike the earlier and other existing PWPs in the developing world, it is unique in its design and application. It incorporates all the features of Transformative SP framework—it is protective, promotional and transformative (Sabates-Wheeler & Devereux, 2011). 1
Protective: It primarily aims to protect the income and consumption shortfalls of the rural labour force by entitling them to surrogate unemployment insurance through a legal guarantee of 100 days of work in a financial year (FY) (Subbarao et al., 2013). 2 The work is self-selective in nature and is provided at a statutory minimum wage notified for the programme by respective state governments, which in most of the cases is below the existing market wage (Dutta et al., 2014).
Promotional: By providing public work, it aims to promote the rural economy through investment in productive assets.
Transformative: By providing the public work, it also aims to transform gender relations through reservation for women in the workforce at a wage rate equal to that of men (Malla, 2014; MoRD, 2012).
Owing to its universal nature, it covers more than 10 per cent of India’s labour force (MoRD, 2010), and has emerged as the largest publicly financed, and financially inclusive PWP in the developing world (Gupta & Mukhopadyay, 2014; Philip, 2010).
Similar to other states of India, MGNREGA was extended to the state (now a union territory) of Jammu and Kashmir (J&K) in 2005 (Malla, 2014). It was received with a lot of hope and optimism because of several reasons. First, unlike most of the other parts of India, J&K is caught in a unique political fragility, where the lives, livelihoods and the freedom of people have been seriously curtailed due to the political interests of various parties (Habibullah, 2009; Navlakha, 2007; Schaffer, 2005). The continuing fragility over the last 70 years has left the region with severe livelihood crises and vulnerabilities. The unemployment rate in the region is 3.61 per cent, compared with the 2.19 per cent all-India average, and rural unemployment is 2.5 per cent, compared with all-India rural unemployment of 1.7 per cent (NSS 68th Round). Second, the dependence on the informal sector has increased, and the people who are already in the informal sector are getting into severe livelihood vulnerabilities because the growth and contribution of agriculture (the main source of livelihood for the informal sector) are declining (NSS 2011–2012). 3 Third, due to conflict disturbances and the poor functioning of the regional administration, the rural infrastructure continues to be at the peripheries of development (Malla, 2014).
The entry of such a type of PWP into the regional labour market is entirely new. Though some residual PWPs were in place earlier, nothing as universal and significant as MGNREGA was there. Considering the unique nature and local need of the policy, it is important to understand the changes in the labour market after its initiation. Further, equally importantly, a scrutiny of the implementation of the programme in this region and its reach among the intended rural households assumes significance. This article aims to serve this purpose and explore the issues in its implementation.
The remaining part of the article is divided into six sections and subsections: empirical work on MGNREGA, methodology, household distribution, targeting outcomes, labour market outcomes and concluding remarks and a way forward.
Empirical Work on Targeting and Labour Market Outcomes of the Mahatma Gandhi National Rural Employment Guarantee Act
Because of its size and implications for rural India, the policy has attracted a considerable amount of academic interest (Azam, 2012). The literature has broadly reflected on aspects of targeting, labour market outcomes, women’s participation, wage increase, livelihood security, income enhancement and income multipliers. This article focuses on targeting of the programme and labour market outcomes, and the following review highlights debates related to these two themes of MGNREGA.
In principle, the policy is a demand-driven guaranteed entitlement to work. Does it function as a demand driven and guaranteed employment programme? The answer is ‘No’ (Dutta et al., 2014). It is found that the policy is top-down supply-driven because the participation rates do not corroborate with the demand (Dutta et al., 2014). Households can engage in work only when a project is available, with many being unable to get their desired level of work (Afridi et al., 2013; Dutta et al., 2012; Gupta & Mukhopadyay, 2014; Himanshu et al., 2015; Ravi & Engler, 2015; Reddy et al., 2010). This misfit between work demand and supply results in huge rationing at the individual, household, seasonal and government levels (Dutta et al., 2012, 2014; Himanshu et al., 2015; Imbert & Papp, 2013). While there are variations across states in work rationing (Dutt et al., 2014; Mukhopadhyay, 2012), an overall understanding is that it has reduced the potential of MGNREGA to act as a fallback insurance mechanism for rural informal workers (Dutta et al., 2014; McCord, 2012).
The second question pertains to the policy’s reach among the poor and disadvantaged. There is considerable evidence that despite various limitations, the scheme is found to be pro-poor and has benefitted disadvantaged groups such as Scheduled Castes (SCs), Scheduled Tribes (STs), Other Backward Classes (OBCs) and women (Afridi et al., 2012; Deininger & Liu, 2013; Dreze & Khera, 2009; Dutta et al., 2014; Jha et al., 2009; Liu & Deininger, 2010; Reddy et al., 2010). However, some studies also show that the self-selective and demand-driven nature of the policy has created incentives for the slightly better-off sections as well—during the slack seasons when the wage rate is down—which consequently crowd out the poor (Jha et al., 2009).
Coming to labour market changes, the literature has broadly examined changes in labour force participation (LFP), casual labour wage rate, external labour market and working conditions. First, there is an agreement that MGNREGA has increased the LFP rate. 4 Second, it is also widely reported that MGNREGA has provided a decent wage rate, which in turn has exerted pressure on and led to an increase in the external market agricultural wage rate, particularly for the female labour force (Afridi et al., 2012; Azam, 2012; Berg et al., 2012; Dreze & Khera, 2009; Imbert & Papp, 2012, 2013; Zimmermann, 2012). However, some studies also reflect that by providing wages higher than the external market, MGNREGA has not been able to manage the conflicting trade-off between granting benefits high enough to effectively alleviate participants’ destitution and avoiding distortion in the labour market. It is becoming lucrative for households with private-sector jobs, and reduced incentives for seeking regular employment. This in-turn is promoting a labour shortage in the private sector, boosting the programme costs, and reducing the net workday contribution of the policy to the labour market (Ravi & Engler, 2015; Dutta et al., 2014). 5 Third, by providing better working conditions, MGNREGA has created opportunities to work with dignity and to give up undesirable work (Dreze & Khera, 2009), notwithstanding instances of child labour, as some reports suggest (Pellissery & Jalan, 2011).
Overall, the literature reflects a slightly fragmented position of MGNREGA, which continues to limit our understanding about its functioning and impact. These limitations are mainly due to a scarcity of rigorous evaluations at the all-India level and across states (Dutta et al., 2014). Much of the current MGNREGA literature comes from few relatively better-performing states that have received considerable attention from researchers. Other states and regions such as J&K continue to remain distant from the attention of researchers due to reasons of political instability, data limitations or their not fitting into the researchers’ research designs (Dutta et al., 2014, p. 34; Mukhopadhyay, 2012, p. 22). Except for some government reports and a few initial generic studies (Alam et al., 2010; Malla, 2014), rarely any study has examined the targeting and labour market outcomes of MGNREGA in J&K.
Methodology
This article is based on a cross-sectional study conducted in Kupwara district of Kashmir. The Act was implemented in this district in the first phase, which is one of the poorest districts in the state of J&K. A cross-sectional design was used to compare the targeting and labour market outcomes, and to assess reasons responsible for differences between villages, grouped as high-performing panchayats (HPAs) and low-performing panchayats (LPAs). Probability sampling was used for the selection of districts, blocks and panchayats. The districts were ranked based on three indicators: per capita income (PCI), the proportion of Below Poverty Line (BPL) population and workday generation as a proportion of the total rural population (WGPTRP) in the last four years. Using all these indicators, Kupwara district with a high BPL population, low PCI and high MGNREGA performance was selected for the study (Figures 1 and 2). Interestingly, the district is also among the first districts where MGNREGA was implemented. Blocks within the district were selected based on the ranking of WGPTRP in the last four years. Kupwara and Ramhal were selected as high-performing blocks, while Rajwar and Trahgam were selected as low-performing blocks (Figure 3). 6 Within blocks, the performance rank of four years of MGNREGA was taken as the first indicator, based on which five panchayats were shortlisted from each block. To increase the contiguity between HPA and LPA panchayats on extraneous factors, an “elimination technique” (Bhattacherjee, 2012, p. 38) was applied based on panchayat data and personal field visits. Out of the five shortlisted village panchayats in a block, two were selected that had relatively less average factor size, less irrigated factor size and a semi-hilly and semi-plain topography (Table 1). 7 Households in panchayats were selected through disproportionate stratified random sampling (DSRS). 8 The total sample comprised 200 households. Besides, 40 bureaucratic and non-bureaucratic administrators were also interviewed, who represented eight panchayats from four blocks of the district. The sample was equally distributed between HPAs and LPAs.


Panchayat Code

To get a comprehensive understanding, a mixed-method approach was used for data collection. Structured interviews were conducted with the households, and in-depth interviews were conducted with secondary stakeholders comprising panchayat representatives, village-level workers (VLWs), block development officials (BDOs) and officials responsible for policy implementation at the district and state levels.
Sample Household Distribution
Out of the 200 households, 50 per cent belonged to HPAs and 50 per cent to LPAs. About 59 per cent belonged to the general category, 37 per cent to the ST category and 3.5 per cent to other castes (SC/Pahari). About 40 per cent and 60 per cent were from poor and non-poor backgrounds, respectively (Table 2).
Sample Distribution of HHs in Percentage

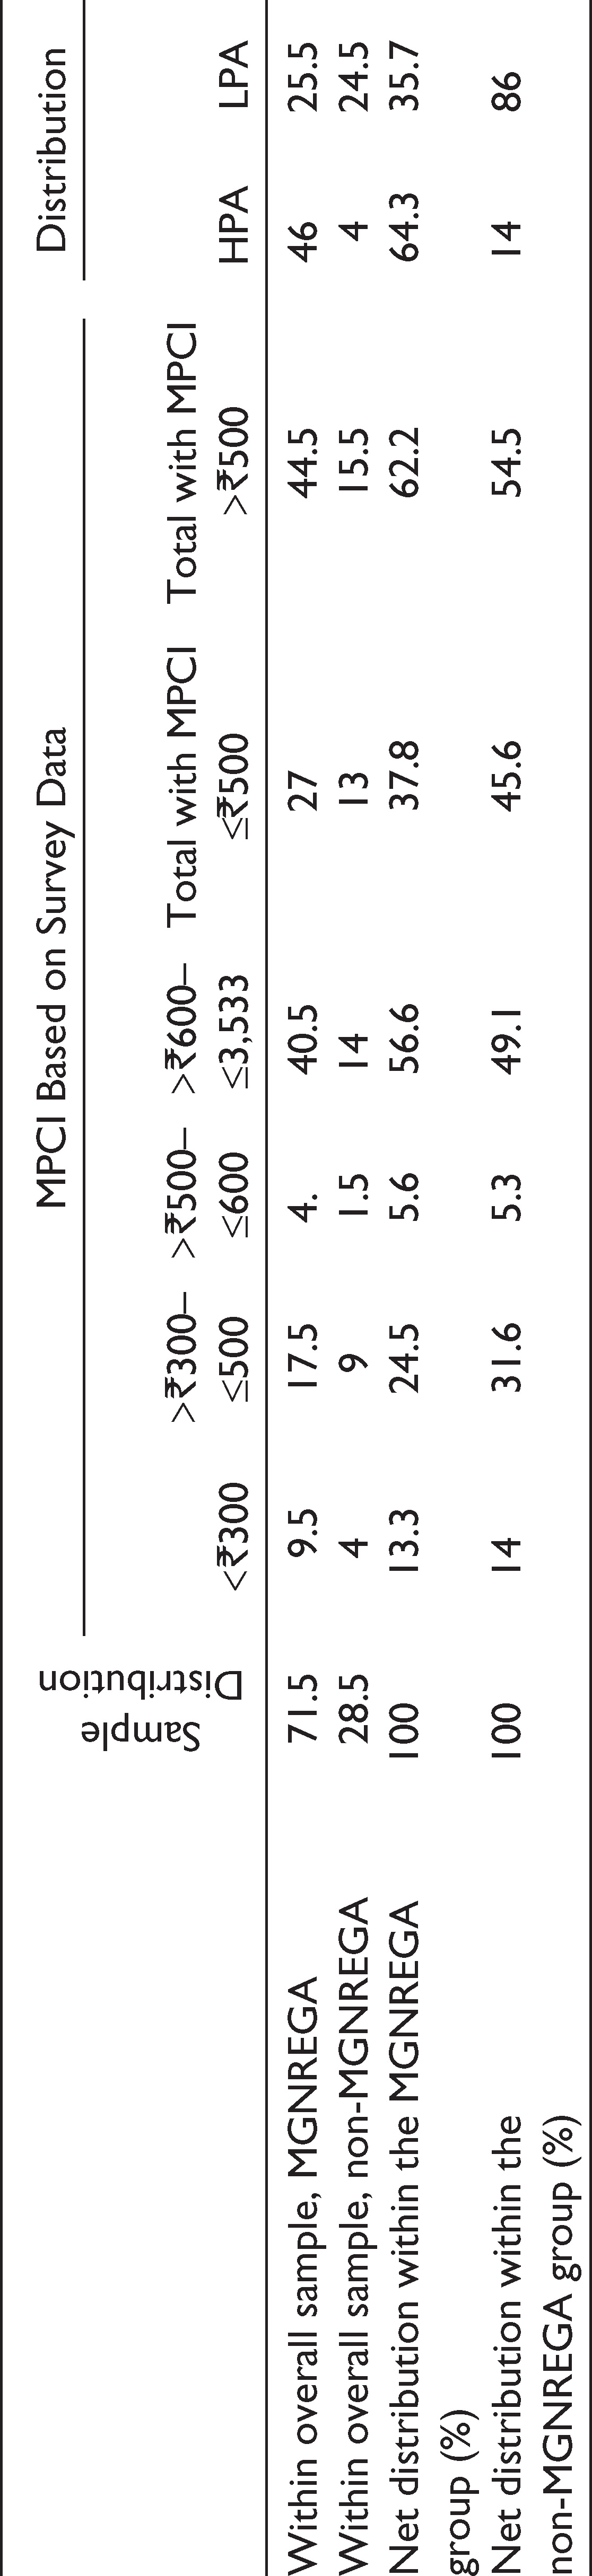
State government methodology forms the basis for regional welfare policy planning and distribution in J&K. At the time of the study, according to the state classification, those with a monthly per capita income (MPCI) of less than ₹500 were considered BPL, and those with MPCI of greater than ₹500 above the poverty line (APL), with an overall estimate of 26 per cent of the J&K rural population categorised as BPL (DESJK, 2008). However, like reports from other parts of India (Khera, 2006), the sample households, and some bureaucratic and non-bureaucratic representatives alleged that the ration card distribution process at the local level was not based on any proper selection criteria/methodology; instead, that was arbitrary, at the mercy of local informal leaders. To overcome these loopholes, the study used the actual income reported by the households from all the sources and family members. The parameters used were the same as prescribed by the state methodology, and the resultant composition represented 40 per cent households with MPCI up to ₹500 and 60 per cent with MPCI above ₹500 (Table 3). This, when compared with the ration card distribution, showed a small difference, where 36.5 per cent and 63.5 per cent had BPL and APL cards, respectively.
Gross Distribution of HHs
Targeting Outcomes
The participation levels and the nature of households participating in the programme reveal the outcomes of the implementation, and also indicate whether the participation is self-selective or the scheme rather becomes targeted in certain ways. Overall, around 71.5 per cent of the 200 households participated in MGNREGA, with 64.3 per cent (of 100 households) from HPAs and 35.7 per cent (of 100 households) from LPAs. About 62.2 per cent non-poor (MPCI > ₹500) and only 37.8 per cent poor (MPCI ≤ ₹500) participated. In correspondence with their overall sample population, 56.6 per cent, 41.3 per cent and 2.1 per cent belonged to the General, ST and other categories, respectively (Table 4). Within the group distribution of overall MGNREGA participants, at the cross-sectional level, there were 92 per cent in HPA, whilst there were only 51 per cent in LPA who participated. Within the economic-status groups, participation was 74 per cent among the non-poor households, while it was 67.5 per cent among the poor. Within social groups, the participation was about 11 per cent higher among STs than that among the General category (Table 5). If we disaggregate further to look at within the group distribution of MGNREGA participation at the cross-sectional level, the participation of non-poor households stood higher among both HPAs and LPAs (Table 5); the participation of both poor and non-poor was high among HPAs, and the participation gap between the poor and non-poor/less poor was less in HPAs than that in LPAs. Similarly, the participation of STs was 100 per cent in HPAs compared with 60 per cent in LPAs.
Sample Distribution of MGNREGA Participants

Within-group Distribution of MGNREGA Participants and Non-participants

Interestingly, these outcomes do not show any caste-based exclusion. They reflect fairly good (above two-thirds) participation of the poor; however, there is more inclusion of non-poor households compared to poor one, whether it is their participation rate in the overall sample or at the cross-sectional level. One could argue that probably, the poor had good work opportunities in the local labour market (working as construction or agricultural labourers) and perhaps did not need MGNREGA. However, the outcomes of average monthly private work available to households reflect differently (Table 9). One could also argue that the policy is self-targeted and open to everyone. However, there appears to be an irreconcilable trade-off. One, the poor are poor, with one of the key reasons being limited livelihood opportunities; therefore, even within the self-selective system, one would expect more participation of the poor than the non-poor. Two, MGNREGA in the state is not so lucrative that it could attract the attention of non-poor, because its wage rate is almost 50 per cent below the external market wage rate (construction sector and agricultural and allied sector labour work in the local market). When MGNREGA was started, its wage rate in J&K was ₹70, and it was ₹131 at the time of this study. Hence, these outcomes raise a few key questions, such as: Does the policy work as self-selective and demand-driven? Why is the poor-household participation rate low? Why are the non-poor attracted to MGNREGA in huge numbers? The sections below seek to unpack these questions.
Is MGNREGA Self-selective and Demand-driven?
The Act provides for self-targeting or self-selection, and whoever is willing to work should formally demand work and should be provided work within 15 days of raising the demand. If not, then he/she should be provided with unemployment allowances (MoRD, 2012). There is also a specified line of implementers to ensure the smooth functioning of the system from the bottom to the top. However, the ground reality is totally different. One, there is a widespread lack of awareness among the people about the real essence of MGNREGA, its various components and functioning system.
Two, there is a systemic constraint embodied in the institutional evolution within which MGNREGA is operating currently. As mentioned earlier, this type of PWP is entirely new to the regional labour market, and the region is also politically fragile. Therefore, providing the stipulated institutional set-up became a challenging task at the beginning. On the bureaucratic front, appointing officials at the village, block, district and state levels was a time-consuming process. Therefore, until the mandatory appointments could be made, the responsibility was given to the existing bureaucratic institutions (BDO, VLW etc). On the political front, establishing specified political systems at all these levels became more challenging, the reasons being that the architecture of MGNREGA as a central strategy is rooted in the 73rd Constitutional Amendment (73rd CA), which was not extended to J&K, whose panchayat institutions were governed by the J&K Panchayati Raj Act, 1989. Notwithstanding when the Jammu and Kashmir Rural Employment Guarantee Scheme (JKREGS) was formulated no such institutions were in place (from about 1970s), due to the ongoing conflict. This forced the state to opt for an alternative and relatively weak institutional strategy. At the gram panchayat (GP) level, a three-member committee—deh majlis—was to be nominated for planning and execution. At the block level, the Block Development Council was to be constituted with members from the deh majlis and line departments. At the district level, the district development board was to be constituted (Alam et al., 2010). However, even after seven years (by the time of the survey in 2013–2014), this alternate arrangement too did not completely exist on the ground. On the bureaucratic front, a few program officers and gram rozgar sevaks were recently appointed, but the control continued to lie in the hands of BDOs and VLWs, for whom MGNREGA is an additional rather than primary responsibility. On the political front, deh majlises had remained either confined to paper or were captured by the local elites.
These initial institutional dilemmas had given rise to a new colluded system in which local bureaucrats and middlemen worked together to actualise their political and economic interests out of the MGNREGA implementation. The middlemen were local informal and/or formal leaders, contractors/elites who had replaced the position of mate (supervisor) in MGNREGA and implemented MGNREGA projects like any other commission-based government construction contract. Having been in existence since the beginning of the policy, this system got embedded into the structure and continued even after the elected panchayats in 2011, despite the appointment of some staff of MGNREGA after 2012 and further dissolution of panchayats in 2015. Within such a derailed implementation system, the self-selective and demand-driven principles of MGNREGA saw limited scope to function as provisioned.
The willingness of a household to work in MGNREGA was translated in two ways. Either it is an under-reported demand (Himanshu et al., 2015), that is, people will inform some representative or official that they want to work, or a latent demand (Dreze & Khera, 2009), meaning they will not ask but will wait, assuming that someone would bring a project and invite them to work. Another aspect of this was that owing to the lack of awareness about the policy being a guaranteed entitlement, some people who were willing to work in MGNREGA felt shameful of asking a formal/informal representative for work, as they fear being looked down upon. The outcomes from the last 12 months show that this willingness to work (latent and under-reported demand) is not getting fully realised, indicating further that the policy is not demand-driven. Out of the households that wanted to work in the last 12 months, only 44 per cent got work (Table 6). Further, there appears to be a little exclusion bias towards the poor, as out of the total poor households who were willing to work under MGNREGA, only 48 per cent received work, compared to 52 per cent non-poor households (Table 6). Further, out of those poor who were willing to work or work more (in the case of non-completion of 100 days), as well as requested for it, no one reported getting it, in contrast to the 5.5 per cent non-poor households, that too from the higher income quintile (MPCI > ₹700 ≤ ₹3,533) (Table 6).
Why is Poor-household Participation Rate Low?
There are three broad reasons for the low participation rate and the possibilities of an exclusion bias towards the poor. Two indirect contributing factors include supply-side constraint and the local government’s unpredictability in implementation. The other direct contributing factor is the control of the middlemen on the local distribution system.
One, at the macro level, similar to observations in Himanshu et al. (2015), there is a supply-side constraint. As shown in Table 6, there is no lack of latent or real demand on the part of the households, but there is a supply shortage, affecting the poor households. Consistent with Dutta et al. (2014), higher work supply increases participation and results in a better inclusion of the poor and other disadvantaged groups. The MGNREGA participation rate in HPAs is 92 per cent compared with 51 per cent in LPAs. Consequently, the participation gap between the poor and the non-poor is only 6 per cent in HPAs compared with 15 per cent in LPAs (Table 5). Furthermore, while the latent demand is almost equal, rationing is relatively higher in LPAs where only 26 per cent compared to 67 per cent in HPAs have got work in the last 12 months (Table 6). All of this indicates that better work supply not only leads to widening of access to benefits but, more importantly, also creates a space for the inclusion of a larger number of poor households in the policy.
Work Demanded and Received (%)

Two, at the meso level (block/district), there is a continued lack of predictability within the governments about the operationalisation of MGNREGA work. Whatever work is approved and/or supplied gets constrained by local governments that start or stop a project at their will without considering the actual need and demand of the people on the ground (Himanshu et al., 2015; Imbert & Papp, 2013). While this disproportionality affects everyone aspiring to work in MGNREGA, it affects the poor even more. There is neither any time-bound response to their demand nor can they go to the block office every time asking about the commencement date of the work. They mainly remain at the mercy of the local village headmen (middlemen), to whom the priority of engagement are not the poor but their family and other clientele. Poor and job scarce are given work only if some space is left, after the engagement of family and other clientele. The option of the poor raising their voice against these middlemen remains limited due to the existence of a colluded system, as well as lack of transparency and accountability in the system.
This leads us to the third, micro-level distributional constraint, and in fact a crucial one, that is, middlemen’s control over the local distribution process. As shown earlier, there is huge under-reported or latent demand. However, in practice, it matters very little whether a household demands work or not, because it is entirely up to the middleman whether he calls a household for work or not. This is partly the reason that some of the households that reported demanding work during the initial years are not doing so now. Hence, instead of voluntary exclusion, 9 which the policy wanted to foster by inserting the provision of self-selection, this nature of implementation is leading to involuntary exclusion through middlemen’s rationing, thereby undermining both the self-selective and demand-driven provisions of the policy.
When projects come up, these middlemen capture them and use their own family members (in some cases their older school-going children as well), extended families and affiliated labourers, or distribute work as political patronage. There are two scenarios which come into play in the local labour engagement process. One, if there is ample time to complete a project, the middlemen would not engage any other labourers beyond the core circle. The key incentive for middlemen in this is that the major portion of the project money comes home without any hassle, through different bank accounts of family members. Documents are counterfeited conveniently to match the online administrative procedures, stating that these were the only people who demanded work. This capturing sometimes leads to these households working for more than the specified cap of 100 days, while others equally or more deserving of wage employment remain without a single day of work. Table 6 shows the outliers of the 1 per cent that completed 100 workdays and the 3 per cent that exceeded the limit of 100 workdays during the last FY. Exceeding the 100-workdays limit not only is a violation of policy norms but also shows the extreme perpetuation of middlemen’s control on the work distribution. Two, if there is a shorter time frame within which a project is to be completed, then the labourers beyond this circle are also engaged. Here too, the preference is not given to those who have the most job scarcity, but to those who are or can be politically significant for the middleman.
What Motivates the Non-poor for MGNREGA?
Because the participation of the non-poor is predominant, so far it has remained unclear what motivates them for MGNREGA when its wage rate is lower than the external market wage rate and is meant to protect those with variable income and those vulnerable to livelihood risks and shocks (Johnson, 2008). Even if they are affiliated to middlemen politically or otherwise, they have little incentive to work for such a low wage rate. One argument, as mentioned earlier, could be that the policy is self-selective and the non-poor might work to overcome their slack-season employment crisis (Dutta et al., 2014). This is true to a certain extent. However, the non-existence of a demand-driven system in the first place, higher participation of the non-poor than the poor and the sense of exclusion of the poor do not justify this argument. Also, winter is the peak slack season in the region when several non-poor, including a majority of the poor, are workless; however, no infrastructure or MGNREGA-type work takes places during this season in the rural areas.
The second argument could be that a poor individual might be caught in a non-poor household (Dutta et al., 2014). This is true in the case of women participation from middlemen’s households, as they are equally unemployed as any other woman of their community. However, the participation of three to six family members of a middleman and no participation from an equal or more deserving neighbouring household cannot justify the huge presence of the non-poor in MGNREGA. The third possible argument could be that the poor are self-excluding themselves due to delay in payments, as reported in some parts of India, allowing the non-poor to participate. This is nullified by the fact that there is a huge latent and under-reported demand from the poor, as reflected earlier. Moreover, it is found that those who participated in MGNREGA and needed urgent payments, middlemen provided the cash, against the people returning the amount after receiving it in their account. Many participants have even received payments through bank transfer, in some cases with little delay, but in no case this was given as the reason for lack of willingness to work in MGNREGA. A widespread feeling among the participants was that their pending money was with the government.
Besides the middlemen controlling the policy and trying to get maximum benefits to their households, the only other factor that could explain this unusual participation is a faulty wage payment system. The last 12 months’ wage structure at the local level—the statutory MGNREGA wage, the actual wage paid under MGNREGA, and the external market casual labour wage rate—shows that rarely any household was aware of or paid according to the statutory wage (Figure 4). 10 Instead, the majority were paid either equal or close to the external market rate, which was between ₹200 and ₹350 (Figure 4). This has made it an attraction for non-job-scarce/non-poor households (HHs). 11 This wage distortion is actually embedded in the ideological misinterpretation of MGNREGA by the regional administrations, most of which, at various levels of interaction, gave an impression of MGNREGA being a developmental policy rather than an SP policy. Hence, project accomplishment (asset creation), instead of delivery of entitlement (providing demand-based jobs when there is job scarcity), remains the priority. Due to consistent delays owing to poor administrative systems and conflict-related strikes, not many projects are sanctioned/completed during the beginning and middle of an FY. Hence, a lot of pressure gets built for meeting the physical targets (asset and workday generation) towards the end of every FY. This creates opportunities for the local colluded system of middlemen and bureaucrats to fulfil their political–economic interests. They do so by adopting an “Exit Theory” (Niehaus & Sukhtankar, 2013) wherein they bargain MGNREGA labour on the external market wage rate to complete projects quickly. In the backdrop of lack of proper documentation, transparency and an accountability system, middlemen bring in non-job-scarce/non-poor households, besides their families and political clients. To adjust records with the official wage rate on Management Information System (MIS), they counterfeit job cards and muster rolls by creating ghost workers and doubling the actual number of workdays. All of them get impunity within the poor transparency and accountability systems (social audits and complaint redress), which have grown under the shadow of 70 years of armed conflict and have become institutionalised.

This equalisation or bringing of MGNREGA daily wage rate (₹131) close to the external market daily wage rate (₹250–₹350) has in turn kept several poor/job-scarce households out of policy benefit, mostly at the cost of crowding out from the external labour market. Crowding out from the external labour market is explained by forgone employment reported by 45.5 per cent (Table 8), predominantly from non-poor households. Forgone work opportunity in case of MGNREGA means loss of work opportunity/income from other sources—a labourer leaving equally remunerative work in the private labour market and working under MGNREGA. The calculation is usually done by asking participants what they would have done in the absence of MGNREGA. If they say that they would have worked, then the calculation is performed by asking how many days and at what wage (Dutta et al., 2014). Sometimes, people leave hazardous, exploitative or physically challenging work and come to work in MGNREGA, which cannot be counted as forgone employment. But in the case of this study, the respondents did not report leaving any such kind of work. Instead, similar works in agriculture and/or construction in their own community or adjacent communities were reported. This diversion from equally remunerative works in construction and/or agricultural and allied labour sectors has eliminated the basic SP essence of MGNREGA. It being a safety net (last-resort job) when no other non-hazardous job is available to a rural labourer—and made it like any other government contract scheme. 12
This distortion, however, comes with huge political–economic incentives for the middlemen and bureaucrats involved. For a middleman, a great portion of project money comes home, with many family members working on sites, and/or he attains strong political clout in the community. Bureaucrats who collude in the process get fixed, project-based commissions from middlemen. Middlemen have widely reported and confirmed that block-level bureaucrats and support staff, on average, take ₹2,000 as commission for transferring the authority of a project. Every panchayat, on average, consists of seven wards, and every ward, on average, gets one project in an FY. Simply put, the average commission earning from one panchayat by just making authorities of MGNREGA projects is about ₹14,000, and this does not include other commissions paid in preparing work completion reports and final billing. This gives a glimpse of the level of personal motivation or incentives bureaucratic staff have in keeping the policy process derailed; if they actually start implementing the policy as per the guidelines, they would incur a huge loss.
Labour Market Outcomes
When a self-selective and demand-driven system is absent, the core element of the MGNREGA policy—legally guaranteed protection (employment)—does not remain relevant for discussion; instead, the policy becomes like any other non-guaranteed, top-down programme implemented within a welfare system. In this scenario, what remains important for discussion is simply the workday contribution of the policy to the labour market. This would provide a first-hand impression of the policy’s influence on the local labour market and the level of livelihood protection it has been offering to the poor and vulnerable, because the core of protective and promotive benefits offered by the policy revolve around the number of workdays it has been able to generate for a particular household.
To understand this, three indicators of household survey—average MGNREGA workdays by a household in an FY, workdays in the last 12 months and maximum workdays in any FY—have been used. 13 The results of these three indicators do not show a very profound impact of the policy on the local labour market. The average yearly workday contribution is only about 28 days, which is less than one-third of what it actually guarantees (Table 7). Similarly, the maximum number of workdays for the majority of HHs in any FY remain between 16 and 30 days (Figure 5).

At the cross-sectional level, the differences are huge, with the mean workday generation in the HPAs being 46.68, compared to 9.95 in the LPAs (Table 7). The low pre-panchayat performance in LPAs is mainly attributed to the low availability of work because of fewer interested middlemen/contractors to take up MGNREGA contracts. The results do not show any significant progress even after the election of panchayats in 2011. In the last 12 months, though outcomes are slightly progressive, non-participation is extremely high, and the number of workdays generated much less in LPAs compared to HPAs (Figure 6).
Average Yearly Workdays Contributed by MGNREGA


As far as the economic groups are concerned, across all indicators, the outcomes do not show any significant difference, as, on average, both the groups (poor and less poor/non-poor) have had a mean of 28 workdays in an FY (Table 7). Across the social groups too, the outcomes do not show any huge difference (Table 7). This shows that if any exclusion is taking place, it takes place at the entry to the policy (when a HHs has not started working in MGNREGA but is aspiring to do so). Once a particular household has become a MGNREGA participant, the distributional exclusion does not seem to be visible.
However, when we consider the forgone employment of 45 per cent, the average net workday contribution of the policy to the labour market comes further down from 28 to 16 workdays in an FY. Interestingly, the reported forgone employment is much higher (53%) among the non-poor compared to the poor (21%) HHS (Table 8). This does not mean that MGNREGA as a policy is not relevant to the local labour market, or that it does not have the potential to address the livelihood crisis of needy. Instead, it implies that had MGNREGA not been diverted from its actual path of implementation, as mentioned earlier, the participation rate and average workdays for job-scarce HHs would have been higher. Consequently, MGNREGA’s impact on the rural labour market crisis would have been higher too.
Forgone Employment (HHs Who Reported – No Job Scarcity, If MGNREGA Work Was Not Available to Them)

Why are Some Areas Low-performing?
Why labour market outcomes are poorer in some areas that otherwise fall within the same socio-economic and geographical ecosystem also needs some explanation. If the policy was demand-driven, the answer could have been found in people’s demand differences in HPAs and LPAs. An alternate data source, willingness to work under MGNREGA, also does not show much difference—96 per cent in HPAs and 92 per cent in LPAs (Table 6). This indicates that lower willingness does not lead to less work and poor performance in LPAs. The difference in average monthly external market work availability also shows similar results (Table 9). This indicates that the need for public work is equal in both HPAs and LPAs. Considering these similarities, logically, given equal chances, the work supply, targeting and labour market outcomes should have been similar in the two areas. Since there is a lack of similarity, the local political economy of the areas with MGNREGA implementation was examined, which showed some significant qualitative differences.
Average Monthly Workdays by an HH Member in the Private/External Labour Market

Interaction with the households, local leaders (formal and informal) and bureaucratic officials revealed that during the pre-panchayat period (PRPP), one factor played a role in the cross-sectional difference. There were fewer middlemen (political leaders, elites or contractors) in LPAs willing to take up MGNREGA projects. Politically, while leaders had strong affiliations, political opportunism (direct political gain) from MGNREGA implementation was not much, because panchayats had been dysfunctional over the last 35 years due to the ongoing conflict and their hope of revival was marginal. Hence, it was mainly the economic benefit that was driving local informal leaders’ interest in MGNREGA. However, even though some LPA panchayats had politically strong informal leaders, during the initial years, most of them found MGNREGA projects to be less incentive-based and having a complex documentation system, and therefore gave less attention to it.
With the election of halqa (gram) panchayats in mid-2011, some significant changes took place in the local implementation process, such as increased awareness about the existence of MGNREGA, increase in number of local leaders in the policy process and efforts to distribute work as per the number of wards in each panchayat. However, even after these changes, as shown earlier, the targeting and labour market outcomes of MGNREGA continued to be poor in LPAs compared to HPAs, the reason being that while all the elected panchayat leaders (some of whom were already acting as middlemen and some who became middlemen after getting elected) continued to prioritise their economic interests in MGREGA implementation, there were differences in the local political ecosystem. Consistent with the findings of Jha et al. (2009), there was a dominance of what can be called ‘Political Contestation’ in LPAs contrary to ‘Political Cohesion’ in HPAs. 14 In LPAs, the ruling panchayat party had a strong bias against the opposition party members and their wards. They continually excluded them from the planning of meetings and manipulated plans, with the main agenda being delivering MGNREGA and other welfare schemes as political patronage to party-affiliated wards and clients. This continuing political battle (rivalry/contestation) undermined MGNREGA implementation, through poor planning, capturing of projects, delays, recurring complaints and spillovers. Moreover, it also worked as a negative reinforcement for bureaucratic staff, resulting in their lack of interest in these panchayats, with the overall impact being poor performance—limited work availability, poor targeting and lower workday generation. In contrast, though political differences were also present in HPAs, use of political interest in social policy distribution through excluding the opposition party was rarely evident. The main reasons being either that the entire panchayat belonged to one political party or there was a very small opposition that did not report any such politically motivated exclusions. This political cohesion also worked as positive reinforcement for the bureaucratic staff, which was evident from their interactions, as they appeared to be more informed, interested and involved. The overall impact was the relatively better performance in job card provision, awareness generation, opening of bank accounts, distribution of projects beyond political relationships and timely work sanction and completion, thereby resulting in greater work supply, better targeting of the poor and higher workday generation.
Concluding Remarks and a Way Forward
In the conflict-ridden Kupwara district of J&K, the absence of a self-selective and demand-driven system and an ineffective delivery system have derailed MGNREGA from its actual path of implementation, thereby affecting its SP potential. The average yearly contribution of the policy to the local labour market is 28 workdays per household, which is less than one-third of what it guarantees. It involves a considerable amount of forgone employment, especially from non-poor households. The situation is abysmal in LPAs, compared to HPAs, due to a relatively poorer work supply, less inclusion of the poor, a higher targeting gap and the generation of fewer workdays.
The genesis of this derailed implementation system lies in the local political economy manifested at various levels: at the macro level, the wrong propagation of MGNREGA as a developmental policy among the top to bottom administrators, with a focus on infrastructure creation, rather than SP provision—aimed at providing employment when no other non-hazardous work is available and meeting subsistence needs; at the meso level, a consistent supply shortage and the government’s approach of starting and stopping projects at its own choice; and at the micro level (panchayat), distributional complexities, with policy control in the hands of a colluded system of politically biased middlemen and bureaucrats who implement MGNREGA as per their own will, with vested political–economic interests being the basis of the distribution.
Based on these outcomes, this article concludes and contributes to the broader literature on SP that it makes little difference to have a legally guaranteed, public, work-based entitlement to overcome the informal sector livelihood crisis in a fragile region when the local government’s priorities are different from the policy goals, the local implementing institutions are inadequate, poorly capacitated and politically driven, and transparency and accountability systems are invisible.
As a way forward, there is a need to streamline the agenda of the policy and overcome the political–economic constraints. In simpler terms, implementing MGNREGA as a SP policy, in accordance with its prescribed rules and institutional system. This will clarify MGNREGA’s essence and priorities across the administration and distance it from the existing colluded implementation system, thereby paving the way for greater and wider livelihood security during lean periods for the poor and disadvantaged groups.
If we look at the local contextual needs per se, there is no mismatch with the policy. MGNREGA employment has great potential to act as the employment of last resort. As reflected by the outcomes of this study, whosoever from poor and job scarce households has got a chance to work, their forgone employment is marginal, and reduction in job scarcity and livelihood related worries wider and greater (Table 10, and Figures 7 and 8). Such outcomes are relatively more visible in HPAs, with greater work supply compared to LPAs.
Reduction in Job Scarcity and Livelihood-related Worries of HHs Because of MGNREGA


Footnotes
Declaration of Conflicting Interests
The author declared no potential conflicts of interest with respect to the research, authorship and/or publication of this article.
Funding
The author received doctoral research fellowship from ICSSR.