
Abstract
This article explores longitudinal trends of healthcare financing and mortality levels among the children under 5 (U5) years of age in the BRICS nations between 2000 and 2015. This analysis is based on the relevant secondary data obtained from the WHO data repository and various other publicly available sources. Inferential statistical tools like linear regression analysis was carried out to test the relationship between dependent and independent variables. The results indicate an inverse relationship between current health expenditure and U5 child deaths, revealing a decline of 29,000 U5 child deaths and 19,000 infant deaths for every US$1increase in per capita healthcare expenditure. Further, neonatal deaths declined by 1.74% and infant deaths 2.8%, while U5 child deaths declined by 4.6% per annum. India spends lowest among the BRICS nations—about US$63 per capita, while out-of-pocket expenditure (OOPE) is highest at 69.3%. Countries with higher per capita government health expenditure have better health indicators. This article, therefore, calls for strengthening public investment in healthcare to improve health outcomes.
Introduction
Healthcare financing is the basic prerequisite for human welfare. It deals with generation, allocation and use of financial resources in the health system. An analysis of healthcare financing data begins with sound estimates of national health expenditure. According to the World Health Report (2000), the purpose of healthcare financing is to make funding available, as well as to set right financial incentives to providers to ensure that all individuals have access to effective public health and personal healthcare. Achieving Universal Health Coverage is an aspiring goal and requires commitment of countries for channelising and allocating the required resources for better health, greater equity and increased social harmony (WHO, 2017). Hence, it falls on the governments to ensure coverage to all health needs of the people, individually and collectively.
In 2015, the world spent US$7.3 trillion on health, which amounts to nearly 10% of the global gross domestic product (GDP). The share of health expenditure to GDP is greatest in high-income countries (HICs) to nearly 12% on average, while low-income countries (LICs) amounted to 7% of GDP and middle-income countries (MICs) 6% (WHO, 2018). The health sector is an important source of real economic growth globally, and particularly, in LICs and MICs. Investing in health not only leads to healthier lives but also generates employment, fosters social and political stability, drives technological innovation and contributes to higher productivity and economic output (WHO, 2016). Hence, investing in health is the basic prerequisite for economic growth and prevents productivity loss to the economy.
Between 2000 and 2015, the global health economy has grown in real terms at an average annual rate of 4.9 %compared with 2.8% in terms of the global economy. The health economy in LICs and lower-middle-income countries (LMICs) has grown even faster at more than 6% on average. The mode of healthcare financing differs across countries. Domestic finances are the dominant source of funding for health in all, except for a handful of LICs, where the share of external resources to health spending was around 30%, while, for the 50 LMICs and 57 upper-middle-income countries (UMICs), it was only 3% and less than 1%, respectively (WHO, 2017).
Higher economic growth in LICs and MICs has not reduced the gap in health spending, and global inequity in health spending has remained largely unchanged (WHO, 2018). Today, HICs with only 16% of the world’s population account for 80% of global health spending. Conversely, 76% of the world’s population live in MICs, but they account for less than 20% of global health spending. LICs, with more than half a billion population, accounted for less than 1% of the world’s health spending in 2015. The global average health spending per capita was US$1,011 with a median of only US$366. This global average conceals a very large difference between the highest and lowest spending countries, ranging from over US$9,000 to less than US$20 per capita. In 2015, close to 50 countries with a total population of 2.7 billion spent less than US$100 per capita (WHO, 2017). Government fiscal capacity, as indicated by the share of overall government spending in GDP, increased steadily between 2000 and 2015, with particular growth among LMICs and LICs. Higher per capita income has been associated with a high demand for public services as per Wagner’s law. Taking the share of domestic spending for health, the average share of health spending in general government spending for LMICs tends to be less than LICs.
India, with a population of 1.32 billion as of 2016, has a GDP of US$2.264 trillion and GDP per capita of US$1,709.4, but it has 21.9% of the population living below the poverty line at US$1.90 per day (WHO, 2017). The government is spending considerable amounts on healthcare, but it is comparatively much lower to other developing countries. In this backdrop, this study attempts to track financial resource flows in the country’s health system in comparison to other BRICS nations.
The world has paid much attention to BRICS nations as emerging economies since 2001. These are Brazil, Russian Federation, India, China and South Africa. Together, these economies account for 40% of the world’s population and 25% of the world’s GDP (Mujica et al., 2014; Wilson et. al., 2011).
A brief introduction of the health systems followed among the BRICS nations, other than India, reveals their success in improving the health outcomes. The success and quality of healthcare system in Brazil is revealed by the provision of universal preventive and curative care through decentralised management and health services for equity and long-term sustainability. China has unveiled an ambitious new healthcare reform plan, which covered more than 95% of their total population with basic insurance coverage by 2011, though out-of-pocket costs and quality of care varied significantly, but were far less than the rates in India (Palm et al., 2011; Le Deu et al., 2012). After independence from Soviet Union in 1991, the Russian Federation health system adopted Mandatory Health Insurance (MHI) model in 1993 and increased budgetary resources, which helped in focusing on the delivery of services and funding priority areas, including primary care provision in rural areas (Popovich et al., 2011; Kutzin et al., 2010), which thereby facilitated in improving the health outcomes. In 1994, when the democratic government came to power in South Africa, a single National Health System was adopted, which is based on equity and accessibility to all, with 11% of the total government budget allocated towards public health, which reflects the commitment of the government. Hence, it can be understood from the experiences of other BRICS nations that for ensuring good health and quality of care, safety of patients is essential, and revamping the financial structure of the health system is most essential. With reference to the healthcare financing among various nations, the present study takes into account the commitment of various governments among the BRICS nations towards healthcare.
Objectives
The main objective of this study is to document the pattern of healthcare financing in India and other BRICS Countries and its impact on the infant mortality and U5 mortality in these nations over a time period from 2000 to 2015 and to suggest measures to improve health financing for better health outcomes among U5 children.
Methods
Secondary data served as inputs to the survey. Comparable data on health indicators, including healthcare expenditure details and mortality rates among the BRICS nations, have been retrieved from data repository of WHO and other government and publicly available search engines. The data on General Government Health Expenditure (GHE) as proportion to GDP, private health expenditure (PHE) as percentage of current health expenditure (CHE), CHE per capita in US dollar and out-of-pocket expenditure (OOPE) as percentage of CHE were obtained from the data repository of WHO, and this study presents data in time trends during the periods of study from 2000 to 2015.
Regression analysis was modelled to assess the relationship between U5 child deaths and the time period during 2000 and 2015 among the BRICS nations. Regression analysis was also modelled between infant deaths and the periods to know the trends among the BRICS nations. Further, to assess the relationship between CHE and U5 child deaths and infant deaths with periods, linear regression analysis was modelled during the 15-year period.
Statistical Analysis
Inferential statistical tools like trend analysis and linear regression analysis were used to model the relationship between various dependent and independent variables during the period of study.
Results
Government Health Expenditure
GHE reflects government commitment towards health of the population. It can be observed (Table 1) that India is the only country with the lowest health expenditure compared to all other BRICS nations. However, to take stock of the healthcare expenditure among BRICS nations, an attempt was made to observe the expenditure details of these nations from 2000 to 2015. The amount spent on GHE in proportion to GDP is the least (1%) in India compared to other BRICS nations, which have been investing nearly 3–4% of their GDP on health compared to India.
Distribution of Government Health Expenditure in proportion to GDP Among Various Nations

Private Health Expenditure
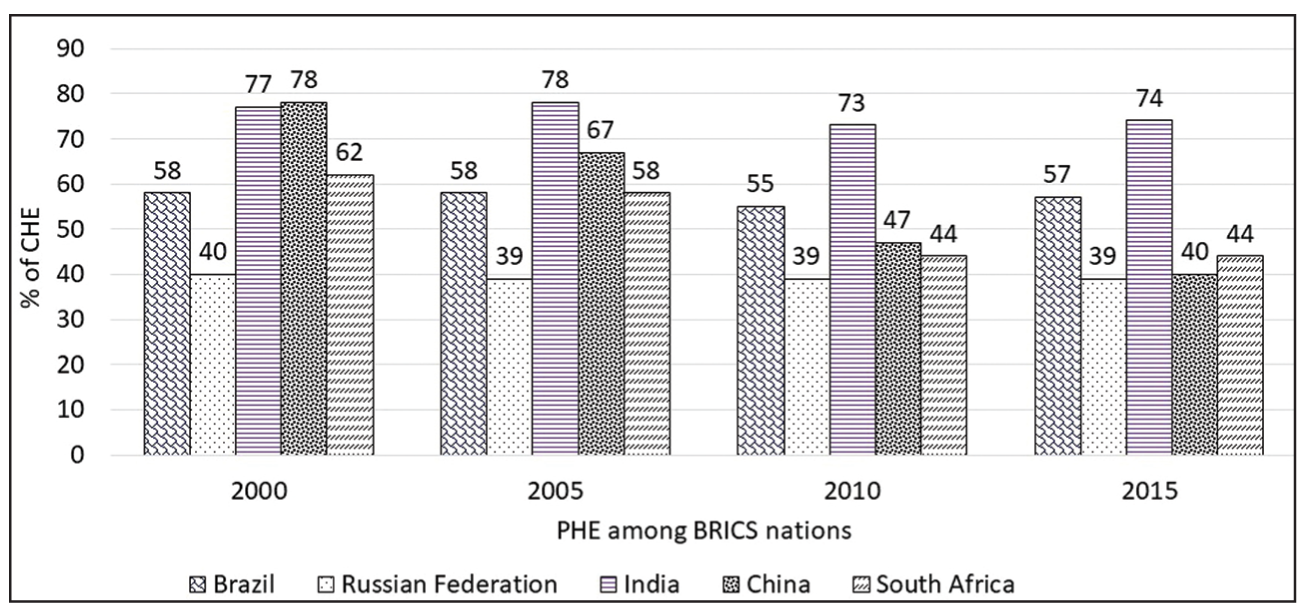
The government expenditure among the BRICS nations, apart from India, have invested in healthcare, and the involvement of PHE as a percentage of CHE has reduced to nearly 40% except for Brazil, where it is nearly 57% (as shown in Figure 1), while the PHE is 74% in India.
Current Health Expenditure
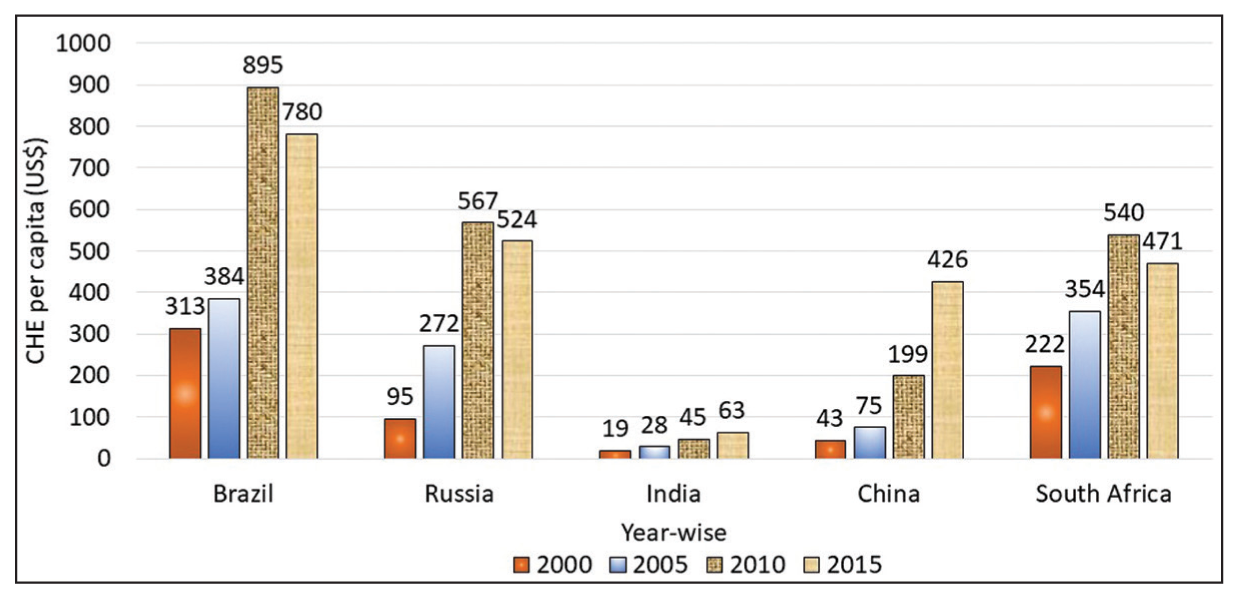
The CHE per capita in Brazil has increased from US$313 to US$780 between 2000 and 2015, while the Russian Federation has increased fourfold from US$95 to US$524. China has increased eightfold from US$43 to US$426, and South Africa increased twofold from US$222 to US$471 during the same period (Figure 2). Conversely, the CHE per capita in India has increased from US$19 to a meagre US$63, which is hitherto less to other BRICS nations. According to the WHO, the average global total health expenditure (THE) per capita is US$1,008.
Out-of-Pocket Expenditure:
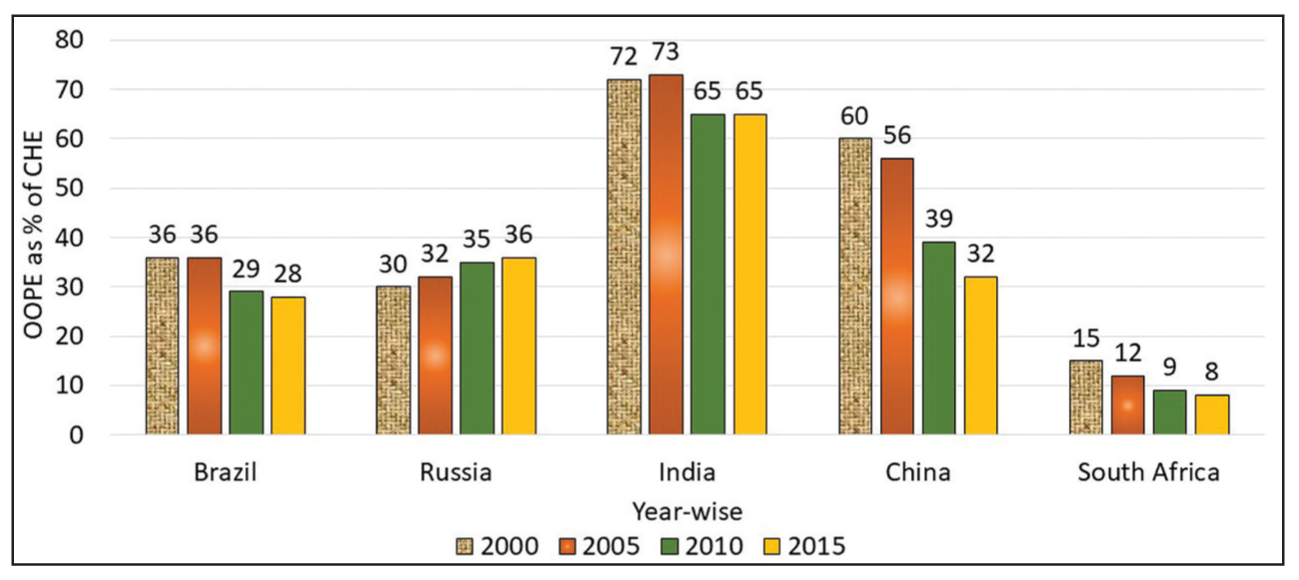
OOPE leads to financial barriers to access for the poor and for households purchasing medical goods and services, thereby leading to financial difficulties or catastrophic expenditures (WHO, 2014). Figure 3 depicts that all the BRICS nations, except India, have reduced the financial burden on the population seeking healthcare services due to illnesses. These nations have low OOPE since the year 2000, and some of them have reduced considerably between 2000 and 2015. OOPE as percentage of CHE was reduced in Brazil from 36% to 28%, while, in Russia, OOPE has increased marginally from 30% to 36%. China reduced OOPE to almost half from 60% to 32%. OOPE was found to be reduced in South Africa from 15% to 8%, while the OOPE was reduced marginally in India but still double the burden compared to other BRICS nations. In India, OOPE has decreased from 74% of CHE to 65% between 2000 and 2015, but it is still fairly high, averaging 69.3% of CHE.
Health Indicators Among the BRICS Nations
In an attempt to assess the implications of healthcare facilities on U5 children, we tried to assess the child mortality rates during the 15-year time period for assessing the health outcomes among the BRICS nations.
Under-5 Child Mortality Among BRICS Nations
The present study takes into account only the trends in mortality of U5 children during the period from 2000 to 2015. Globally, 5.6 million children under the 5-year age group died in 2016, that is, nearly 15,000 every day, and 46% of the U5 deaths were in the neonatal age (WHO, 2018). The number of U5 child deaths was the highest in India when compared to all other BRICS nations (UN IGME, 2018). When all other nations are counting deaths of children in thousands, we are counting in millions. In Brazil, the U5 child deaths in 2016 were 45,000, in Russia 14,000, China 168,000 and South Africa 51,000, while it was 1.1 million deaths per year in India (WHO, 2018). The number of U5 child deaths in India in 2015 was distressing, when compared to other BRICS nations, with majority (79%) of deaths occurring at infancy amounting to 867,000 per year. It was also observed that majority (74%) of the infant deaths, that is, 640,000 deaths per year occurred at neonatal age.
Regression Analysis
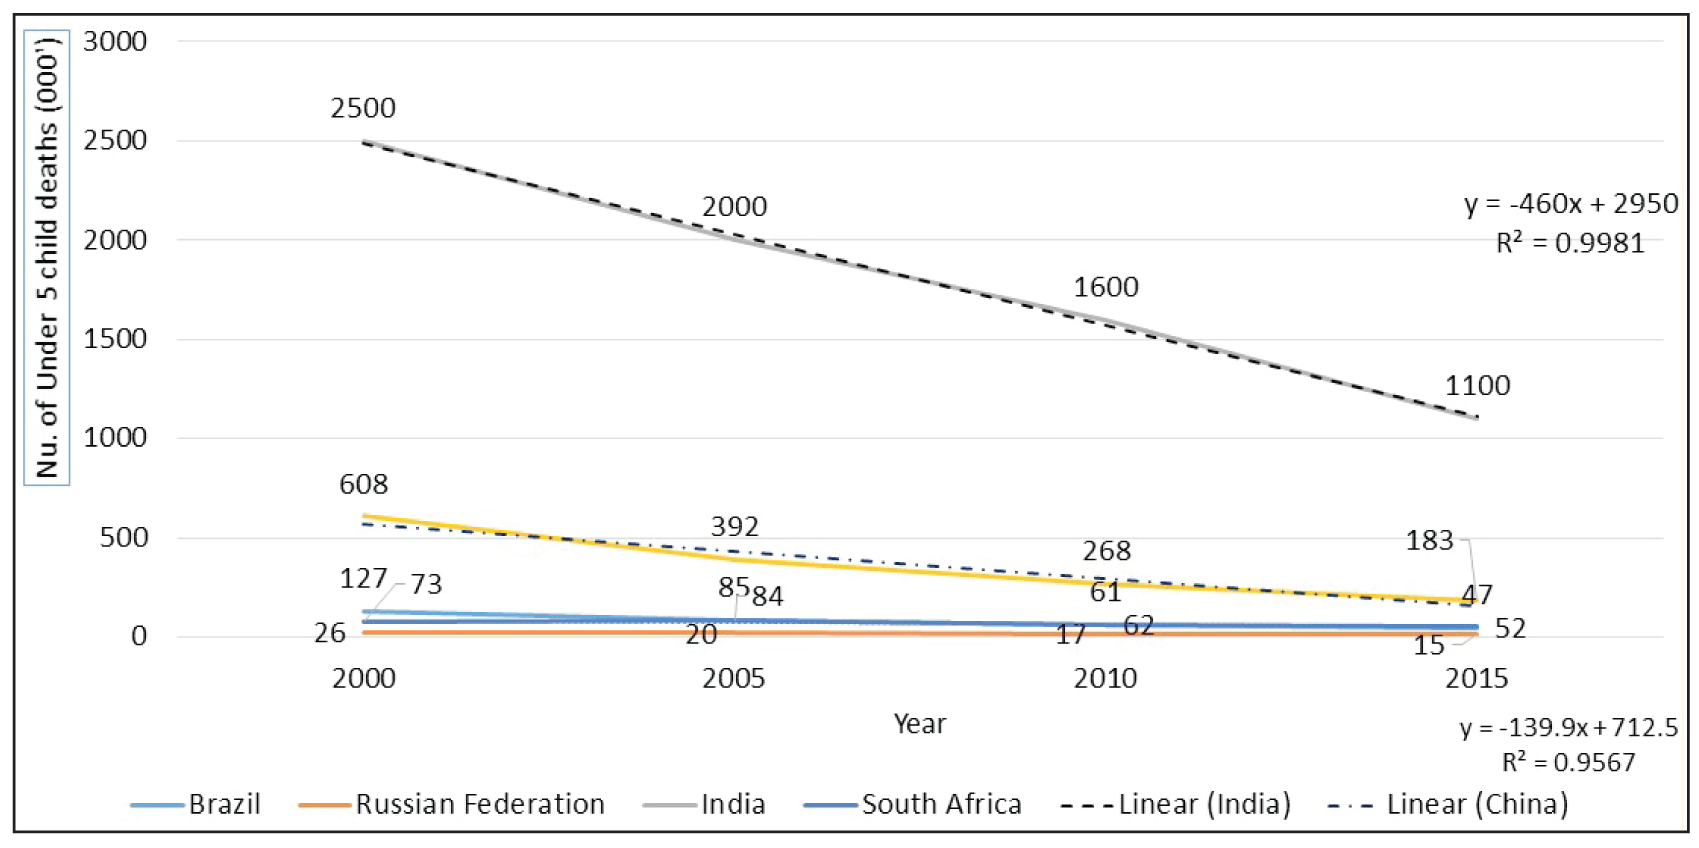
To assess the relationship between U5 child deaths with time, regression analysis was modelled (Figure 4), which reveals that U5 child deaths have been declining at 460,000 deaths for every 5 years with around 93,000 deaths per annum in India, while the U5 child deaths declined by 140,000 in China for every5 years averaging 28,000 deaths per annum during the period. On the contrary, among the other BRICS nations, U5 child deaths declined by 8,500 for every 5 years with an average of 1,700 deaths per annum. Though the number of U5 child deaths in India is declining steadily, the prevalence of high mortality compared to other BRICS nations is a cause for concern.
It has also been observed that the U5 child deaths declined by 4.6% per annum, while infant deaths declined by 2.8% and neonatal deaths by 1.74% per annum during the 15-year period. To assess the relationship further between the infant deaths and the periods, linear regression was modelled. Regression estimates (Figure 5) show that the number of infant deaths in India has declined by 59,000 deaths per annum, while infant deaths declined by 22,000 deaths per annum in China. It can be observed that the infant deaths declined by nearly 8,000 deaths per annum in Brazil, Russia and South Africa.

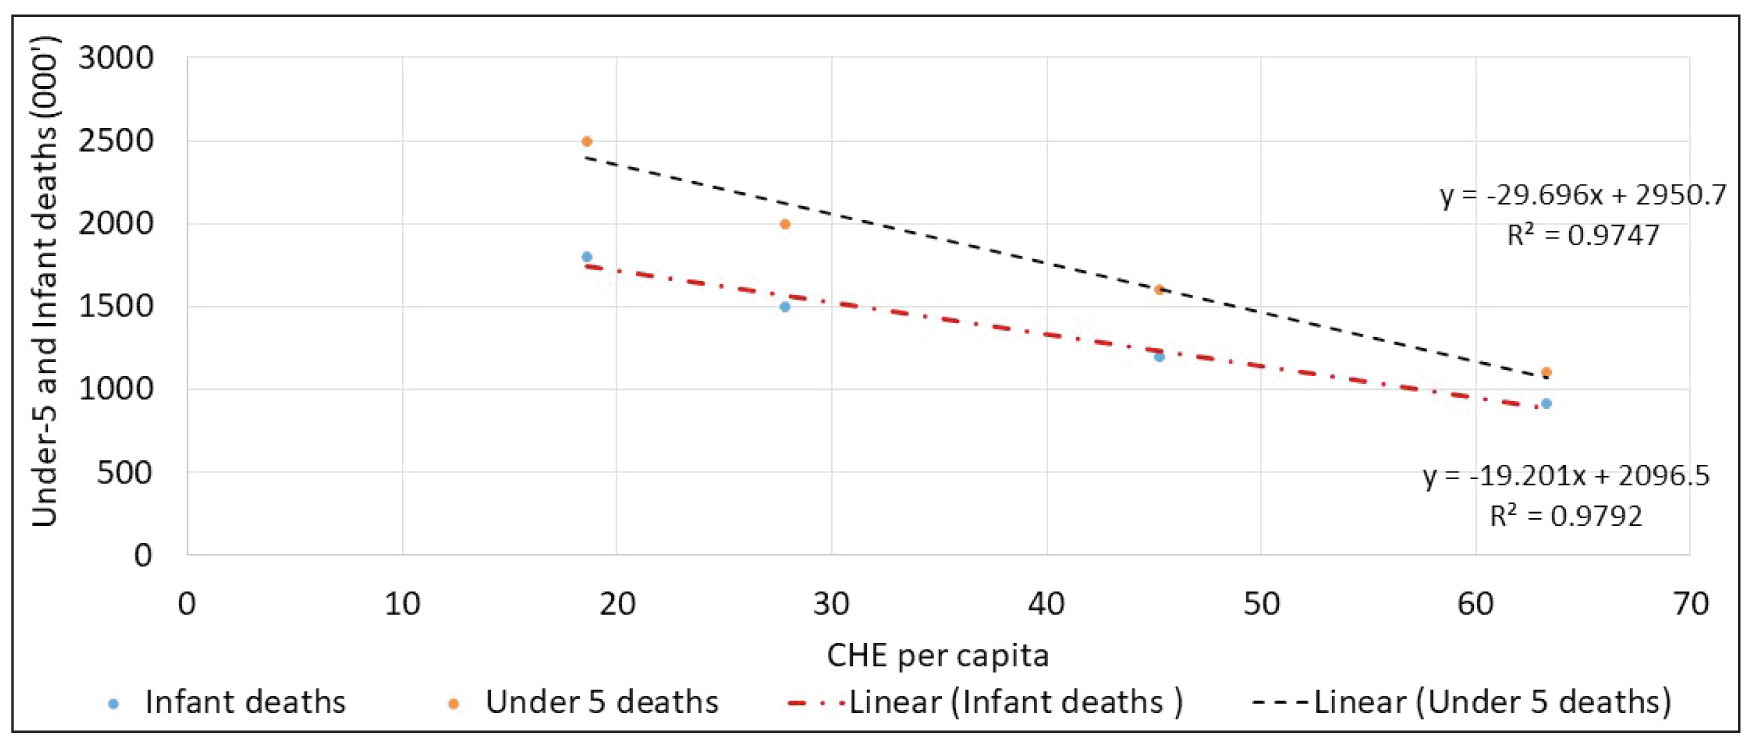
To further assess the relationship between CHE per capita on U5 child and infant deaths, linear regression was modelled, which is found to be statistically significant as shown in Figure 6. Regression model reveals that for every US$1 per capita spent, the U5 child deaths declined by 29,000, while the infant deaths declined by 19,000.
Discussion
For ensuring good health and quality of care, safety of patients is essential and revamping the financial structure towards the health system is most crucial. In the Abuja Declaration of 2001, the heads of global states committed to ensuring that 15% of overall government expenditure goes to health. This was taken as an aspirational goal, although few HICs in the world currently achieve it. While it is difficult to justify why 15% is the ideal cut-off point, many countries still devote less than 4% of GHE towards health, suggesting low levels of government commitment. Developed countries spend more than 7% in proportion to GDP towards health, while the developing Asian nations spend less than the global average but more than 2% in proportion to their GDP, which may be one of the reasons for having better health outcomes and lower mortality rates, compared to India. The GHE as a percentage of GDP is less than or equal to 1% in India during the 15-year period, while the other BRICS nations invested nearly 3–4% of their GDP on health, which shows their commitment towards mobilising the required resources for health and to reallocate and redistribute them for better health, greater equity and increased social cohesion as advocated by the WHO.
The per capita CHE by the government is also very less in India (US$63), while all the other BRICS nations have invested nearly US$500 per capita, thus revealing the commitment of the governments in improving the health of its citizens. It can be noted that India is the only country, which is spending the least, that is, 1% in proportion to the GDP, among all the BRICS nations towards healthcare. This study attempts to assess the implications of low investment in healthcare through health indicators. It is crucial to understand the implications of lack of proper healthcare facilities, which has led to the death of young infants and U5 children.
Increase in GHE would reduce the OOPE on health by households, which is 65% of the THE in India in 2015. It was observed that all the BRICS nations, except India, have reduced the financial burden on the people due to illnesses. These nations have reduced the OOPE considerably between 2000 and 2015. It can be observed that OOPE as a percentage of CHE has reduced considerably in Brazil, while OOPE has increased marginally in Russia, and China and South Africa have reduced OOPE to almost half, while the OOPE was reduced marginally in India but double the burden compared to other BRICS nations. The burden of financial expenditure for need of treatment, especially among the poor, is high in India, which may push them below poverty line (La Forgia and Nagpal, 2012). OOPE prevents people from seeking care and results in financial catastrophe (Xu et al., 2007). As per national health accounts (NHA) (2016–17) OOPE as percentage of GDP is 2.2%. The government should make all efforts to reduce the financial burden of OOPE, especially for the needy, which indicates that people approach the private hospitals more than the government hospitals due to the lack of proper services and infrastructural facilities in government hospitals and health centres, in comparison to other BRICS nations.
The implications of lack of proper healthcare facilities reflect in birth and health outcomes. Among the BRICS nations, India has the highest U5 child mortality rates, and this contributes to more than 3,000 U5 child deaths per day. To support this, per capita CHE is the least in India among the BRICS nations with a meagre US$63 per capita per annum, while the global THE per capita is US$1,008 per year. Due to the lack of accessibility and affordability of proper healthcare facilities, especially among the vulnerable sections of the society, we are not able to reduce the U5 child deaths. Though there are several causes for neonatal deaths, majority of the deaths are premature (280,532) and birth asphyxia and birth trauma (120,936) (WHO, 2018). The high rates of deaths among U5 children in India is a major cause for concern. This study also suggests that there is an inverse relationship between CHE per capita and the U5 child deaths. Regression estimates reveal that every dollar per capita invested reduces the U5 child deaths by 29,000 and infant deaths by 19,000, which underscores the impelling need for investing in healthcare facilities for improving the child survival rates.
The urgent need to improve the health indicators, which are at a devastating state in India, would be possible by increasing GHE and improving healthcare facilities at the primary, secondary and tertiary levels. All the BRICS nations have invested heavily way back and improved tremendously in health outcomes, and, now, it is high time for India to invest in healthcare for better health outcomes, which would pave the way in achieving the Sustainable Development Goals (SDG) of health for all age groups. It is crucial to note that majority of the deaths of U5 children occur at the neonatal age, which may be attributed to the lack of proper healthcare facilities after birth or lack of proper nutrition and healthcare facilities before birth. This study underscores the need to invest in health to prevent human capital loss. To reap the demographic dividend, there is the dire need for drastic increase in health expenditure from the prevailing 1% of GDP to improve the health indicators nationwide. Thus, it is imperative for the government to invest in healthcare for better health outcomes.
Conclusion and Policy Suggestions
This study brings out the comparison of India with other BRICS nations in terms of GHE, per capita health expenditure, CHE and OOPE by the people towards health, where India stands at the lowest position in terms of outcomes. Regression analysis between U5 mortality and infant deaths with time reveals the rate of decline in child mortality during the period of study. Further, linear regression was modelled between CHE and U5 mortality, which reveals that every dollar per capita invested reduces the U5 child deaths by 29,000 and infant deaths by 19,000. Thus, this analysis emphasises the need for improving health outcomes of U5 children through scaling up investments on healthcare. The U5 children mortality in India is very high as compared to other BRICS nations, and it requires immediate action.
Though the Indian government is spending thousands of millions for women and child health through various intervention programmes, the outcomes of health are still not satisfactory. The 12th Five Year Plan envisions “assured access to a defined essential range of medicines and treatment at an affordable price, which should be entirely free for a large percentage of the population”. It would be an important transition in India’s National Health strategy if it is implemented and followed. The following suggestions are imperative to the government for achieving the SDG targets within the time frame:
Investing in health not only leads to healthier lives but also generates employment, fosters social and political stability, drives technological innovation and contributes to higher productivity and economic output. As suggested by WHO (2017), total expenditure for healthcare should be at least 6% of the country’s GDP for better provision of healthcare facilities to the needy and for better health outcomes. Severe shortages of staff and supplies are constraints to healthcare and medications, especially in the government hospitals, primary health care centres and sub-centres. Increasing the GHE will improve the health facilities and reduce the OOPE of the poor people (Gudwani et al., 2012). Lack of government health infrastructure in most of the states in India is a hindrance to availability of healthcare systems. To improve the health indicators such as maternal mortality, infant mortality, nutritional status of U5 children and pregnant and lactating women, increasing GHE would help in improving the health outcomes. The returns on investment in health are estimated to be 9: 1. One extra year of life expectancy has been shown to raise GDP per capita by about 4% (WHO, 2016). Hence, increasing the investment on healthcare would pave the way to increase in GDP per capita in the long run.
More research is recommended by WHO (2013) for implementing universal health coverage—with full access to high-quality services for prevention, treatment and financial risk protection, which cannot be achieved without the evidence provided by scientific research.
Footnotes
Acknowledgements
The authors would like to acknowledge Prof R. Radhakrishna, Chairman, CESS, Hyderabad, for his suggestions on this article.
Declaration of Conflicting Interests
The authors declared no potential conflicts of interest with respect to the research, authorship and/or publication of this article.
Funding
The authors would like to thank the “TATA Trusts” for providing the financial support through facilitating research at NIN-TATA Centre of Excellence in Public Health Nutrition.