



Abstract
Structural change—reallocation of labour from lower-productivity economic activities to higher-productivity ones—is not just an important contributor to growth but is also the principal route to improvement in employment conditions in developing economies. In history, remote and recent, structural change associated with successful development has involved labour reallocation from agriculture to manufacturing and services at early stages and from agriculture and manufacturing to services at later stages. Structural change in India, however, has been and continues to be very different; even at an early stage of development, labour reallocation has occurred from agriculture to services but not to manufacturing. While this kind of structural change has contributed to growth, its effect on employment has been very weak. The pace of improvement in employment conditions has been very slow. Economic growth, consequently, has not been accompanied by commensurate development. The challenge for the future is one of enhancing the role of manufacturing in the growth process.
Introduction
Structural change—the process of reallocation of labour across economic sectors with different levels of labour productivity—is both an outcome of and a contributor to the growth process in an economy. 2 The pattern of labour reallocation derives from the pattern of growth. But labour reallocation, when it is from lower-productivity sectors to higher-productivity sectors, in turn, contributes positively to growth. This contribution, it has long been recognised, can be quite substantial in low-income economies where productivity differentials across sectors are typically large. Less well recognised and certainly less discussed is the fact that labour reallocation from lower-productivity sectors to higher-productivity sectors is also the principal route to improvement in employment conditions in low-income economies, where the employment problem manifests itself in widespread prevalence of low-productivity work and underemployment rather than in high unemployment. Since development is ‘growth with employment’, structural change has a critically important role to play in the process of development in low-income economies.
In the celebrated Lewis model, 3 a low-income economy is seen to be composed of a small modern sector, which employs a small proportion of the labour force at a high level of productivity, and a large traditional sector, which employs a large proportion of the labour force at a low level of productivity and also holds a stock of surplus labour in the form of underemployment of many of the employed workers. The process of development is then conceptualised as a process of labour transfer from the traditional sector to the modern sector, made possible by capital accumulation in the modern sector. Growth of labour productivity in the modern sector, while this could occur as a result of investment, is not really essential to the process. For, so long as there is surplus labour, labour productivity in the traditional sector remains unchanged even while some workers move to jobs in the modern sector. Even if the labour productivity in the modern sector remains unchanged, the productivity gap between the sectors remains large and stable. Thus, substantial economic growth can result purely from labour reallocation from the traditional sector to the modern sector till such time when the movement of workers out of the traditional sector is large enough to reduce surplus labour to zero. At the same time, movement of workers from low-productivity employment in the traditional sector to high-productivity employment in the modern sector improves the overall employment conditions in the economy through two routes. First, labour incomes and working conditions of those workers who move from jobs in the traditional sector to jobs in the modern sector improve. Second, the workers, who remain in the traditional sector, have work for longer time periods than before, so that underemployment declines; labour income per worker then increases even while the labour income per unit of time worked remains stable.
In the well-known Kuznets’ framework, 4 the economic sectors in a low-income economy are taken to be agriculture, with low labour productivity and large employment, and non-agriculture, with high labour productivity and small employment. Modern economic growth involves reallocation of labour from the low-productivity sector—agriculture—to the high-productivity sector—non-agriculture. Kuznets does not assume the existence of surplus labour in agriculture, nor does he seek to analyse the process of capital accumulation. He simply assumes that labour productivity is growing in both agriculture and non-agriculture though not at the same rate; it typically grows faster in non-agriculture than in agriculture even while labour steadily moves out of the latter into the former. So, labour reallocation from agriculture to non-agriculture remains growth-enhancing for a very long time. Such labour reallocation also improves the overall employment conditions in the economy both because the workers who move from agriculture to non-agriculture effectively move to better jobs and because their movement adds to productivity growth in agriculture, thereby increasing the quality of employment for the workers remaining in agriculture.
While the Lewis model has been the centrepiece of development theory, Kuznets’ framework has been widely used in empirical analysis for the simple reason that much of the available statistical data are suitable for studying Kuznets-type labour reallocation but not for studying Lewis-type labour reallocation. However, the central argument relating to labour reallocation as a source of growth is the same in the two models. Indeed, the Lewis model can be easily reformulated by treating agriculture as the traditional sector and non-agriculture as the modern sector; the Ranis-Fei model represents precisely such a reformulation (Ranis & Fei, 1961).
Detailed empirical analysis of structural change in history has yielded important insights into some key aspects of development. One such insight relates to the central role of manufacturing in economic development. Non-agriculture is a broad category that includes sectors such as manufacturing, services, construction, mining and utilities. Analysis of past experiences of today’s developed economies of Europe and North America shows that manufacturing played a key role in the growth process at early stages of development, while services played a key role at later stages. Accordingly, the structural change associated with growth involved labour reallocation from agriculture to both manufacturing and services at early stages, and from both agriculture and manufacturing to services at later stages. 5 This is the classical pattern of structural change, which has also been observed in the late developers of East Asia such as Japan, Korea, Malaysia and Taiwan. The process of structural change currently under way in China and Vietnam also conforms to the classical pattern.
The fact that the classical pattern of structural change is observed in all countries that are now developed suggests a strong linkage between this pattern and economic development. The search for the economic logic underpinning this linkage led to the formulation of what have come to be known as Kaldor’s growth laws. 6 These emphasise three special characteristics of manufacturing that enable it to play a key role in the process of development at early stages.
First, the growth of labour productivity is typically much faster in manufacturing than in agriculture or services. The main reason is that there are increasing returns to scale in manufacturing, while agriculture faces diminishing returns, and constant returns to scale prevail in services. Returns to scale in this context are to be understood as macroeconomic in nature; they are realised at the level of the sector rather than at the level of firms or farms. Thus, rising manufacturing output is associated with rising labour productivity because of growing division of labour, specialisation and skills of the workforce (the learning-by-doing effect). 7 The scope for these developments is far more limited in agriculture and services. 8 Besides, the potential for technological learning and innovation is much greater in manufacturing than in agriculture or services. Indeed, it is manufacturing that incubates technological innovations for other sectors of the economy. Thus, the growth of manufacturing also induces productivity growth in agriculture, construction and services through technology spillovers. Hence, the higher the growth of manufacturing, the higher is the overall growth of the economy.
Second, in a low-income economy, the demand for manufactures grows faster than that for agricultural products or services. One reason is that, when incomes are low, the income elasticity of demand for manufactured products is high, indeed, substantially higher than that for agricultural products or services. 9 A second reason is that, since productivity in manufacturing increases faster than in other activities, the relative price of manufactures declines with output growth, which also stimulates the growth of demand for manufactures. A third reason is that expansion of production, not just in manufacturing but also in agriculture and services, requires investment and hence investment goods, which also are manufactured goods.
A third special characteristic of manufacturing is its ability to employ relatively low-skilled labour (migrating from agriculture) at a large productivity premium. There is also the fact that growth of manufacturing stimulates growth of industries like construction and of services, including distributive trade and transport, which also employ low-skilled labour at a productivity premium. Hence, rapid growth of manufacturing induces speedy reallocation of labour out of low-productivity agriculture to high-productivity non-agriculture, which further enhances growth and rapidly improves employment conditions.
These special characteristics of manufacturing explain why it plays a key role at early stages of development. Interactions among the demand-side and the supply-side factors generate a virtuous cycle of growth in the case of manufacturing: production growth brings income growth and lower prices, which, given high income elasticity of demand, bring rapid growth of demand, which, in turn, stimulates production growth. Hence, in a low-income economy, growth of manufacturing can be both rapid and self-sustained, and it can thus be the growth engine for the aggregate economy. When the economy is open to trade with the external world, another factor can come into play. As manufactures are far more tradable than agricultural products or services, external demand can also play a more important role in stimulating production growth in manufacturing.
Thus, in low-income economies, manufacturing-led growth is the fastest feasible and brings about the fastest possible improvement in employment conditions. Things change as economies develop and incomes increase. For one thing, the income elasticity of demand for manufactures declines, while that for services increases. For another, precisely because labour productivity grows rapidly, the ability of manufacturing to absorb labour declines as growth takes place. The labour-displacing effect of productivity growth eventually outweighs its price effect on demand. So, after a certain level of development has been achieved, the services sector takes over from manufacturing the lead role in the growth process, and labour reallocation increasingly occurs from both agriculture and manufacturing to services.
From this perspective, India’s recent experience of rapid services-led growth at a rather early stage of development stands out as strangely anomalous. And the structural change that has accompanied this growth process naturally has not conformed to the classical pattern. In short, India’s experience appears to defy Kaldor’s growth laws and hence raises many questions. What explains India’s unusual growth experience? In what ways does the structural change in India’s economy differ from the classical pattern? To what extent does this non-classical structural change contribute to development? These are the questions that we seek to answer in this article.
The structure of this article is as follows. In the second section, we examine in some detail the classical pattern of structural change. We then consider, in the third section, the relevance of two currently dominant narratives about structural change in the late developers, one of which suggests that the classical route to development through industrialisation is no longer available to today’s low-income economies, and the other suggests that a new route through services-led growth has now opened up. In the fourth section, we analyse the pattern of structural change associated with the services-led growth in India and contrast this with the contemporaneous classical pattern of structural change associated with the manufacturing-led growth in China to highlight the distinctiveness of India’s experience. The final section presents the main conclusions.
The primary sources of data used in the study are the two databases developed and maintained by the Growth and Development Centre (GGDC) of the University of Groningen—the 10-Sector Database and the Historical Statistics Database. 10 Historical statistics is also drawn from certain other sources, which are cited at appropriate places. The data for India are drawn from the national sources: Central Statistical Organisation (CSO) for National Accounts Statistics and National Sample Survey Organisation (NSSO) surveys of employment and unemployment statistics for employment.
The Classical Pattern of Structural Change
Analysis of past experiences of economic development yields four important stylised facts about the structure of low-income economies and its evolution in the course of development. 11 A first stylised fact is that, at low levels of per capita income, a very large part of the working population is engaged in agriculture, a small part is engaged in services and an even smaller part is engaged in manufacturing. These features characterised today’s developed economies in the years prior to the onset of modern economic growth as much as today’s developing economies in the 1950s and the 1960s.
A second stylised fact is that, at low levels of per capita income, output per worker is lowest in agriculture and highest in services. Again, these features characterised today’s developed economies at early stages of their development as much as today’s developing economies in the recent past. It should be said here that labour productivity is a meaningful notion only in some of the services. In the case of services such as distributive trade, transport, communication and information technology, output can be, and usually is, measured independently of input so that labour productivity can be meaningfully measured. But in the case of services such as public administration and defence, health, education and professional services, output cannot be measured independently of input so that the measured labour productivity is nothing other than the average salary or income earned by the persons engaged. Then, there are services (e.g., financial services) in the case of which output can, in principle, be measured independently of input but often proves difficult to do so in practice. On the whole, comparing labour productivity in services with that in agriculture or manufacturing is a bit like comparing apples with oranges. Fortunately, the measured labour productivity still reflects the labour income in both sectors. So, we can legitimately say that, at low levels of per capita income, labour income per worker is highest in services, lowest in agriculture and somewhere in the middle in manufacturing. 12 We can also say that labour reallocation from agriculture into manufacturing and services—indeed, into non-agriculture, in general—improves employment conditions.
A third stylised fact relates to the process of labour reallocation in the course of development. As growth occurs and the per capita income rises, the employment share of agriculture steadily declines, the employment share of manufacturing moves along an inverted U-shaped trajectory and the employment share of services steadily increases. These tendencies are well illustrated by the pattern of change observed in a selection of today’s developed economies: the UK, the USA, Netherlands and France (see Ghose, 2020). In all of these countries, which developed in the second half of the nineteenth century and the first half of the twentieth century, the employment share of agriculture persistently declined over time and that of services persistently increased. The employment share of manufacturing first increased up to a point and then started to decline; industrialisation was followed by de-industrialisation. Through the phases, population, employment and per capita income were all increasing in all of them. The trends continued through the second half of the twentieth century and early twenty-first century. At the end of the period, the employment share of agriculture was minuscule (2–3%), and services accounted for a very large part (around 80%) of total employment in all of them.
It is worth noting that the employment share of manufacturing had reached its peak at different points of time in different countries—in the UK in 1871, in the USA in 1920, in Netherlands in 1920 and in France in 1931—and at different levels of per capita income (measured in 2011 international $)—US$5,684 in the UK, US$8,485 in the USA, US$7,593 in the Netherlands and US$6,967 in France. The peak employment share of manufacturing was also somewhat different in different countries: 34% in the UK, 28% in the USA, 26% in the Netherlands and 27% in France. The generalisable fact is that, in each of the countries, the employment share of manufacturing climbed to a fairly high level (25% or more) before beginning to decline.
The classical pattern of structural change was very much in evidence in several East Asian economies that developed in the post-war period. The pattern of change observed in two of them—Japan and South Korea—provide good illustrative examples (see Ghose, 2020). The process of change had begun in the pre-war period in Japan (but it was still a low-income economy in 1950), and the employment share of manufacturing peaked in the early 1970s. In South Korea, the process of change began only in the early 1960s, and the employment share of manufacturing peaked in the late 1980s. The peak shares in the two economies were somewhat different: 25% in Japan and 28% in South Korea. The per capita income (measured in 2011 international $) at which the employment share of manufacturing reached its peak—US$17,993 in Japan and US$10,509 in South Korea—was significantly higher than what it had been in the early developers.
A fourth stylised fact is that as growth occurred, labour productivity increased in all economic sectors, but at different rates. It always increased more rapidly in manufacturing than in services (see Ghose, 2020). Thus, labour productivity in manufacturing, much lower than that in services to begin with, caught up with and exceeded that in services as the economy developed. We observe this pattern in both the early developers and the late developers. On the other hand, productivity growth in agriculture, which reflected the combined effect of capital accumulation, technological change and decelerating employment growth, was faster than the productivity growth in manufacturing in the early developers, but it was slower in the late developers. In all cases, however, labour productivity in agriculture remained lower than that in manufacturing.
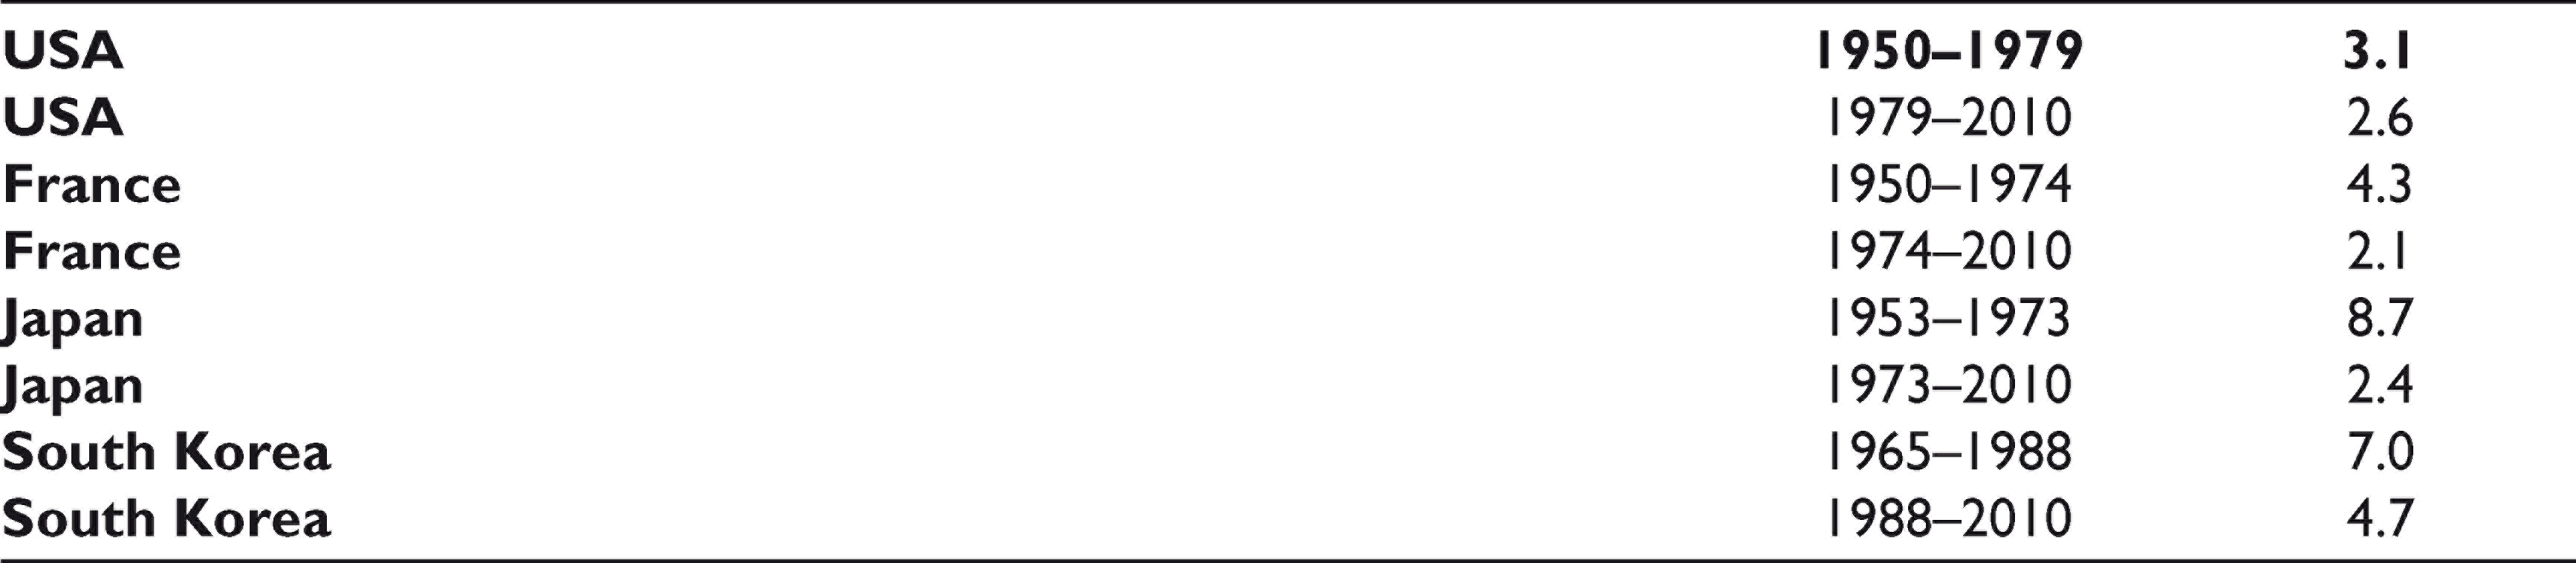
One consequence of these patterns of productivity growth is that economic growth slows down when labour begins to move out of manufacturing into services. For, labour reallocation then occurs from a higher-productivity and more dynamic sector to a lower-productivity and less dynamic sector so that structural change becomes growth-reducing. 13 The effect is countered to an extent by simultaneous reallocation of labour from agriculture to services (since this continues to mean movement from a lower-productivity sector to a higher-productivity sector), but only for a while, because the scale of such reallocation declines into insignificance rather quickly. Some evidence on growth slowdown is presented in Table 1, in which the periodisation reflects the transition from ‘labour reallocation from agriculture to manufacturing and services’ to ‘labour reallocation from agriculture and manufacturing to services’.
Growth (% p.a.) of Real GDP
Structural Change in the Late Developers: Two Current Narratives
Premature De-industrialisation
The low-income economies of today, according to a currently dominant narrative, are faced with the prospect of premature de-industrialisation; the peak employment share of manufacturing in these economies will inevitably be significantly lower than it had been in the early developers and will, moreover, be reached at a much lower level of per capita income. 14 In other words, industrialisation can no longer be the route to development for today’s low-income economies as it once had been for today’s high-income economies.
The narrative is based on empirical evidence rather than theoretical reasoning. As such, it appears odd in view of the fact that there are quite a few instances of low-income economies achieving development through industrialisation in recent periods. We know that the peak employment share of manufacturing in South Korea (a late developer) was as high as that in the USA or France (both early developers), and also that the per capita income associated with the peak was higher in South Korea than it had been in the USA or France. And South Korea is not the only low-income country to have had this experience in recent times; there are several others (as we shall see later).
On close scrutiny, it turns out that the thesis about the inevitability of premature de-industrialisation in the late developers has been derived from a flawed reading of a certain kind of empirical evidence, which is constructed by pooling together data on employment share of manufacturing and per capita income for relatively recent periods from all types of countries—countries that industrialised long ago and have been de-industrialising since the 1950s, countries that industrialised during the period from 1960 to 1990 and have since been de-industrialising, countries that are currently industrialising and countries that have not even begun to industrialise (see Amirapu & Subramanian, 2015; Felipe et al., 2018; Rodrik, 2016). A cross-sectional view of the observed employment (or GDP) share of manufacturing and per capita income for this set of countries in any given period only tells us about the highest share observed in that period (which is not necessarily the historical peak share for the country concerned) and the level of per capita income associated with that share.
It is not difficult to see that in any year of the period from 1950 to 1975, the highest employment (GDP) share of manufacturing would be observed in one of the developed countries, that is, in one of the early developers. In these early developers, though the peak employment share of manufacturing had been attained in the first half of the twentieth century when their per capita incomes were in fact quite low, de-industrialisation was a very slow process stretched over a long period (during which their per capita incomes were steadily growing) and gathered speed only after 1975. In the UK, for example, the employment share of manufacturing reached its peak of 34% in 1871 when its per capita GDP (in 2011 international $) was just US$5,864, declined very slowly to 31% in 1971 when the per capita GDP was US$17,101 and then declined rapidly to just 10% in 2009 when the per capita GDP was US$34,338. 15 The developing countries began to industrialise only in the 1960s, and only some of them succeeded. A cross-sectional view of employment shares of manufacturing in the 1980s or the 1990s (when de-industrialisation had advanced in the high-income countries, and some low-income countries had made substantial progress towards industrialisation) for the same set of countries would show the highest employment share to be associated with a late developer, which would be smaller than that observed for the earlier period. For the same reason, the per capita GDP associated with the highest share would be observed to be lower for the latter period than for the earlier period. These are perfectly predictable results. They cannot be interpreted to mean that both the peak employment share of manufacturing and the per capita income associated with this peak have been steadily declining over time and will inevitably be lower in today’s low-income countries in the future than they had been in the early developers in the past.
A careful reading of the evidence on country experiences actually tells a rather different story. 16 A large number of the low-income economies—Ethiopia, Kenya, Malawi, Nigeria, Senegal, Tanzania and Zambia are some of the examples—are yet to begin to industrialise. There are some countries—Bolivia, Colombia, Egypt, Ghana, Indonesia, Morocco, Peru and the Philippines are the most prominent examples—that can be said to have experienced premature de-industrialisation; the peak employment share of manufacturing was low (15% or less), and the level of per capita income at which the peak had been reached was also low (mostly below US$5,000 in 2011 international $). Then, there are countries—Brazil, Chile, Costa Rica, Mexico and South Africa are examples—that did experience early de-industrialisation, but this was not unambiguously premature; the peak share of employment was relatively low (around 20%), but the level of per capita income at which the peak was reached was not low (US$8,000 or more in 2011 international $). There also are late developers—Argentina, Japan, South Korea, Malaysia, Mauritius and Taiwan being the most prominent examples—that have experienced natural de-industrialisation; the peak employment share of manufacturing in these countries was as high as it had been in the early developers, and this peak was, in fact, reached at a level of per capita GDP that was significantly higher than it had been in the early developers. Then, there are countries—China and Vietnam are the most prominent examples—that are currently industrialising; in these countries, the peak employment share of manufacturing is yet to be reached. This evidence provides no basis for arguing that the late developers are fated to experience premature de-industrialisation regardless of their resource endowments and policies.
There is a recent finding that, in the global economy, the employment and GDP shares of manufacturing remained quite stable over a period of four decades (1970–2010). 17 Underlying this stability was a process of redistribution of manufacturing employment and output from the developed to the developing world. While the developed countries were de-industrialising, some of the developing economies (basically those in East Asia) were industrialising at a rapid pace. This evidence seems to suggest that only some of the low-income countries can industrialise at a time. However, we can legitimately ask: was the observed stability of employment and output shares of manufacturing inevitable or does this perhaps simply reflect the failure of many low-income economies to industrialise? There surely is no iron law that imposes strict limits to employment and GDP shares of manufacturing in the global economy. The evidence points to a need to investigate why many of the low-income economies experienced non-industrialisation or premature de-industrialisation. 18
Another recent finding is that there is unconditional (i.e., regardless of differences in geography, policies and institutions) convergence of labour productivity in manufacturing across countries, while there is no convergence of labour productivity in agriculture or in services or in the aggregate economy (see Duarte & Restuccia, 2010; Felipe et al., 2018; Rodrik, 2013). This means that the growth of labour productivity in manufacturing (and in manufacturing alone) is faster in today’s low-income countries than in today’s high-income countries. Since the growth of labour productivity in manufacturing was accelerating over time in today’s high-income countries, it follows that this growth is much faster in today’s low-income countries than it was in today’s high-income counties during the period of their industrialisation. An implication is that the employment share of manufacturing can be expected to reach its peak in a much shorter time period in the late developers than it did in the early developers. In Japan, the employment share of manufacturing increased from 9% to its peak of 25% over a period of 83 years; in South Korea, this share increased from 10% to its peak of 28% in just 23 years. It is also to be expected that de-industrialisation will be a far faster process in the late developers than it had been in the early developers. In the UK, the employment share of manufacturing declined from 34% to 31% over a period of 100 years; in South Korea this share declined from 28% to 18% in 22 years.
But does unconditional convergence of productivity in manufacturing suggest that the peak employment share of manufacturing will be lower and will be reached at a lower level of per capita income in the late industrialisers than was the case in the early industrialisers? The answer is: we cannot tell. Theoretically, the overall effect of faster productivity growth in manufacturing than in other sectors on employment in manufacturing is ambiguous. On the one hand, less labour is required to produce a given volume of manufacturing output. On the other hand, the relative price of manufactures vis-à-vis agricultural products and services declines, which stimulates the demand for manufactures, thereby increasing the volume of output. Ceteris paribus, the employment share of manufacturing will continue to rise so long as the demand-creating effect of lower prices outweighs the labour-saving effect of productivity growth. Besides, the growth of demand for manufactures derives not just from decline in relative prices but also from growth of income in the domestic economy and growth of net exports (positive trade balance in manufactured goods). So, the employment share of manufacturing will continue to grow as long as the combined effect of declining relative prices, growing incomes and changing trade balance on the demand for manufactured goods outweighs the labour-saving effect of productivity growth. Eventually, of course, a point is reached at which the demand growth, and hence the output growth, begins to fall short of the productivity growth. The employment share of manufacturing will then have reached its peak, and de-industrialisation will begin. Whether or not this peak will be lower than what it had been in the early industrialisers cannot be known a priori.
What can be said with a measure of certitude is that if the peak employment share of manufacturing is to be as high in the late industrialisers as it had been in the early industrialisers, the associated GDP share of manufacturing will have to be significantly higher in the former than it had been in the latter. This follows from the fact that the gap in labour productivity growth between manufacturing and the rest of the economy tends to be larger in the late industrialisers than it had been in the early industrialisers. For the very same reason, however, a given level of GDP share of manufacturing will be associated with a lower per capita GDP in the late developers than it had been in the early developers. 19 Thus, once again, we cannot know a priori if the peak employment share of manufacturing will be reached at a relatively low per capita GDP.
What emerges from this discussion is that there are no strong grounds for arguing that today’s low-income economies cannot hope to achieve manufacturing-led development. 20 The characteristics of manufacturing that made it the growth engine for low-income economies in the past—rapid productivity growth, high income elasticity of demand for products, high tradability of products and ability to employ relatively low-skilled labour moving out of agriculture at a large productivity premium—still remain very much relevant. The fact that many low-income economies have experienced non-industrialisation or premature de-industrialisation does not tell us that the time-tested route to development no longer exists.
Premature Services-led Growth
Another in-vogue narrative is that, unlike in the past, services can be the engine of growth in low-income economies of today. This seemingly complements the one discussed earlier (that industrialisation can no longer be the route to development) by suggesting that a new route to development through services has now become available. The narrative has emerged essentially from efforts to make sense of India’s premature (and hence intriguing) services-led growth of recent years, premature because it has come at a rather early stage of development, without being preceded by a phase of manufacturing-led growth.
The main argument that is made in support of the proposition is that recent advances in digital technology have transformed certain services, which have now acquired at least some of the characteristics of manufacturing. Information technology, communication, financial and business services now enjoy increasing returns to scale in production and also are highly tradable. Indeed, trade in these services is now growing faster than trade in goods (cf. Loungani et al., 2017; Wood, 2017). In these circumstances, it is claimed that services can lead the growth process in low-income economies of today just as well as manufacturing did in the early developers (cf. Amirapu & Subramanian, 2015; Dasgupta & Singh, 2005, 2007).
That certain digitally transformed services have now become more like manufacturing is not in doubt. But we can hardly deduce from this that low-income economies can now develop by producing and exporting these services. In the first place, we have little reason to believe that low-income economies, given their resource endowments, have the capacity to produce these transformed services, which are highly skill- and technology-intensive, on any substantive scale. Second, it is hard to imagine that the income elasticity of demand for such services can be as high as that for manufactures at low levels of income. In other words, we do not have good reasons to expect the domestic demand for these services to grow as rapidly as the domestic demand for manufactures in low-income economies. Third, it is not obvious that a low-income economy can achieve a positive and sizeable trade balance in these skill-intensive services (in which they cannot have a comparative advantage). Finally, unlike manufacturing, the digitally transformed services simply cannot employ the low-skilled labour migrating from agriculture at a large productivity premium; sustained services–led growth, even if this were possible, is most unlikely to bring substantive improvement in employment conditions.
Thus, it is hard to see how services-led growth can be regarded as the new route to development for today’s low-income economies. It is not much of a surprise that, to this day, India remains the only low-income country to have achieved rapid services-led growth for a couple of decades. Moreover, even India’s services-led growth, on close scrutiny, shows up to have been somewhat fortuitous, an outcome of the confluence of special circumstances. 21 And this growth has not brought substantial improvement in employment conditions in the country (as we shall see in the next section).
What explains India’s premature services-led growth? At first sight, growth does seem to have been driven by the digitally transformed services (information technology, communication, financial and business services). The share of these services in total services output increased from 13% in 1994 to 18% in 2000 and then to 30% in 2012; their share in GDP increased from 6% in 1994 to 8% in 2000 and then to18% in 2012. 22 In the period since 2000, the trade balance in these services has also been significantly positive; as a share of GDP, the trade balance increased from 0.7% in 2000 to 3% in 2012. So, it looks like India’s growth has been export-led, except that the export items have been skill-intensive services rather than labour-intensive manufactures.
As we dig deeper, however, things begin to look different. The trade balance has been positive and significant only for software services, which accounted for less than 18% of total services output in 2012. The trade balance in the other digitally transformed services (accounting for about 12% of total services output in 2012) has generally been negative. So, only the growth of software services has been export-oriented; the growth of the transformed services other than software services has actually been supported by the growth of domestic demand. Moreover, the growth of non-traded services, which account for bulk of the services output (70% in 2012), has also been rapid, though somewhat less rapid than the growth of the transformed services. It is clear that the rapid growth of services has been driven largely by domestic demand. 23
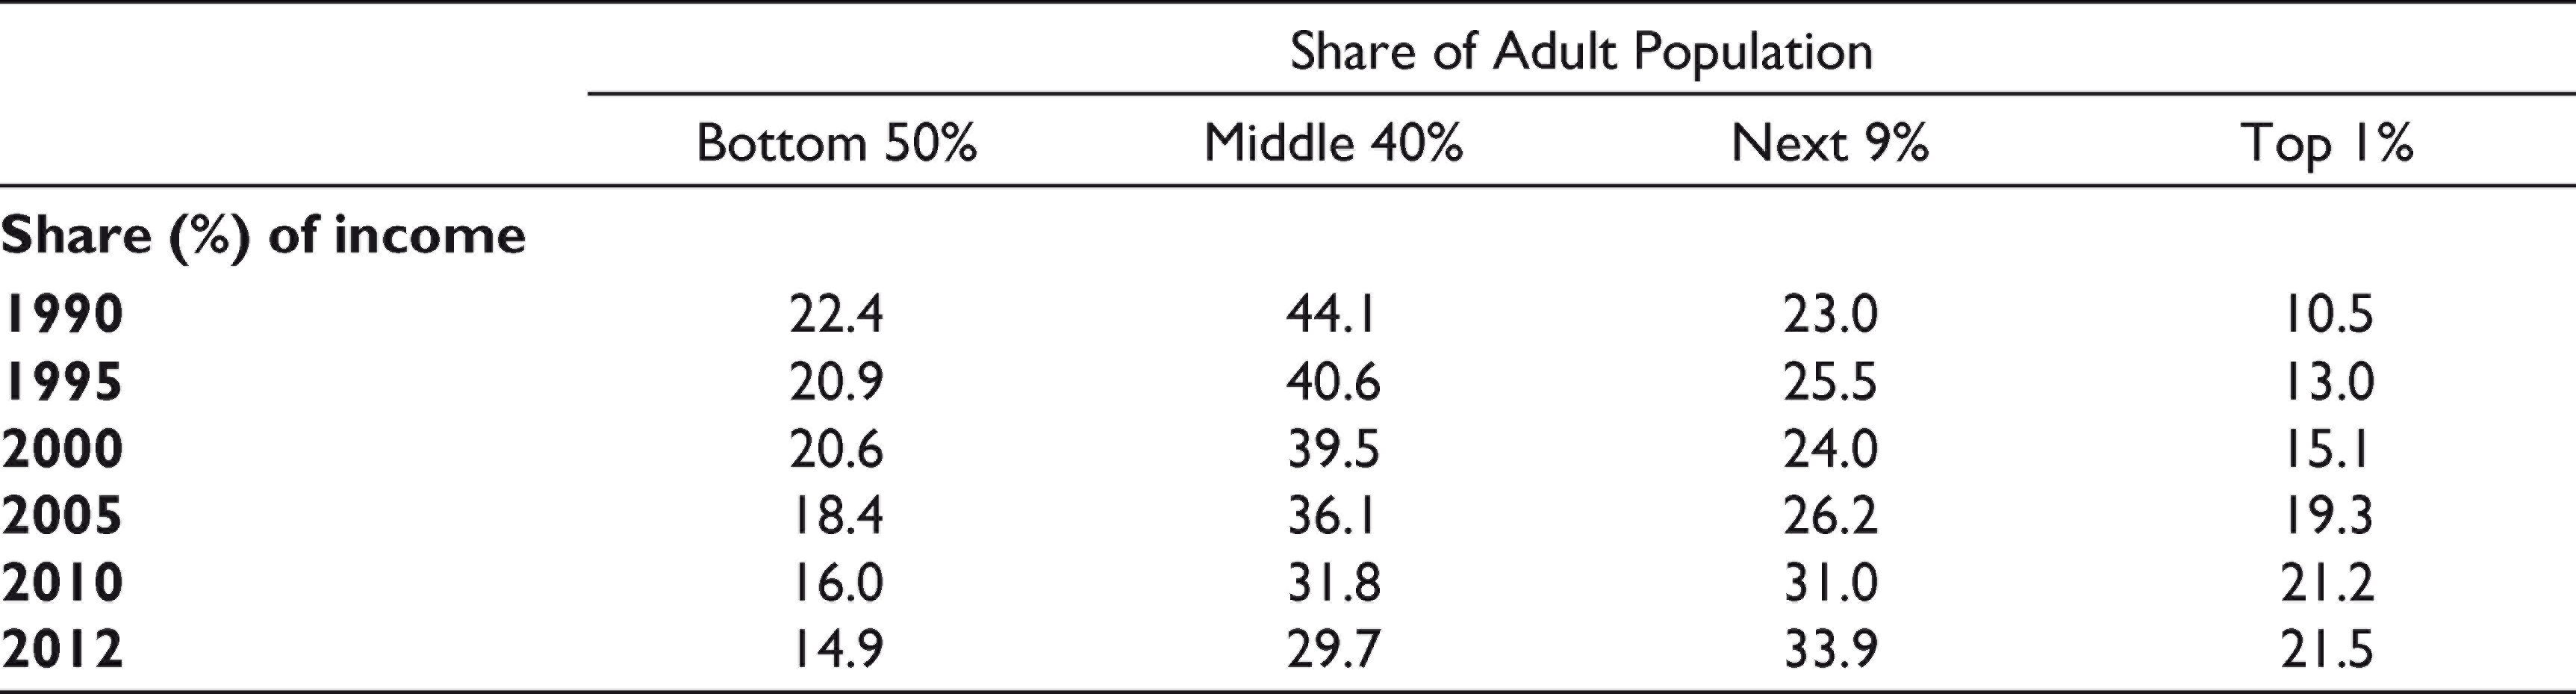
It is this rapid growth of domestic demand for services of all kinds in an economy like India’s that appears rather puzzling. For, it suggests that the income elasticity of demand for services in India is, in fact, much higher than that for manufactures even though the per capita income is still rather low. Indeed, the available evidence shows the income elasticity of demand for services is significantly greater than unity. 24 But how is this to be explained? The only sensible answer is by the rapidly growing income inequality that has been a prominent feature of India’s economy in the post-1990 period (see Table 2), which was also the period of rapid services-led growth. It was the spectacularly growing concentration of income at the hands of the richest 10% of India’s population that was driving the growth of domestic demand for services. 25 To explain India’s services-led growth, therefore, we need to explain this spectacularly rising income inequality.
Trends in Income Distribution
The obvious proximate cause of the rapidly rising income inequality is that much of the incremental income was generated in a few skill-intensive services that engaged a few highly educated persons who came from already rich households. 26 But income growth in these services was driven largely by external transfers in the form of financial inflows (both foreign direct investment—FDI and non-FDI), much of which initially went into them. 27 Later, as the growing inequality began to create demand for non-traded services, bulk of the inflows went not just into the digitally transformed services but also into non-traded services, which were also being transformed (shopping malls, supermarkets, multiplexes, e-commerce, luxury hotels and restaurants, luxury housing, commercial complexes, private education and healthcare, etc.), making them incrementally skill-intensive. 28 The inflows grew rapidly in the 2000s. 29 This is explained by three factors. First, there was a global surge in cross-border financial flows in the early 2000s, and India became a favoured destination as it was perceived as a potentially fast-growing large economy. Second, trade in skill-intensive services was growing rapidly. Third, unusually for a low-income country, India had a relatively large pool of high-skilled workers available for employment at wages relatively low by developed country standards but high by Indian standards.
Financial inflows generated something like a virtuous circle of growth. By concentrating incremental incomes at the hands of the richest 10% of the population, the flows ensured rapid growth of demand for services, in general, and for high-end manufactured goods. By generating credit boom in the domestic economy, the flows helped bring the supply response. And by making foreign exchange available, the flows eased imports. This was necessary because services-led growth had created a growing imbalance between domestic demand for and supply of goods (including manufactures). Growth was associated with rapidly growing deficit in goods trade. 30
This brief (and, of course, incomplete) account of India’s premature services-led growth is intended to underline its distinctiveness. It has not been the kind of growth envisaged by those who argue that services-led growth is the new route to development for low-income economies. And it has not been the kind of growth that many other low-income economies could conceivably replicate. Even the sustainability of India’s growth, which has been contingent upon inflows of foreign finance and consumer demand of the richest 10% of the population, is not assured. 31 And even rapid services-led growth does not bring substantive improvement in employment conditions, as the Indian experience shows.
Services-led growth is not the new route to development for low-income economies of today.
Structural Change and Development: The India Story
The Pace and Pattern of Structural Change
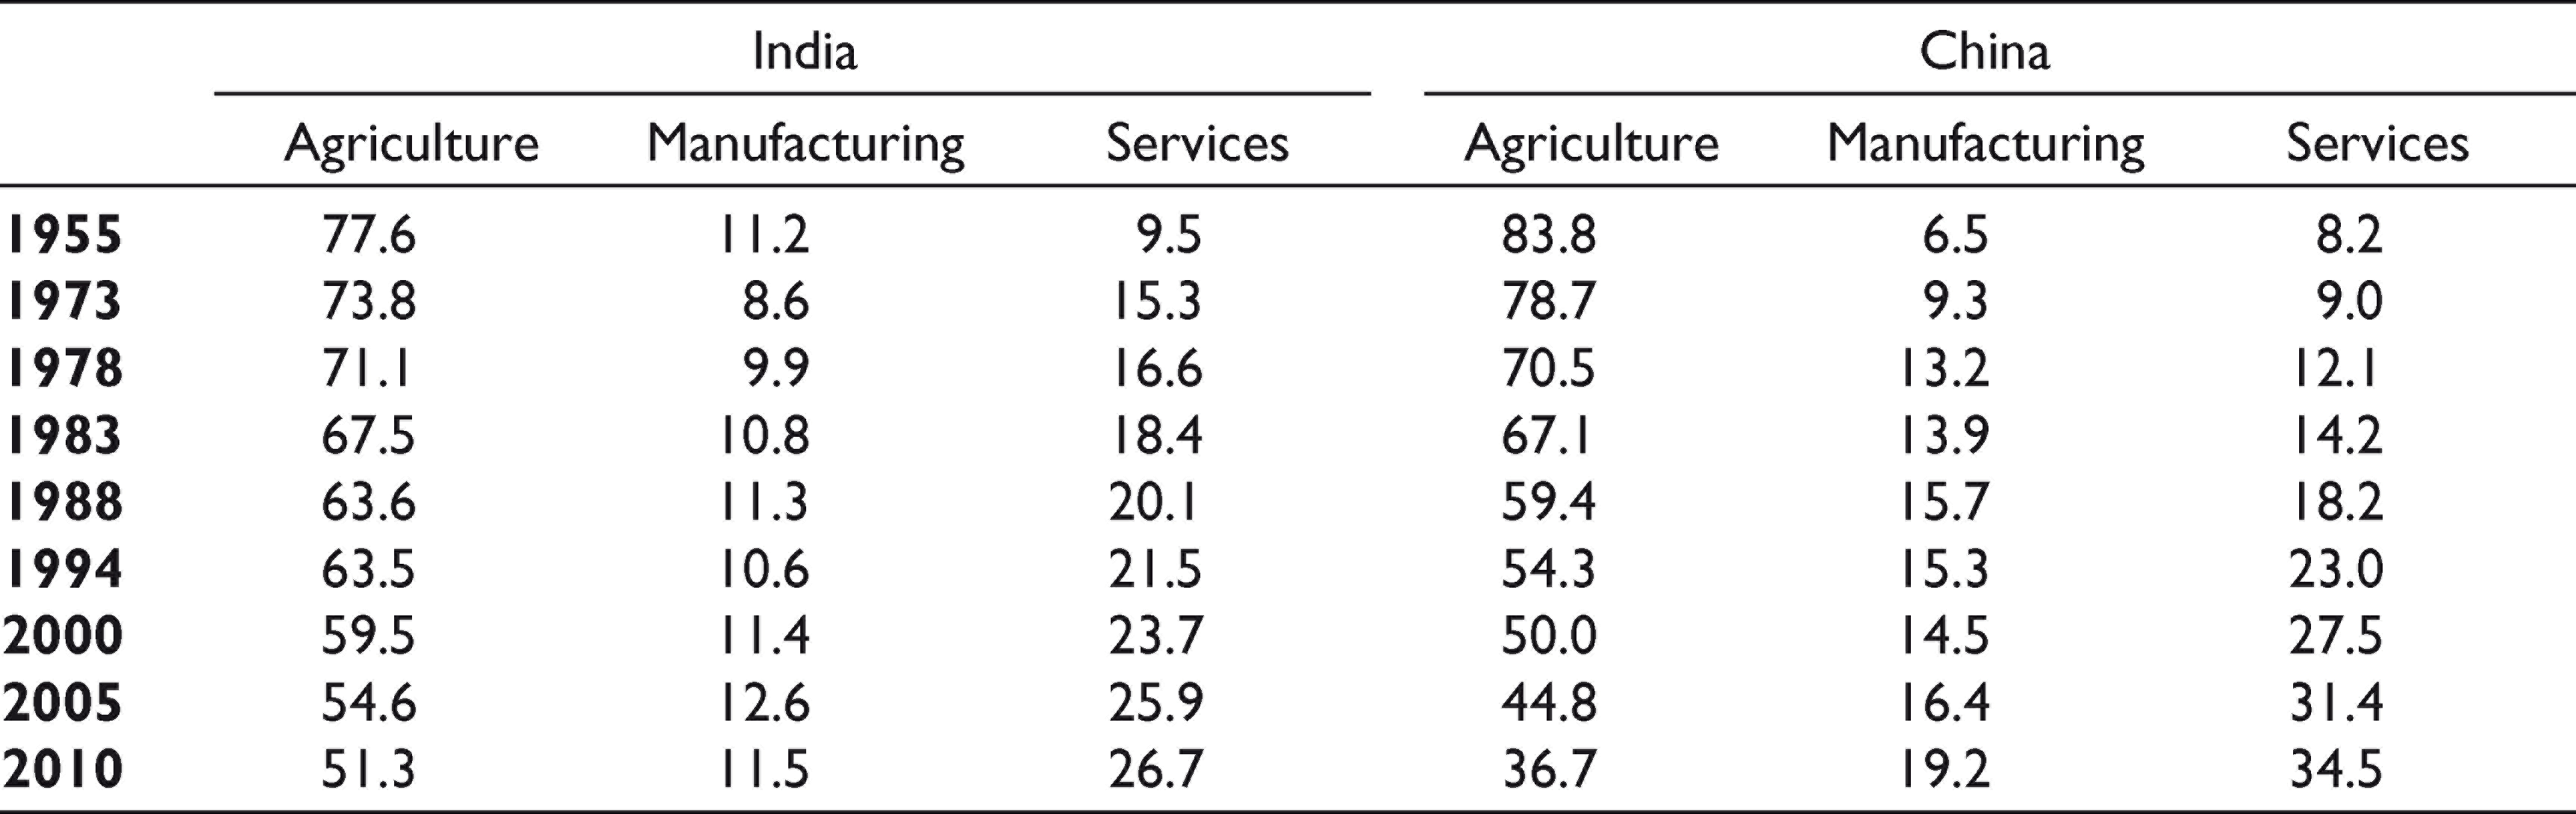
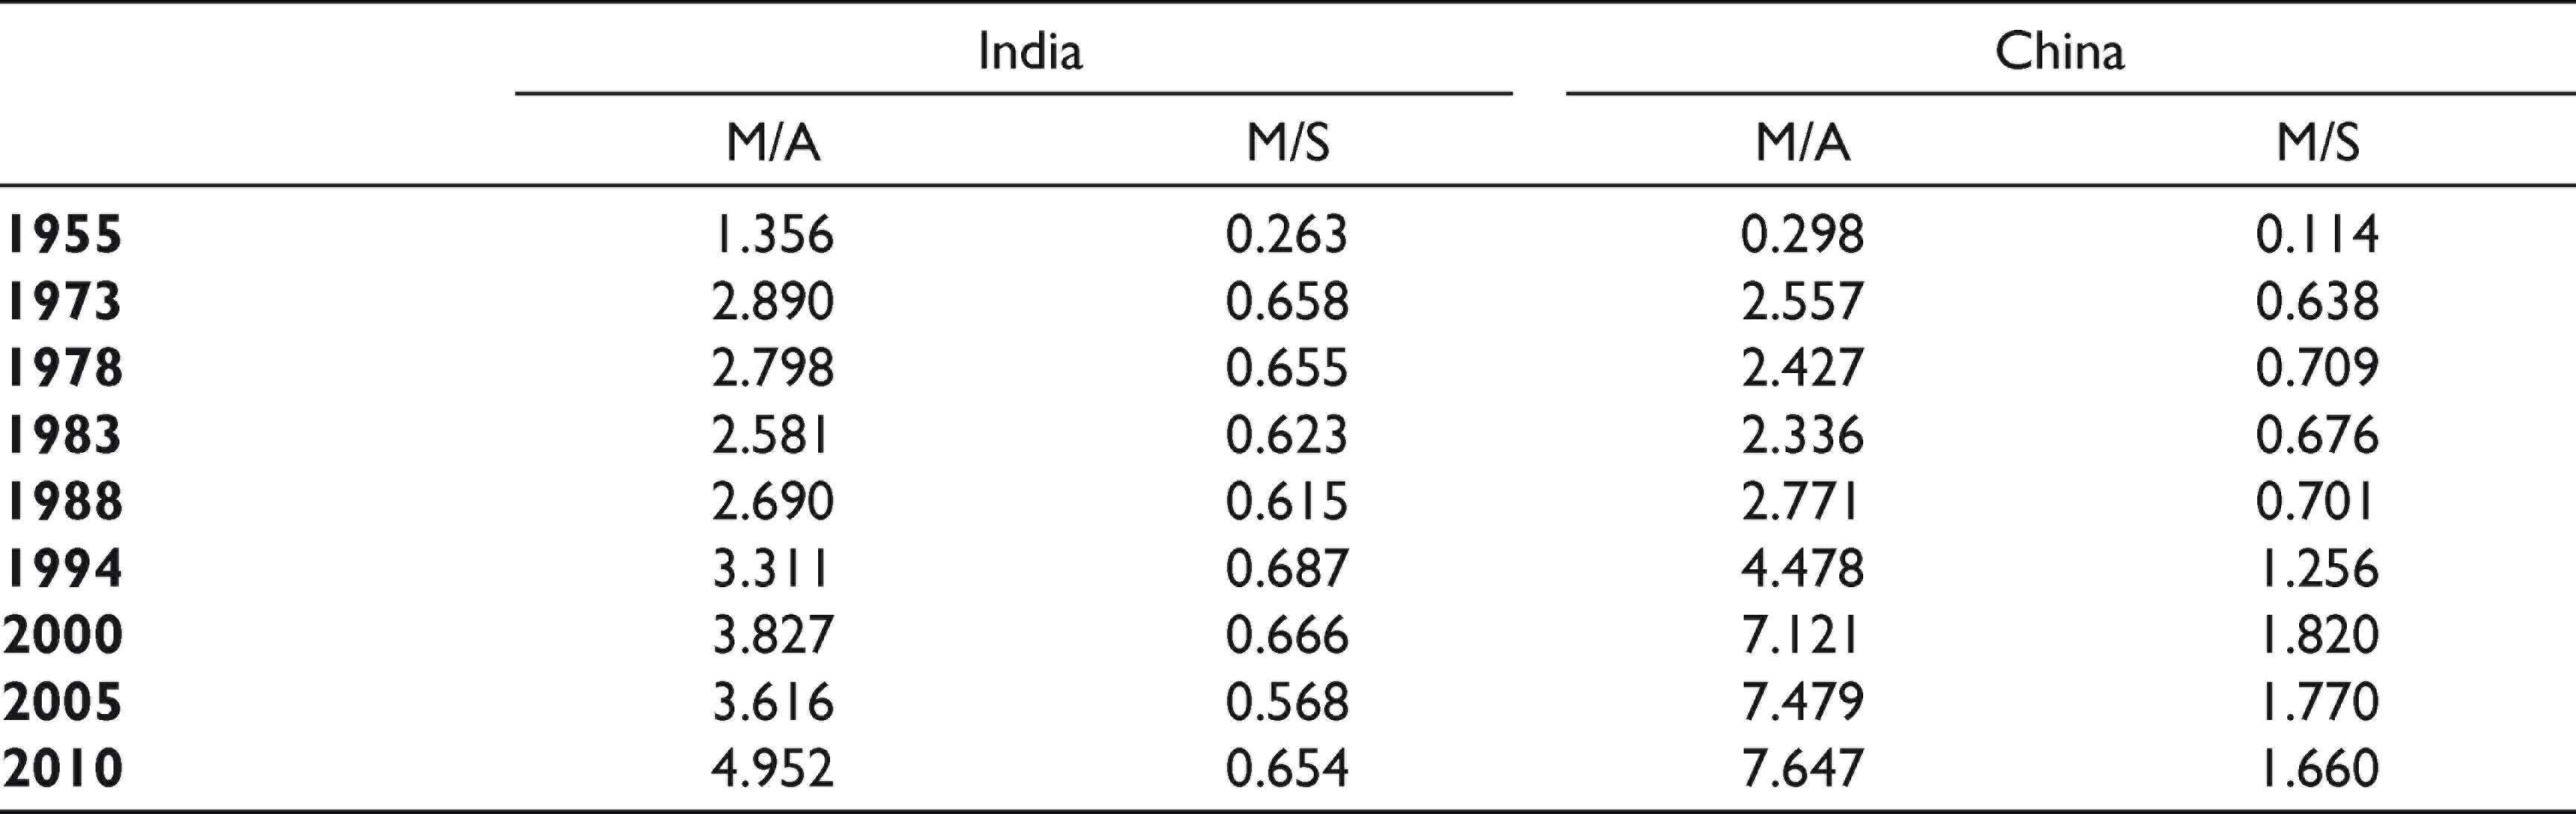
Structural change in India, which has been associated with premature services-led growth, naturally has not conformed to the classical pattern, which had been associated with manufacturing-led growth at early stages of development. But what are the distinctive features of structural change in India? A good way of answering this question is by contrasting the structural change in India with that in China, which has been contemporaneous yet classical (having been associated with manufacturing-led growth). The relevant data for the two countries are put together in Tables 3 and 4.
Changing Structure of Employment in India and China
Ratio of Labour Productivity in Manufacturing to that in Agriculture (M/A) and to that in Services (M/S)
The first and most striking difference between the two experiences is with respect to the time trend in the employment share of manufacturing. In both countries, the employment share of agriculture declined, and the employment share of services increased. But the employment share of manufacturing remained virtually constant in India, while it recorded significant increase in China. Second, the pace of structural change was much slower in India than in China. During the 55-year period (1955–2010), the employment share of agriculture declined by 26 percentage points in India, while it declined by 47 percentage points in China. During the shorter but more relevant period 1978–2010 (the period of services-led growth in India and manufacturing-led growth in China), the employment share of agriculture declined by 20 percentage points in India and by 34 percentage points in China. Third, except during the period from 1955 to 1978, the employment share of services increased much faster in China than in India. This is remarkable since India’s growth was services-led, while China’s growth was manufacturing-led. Even during the period from 2000 to 2010, the period of rapid services-led growth in India, the employment share of services increased by just 3 percentage points (from 24% to 27%) in India, while it increased by 7 percentage points (from 28% to 35%) in China.
A final noticeable difference is with respect to productivity growth (Table 4). Throughout the period from 1978 to 2010, the growth of labour productivity in manufacturing was about the same as that in services in India; in China, during the same period, productivity growth was significantly faster in manufacturing than in services. During the shorter period from 1994 to 2010, productivity growth was actually slower in manufacturing than in services in India, while it continued to be significantly faster in manufacturing than in services in China.
Thus, three distinctive features of structural change in India stand out. First, the employment share of manufacturing failed to increase, which tells a story of non-industrialisation. Rapid growth of services—the lead sector—seems to have restrained the growth of manufacturing. 32 Second, the pace of structural change has been much too slow, which suggests very slow improvement in employment conditions. Third, productivity growth in services has been faster than or at least as fast as that in manufacturing. These trends are truly exceptional. It is hard to find another growing economy (either in the past or at present) in which the productivity growth in services has been faster than or even as fast as the productivity growth in manufacturing.
Structural Change and Employment
This section draws on Ghose (2019). As already stated, structural change involving labour reallocation from agriculture to non-agriculture is the primary mechanism for improvement in employment conditions in low-income economies, where a large part of the workforce is typically engaged in very low-productivity activities in agriculture. Since labour productivity is much higher in non-agriculture, movement of workers from agriculture to non-agriculture means movement from lower-productivity jobs (that yield lower labour incomes) to higher-productivity jobs (that yield higher labour incomes). Movement of this kind also improves employment conditions in agriculture itself by reducing surplus labour in the sector, thereby contributing to productivity growth (and thus to growth of labour income). Hence, the faster the pace of labour reallocation from agriculture to non-agriculture, the faster is the pace of improvement in employment conditions.
To get an explicit view of the process of labour reallocation in an economy, we need to find a measure of the magnitude of labour reallocation in any given period. A simple measure is given by:

where (LR) i is the quantity of labour reallocated from/to sector i in a period,
ei0 is the fraction of total employment in sector i at the beginning of the period,
eit is the fraction of total employment in sector i at the end of the period and
Et is total employment in the economy at the end of the period.
The idea underlying the measure is simple. Had there been no labour reallocation across the sectors, each sector’s share in total employment would have been the same in initial and terminal years of a given period, but employment in each sector would have increased, reflecting the increase in total employment in the economy. So, (ei0 × Et) would then have been the employment in sector i in period t, which we can call the ‘zero-reallocation’ employment. If there has been labour reallocation, the actual employment in sector i in period t would be given by (eit × Et). The difference between these two levels of employment can be regarded as the quantity of labour reallocated from/to sector i. When there is reallocation from sector i, eit < ei0 so that (LR) i is negative. When there is reallocation to sector i, eit > ei0 so that (LR) i is positive.
However, (LR)
i
is not comparable across countries because it depends on Et, which varies across countries. But (LR)
t
can be expressed as a percentage of the ‘zero-reallocation’ employment (ei0 × Et) to get a measure of the scale of reallocation from/to sector i that is comparable across countries:

Estimates of the magnitude and scale of labour reallocation from agriculture to non-agriculture in India and China are presented in Table 5. We have chosen to confine attention to developments since 1978; this was when growth was rapid and accelerating in both countries and also when India’s growth was clearly services-led while China’s growth was clearly manufacturing-led. The scale of reallocation was significant in both economies, but it was much smaller in India than in China in both periods. Between 1994 and 2010, for example, 20% of the potential agricultural workers moved to jobs in non-agriculture in India, while the corresponding figure for China was 48%. Thus, the pace of transfer of workers from low-productivity jobs in agriculture to higher-productivity jobs in non-agriculture was much slower in India than in China. The slower pace of labour transfer also meant slower growth of labour productivity in agriculture in India. The pace of improvement in overall employment conditions was thus much slower in India than in China.
Labour Reallocation (numbers in million) Across Sectors
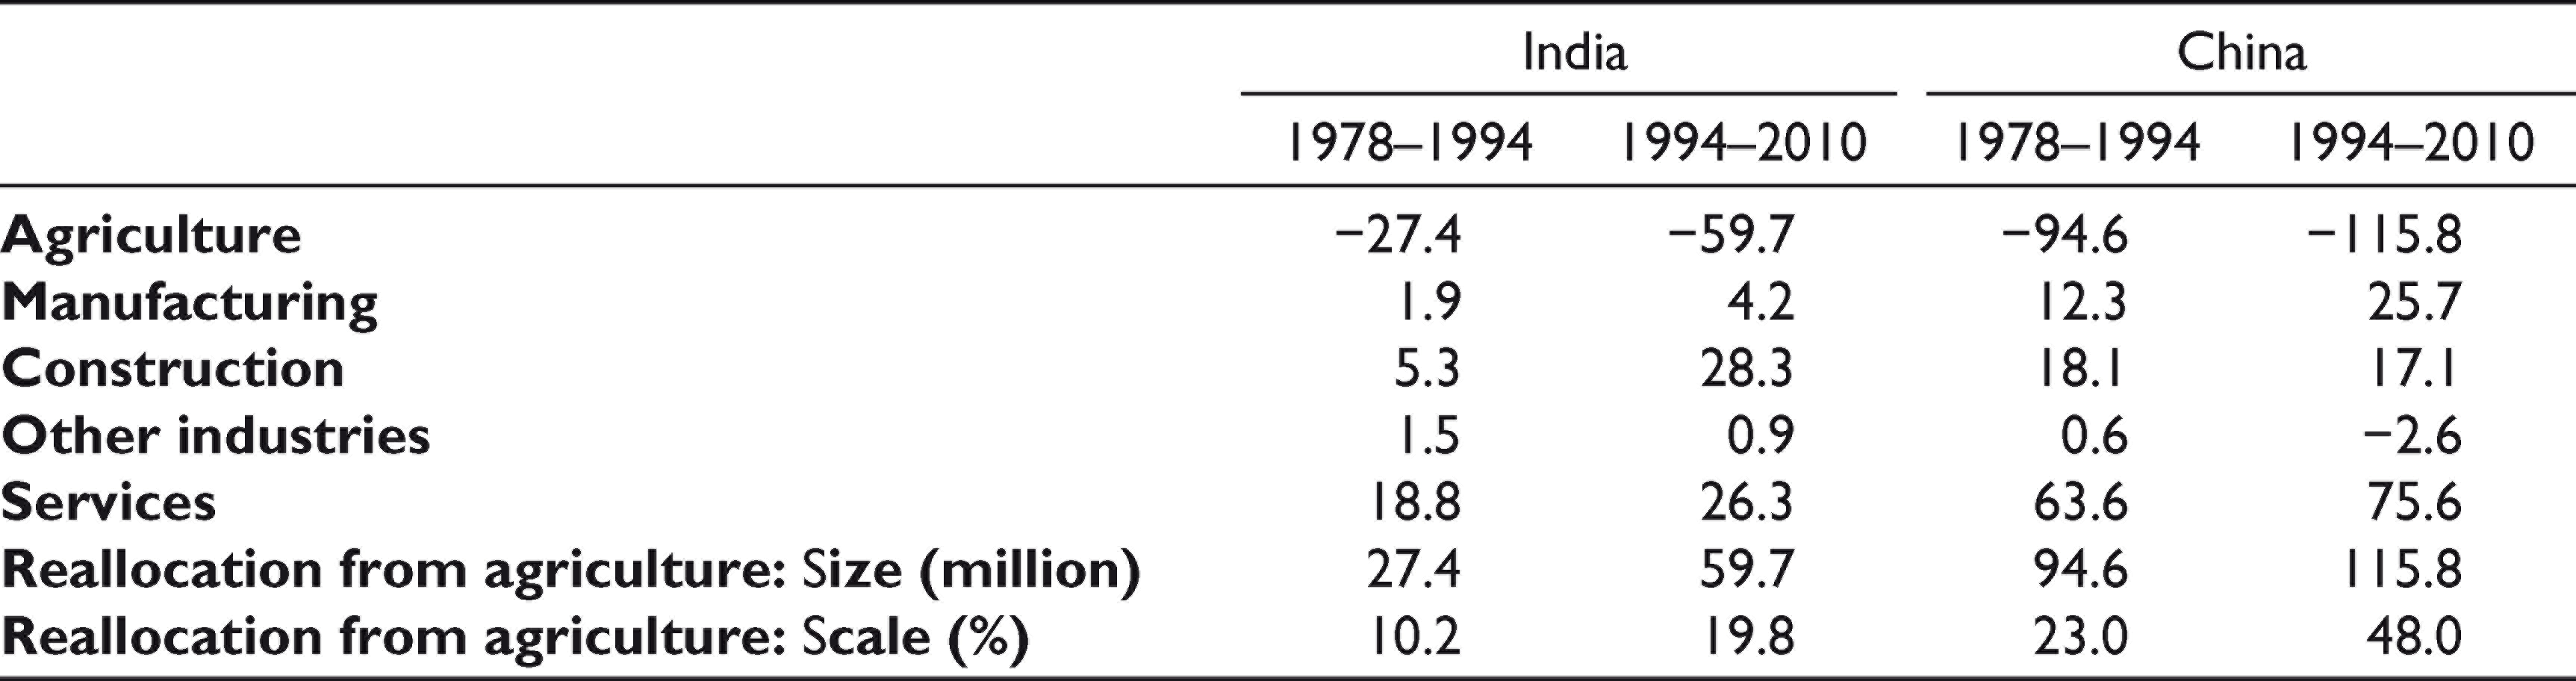
The reasons why the scale of labour reallocation from agriculture was so much smaller in India than in China become clear from the differences in the pattern of absorption of the reallocated labour by different sectors within non-agriculture in the two economies, particularly during the period from 1994 to 2010 (Table 6). First, the manufacturing sector was a rather insignificant employer of workers moving out of agriculture in India; in China, in contrast, manufacturing was a major employer of such workers. Second, the services sector was also a far less important employer of transferred workers in India than in China. Finally, construction was a major absorber of reallocated labour in India but not so in China. Strikingly, construction was actually a more important absorber of the reallocated labour than services in India. It is also the case, as we shall see later, that labour productivity in construction recorded zero growth in India (but high growth in China). However, labour productivity still remained much higher in construction than in agriculture so that labour reallocation from agriculture to construction was both growth-enhancing and employment-improving. 33
Absorption of Reallocated Labour by Sectors (percentage distribution)

It is clear that China’s manufacturing-led growth was far more effective in improving the employment conditions than India’s services-led growth. This was not just because, in China, manufacturing was a major destination for labour moving out of agriculture but also because services became increasingly important absorber of such labour. In India, in contrast, not only was manufacturing an insignificant absorber of labour moving out of agriculture, but services also became progressively less important absorber of such labour. Had construction not become a major absorber of labour, the scale of labour reallocation from agriculture would have been significantly smaller than it actually was. 34
The contrasting experiences of China and India show why manufacturing-led growth has served as the route to development over a long period and also why services-led growth, even when possible, is not really an alternative route. The employment outcomes of the two types of growth are very different. Manufacturing-led growth is associated with rapid transfer of low-skilled labour from agriculture not just to manufacturing but also to services and, hence, with rapid improvement of employment conditions. Services-led growth, in contrast, is associated with slow growth of jobs not just in manufacturing but also in services and, hence, with slow improvement of employment conditions.
Structural Change and Growth
This section draws on Ghose (2019). Structural change, when it involves reallocation of labour from lower-productivity to higher-productivity sectors, positively contributes to growth of labour productivity in the economy and thus to economic growth. 35 Overall productivity growth then results partly from productivity growth within the sectors (which we can think of as the direct result of investment, technological change and worker skills in the sectors) and partly from labour reallocation across the sectors. And overall growth is the combined result of productivity growth and employment growth.
To empirically observe the contribution of structural change to productivity growth, we can employ the following decomposition of the aggregate growth of output per worker
36
:

where g(y) is the average annual growth of overall output per worker in the economy,
g(yi) is the average annual growth of output per worker in sector i,
li0 is the initial share of sector i in total employment in the economy and
s is the residual.
The first term on the right-hand side of the equation measures the economy-wide productivity growth that would have occurred had no reallocation of labour taken place, that is, the within-sector productivity growth. The residual, then, gives a measure of the contribution of labour reallocation to aggregate productivity growth in the economy. 37 The overall output growth, of course, is given by: g(l) + g(y), where g(l) is average annual growth of employment in the economy.
The results of decomposition of aggregate productivity growth in India and China are presented in Table 7.
Growth (% p.a.) of Output Per Worker, Employment and GDP
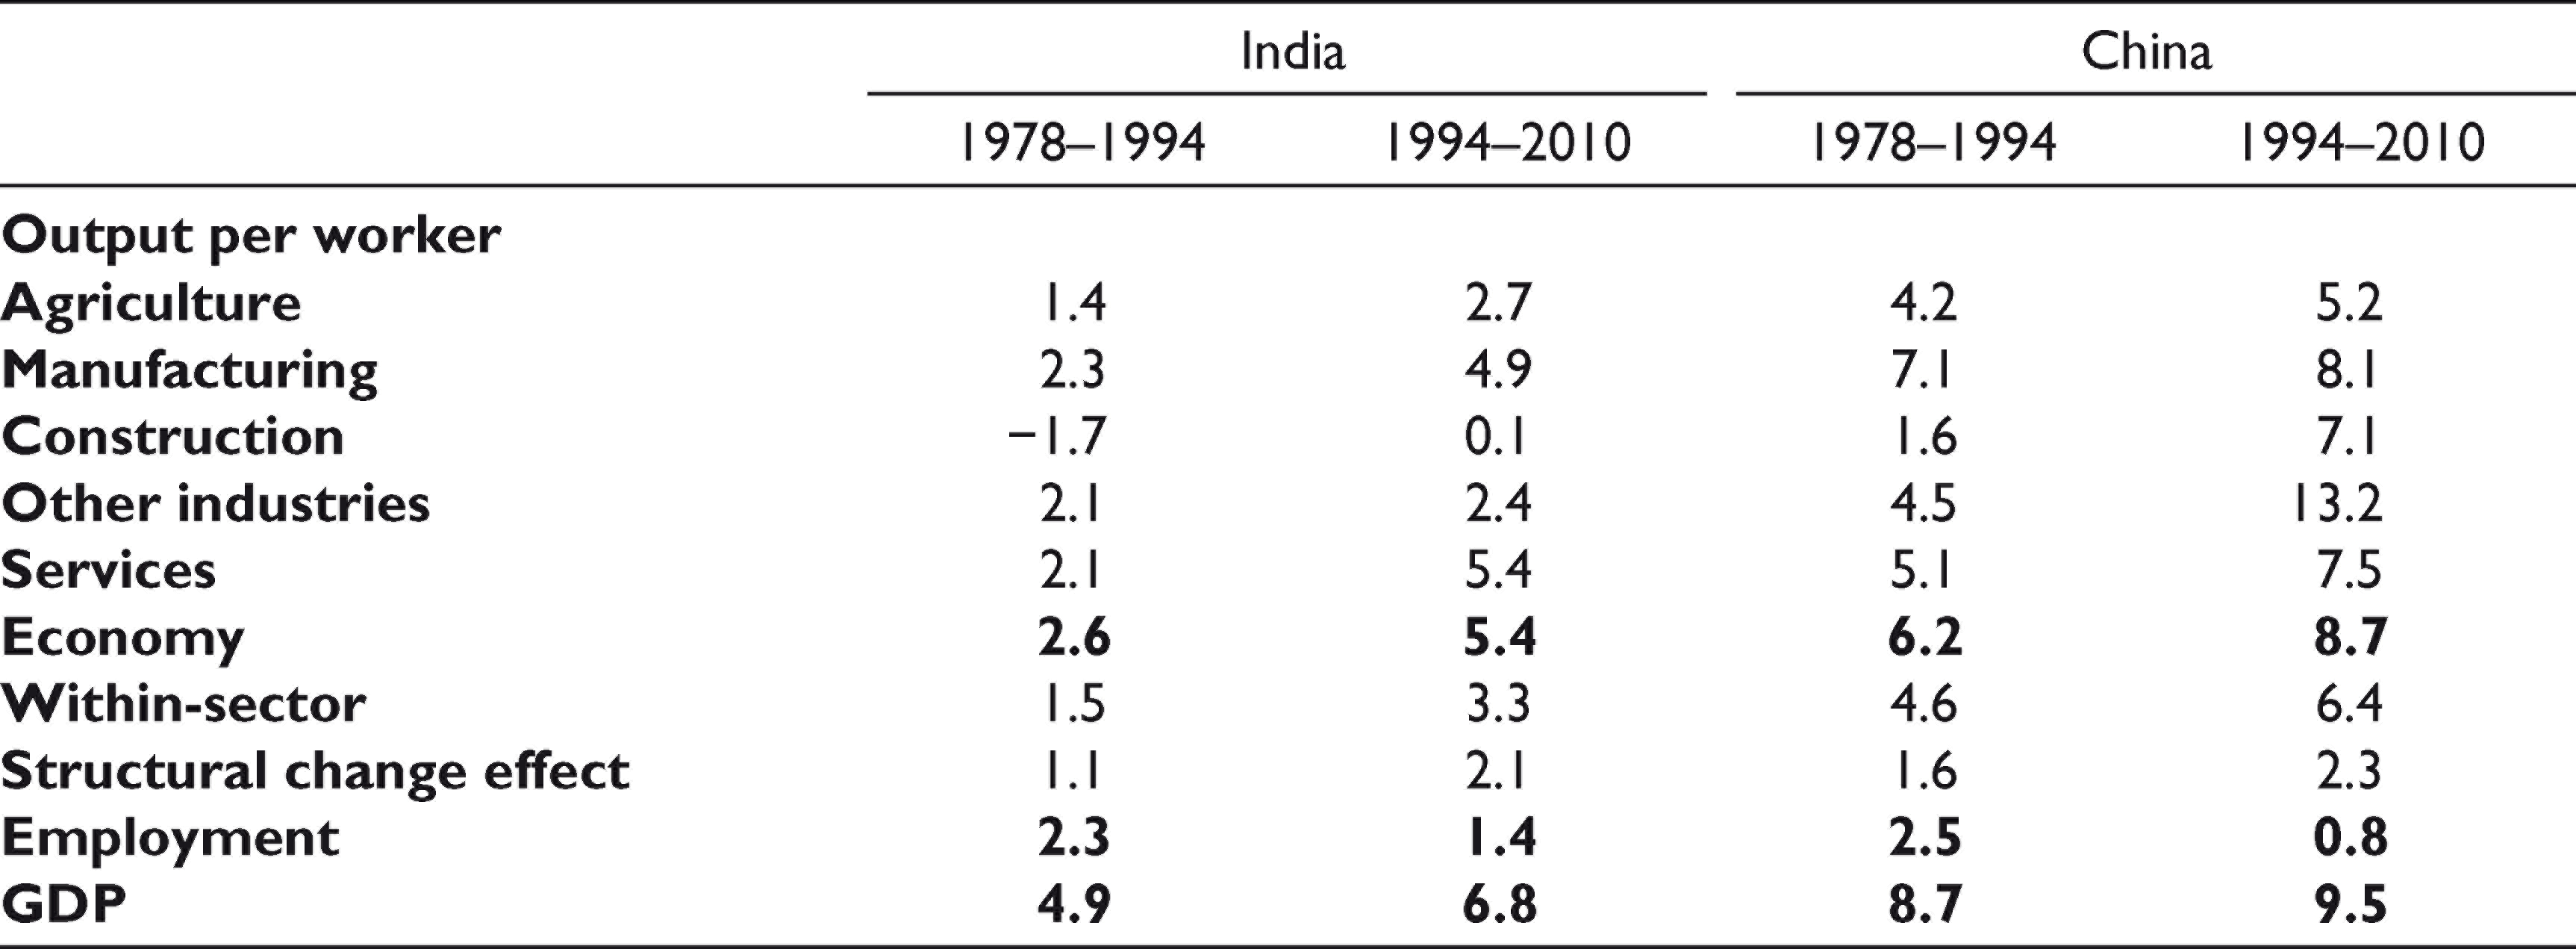
The growth of labour productivity was significant and was also accelerating over time in both economies. But productivity growth was higher in China by a large margin throughout the periods under consideration. The principal reason was the much higher within-sector productivity growth in China. 38 Quite remarkably, moreover, productivity growth was substantially higher in each of the sectors in China, even in services. In the case of India, two features stand out. The first is the declining or stagnant productivity in construction, a sector that has been a major absorber of the low-skilled labour moving out of agriculture. The second is the relatively slow productivity growth in manufacturing, which has not absorbed much of the labour moving out of agriculture. During the 1994–2010 period, productivity growth was slower in manufacturing than in services. It is tempting to attribute this to the growth of digital technology and trade-intensive services. 39 But it is not the case that productivity growth in services was spectacular. As already noted, productivity growth in services was much higher in China than in India. But in China, productivity growth in manufacturing was still higher than that in services.
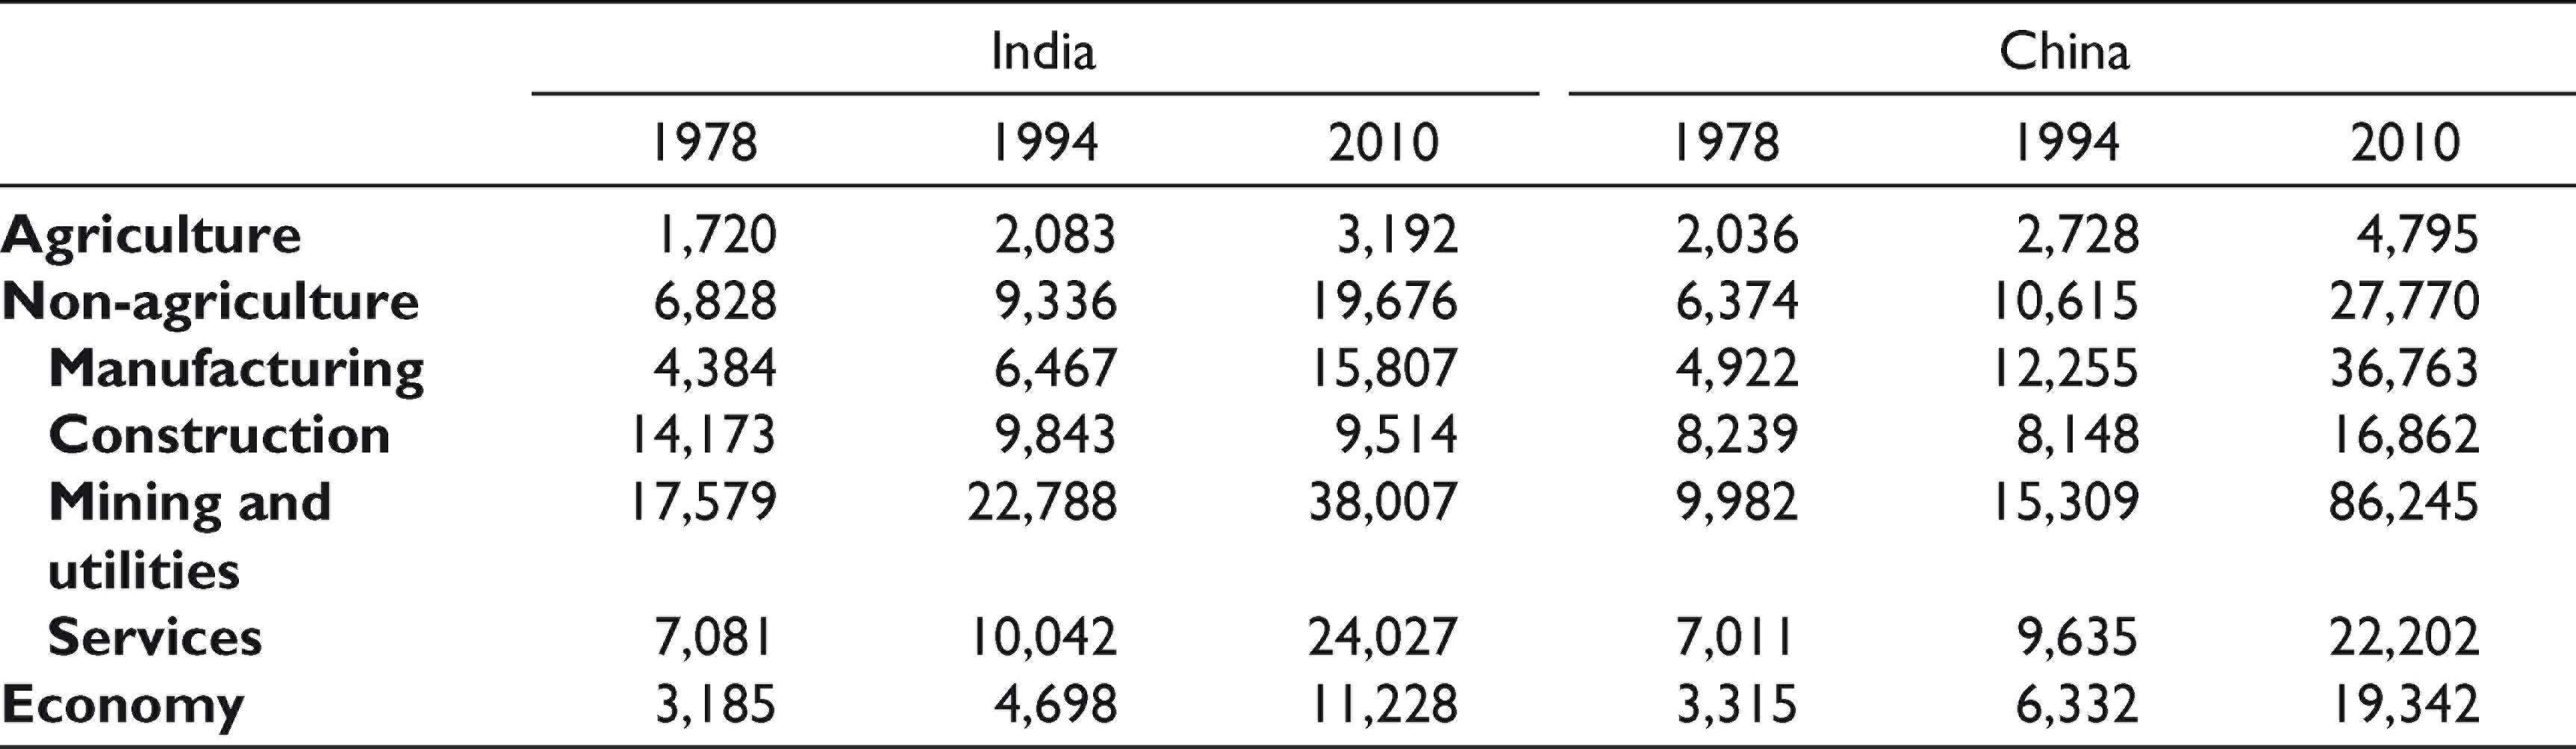
The contribution of structural change to overall productivity growth in the economy was positive and significant in both countries. 40 The magnitude of the structural change effect was larger in China during the period from 1978 to 1994 and about equal during the period from 1994 to 2010. Given that the pace of structural change was much slower in India, the fact that its growth-enhancing effect was similar in magnitude to that in China during the period from 1994 to 2010 appears a little surprising. The explanation is that the gap in productivity between agriculture and non-agriculture has been and remains significantly larger in India than in China. The ratio of labour productivity in non-agriculture to that in agriculture was 4.5 in India against 3.9 in China in 1994 and 6.2 in India against 5.8 in China in 2010 (Table 8). This was not because the productivity in non-agriculture was higher in India; as a matter of fact, productivity was higher in both agriculture and non-agriculture in China.
Output Per Worker in 2011 International $
Concluding Observations
Structural change in India, like its services-led growth, is an exception to the rule. Labour reallocation has occurred from agriculture to construction and services and not to manufacturing and services. Indeed, manufacturing was simply not a part of the story. This explained why the pace of labour reallocation from agriculture to non-agriculture was rather slow. But for the government’s special employment schemes, which generated low-skill jobs in construction, employment growth in the sector (which remained a stagnant-productivity sector) would have been lower than it was so that the pace of labour reallocation from agriculture to non-agriculture would have been even slower. The slow pace of structural change meant slow pace of improvement in employment conditions. This stood in sharp contrast with the experience of China, where the structural change was very much classical in character, having been associated with manufacturing-led growth. The pace of improvement in employment conditions was much faster in China than in India.
However, the structural change in India was growth-enhancing, indeed, almost as growth-enhancing as that in China. The reason is that the productivity gap between non-agriculture and agriculture has remained large, larger than that in China. This is not because productivity in non-agriculture in India was high; in fact, productivity in both agriculture and non-agriculture was higher in China than in India for much of the period. Productivity growth in agriculture remained low in India, in part because of the slow pace of labour reallocation. And productivity in non-agriculture remained relatively high because of the growing weight of high-productivity services in output.
India’s experience shows why services-led growth cannot be seen as a new route to development (i.e., as an alternative to manufacturing-led growth) for the low-income economies of today. The employment benefits of services-led growth are far too inadequate to translate growth into development. Manufacturing absorbs the relatively low-skilled labour moving out of agriculture at a productivity premium. Moreover, manufacturing growth stimulates growth of certain services, which also absorb the relatively low-skilled labour moving out of agriculture at a productivity premium. But services-led growth has to be based on growth of skill-intensive services, which cannot absorb the low-skilled labour moving out of agriculture. And growth of services does not seem to stimulate growth of manufacturing that can absorb the low-skilled labour moving out of agriculture. 41 Thus, services-led growth, even when possible, does not amount to services-led development.
It must also be recognised that services-led growth is not even a possibility for most of the low-income economies. For, this kind of growth must rely on growth of skill-intensive traded services, and the low-income economies typically are skill-scarce and labour-surplus economies. India was an exception to the rule, in that it happened to have built a supply of skilled labour. 42 Not surprisingly, it has also remained the only country to have achieved premature services-led growth.
Does manufacturing-led development still remain a possibility for low-income economies of today? The answer, our analysis suggests, is yes. 43 There are no solid grounds, empirical or theoretical, for believing that low-income economies of today are fated to experience premature de-industrialisation. A great merit of manufacturing-led growth is that it can be sustained by synchronous increases in domestic demand (through growth of employment and income) and in domestic production (under increasing returns to scale). Exports help by bringing additional demand and growth acceleration. 44 In contrast, services-led growth in a low-income economy (which happens to be endowed with skilled labour) has to be sustained by synchronous increases in income inequality and inflow of foreign finance; the former sustains the growth of domestic demand for services, and the latter promotes the production of skill-intensive traded services.
Should India make a transition from services-led growth to manufacturing-led growth? The answer, again, is yes. And the main argument is that India needs much faster pace of improvement in employment conditions, that is, much faster pace of structural change, which only manufacturing-led growth can engender. 45 We can add that sustainability of India’s services-led growth is conditional on growing income inequality and continued inflow of foreign finance and hence is open to doubt. The growing concentration of income at the hands of the richest 10% of the population cannot sustain rapid growth of domestic demand for services for ever—a saturation point will inevitably be reached. Inequality growth itself is likely to become socially unsustainable. And continued inflow of foreign finance cannot be taken for granted.
A transition to manufacturing-led growth, it should be pointed out, does not require choking of the export-oriented growth of the services (e.g., software services) in which India has acquired a comparative advantage. In this sense, India can have both manufacturing and services as growth engines.
At this point, we need to take note of a current concern that the labour-saving technologies associated with the so-called Fourth Industrial Revolution (or Industry 4.0)—robotics, artificial intelligence, Internet of Things and 3-D printing—will make it increasingly difficult for low-income countries to develop manufacturing by drastically reducing trade in manufactures and thereby destroying prospects of manufactures-export-led growth. In parallel, the technologies will, it is feared, also destroy the job-creating potential of manufacturing by enabling near-complete automation. In short, future prospects of manufacturing-led development appear to look pretty grim. Amidst these fears and concerns, a view is emerging that, since the same technologies will keep increasing the tradability of services, it will now be possible for low-income economies to achieve services-export-led growth provided, of course, that they concentrate their energies and resources on building a skilled but low-wage labour force. 46
While the concern cannot be dismissed as entirely baseless, it should not persuade the low-income countries to devote all their energies and resources to building highly skilled labour force and dissuade them from pursuing manufacturing-led development. If there is a day when manufacturing will employ only ‘artificially intelligent robots’ and no workers, that day is still far off. And it is difficult to see why there will not be a day when ‘artificially intelligent robots’ will be delivering all services. Speculations of this kind are not very helpful. What we do know at this point of time is that ‘robotisation’ is of some importance in the traditionally capital-intensive industries. Labour-intensive manufacturing, in which the low-income countries have a comparative advantage, has not seen much use of robots (see Hallward-Driemeier & Nayyar, 2018). It has also been found that increased ‘robotisation’ in developed countries actually increases offshoring rather than reshoring (see Hallward-Driemeier & Nayyar, 2019). Exports of labour-intensive manufactures from low-income to high-income countries will remain important in the foreseeable future. Moreover, manufacturing value chains and ‘trade in tasks’ are not about to disappear. And manufacturing-led growth should not be taken to mean manufactures-export-led growth. As argued earlier, growth of manufacturing can be driven by synchronised forces of demand and supply in the domestic economy. Exports certainly help but need not, and usually do not, drive manufacturing growth. Most jobs are created in domestic-market-oriented manufacturing and not in export-oriented manufacturing.
Footnotes
Declaration of Conflicting Interests
The author declared no potential conflicts of interest with respect to the research, authorship and/or publication of this article.
Funding
The author received no financial support for the research, authorship and/or publication of this article.