
Abstract
We find very little evidence of household investment in professional higher education in India that has seen the highest participation of the private sector. This article examines the variability of household expenditure on professional higher education in India and its relationship with socioeconomic and institutional factors. We find that households in India spend close to half of their annual income per child for accessing professional higher education. The study confirms the presence of a pro-male bias in household expenditure on professional higher education with an additional preference among poor households. Students enrolled in private institutions have spent significantly higher than those enrolled in public-funded institutions, and interestingly, this gap is not only due to the difference in the payment of fees but also due to expenses in non-fee items. The findings from this analysis have important policy insights which would contribute towards making professional higher education equitable and inclusive in India as aimed in the National Education Policy 2020.
Keywords
Introduction
Higher education plays a critical role in creating a better world. It helps in promoting economic growth, improving income distribution and reducing social and economic inequalities and is regarded as the primary engine of upward mobility (Tilak, 2003). Higher education that includes technological and professional education, apart from general education, contributes to dynamic economic growth with the production of “specialised human capital” (Schultz, 1988), yielding direct economic benefits and playing an equally important role in producing a large multitude of externalities (McMahon, 2018; Özdoğan Özbal, 2021). Furthermore, in a competitive global knowledge economy, there is an increasing demand for qualified and skilled human resources with creative minds, and the professional higher education (PHE) system contributes significantly to fulfilling these demands (Tilak & Choudhury, 2019). National Education Policy (NEP) 2020 targets of ensuring broad-based competencies and twenty-first century skills among PHE graduates to create the highest quality professional capacities that would help to address the new realities in the changing economy and society (MHRD, 2020).
Interestingly, the rapid growth of PHE in India that includes disciplines of engineering and technology, business management, financial management, hotel management, catering technology, architecture, town planning, legal studies and pharmacy is significantly higher in the private sector than the courses offered in humanities and social science disciplines (Choudhury, 2016; Tilak, 2018). For instance, in 2018–2019, the share of private institutions was more than 90% of country’s total undergraduate level engineering institutions with an enrolment share of 87% (AICTE, 2020). Similarly, in the last three decades (1990–2020), the number of private medical colleges increased by 540%, whereas the number of government-run medical colleges grew up only by 174% with an overall growth of 279%. The share of private sector in the total number of medical colleges increased from 3.6% in 1950 to 48.3% in 2020. In this period, the enrolment in medical education share has gone up from 1.4% to 47% (Choudhury, 2016; National Medical Commission, 2020). According to All India Survey on Higher Education 2019–2020, student enrolment in professional courses in private institutions at under graduate level is 72.5% and it is 59.8% at post graduate level (MoE, 2020). As PHE courses are revenue-rewarding to the private investors as well as to the students in terms of dividends in the labour market, as compared to other disciplines like humanities and social sciences, it observed very high growth in India, particularly during the last two decades. In 2019–2020, the share of enrolment in four disciplines of PHE (medical, engineering, law and management) to total enrolment in higher education is 21.6% (MoE, 2020).
The increasing presence of private sector in the provisioning of PHE has made a major shift in policies on financing of higher education in India during the last few decades. In the early 1960s, public funding and philanthropic contributions were a major part of the resource for higher education in India, and the contribution from private sources in terms of tuition fees and other payments from students was negligible (Tilak, 1983). However, with the implementation of the New Economic Policy of 1991, broadly known as the Structural Adjustment Programme (SAP), the trend shifted towards private funding of higher education (Chakrabarti & Joglekar, 2006; Chattopadhyay, 2007, 2019; Panchamukhi, 1990; Panigrahi, 2019; Varghese, 2013). In the post-1990s, major policy think tanks (including the World Bank) recommended the supplementation of public higher education revenues by non-governmental sources, primarily from the users, that is, students (Johnstone, 1993, 2003; Johnstone et al., 1998; Woodhall, 1992; World Bank, 1994; Ziderman & Albrecht, 1995). Declining public funding and advocating non-state funding of PHE, specifically passing the burden to households in terms of high fees and student loans, have been the familiar trends. Furthermore, it is widely viewed that students accessing technical and professional courses should share the cost substantially by paying fees as it offers higher private returns. As a result, the fee in several professional courses in higher education in India is increasing despite the existing regulations imposed by the centre and various state governments (Panigrahi, 2020). Cost recovery measures, particularly student fee, which has been used to generate more and more resources, have contributed to making PHE increasingly costlier for the students, raising questions about affordability of quality higher education. Households belonging to lower and middle socioeconomic strata feel financially handicapped in sending their children to costly professional courses such as engineering, medicine and management.
In the policy space, it is often said that accessing PHE through the self-financing mode has led to substantial out-of-pocket spending by households in India. But, intriguingly, we find very little evidence of household investment in PHE in India that has seen the highest participation of the private sector in the last two decades. Examining this issue has become increasingly relevant as the public budget for PHE in India is shrinking, and the household’s contribution is being looked at as a potential substitute to it in recent years.
How much do households spend on PHE in India? What are the factors that decide the extent of investment by the households in these costly courses? How expensive are the professional courses in private institutions vis-à-vis the public? This article addresses these important concerns by examining the variability of household expenditure on PHE in India and its relationship with socioeconomic and institutional factors, using the unit-level data from the latest 75th education round of the National Statistical Office (NSO) conducted in 2017–2018. Interestingly, this study analyses the pattern of household spending separately for fees (tuition fees, exam fees, library fees and other fees) and non-fee items (expenditure on textbooks, stationery, uniform, transport, private tuition and other educational spending) to find a better picture. The study has estimated the impact of various socioeconomic and institutional factors on household spending on PHE in India. Separate household expenditure functions are estimated by gender, location, between poor and rich households and institution type to understand variations in the impact of different factors on PHE spending better. Thus, an important contribution of the study is the analysis of socioeconomic as well as institutional factors in determining household spending on PHE using the most recent education round data of the NSO.
The rest of this article is organised as follows: the second section discusses the problem by providing an overview of the existing literature on household investment in education both in the context of India and elsewhere. The third section describes the data and methodology/analytical framework used for the analysis. The fourth section discusses the results. An attempt is made in the concluding section to draw a few major conclusions and policy recommendations that emerge from the study.
Prior Literature
Several past studies suggest that households in India spend a sizeable amount on their children’s higher education, which has been escalating over the past three decades (Chakrabarti & Joglekar, 2006; Chandrasekhar et al., 2019; Choudhury, 2019; Choudhury & Kumar, 2021; Tilak, 2002, 2021). Scholars, however, have witnessed that household expenditure on higher education varies widely depending upon a complex set of socioeconomic and institutional factors. For instance, using a survey data of about 7,000 B.Tech students, Tilak (2021) finds that family’s social, economic and educational factors considerably influence levels of family expenditures on engineering education in India. Some of the major factors often cited in the literature include individual characteristics (gender, caste and religion), household attributes (location, family income, household size, parental education and occupation) and institutional factors such as type of institution, type of course, scholarship, distance, hostel and medium of study (Azam & Kingdon, 2013; Chandrasekhar et al., 2019; Choudhury & Kumar, 2021; Datta & Kingdon, 2019; Duraisamy & Duraisamy, 2016; Panchamukhi, 1990; Sarkar, 2017; Tilak, 2002, 2021; Yan et al., 2021). Earlier studies unfolding a few of these significant factors are reviewed briefly in this section.
Gender bias in education spending has been a topic of many research studies, particularly in the context of developing countries. The existence of pro-male bias in household spending on education has been documented worldwide, including in India (Beg & Bhat, 2021; Choudhury & Kumar, 2021; Datta & Kingdon, 2019; Dizon-Ross & Jayachandran, 2022; Kaul, 2018; Kingdon, 2005; Kumar & Naincy, 2020; Panchamukhi, 1990; Saha, 2013; Xu et al., 2022). But most of these studies have focused either on school education or overall higher education, and not many studies have examined the issue in the context of professional education that is found to be relatively costlier, except for two recent works—Choudhury and Kumar (2021) & Tilak (2021) which are on engineering education. Households prefer to invest comparably more towards education for their sons, and the extent of such differences widens further in the case of rural setups and higher education (Datta & Kingdon, 2019; Himaz, 2009; Iddrisu et al., 2018; Kaul, 2018). In a recent study, Choudhury and Kumar (2021) find that the average annual household expenditure on male students accessing engineering education is around 11% more than that on females, and this gap in spending widens further among poor households. The pro-male spending on education is mainly due to India’s conservative socio-cultural setting where spending on girls’ education may work as a “negative dowry”. In professional education, this difference is expected to widen as investments in these courses take a major part of households’ income, but there is hardly any study to establish this. Therefore, it is interesting to empirically examine the gender bias in household spending on PHE in India and its association with other socioeconomic and institutional factors. This is particularly important to look at as the female enrolment in PHE courses is found to be significantly less as compared to male counterparts. For instance, the share of female enrolment in four disciplines of PHE (engineering, management, medicine, and law) is 37.1% in 2019–2020 (MoE, 2020). And this figure is as low as 29.2% in the field of engineering and technology.
It is argued that income inequalities may result in inequalities in educational opportunities since those able to pay more can access better quality education. Tilak and Choudhury (2019) find that the inequality in access to higher education is significant between poor and rich households—the difference in the gross attendance ratio between poorest and richest families was 43.5% points in 2013–2014. Many scholars around the globe have established a positive relationship between household income and education spending both in rural and urban areas (Acar et al., 2016; Omori, 2010; Pallegedara & Kumara, 2020; Shafiq, 2011; Tansel & Bircan, 2006; Tilak, 2002). Kanellopoulos and Psacharopoulos (1997) found that Greece households belonging to the bottom 20% expenditure quintile spent 6.5% of their annual income on education, whereas it is 55.8% for households belonging to the upper 20% expenditure quintile. Similar findings were reported by Sengupta et al. (2008) and Shafiq (2011), revealing that education expenditure as a percentage of family income for poor households was quite low compared to their rich counterparts in India and Bangladesh, respectively. Similarly, there is a negative relationship between family size and households’ education spending (Dang & Rogers, 2016; Tansel & Bircan, 2006; Tilak, 2002) as a bigger family size will result in leaving fewer resources for education (Bayar & Ilhan, 2016; Huy, 2012; Qian & Smyth, 2011). With limited financial resources, as children are added to the family, the per-child resource declines to lower educational attainment for later order children (Dang & Rogers, 2016; Kugler & Kumar, 2017). However, very little is known about these issues for PHE in India. Thus, we examine the impact of households’ paying capacity as well as family size on their spending on PHE in India.
Regional belongingness or location of households has a direct bearing on households’ education spending. Many studies have revealed the dominance of urban households over their rural counterparts while spending on education (Chandrasekhar et al., 2019; Choudhury, 2019; Duraisamy & Duraisamy, 2016; Kingdon, 2005; Panchamukhi, 1990; Tansel & Bircan, 2006). Interestingly, Pradhan et al. (2000) found that the per-capita annual expenditure on education in India was ₹101 and ₹455 in rural and urban areas, respectively, reporting a noticeable difference of around 4.5 times. Similarly, Duraisamy and Duraisamy (2016) showed that the average spending on higher education for an urban student was 1.6 times the expenditure of a rural student. In a more recent study, Chandrasekhar et al. (2019) found that while rural households spend around 15% of their total consumption expenditure on their children’s higher education, the figure was 18.4% in urban areas. This variation may be due to the rural-urban earning difference and higher cost of education in urban areas. However, studies addressing the variations in household spending on higher education between rural and urban regions are quite limited in India, and this study attempts to fill this gap to some extent.
Apart from various individual and household factors, institutional factors, such as type of institution, discipline of study, distance and availability of financial support like student loans and scholarships, and several other related factors also determine the level of education spending. However, studies unfolding their impact on household education spending are quite limited in the Indian context, except for a few recent studies (Choudhury, 2019; Sarkar, 2017). Using 71st round NSO data, Sarkar (2017) reveals that technical courses in India cost 105.9% more compared to general courses. In our study, we include two important institutional factors (college type and discipline of study) in examining the pattern and determinants of household spending on PHE in India.
The large bulk of the current literature has focused on examining the pattern and determinants of household expenditure on higher education in India, and studies on PHE are sparse. As far as we know, this is the first attempt to empirically estimate the pattern and determinants of household spending on PHE in India. The increasing presence of private sector in provisioning of PHE in India calls for a detailed analysis of the financial burden felt by the households due to escalating course fees and other related expenses. The article also includes an examination of gender bias in household expenditure, which could possibly explain the persistent gap in providing quality PHE between males and females, on which very little is known in academia and policy space. In addition, we provide additional evidence on the variability in PHE spending by different components (fee and non-fee items), which is missing in the existing literature. Therefore, this work would significantly contribute to the literature and offer recommendations on policymaking.
Data and Empirical Design
Data
The article uses disaggregated unit-level data available in the latest education round of the NSO—the 75th round conducted from July 2017 to June 2018. The survey (Household Social Consumption: Education) includes a sample of 113,757 households, including 64,519 rural households and 49,238 urban households from all over India. Unlike the more “general” or “normal” rounds, the focus of this round was to collect information on four important issues (literacy, access and participation, costs and subsidy, and dropout) related to education in addition to many other household-level characteristics.
The survey provides information on annual per-student household expenditure (private expenditure) on different levels of education and also by items. Other than spending on course fees (which include tuition fees, examination fees, development fees and other compulsory payments), it gives the amount of household spending on various non-fee items such as books, stationery, uniform, transport, private coaching and other educational expenditures. Besides, the households have reported their education spending on courses other than the basic course and expenditure on preparation for higher/additional studies during the current academic year. However, this study uses information regarding household spending on a basic course that the student is currently pursuing.
In this study, we have restricted our sample to the students who are currently attending four professional courses (engineering, management, medicine and law) in higher education in India. The sample size for those pursuing professional courses is coming out to be 12,029 which accounts for 37.5% of the total sample size for university graduates. Of the total sample for PHE, around 82% of students were enrolled in private institutions (both aided and unaided), whereas the remaining 18% were studying in government ones. Engineering students constituted the highest share (70%) followed by medicine (13.2%), management (11.9%) and law (4.6%). Furthermore, 65% of students were male, and 35% were females. Caste distribution of students reveals that around 43.9% of students are from other backward classes (OBCs), 42% belong to upper castes (UCs), and 14.1% are from Scheduled Castes (SCs) and Scheduled Tribes (STs).
Empirical Design
The pattern of household spending on professional courses by different socioeconomic and institutional characteristics of the students is discussed using the descriptive statistics, while the factors determining the annual household expenditure on PHE in India are estimated using the ordinary least square (OLS) technique. Separate regression equations are estimated by gender (male and female separately), location (rural and urban areas), household expenditure quintiles (poor and rich households) and institution type (government and private) with the objective to understand the variations in the impact of different factors on PHE spending. The major equation used to estimate the household expenditure function is as follows:

where
lnEducost = natural logarithm of annual total household expenditure on PHE.
α1 = intercept terms.
βi = regression coefficients that measure the influence of explanatory variables on the household expenditure on engineering education.
Xi = explanatory variables.
ε1 = error terms.
The explanatory variables used in the regression are broadly categorised as individual characteristics, household factors and students’ current education status. The summary statics of the variables used in robust OLS models are given in Table A1.
To check the robustness of the regression results, we have estimated three different OLS models, which allow us to find out whether the coefficients of the independent variables determining household expenditure on PHE are consistent after altering them. For instance, the estimation of model 3 (in comparison to models 1 and 2) evidences how the effect of socioeconomic and institutional factors (taken together) on determining household investment in PHE varies from considering socioeconomic to institutional factors separately. The regression results are found to be robust as similar findings are observed in models 1–3. Additionally, we have estimated the heteroscedasticity-consistent OLS model to check the robustness, and the results are given in Table A2. The OLS coefficients of the main models (models 1–3) are found to be exactly the same in direction (positive or negative) and almost similar in magnitude (the numeric values of the coefficients) to the heteroscedasticity-consistent OLS model. The effect of explanatory variables included in the models (models 1–3 and also in the heteroscedasticity-consistent OLS model) on household expenditure on PHE remained consistent and statistically significant.
Results and Discussion
Patterns of Household Expenditure on Professional Higher Education in India
The annual average household expenditure on higher education in India is ₹26,400, which accounts for 17.3% of the total annual household consumption expenditure in 2017–2018 (see Table 1). 1 Fees accounted for 61.2%, and non-fee spending constituted 38.8% of the overall spending. Although this is the picture for overall higher education, we notice a significant difference in household spending between general and professional courses. 2 Students pursuing professional courses spent remarkably higher on their education (483% more) than those attending general courses. Households spend around 46.7% and 9.7% of their annual consumption expenditure if one of their children is pursuing a professional course and general course, respectively, marking a huge difference. This is largely due to higher fees charged (particularly in private institutions) in professional courses such as engineering, management, medicine and law. Estimates reveal that the fee charged in professional courses is reported to be 711% more than in general courses. Given the costly nature of professional courses and thereby huge household investment in them, this article examines the changing pattern and determinants of household spending on PHE in India.
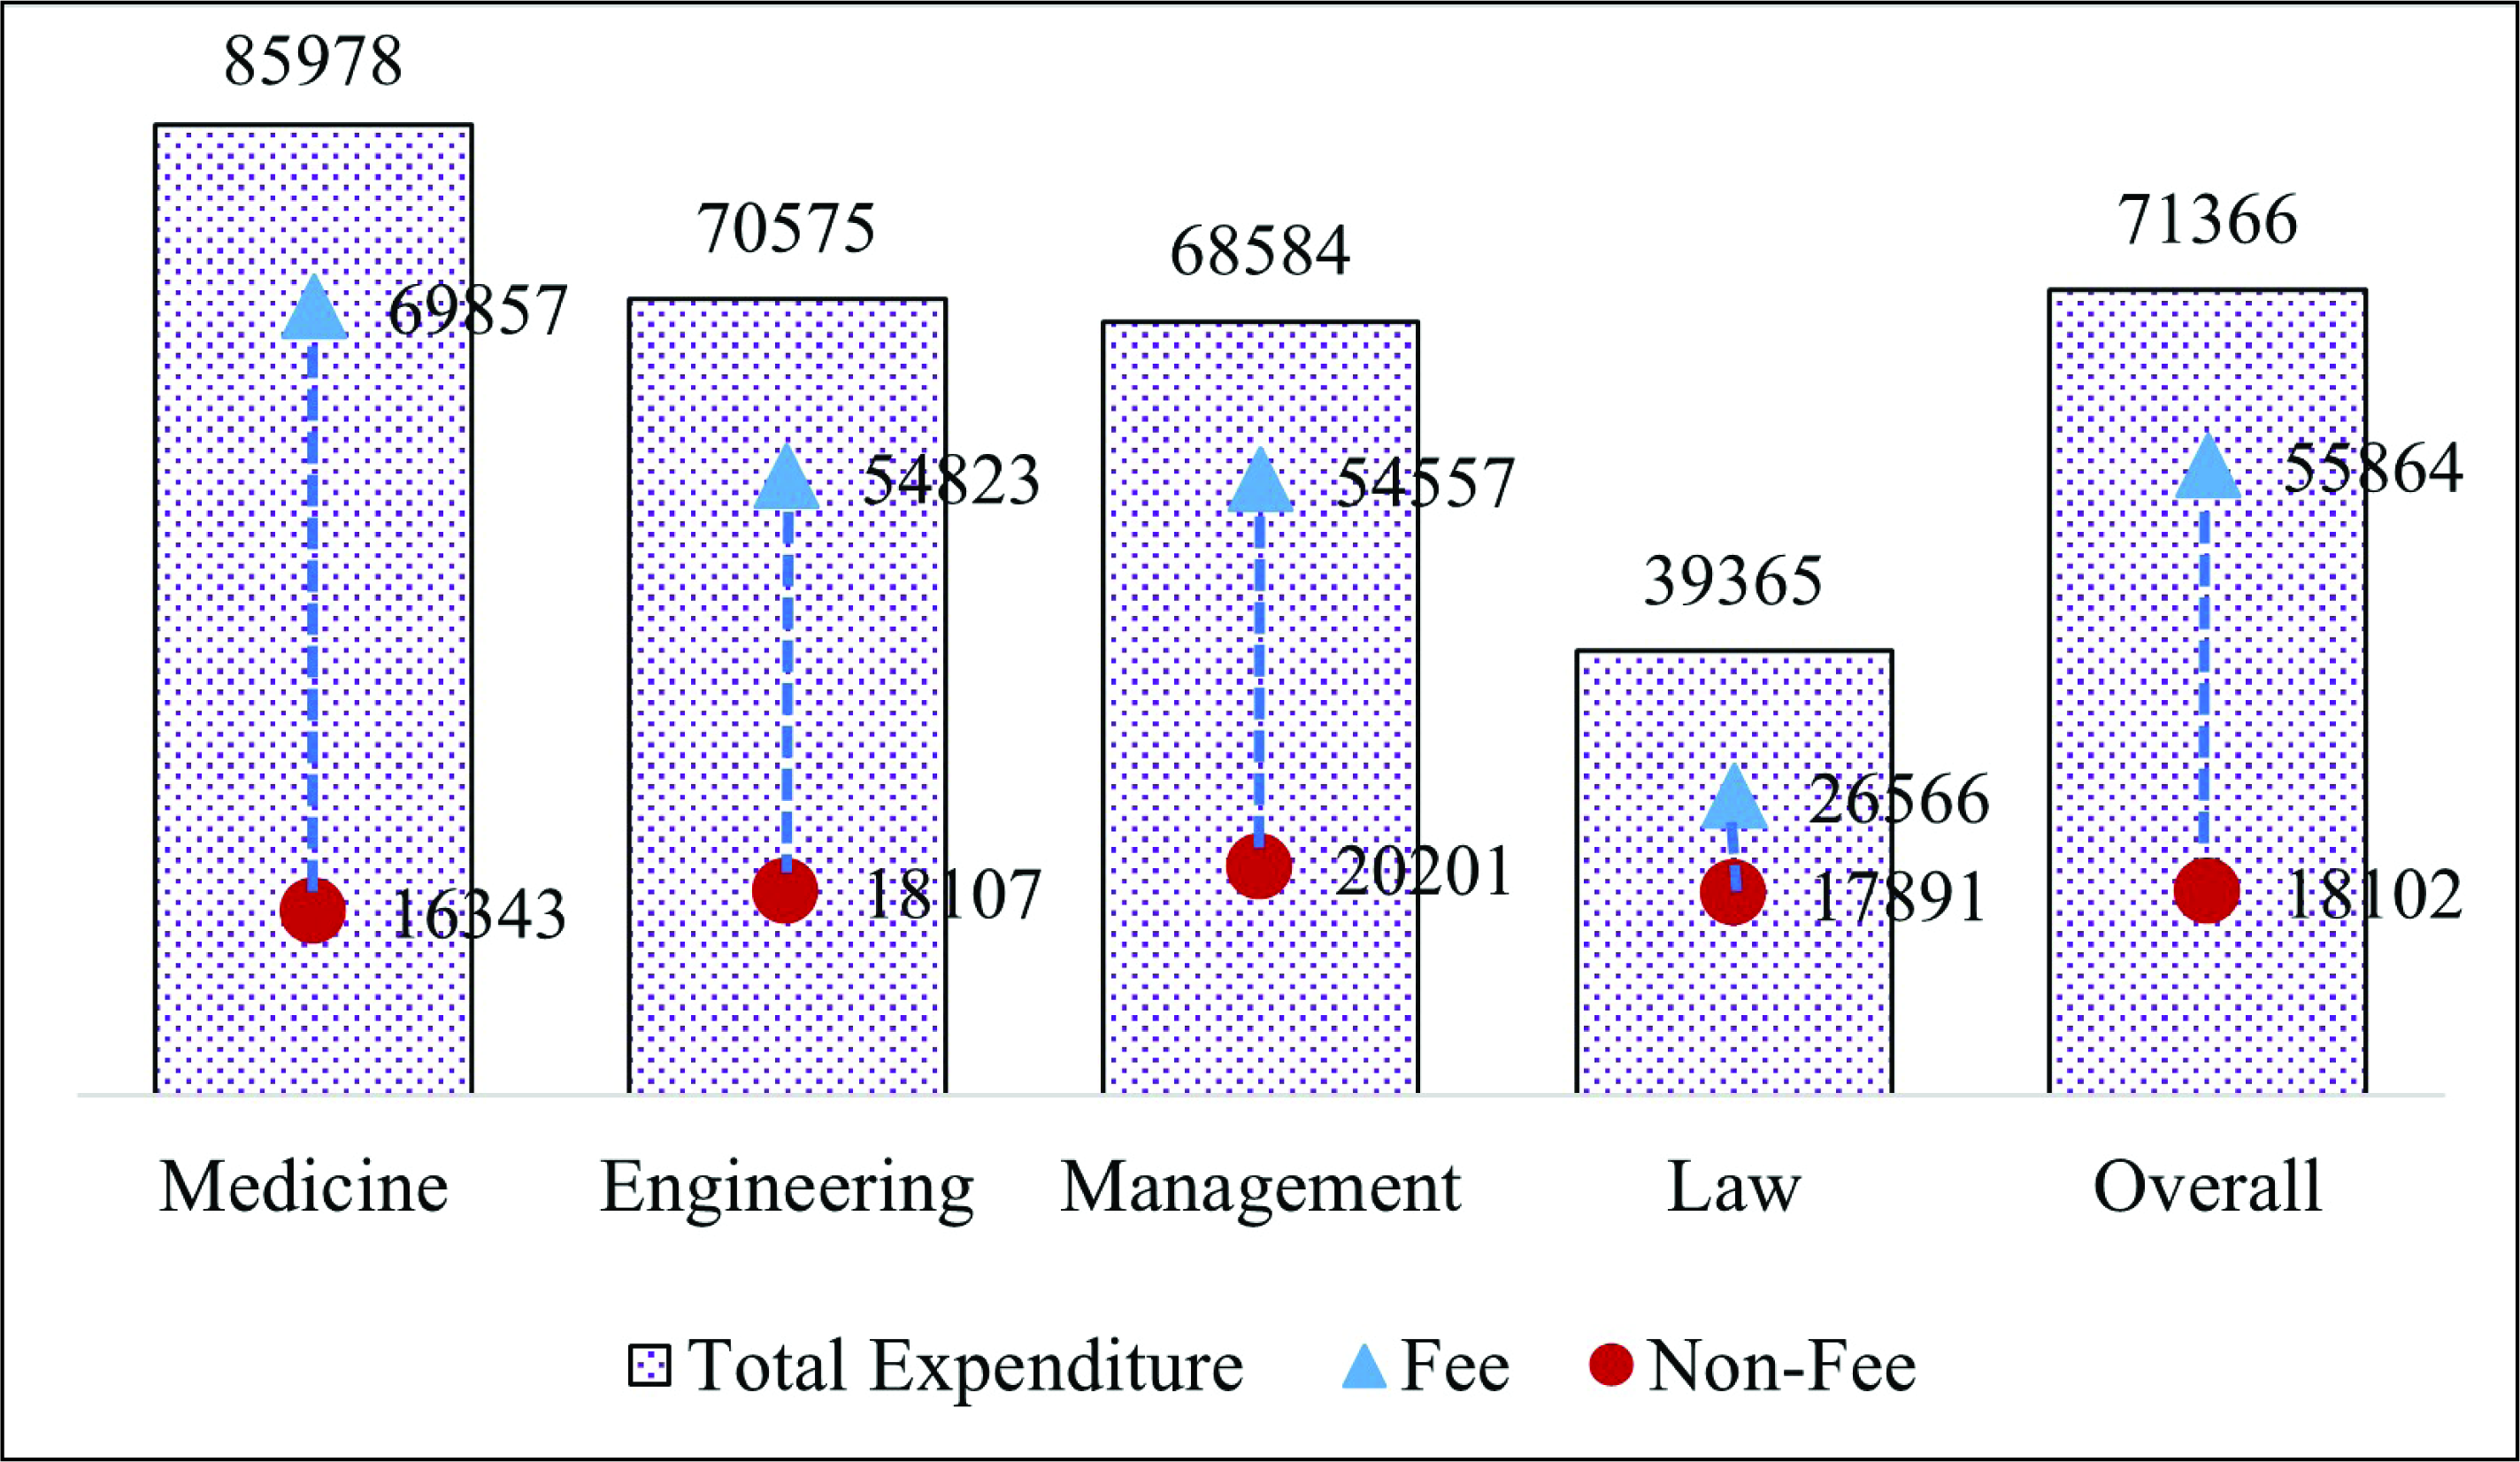
Annual Per-student Household Spending (₹) on Higher Education in India by Type of Course

The annual average household expenditure on PHE in India is ₹71,400, which accounts for 46.7% of the total annual household consumption expenditure in 2017–2018. Of the total household spending on PHE, ₹55,800 is incurred on fees (tuition fees, exam fees, library fees and other fees) and ₹18,100 on non-fee items such as expenditure on food, accommodation, textbooks, transport, private tuition, mobile, internet and others (see Table 1). Fees accounted for 36.6%, and non-fee spending constituted 11.8% of annual household consumption expenditure. The share of spending on fees to total household spending on PHE is 74.5%, while it is 25.5% on non-fee items. Interestingly, even though PHE institutions charge high fees, households sending their offspring to PHE courses spend a good amount of money on non-fee items. Spending on “books, stationery and uniform” and transportation takes a major share (69.3%) of non-fee spending followed by 15.7% on private tuition and the rest 20.9% on other items.
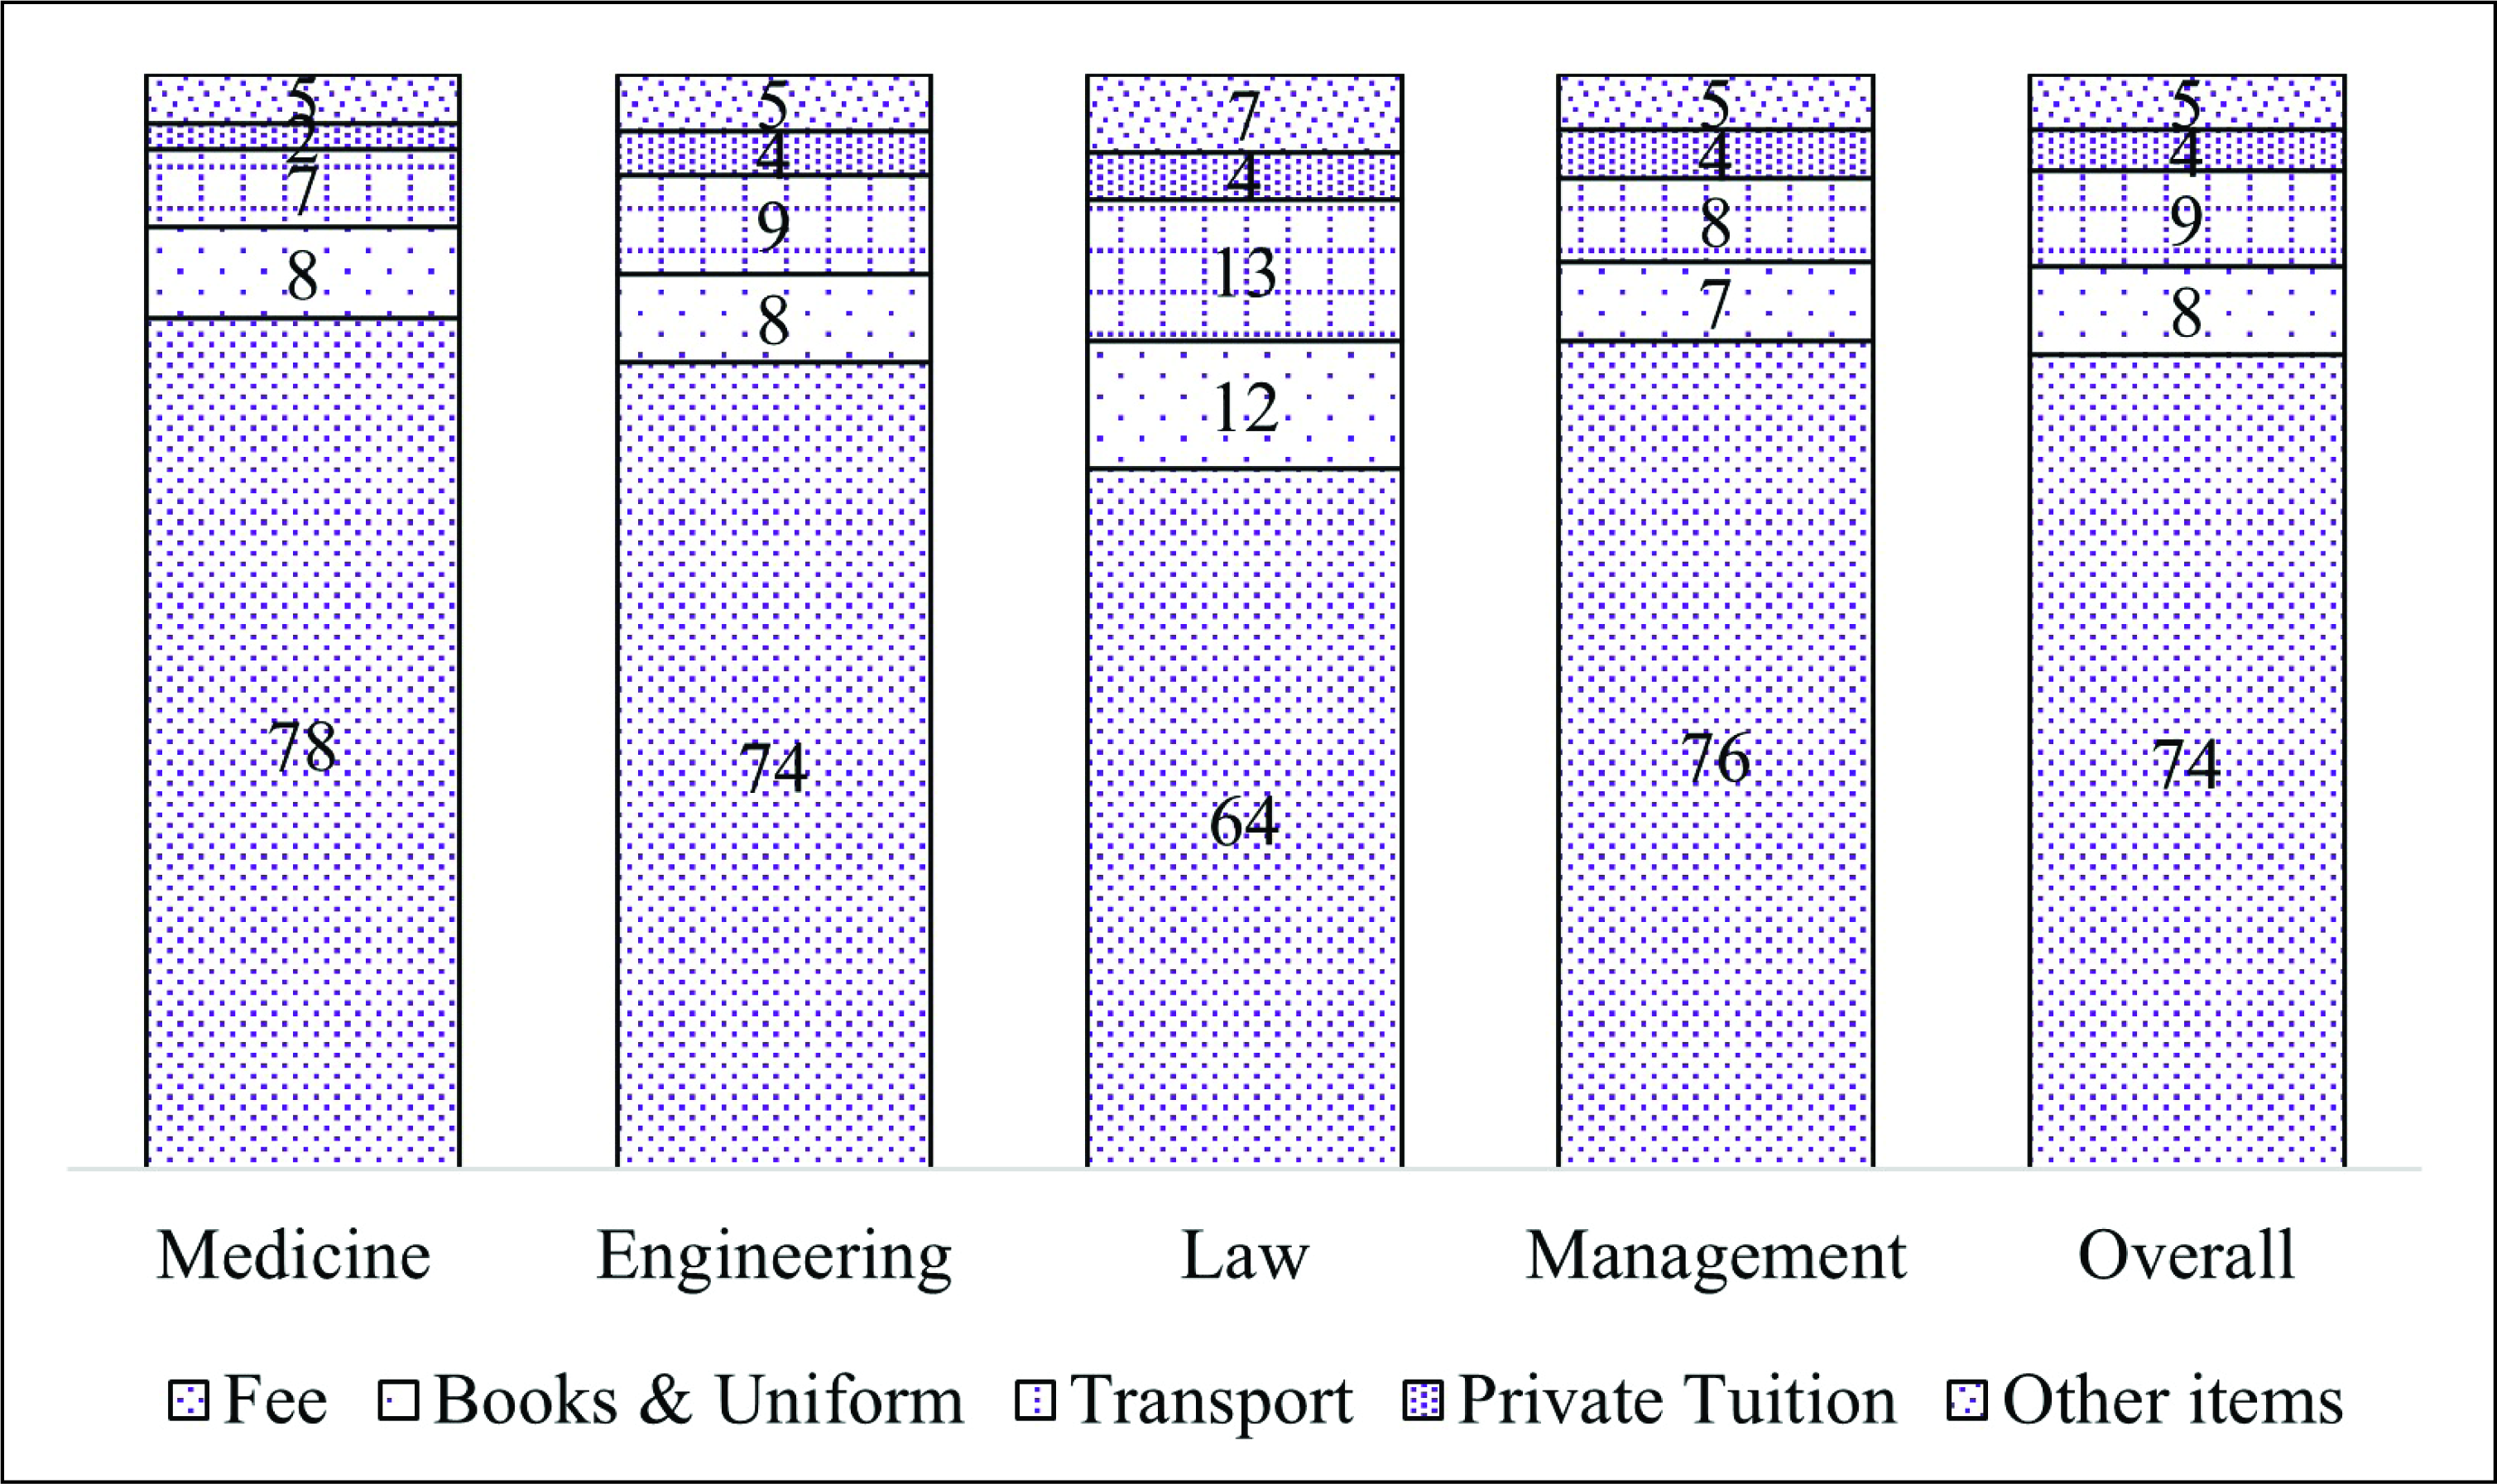
Within PHE, the highest expenditure was incurred by medical students (₹85,900) followed by engineering (₹70,500), management (₹68,500) and least by the law students (₹39,300)—making medical the costliest professional discipline (see Figure 1). While the fee in a medical course was 2.6 times that of the law course, interestingly, non-fee spending was more among law students (compared to medical students). It is apparent that the tuition fee charged for medical courses is much higher than other professional courses (especially in private institutions), which results in differences in household expenditure. For instance, while the fee constituted 78% of the total spending on medicine courses, the respective share was 64% in law courses (see Figure 2). We do not find many variations in household expenditure on non-fee items such as books, uniforms, transport, and private tuitions across different courses.
Household spending on PHE varies by different socioeconomic and institutional factors. Findings reveal a pro-male bias in PHE spending, wherein households spent ₹71,700 on sons, slightly more than daughters, that is, ₹70,700 (see Table 2). Gender bias in favour of men in household spending on education has been documented in many studies conducted in different regions across India (Azam & Kingdon, 2013; Kingdon, 2005; Panchamukhi, 1990; Saha, 2013). Contrary to the established literature, non-fee spending on females is more than their male counterparts—₹19,600 against ₹17,300. And further understanding on this needs a detail study. Furthermore, a significant rural-urban disparity exists in spending on professional education in India, particularly on fees. Urban households spent 1.4 times more on PHE of their children than their rural counterparts. This inter-regional gap in spending was found to be slightly more in the case of fees (1.5 times) than non-fee items (1.2 times)—mainly due to the huge gap in fees charged by professional HEIs in these two sectors. Variations in PHE spending are also prevalent across social groups. General students incurred the highest expenditure (₹81,600), followed by OBCs (₹66,700), and as expected, SCs/STs spent the lowest, that is, ₹55,200. Students from UCs spend around 50% more (a gap of ₹26,300) than SC/ST students. This variation is largely due to the difference in the spending on fees paid by students. This might be because students from marginalised sections (including SCs and STs) are provided with fee waivers in professional HEIs (particularly by public ones) of the country. Nevertheless, this needs to be probed in detail.
Household Spending on PHE by Socioeconomic and Institutional Factors

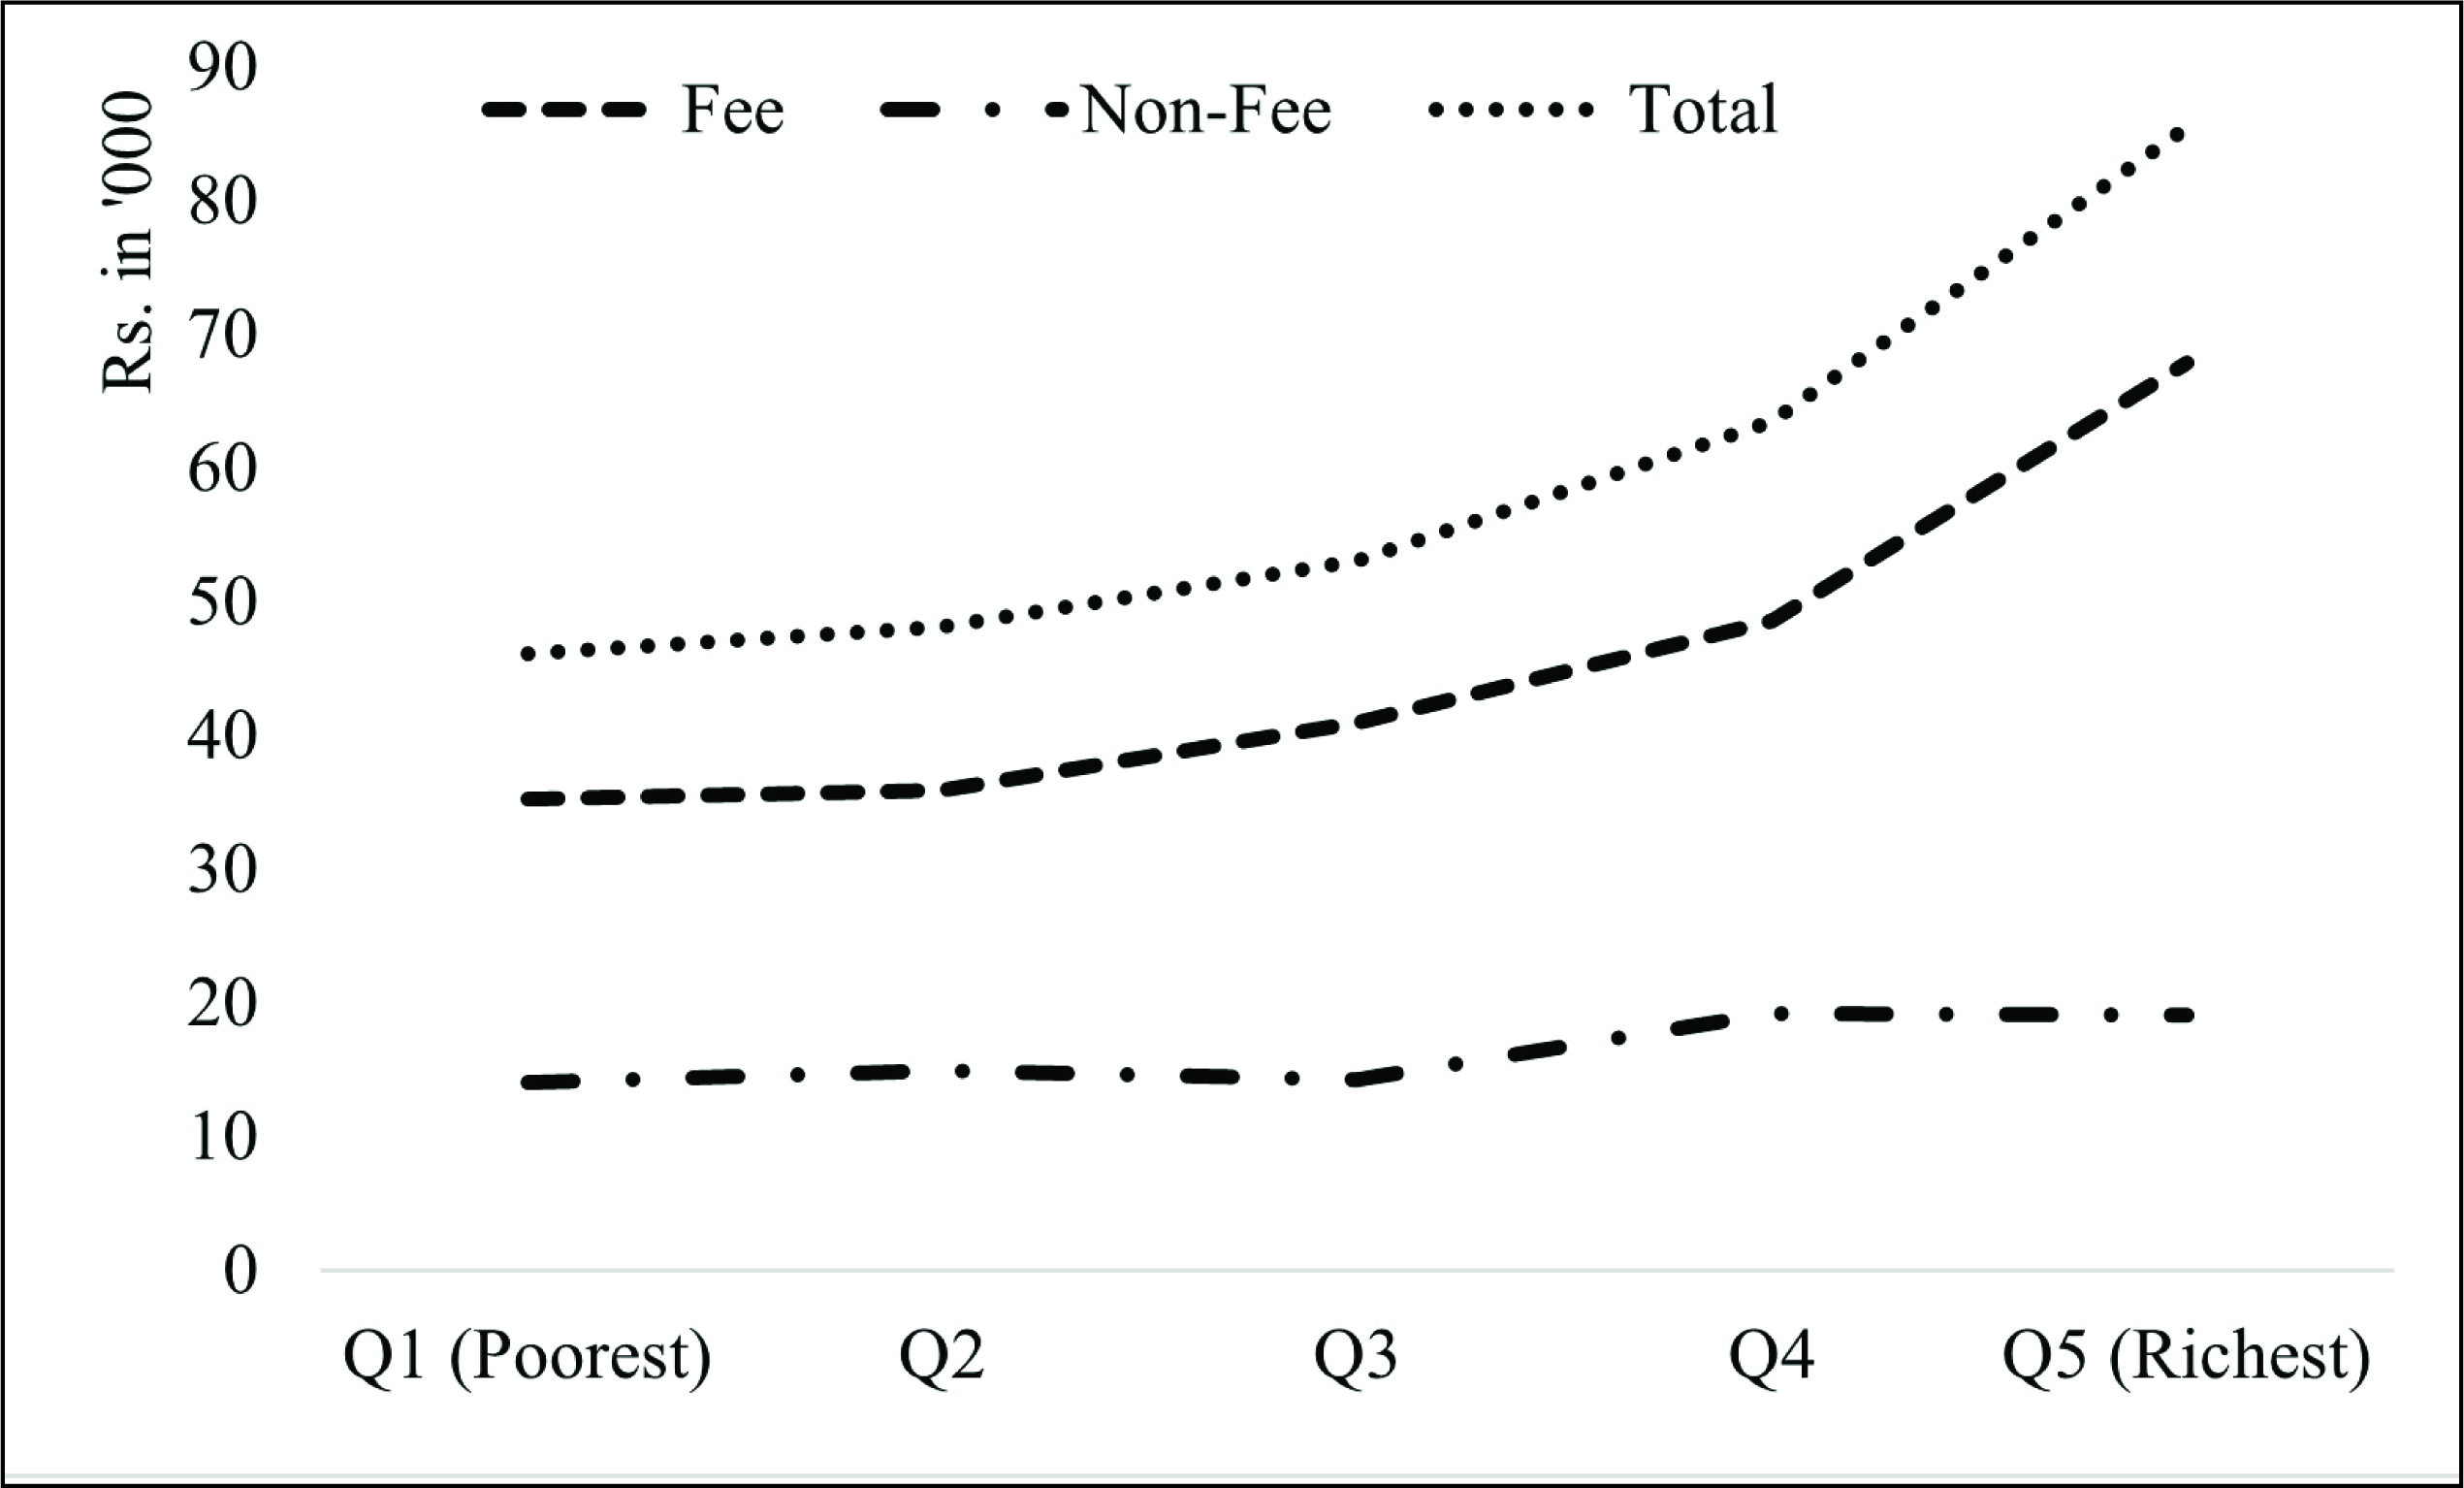
It is argued that the quality of PHE accessed by the students of different family backgrounds varies substantially, and this is largely due to the differences in their spending on higher education. Even if some poor households send their wards to courses such as engineering, medicine, management and law, they spend significantly less on it as compared to the non-poor households, which might affect quality, continuation and performance of students in their studies. It might also bring inequality in employment opportunities in the labour market. Therefore, it is quite important to look at the variations in the household expenditure on PHE in addition to examining the inequality in accessing it. Although there are few available studies on the inequality in household expenditure on higher education in India (Azam & Kingdon, 2013; Chandrasekhar et al., 2019; Duraisamy & Duraisamy, 2016; Panchamukhi, 1990; Tilak, 2002), there is hardly any such work for the PHE sector. Present estimates reveal that average spending on professional education is higher for each successive expenditure quintile in 2017–2018 (see Figure 3). It is the lowest for the poorest households (₹46,078) and highest for the richest households (₹85,439). The top quintile households (quintile 5) spend close to two times more on PHE than the bottom quintile (quintile 1). A similar expenditure pattern is observed for fee and non-fee items, wherein the households belonging to the highest consumption expenditure quintile spent around 1.9 times and 1.4 times more than their lowest quintile counterparts. Households belonging to the lowest quintile (Q1) spent a significant part (67.2%) of their annual household consumption expenditure, whereas the corresponding figure was only 32.9% for the highest quintile. This indicates that poor households are spending a significant share of their annual consumption expenditure on PHE of their children. This is largely due to the massive expansion of private HEIs in the country that has led to an increase in family investment in higher education, and more so for students accessing professional courses.
Household spending on PHE varies widely by institution type, of course, due to their different fee structures. Students enrolled in private unaided institutions spent around 1.7 times more as compared to those studying in government ones—₹78,400 and ₹45,500, respectively. The considerable gap in overall spending is largely due to huge fee differences between the two types of institutions, which is relatively high in private institutions. The fee charged by private unaided professional HEIs was around twice the government institutions. We also find inter-institutional variations in spending on non-fee items such as books, uniforms, transport and private tuitions across different courses. Students accessing private PHE institutions spend higher on non-fee items than government institutions.
Determinants of Household Expenditure on PHE in India: Robust OLS Results
The robust OLS results in model 1 confirm the significant impact of gender on household spending on professional education in India. Households are spending 9.5% more on sons than daughters in PHE (see Table 3). Interestingly, an additional preference is observed among poor and rural families, wherein they are spending 23.1% and 11.2% more on PHE of male offspring than females, respectively. Even after controlling for the institutional factors, the effect of gender on household spending on PHE remained consistent and statistically significant (model 3, Table 3). The gender bias in households’ education investment may be attributed to the parental preference for boys’ education over girls, as discussed by many scholars in India (Azam & Kingdon, 2013; Datta & Kingdon, 2019; Kaul, 2018; Panchamukhi, 1990; Tilak, 2002, 2021). In a patriarchal society like India, parents usually do not expect future financial support from their daughters and, therefore, invest less in girls’ education than boys, and it is more so in costly professional courses. In addition, examining gender inequality in household spending on PHE is an interesting case in India as around 65% of the students in these disciplines are male. The OLS coefficient for gender of main models (models 1–3) is found to be exactly the same in direction (positive or negative) and almost similar in magnitude (the numeric values of the coefficients) to the heteroscedasticity-consistent OLS model, given in Table A2.
Robust Regression Estimates for Determinants of Household Expenditure on Professional Higher Education (2017–2018)

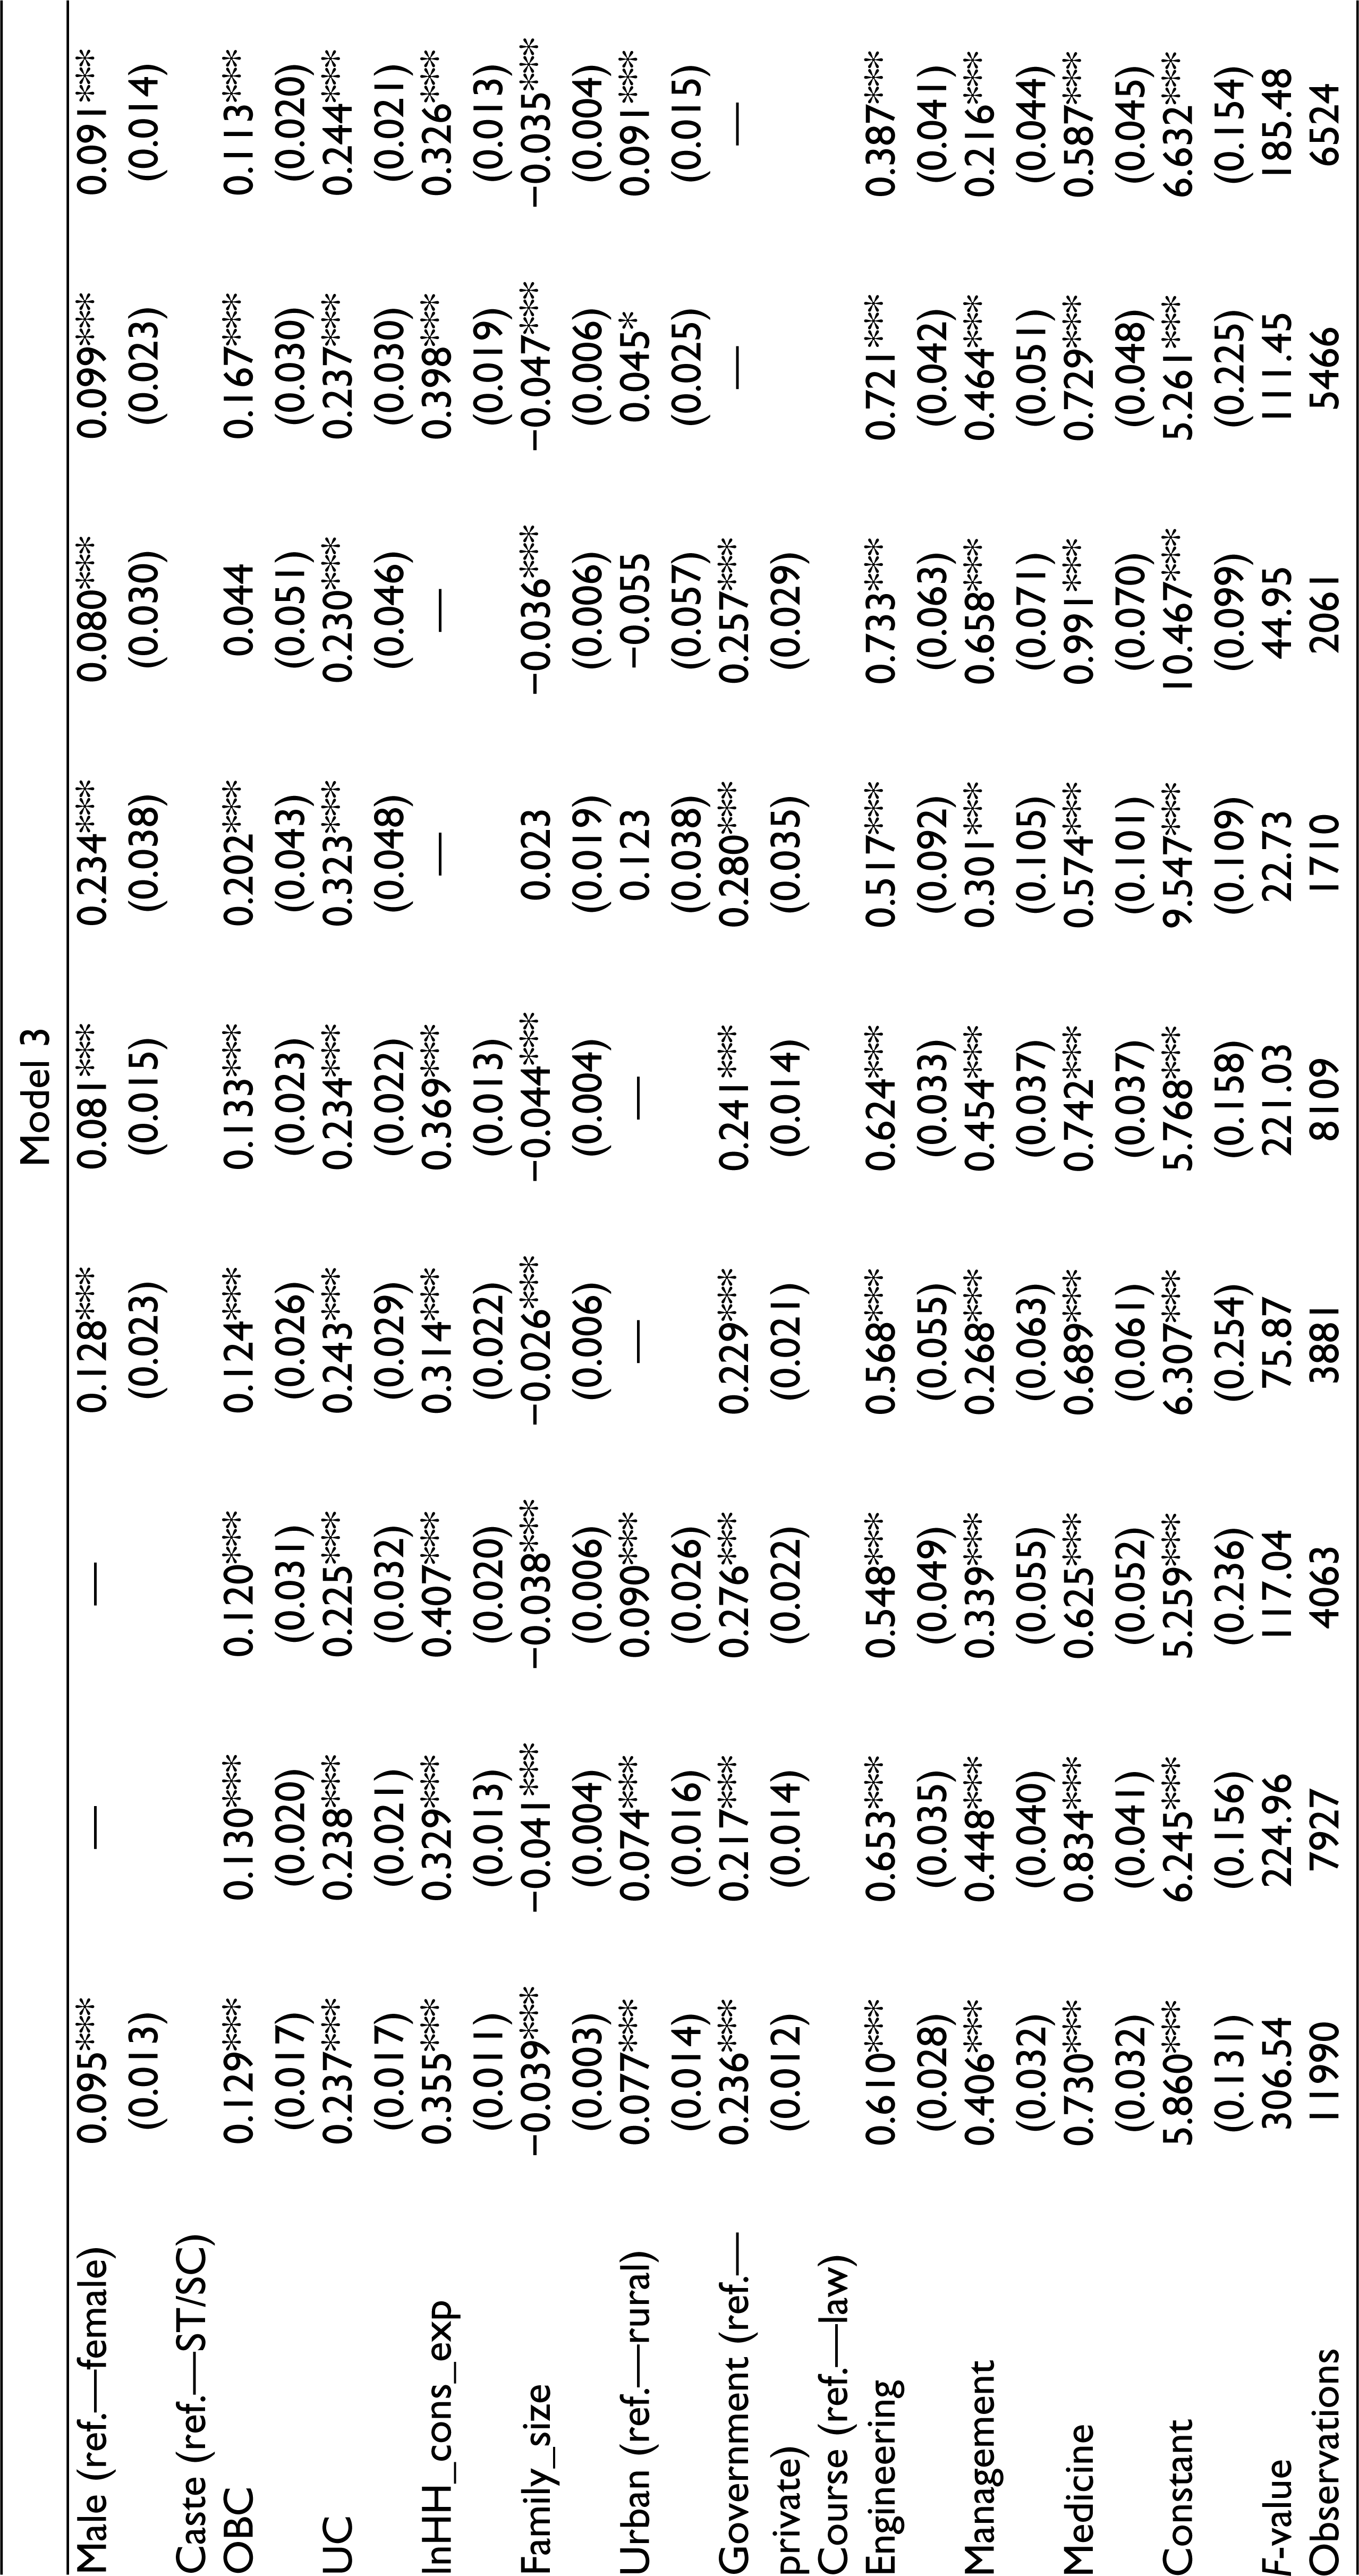
Variations in household spending on PHE are also prevalent across social groups as caste is found to be statistically significant in the robust OLS results. As expected, the average expenditure on SC/ST students was reported to be considerably lower than UC students. In particular, UC students and OBCs spent 23.2% and 16.4% more than SCs/STs, respectively (goes in line with the findings of Choudhury, 2019; Sarkar, 2017; Tilak, 2021). Such a difference is found to be more in the case of low-income families. For example, poor students from UCs spend 30.4% more than poor SC/ST students. The results are found to be robust as similar findings are observed in model 3, which controls for institutional factors. Tilak (2021) finds that ST and SC students spend 44% and 24% less on their education than UC students in engineering education in India. Apparently, the majority of SC/ST students come from lower or middle-class families and find it difficult to spend much on education, especially when it comes to costly professional courses. These groups of students are not only spending less on PHE, but their access to it is quite low. According to the 75th education round survey of the NSO (2017–2018), merely 6.8% of students from SC and ST are accessing PHE in India, while it is 38% among OBCs and 55.3% for the UC group.
Estimates show a positive impact of household’s consumption expenditure (a proxy for households’ paying capacity) on their spending on PHE. This finding is in agreement with the literature, which emphasises that income significantly and positively determines the household expenditure on education (Acar et al., 2016; Omori, 2010; Shafiq, 2011; Tansel & Bircan, 2006; Tilak, 2002, 2021). A unit increase in the level of household consumption expenditure increases their spending on PHE by 37.5%. This coefficient value is higher for urban families (39.2%) and female students (42.6%). Similar results are noted in model 3. Undoubtedly, it is evident that households’ paying capacity plays a significant role in household spending on PHE, although the effect varies with social groups and type of institution. Furthermore, the present results confirm a negative relationship between family size and households’ spending on PHE. An addition to the family members results in around 4.7% decrease in per-student household spending on professional education. The effect is higher among urban households (5.1% less spending) and those studying in government institutions (5.3% less spending).
Location of the household also plays an important role in determining the level of investment in PHE. It is evident that the average annual per-student expenditure on PHE in urban areas is 4.4% more than their rural counterparts, and it is more so in the case of poor households and students enrolled in private institutions. In particular, urban poor households were spending 8.1% more on PHE than poor rural households. The OLS coefficient for location is consistent in the main models (models 1–3) as well as in the heteroscedasticity-consistent OLS model. Similarly, those enrolled in private institutions in urban areas are spending 8.6% more than their counterparts in rural areas. These findings go in line with the literature that discusses the inequality in rural-urban spending on education in India (Kanellopoulos & Psacharopoulos, 1997; Panchamukhi, 1990; Tilak, 2002). This may be due to the rural-urban income variations arising out of various earning opportunities, which are comparably more in urban areas. In addition, the socio-cultural differences between rural and urban areas put female students in a disadvantaged position in rural households than boys. However, further research is needed to understand the issue better.
Apart from individual characteristics and household attributes, other factors affecting household investment in education include institutional factors like type of institution and discipline/course. Annual average household expenditure on PHE varies widely by type of institution, that is, students accessing private PHE institutions spend 24.8% more than those studying in government institutions. Interestingly, inter-institutional differences in household expenditure are significantly higher among females—female students are spending 29.4% more in private institutions than females in government institutions. This difference is largely due to the high fee charged by engineering and medical colleges in the country, which has been increasing over the years. In addition, this reveals that the growth of PHE by the private sector in India is exploitive in nature as the students from poor households aspiring to access these courses bear the financial hardship. Tilak (2021) finds a positive relationship between the type of institution (public or private) that the student is currently enrolled for undergraduate engineering course and household expenditure on education. Students in private engineering institutions spend about 61% more on education than those studying in public institutions.
Students accessing medical education are spending 67.3% more than law students, which is taken as the reference category in robust OLS estimation. This is followed by engineering (59% more) and management (42.1% more)—making medicine course the costliest professional discipline. It is apparent as tuition fees charged for medical courses are much higher than other professional courses (especially in private institutions), which results in differences in household expenditure. In addition, several medical colleges in India charge a capitation fee at the time of admission. Although there are inter-course differences in spending (arising out of variations in fees), the extent of disparity widens further in the case of males, urban and rich households. For instance, males attending medicine and engineering courses spent 77.7% and 63.3% more than males in law courses, respectively. But, the course-wise variations in household investment in higher education are an interesting domain for further enquiry, particularly in the context of declining demand for engineering courses in India. It is important to find out the changing investment preferences of Indian households in higher education over the years.
Conclusion
Using the latest education round data of the National Statistical Office, the article provides an empirical account of the socioeconomic and institutional factors determining household expenditure on PHE in India. It has analysed the inequality in household spending on fee and non-fee items separately by students’ socioeconomic and institutional settings. We find that a typical Indian household spends around half of its annual consumption expenditure (a proxy for annual family income) per-child per year for accessing professional education, and this share varies significantly between the poor and the rich. Regression results reassert pro-male bias in household expenditure on PHE with an additional preference among poor households. Similarly, students enrolled in private engineering institutions spend more than those studying in public-funded institutions, and interestingly, this gap is not only due to the difference in the payment of fees, as expected, but also in other expenses such as books, stationery, uniforms and private tuitions.
This study has largely considered the demand-side factors to understand the determinants of household spending on PHE in India and does not include supply-side variables due to the limitations of the NSO data used in this study. For instance, the household expenditure function would have been estimated better with the inclusion of supply-side factors such as the quality of PHE institutions, institutional support to students in terms of scholarships and fee-waivers and student loan market conditions in the analysis. Therefore, in further research, the focus might be expanded to include supply-side determinants of household spending on PHE and other related aspects. Further research might focus on looking at the household spending on some specific costly disciplines such as engineering, medicine and management. Another area for further enquiry should be to link the pattern of household spending on professional education with access to student loans, which is considered an alternative to costly higher education in the policy space.
Nevertheless, this article makes a significant contribution to the literature as there are limited studies on household expenditure on PHE in India. It also offers critical policy suggestions for the financing of PHE sector in India. For instance, while increased private participation has opened up possibilities of better access to PHE, it has widened inequalities in access to quality PHE in the country as revealed by the striking variations in household expenditure on these courses. The findings of the study also reveal inequality in sharing of cost in PHE as poor households spend a significantly higher share of their income as compared to rich households. This calls for an urgent need to increase public spending on PHE in India, particularly in the interest of the most vulnerable and marginalised students. Specifically, the study recommends the government of India and state governments to offer scholarships to needy students accessing PHE in the country. This would certainly help make PHE equitable and inclusive in India as aimed in the NEP 2020.
Availability of Data and Material
This study is based on a national survey conducted by the National Statistical Office (NSO) from July 2017 to June 2018, Ministry of Statistics and Programme Implementation, Government of India. The data are publicly available at
Footnotes
Declaration of Conflicting Interests
The authors declared no potential conflicts of interest with respect to the research, authorship and/or publication of this article.
Funding
The authors received no financial support for the research, authorship and/or publication of this article.