
Abstract
There have been several interventions by the government to promote financial inclusion in India. This article attempts to measure financial inclusion in India during 2001–2019, segregating states/union territories and using three dimensions: availability, access and usage of banking services. The index value of each dimension is calculated with the help of the method ‘Max–Min procedure to convert indicators into indices’, and overall index value of financial inclusion is obtained by taking the geometric mean of the three index values of the three dimensions. A fluctuating trend of financial inclusion reflects a less satisfactory performance. Financial inclusion is also evaluated following the CRISIL’s (Credit Rating Information Services of India Limited) criteria of measurement. The lack of a modernised financial system and financial illiteracy of the vulnerable groups, especially in remote areas, often holds back the mission to run efficiently. Finally, the nexus between financial inclusion, human development and the growth and development of India is studied with the expectation that people’s empowerment might help the mission to be successful. The states and regions that need attention are identified and required improvements in banking services are examined through an environmental analysis based on the existing system.
Keywords
Introduction
Financial inclusion attempts to ensure the availability of and access to financial products and services to the privileged as well as underprivileged sections of society at an affordable cost and timely manner. Although the privileged section can reap the advantages of these services at an ease, the unprivileged section seeks the government’s help in this regard. Human development can only certify making the deprived citizens educate to enjoy the benefits of financial inclusion programmes. According to the data of the Reserve Bank of India (RBI, 2015) 1 , rural-urban combined population below the poverty line was 37.20% in 2004–2005, 29.80% in 2009–2010 and 21.92% in 2011–2012, based upon MRP (Materials Requirements Planning) consumption and following the Tendulkar Committee estimates in India. This estimate for 2017–2018 was 22.8%, which was derived from the Consumption Expenditure Survey report prepared by the National Statistical Office (NSO), using the inflation-adjusted state-wise poverty lines drawn by the Planning Commission in 2013, and based on the Tendulkar Committee Methodology of estimating poverty. The data show almost a declining trend in poverty though the data for 2017–2018 slightly adds to the change. While considering the distribution of income in India, the data reflect that for the top 1% share of income, income inequality has gradually increased from 15.5% in 2000 to 21.7% in 2015, and for the top 10% share of income, this inequality increase is from 40.9% to 57.1% in the same period. However, for the bottom 50% share of income, this inequality has been gradually declined from 18.5% in 2000 to 13.1% in 2015. The inequality estimates for 2020 are the same as in 2015. Again in wealth inequality, the data reflect that wealth inequality for the top 1% share of wealth has been gradually increased from 23.5% in 2000 to 31.8% in 2015, and for the top 10% share of income, this inequality increase is from 54.8% to 64.0% in the same time. However, for the bottom 50% share of income, this inequality has gradually decreased from 8.3% in 2000 to 6.0% in 2015. For 2020, these inequality estimates are 31.7%, 63.9% and 6.0% respectively 2 . Therefore, inequality in distribution is a serious concern in India to step on the development ladder; the reduction of which may help human development and might ensure financial inclusion policies work well. Conversely, the government’s initiatives for financial inclusion can promote inclusive growth in India. Though some previous works have been done on analyzing financial inclusion or human development or sometimes both at the Indian level, any study related to the conceptual and empirical building of the nexus between financial inclusion, human development and the growth & development of a nation is scarce for India at sub-national level spanning over the last two decades.
Objectives of the Study
In line with the issues discussed, the present article attempts to analyse financial inclusion with human development in India across states/union territories and for the entire economy, over the period 2001–2019. The specific objectives of the study are:
To analyse India’s performance in achieving financial inclusiveness on the basis of three crucial dimensions of banking services—availability, access and usage. To estimate the values of the financial inclusion index (FII) in terms of the above three dimensions of banking services. To evaluate the relationship between financial inclusion and human development. To examine the regional differences in financial inclusion in terms of banking services, and human development. To conduct an environmental analysis for policy prescriptions.
Significance of the Study
Sustainable development goals (SDG) of the United Nations (UN) recognise financial inclusion as an integrated spectrum to target the goals such as reduction of poverty and inequality; ensuring equitable quality education, and well-being to all; providing access to effective, accountable, and inclusive institutions at all levels to convey justice, and so on. Chibba (2009), Park and Mercado (2015) and Dahiya and Kumar (2020) are of the view that financial inclusion is an instrument to eliminate or reduce poverty and inequality, and thereby, certify inclusive growth.
Financial inclusion is usually assessed by the activities of banks, Micro Finance Institutions (MFI), insurance providers, etc. Several studies such as Sahu (2013), Garg and Agarwal (2014), Iqbal and Sami (2017), Omar Khayam and Tasneem (2018), Alam and Saha (2020) and Saha and Alam (2021) have examined financial inclusion to make development sustainable. Several banking policies and government initiatives are of help in financial infrastructure development, but a steady customer base is also important in this regard. The study by Maity (2020) points out the importance of banks to being financially strong to serve commons. The present study tries to assess financial inclusion through the operations of banks with diversified customers. Since human development makes people financially educate, so it is expected that financial inclusiveness may uplift the standard of living, and thereby, the well-being of commons will ensure sustainable development.
In connection with this, the methodology used in the study is discussed in the next section. The third section deals with data analysis and findings. Finally, the conclusions of the study are presented in the fourth section.
Methodology
En route to the conceptual framework of the study, the aspects of financial inclusion and human development are discussed, the relationship between financial inclusion, human development and growth are narrated, and then the data and methods used for the study are illustrated in this section.
Aspects of Financial Inclusion
Financially excluded people in the economy are those who have no or less access to financial facilities because of their vulnerable economic situation, ignorance or sometimes for the absence of legal identity of them. They are generally the people of rural or semi-urban areas working in unorganised sectors, unemployed persons, children, women, old and physically challenged people, etc. Geographical remoteness often becomes a barrier to the mainstream institutional players operating in the underdeveloped regions. Less financial resources based on the customers also call for the poor functioning of the financial system, and therefore, the role of the government is imperative. Garg and Agarwal (2014) have assessed financial inclusion and exclusion of the Indian economy over the period 2010–2013, considering the role of banks and initiatives taken by the government. Since financial inclusion aims to provide economically priced financial services to the negligible section of society for financial independence and lessening the reliance on charity or other funds which are not sustainable, so it helps inclusive growth. Shah and Dubhashi (2015) have reviewed financial inclusion in India to analyze inclusive growth through the initiatives by the banking authorities, government and RBI.
The term ‘Financial Inclusion’ was coined in April 2005, in India, by Y. Venugopal Reddy, the then Governor, RBI (Reddy, 2005). Mangalam in Puducherry was the first Indian village where the villagers were privileged to get the benefits of financial inclusion. However, financial inclusion was initiated in India under British rule through the Co-operative Society Act in 1904, to help the rural poor. The establishment of the State Bank of India (SBI in 1955), the nationalisation of commercial banks (in 1969 and 1980), the setup of the Regional Rural Bank (in 1975) and National Bank for Agriculture and Rural Development (NABARD in 1982) were notable steps in this direction. The basic initiatives and policy measures by the RBI and Government of India (GoI) for financial inclusion are opening up of bank branches in rural areas through rural infrastructure development; simplification of savings bank account opening form and Know Your Customer (KYC) norms; introduction of Kisan Credit card (KCC in 1998) and General Credit Card (GCC in 2005); providing the benefit of No-frill accounts, which in the later phase transformed into Basic Savings Bank Deposit Accounts (in 2010); promoting ATM (Automated Teller Machine), insurance, mutual fund, pension services; creating Self Help Group (SHG)—Bank linkage programmes; utilization of Business Correspondents (Non-Governmental Organisations, Micro Finance Institutions, SHGs and other civil society organisations as intermediaries) for providing financial and banking services to the common people; creating funds for financial inclusion like Financial Inclusion Fund and Financial Inclusion Technology Fund (Rangarajan, 2008); introducing financial literacy programmes; extending help in overcoming language barrier; promoting National Rural Financial Inclusion Plan (NRFIP in 2008); introduction of Aadhar Card (Unique Identification Number in 2010) for the Indian Nationals, Swabhiman (in 2011), Pradhan Mantri Jan Dhan Yojana (PMJDY in 2014), the National Strategy for Financial Inclusion (NSFI in 2020), PM Shram Yogi Man Dhan Yojna (in 2021), etc.
Various indices have been formed and are used to measure financial inclusion worldwide. The Alliance for Financial Inclusion Core Set tried to establish a common measure of financial inclusion with the dimensions—access and usage of financial services (Alliance for Financial Inclusion [AFI], 2011). The Global Findex Report analyzes the data to exhibit the use of financial services by the people of a nation. Sha’ban et al. (2020) assessed financial inclusion using Financial Access Survey data from International Monetary Fund (IMF) to construct a multidimensional financial inclusion index for a global sample of 95 countries. Likewise, in India, the Inclusix index was developed by CRISIL (Credit Rating Information Services of India Limited), in 2013, to study financial inclusion. The index combines the three critical indicators of basic financial services—bank branch penetration, deposit penetration and credit penetration into one single metric. Later on, data on life insurance, pension scheme, and micro finance were incorporated in the index. In our study, financial inclusion in terms of banking activities in India is assessed forming a composite index and with the help of CRISIL’s criteria of measurement as well. Many research works such as Mittal and Shukla (2014), Shah and Dubhashi (2015), Alam and Saha (2020) and Saha and Alam (2021) have used CRISIL’s data or the indicators for assessing financial inclusion in India. Sahu (2013) used the dimensions such as banking penetration, availability of banking services and used to score financial inclusion and to study the relationship between financial inclusion and the demography of different regions in India. In recent time, the RBI, in consultation with the government and other regulatory bodies in India, has constructed a financial inclusion index (in 2021) as a comprehensive measure incorporating banking, investments, insurance, postal and pension sectors.
Aspects of Human Development
Human development is all about the expansion of the well-being of people, rather than simply considering the growth of the nation where they reside. The Human Development Index (HDI), developed in 1990, is a composite index to assess the economic and primary social development of a nation, and thus human development. The indicators used in this index are life expectancy, education and per capita income. HDI emphasizes the abilities of individuals to unleash their optimum potential. Unlike the HDI, there is an Inequality-adjusted Human Development Index (IHDI), which combines a nation’s average achievement for the above three indicators taking into account how those achievements are distributed among the people of a nation. Though IHDI exhibits a loss in HDI due to inequality, there is not yet any consensus about how to measure inequality in HDI. Among the different types of inequalities, where economic inequality tries to ensure adequate opportunities, social inequality tries to establish equal rights and opportunities for development for all in a nation with the aim of reducing the gap between rich and poor. Therefore, the use of HDI is meaningful in the study instead of any other development indices.
Relationship between Financial Inclusion, Human Development and Growth of a Nation
A few past literatures have established the relationship between financial inclusion, human development and the growth of nations. Kuri and Laha (2011) tried to find out the association between financial inclusion and human development for some selected states in India in 1993–1994 and 2004–2005. Empirical evidence suggested that an all-inclusive financial system would facilitate human development through proper dealings with the distortions in human development. In the conceptual framework, the study focuses on the fact that since financial inclusion makes better available and usage of banking services in the economy, it enhances economic opportunity. Gradually, the capability enhancement of commons helps reduce poverty and ensures human development. Nanda and Kaur (2016) using data from 68 countries from 2004 through 2008, to 2012, even established a strong and significant correlation between financial inclusion and human development. The study revealed that not only human development, but income levels of the countries positively moved with financial inclusion. Removal of financial illiteracy and technological backwardness could help global development and prosperity. A notable attempt was also made by Raichoudhury (2016) to measure financial inclusion using a cross-country data set from the Financial Access Survey, and with the help of an index developed by Sarma (2012). From the empirical analysis of the relationship between financial inclusion and human development across the countries for the year 2013, the study found a significant positive correlation between them. Ababio et al. (2021), after analysing the data of twenty frontier markets spanning from 2005 to 2014, concluded in their study that low human development is the root cause of low financial inclusion, and promoting financial inclusion through the banking sector would be effective to stimulate human development. Even Arora and Kumar (2021) established that financial inclusion through banking operations acts as a key to human development in the Indian context. Most recently, the study of Abdelghaffar et al. (2022) reveals that in low and lower-middle-income countries; financial inclusion has a higher effect on human development than in high and upper-middle-income countries.
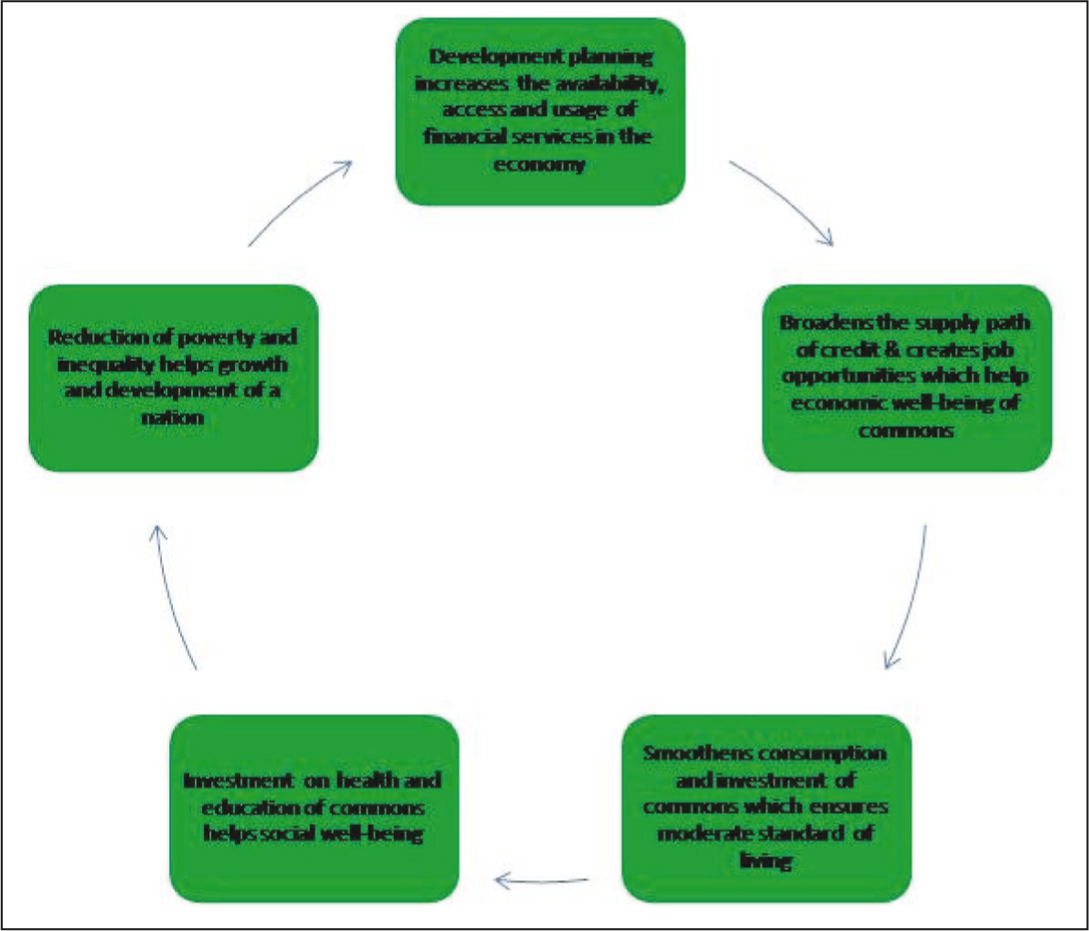
In view of the fact of having relationship between financial inclusion, human development and the growth of nations, the present study focuses on the availability, access and usage of financial products and services which are crucial for financial sector development, human development, and subsequently growth of a nation. The dimension—availability is assessed in the study from the supply of financial services by the government or government-approved institutions to the citizens. The other two dimensions—accessibility and usage, represent the scope and capability to use the financial services by the residents, which mostly come from the demand for financial services, and upon their critical thoughts based on the level of literacy to plan for future. The supply of credit by formal financial institutions actually creates the path of financial inclusion in the society. Access to financial services opens the doors to the economically backward families allowing them smoothening of consumption and investment, and to spend on education and health. Further, access to credit opens up job opportunities, enables existing businesses to expand, and thus, reduces poverty and inequality. Subsequently, it raises the demand for credit further and the process continues. Therefore, the growth and development of a nation are subjected to the positive association between financial inclusion and human development, which the present study intends to exhibit. This nexus is represented in Figure 1.
Data and Methods Used
The study uses secondary data at an aggregate level and also segregating the states/union territories in India, for the period 2001–2019, to assess financial inclusion in terms of banking services, and human development.
The study considers the three crucial dimensions of banking services—availability, access and usage to assess financial inclusion, which are evaluated by considering the following indicators.
Availability: Number of bank branches 3 in per hundred thousand of population 4 .
Access: Combining the numbers of deposit and credit accounts 5 per hundred thousand of population.
Usage: Credit-deposit ratio 6 as a proportion to India’s Gross Domestic Product (GDP) 7 in per hundred thousand of population.
Calculation of Index Value for Financial Inclusion
On the way to measure financial inclusion considering the three crucial dimensions of banking services, three separate indices were formed with respect to the specified indicators under each dimension. The index values for each dimension were calculated considering the data of 2001–2019, and with the help of the method of “Max–Min procedure to convert indicators into indices”. This method of normalization performs a linear transformation on the original data. The fundamental way to convert an indicator value (V) into an index value (I) is given by,
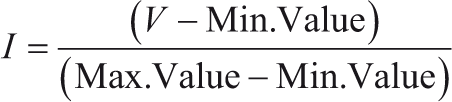
In the formula, I is a relative index with a scale of 0–1, in which ‘1’ is the ideal state for each dimension. Min. Value is the minimum admissible value or the lower bound and Max .Value is the maximum admissible value or the upper bound of the data to be studied under each dimension. The bounds have constant values because of the pre-determined time horizon for analysis, and therefore, any incorporation of input for normalization outside the original data range would encounter an error and distort the analysis. This approach of data normalization is used by UNDP (United Nations Development Programme) for the computation of some popular development indices such as the Human Development Index, Gender Development Index, Human Poverty Index, and so on. Rahman (2012) exhibited that the measurement approach used in the literature on human development is also applicable to measuring financial inclusion. Since normalizing the data attempts to put equal weight to all dimensions, so in our study equal weight is given to each dimension. Moreover, there is not yet any consensus in literature that which dimension is more important than others. Subsequently, the geometric mean of the index values of three indices for each year has been calculated to get the overall value of FII or in a particular year. In this manner, the FII values in India have been calculated for the entire period 2001–2019, for each state/union territory and overall. Higher the index value, the higher is the rate of financial inclusion; and vice versa. Like our study, Kuri and Laha (2011), and Sahu (2013) have also followed this UNDP approach in measuring financial inclusion in India.
After the year-wise values of FII, Indian states/union territories are ranked according to the estimated values during the study period. The extent of financial inclusion is also examined in the study following the criteria developed by CRISIL. Graphical representations of the data have been exposed to show the trends of financial inclusion and human development in India during 2001–2019. The correlation between financial inclusion and human development is estimated to establish any significant relationship between them. Consequently, a regional analysis in the study signifies the status of financial inclusion and human development, and the discrepancies in the region-wise performances. Finally, an environmental analysis through a PESTEL (Political-Economic-Social-Technological-Environmental-legal) framework is done to detect the required improvements in the banking sector in attaining financial inclusiveness.
Analysis, Findings and Related Discussions
In this section, we attempt to analyse financial inclusion, human development, and the relationship between them for India during the period 2001–2019.
Assessment of Financial Inclusion
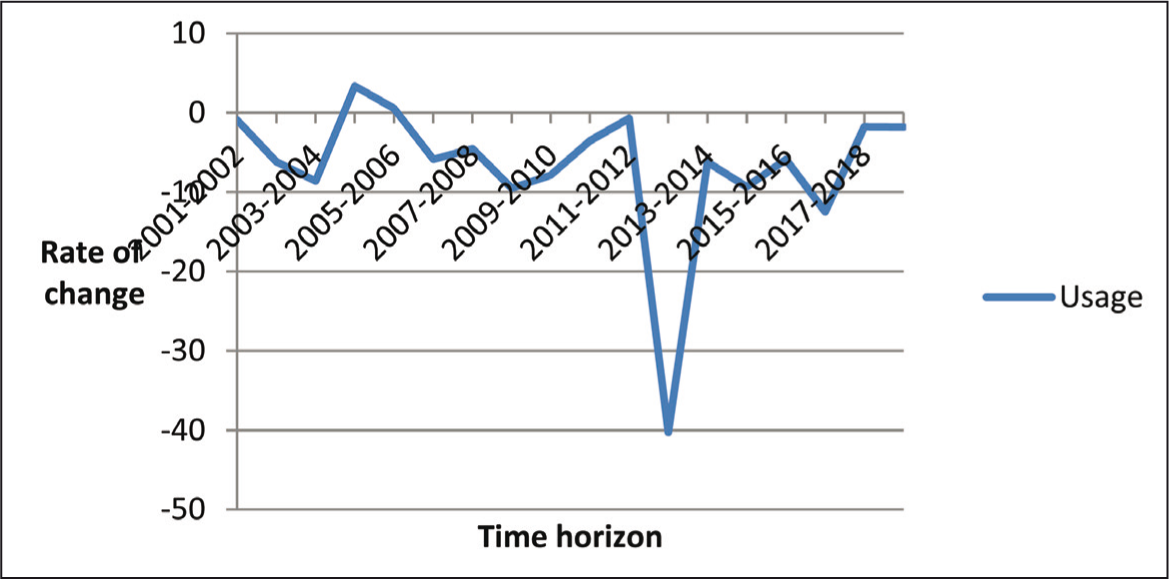
Once to address the first objective and discuss financial inclusion in terms of the three dimensions of banking services—availability, access and usage, during the period 2001–2019, the rates of change of the dimensions instead of considering only the mere numbers have been considered for the entire economy. The wide range of fluctuations in the rates of change of the three dimensions of banking services have been perceived during the assessment period while evaluating the performance of the banking sector. None of the dimensions has shown any trend, which Figures 2, 3 and 4 depict.
Figure 2 exhibits the rate of change in the availability of banking services that had increased over time in India since 2001 and up till 2014, with certain fluctuations in the trend. But a steady fall had been perceived after that, which again started rising in 2018. After the formal launch of the Financial Inclusion Mission (in 2005) in India, the government accommodated a considerable fund for infrastructural development through the expansion of bank branches and modernization of the system in the developed and underdeveloped regions. This initiative was taken to make the financial inclusion programmes workable which were already in existence and to promote the new programmes which were planned for. During 2011–2014, the government’s initiative in this regard made financial services better available to the citizens than ever before. It was at peak during 2013–2014. Data show that Centre and State combined development expenditures on average increased by more than 100% (104.71% and 105.78%) during 2000–2005 to 2005–2010 and 2005–2010 to 2011–2015 8 . Since financial inclusion is not an independent objective of the SDGs but it is essential in achieving many of the goals as discussed, so the year 2015 onwards, India (being a member State of the United Nations (UN)) started focusing on increasing the accessibility of financial products and services to all types of citizens to make the growth inclusive.

Figure 3 shows that people’s access to financial services started to increase from the year 2003 in India up till 2009, and after that, it experienced a slight dim. The year 2012 onwards again it started to increase and was high during the period 2013–2015. India committed to Millennium Development Goals (developed by UNs) in 2000. Consequently, it became necessary to bring the diversified people of the nation under a single roof to offer the benefits of financial inclusion programmes and eradicate poverty. The Kisan Credit Card scheme (introduced in 1998) of the government, issuance of the General Credit Card (in 2005), NRFIP (in 2008 to bring 50% of financially excluded households of rural areas including cultivator and non-cultivator into the banking sector by 2012) raised the demand for bank credit in rural and sub-urban areas. The World Bank data 9 show that fixed capital formation (percentage of GDP), also called investment, was high in India during 2007–2011, which helped escalate the aggregate demand, and further demand for credit in favour of investment through the multiplier effect. Therefore, the gross savings (percentage of GDP) was in peak in 2007 and it was moderate up to 2012. Meanwhile, planning for the smooth functioning of Self Help Groups, endorsement of Basic Saving Deposit Accounts instead of no-frill accounts (in 2010), Swabhiman movement (in 2011 to facilitate the people by opening up bank accounts; providing need-based credit and remittance facilities), PMJDY (in 2014), Sukanya Samridhi Yojana (in 2015)—all these moves of the government helped opening up of bank accounts to do the necessary transactions. Thereby, the accessibility, which is judged by combining the number of deposit and credit accounts in the study, was increased in this time phase. However, people’s interest in banking operations began to low down after that (due to the effect of the Demonetization Policy in 2016) and this demotivation persists in the Indian economy resulting in low gross savings, investment, and GDP growth.

Figure 4 shows wide ranges of fluctuation over usage during the entire assessment period. Actual usage of banking services is measured through credit–deposit ratio as a proportion to India’s GDP in the study. The volumes of credit and deposit have been considered in this regard. There has been a more or less steady increase in credit–deposit ratio in India over the assessment period. It was 70.27% in the first decade and 77.41% in the second decade on average. The year 2017 is marked as an outlier of the second decade (73.8%) 10 . During 2001–2019, India’s data on GDP growth reflects a quite fluctuating trend. Though it started mounting in 2002, the Global Financial Crisis (in 2008) overturned the boom and a deep down was perceived in 2008. However, the large domestic market of India and stringent financial regulations could make a fast recovery and soon it reached its peak in 2010. A perpetual fall in the growth rate of GDP after 2010 and up till 2012 was also successfully managed by the government through fiscal—monetary policy initiatives, and thereby, again GDP started rising. However, a steep fall in its growth rate from 2016 onwards was due to the effect of the government’s demonetization policy. Although the government marks this phenomenon as a temporary and cyclical problem which might eventually wash off, still it persists in the economy (from the data of the World Bank) 11 . Every bit of these reasons is considered to be liable for the fluctuating path of usage with a radical deep down during 2012–2013.
Subsequently, to address the second objective and to calculate the values of FII year-wise, combining the data of the three dimensions of banking services per hundred thousand of population, the method of ‘Max-Min procedure to convert indicators into indices’ has been employed for the period 2001–2019. At first, the index values of each dimension for each year for the states/union territories are calculated 12 . Then the overall values of FII are derived, which is depicted in Table 1.
Values of FII in Terms of Banking Services.

In the next stage, from the year-wise values of FII for the states/union territories in India, average values are calculated for the two decades separately (2001–2010 and 2011–2019) and for the entire assessment period (2001–2019), in favour of the three dimensions of banking services. While considering the averages of the three dimensions segregating decades and for the entire assessment period for each state/union territory, arithmetic mean is used as usual. However, geometric mean has been used while getting the values of FII in overall (considering the three dimensions) for any decade or for entire study period. The average index values of financial inclusion segregating states/union territories over the entire assessment period are shown in Table 2.
Table 2 reflects that the average value of FII was highest for the dimension—usage and followed by the dimensions—availability of and access to financial services during the entire assessment period. In the first decade also the average value of FII was found highest for the dimension—usage. However, in the second decade, the average values of FII were remained high for the dimensions—availability of and access to financial services. The other dimension—usage showed a less satisfactory result in contributing to financial inclusion.
Average Values of FII in Terms of Banking Services during 2001–2019.

Even following CRISIL’s criteria 13 of measuring financial inclusion, it is found at all India levels that the average values of FII for the entire study period are below the average level for the dimensions—availability of and access to financial services, but the score is above average for the dimension of usage. Therefore, restructuring the policies of the banking sector is a prerequisite. Mittal and Shukla (2014) have discussed the required improvements of banking services in India in this regard.
After commencing the average values of FII over the entire assessment period and the two decades separately, the ranking of the states/union territories for the three dimensions and overall are done and presented in Table 3.
Rank of the States/Union Territories in Terms of Banking Services.
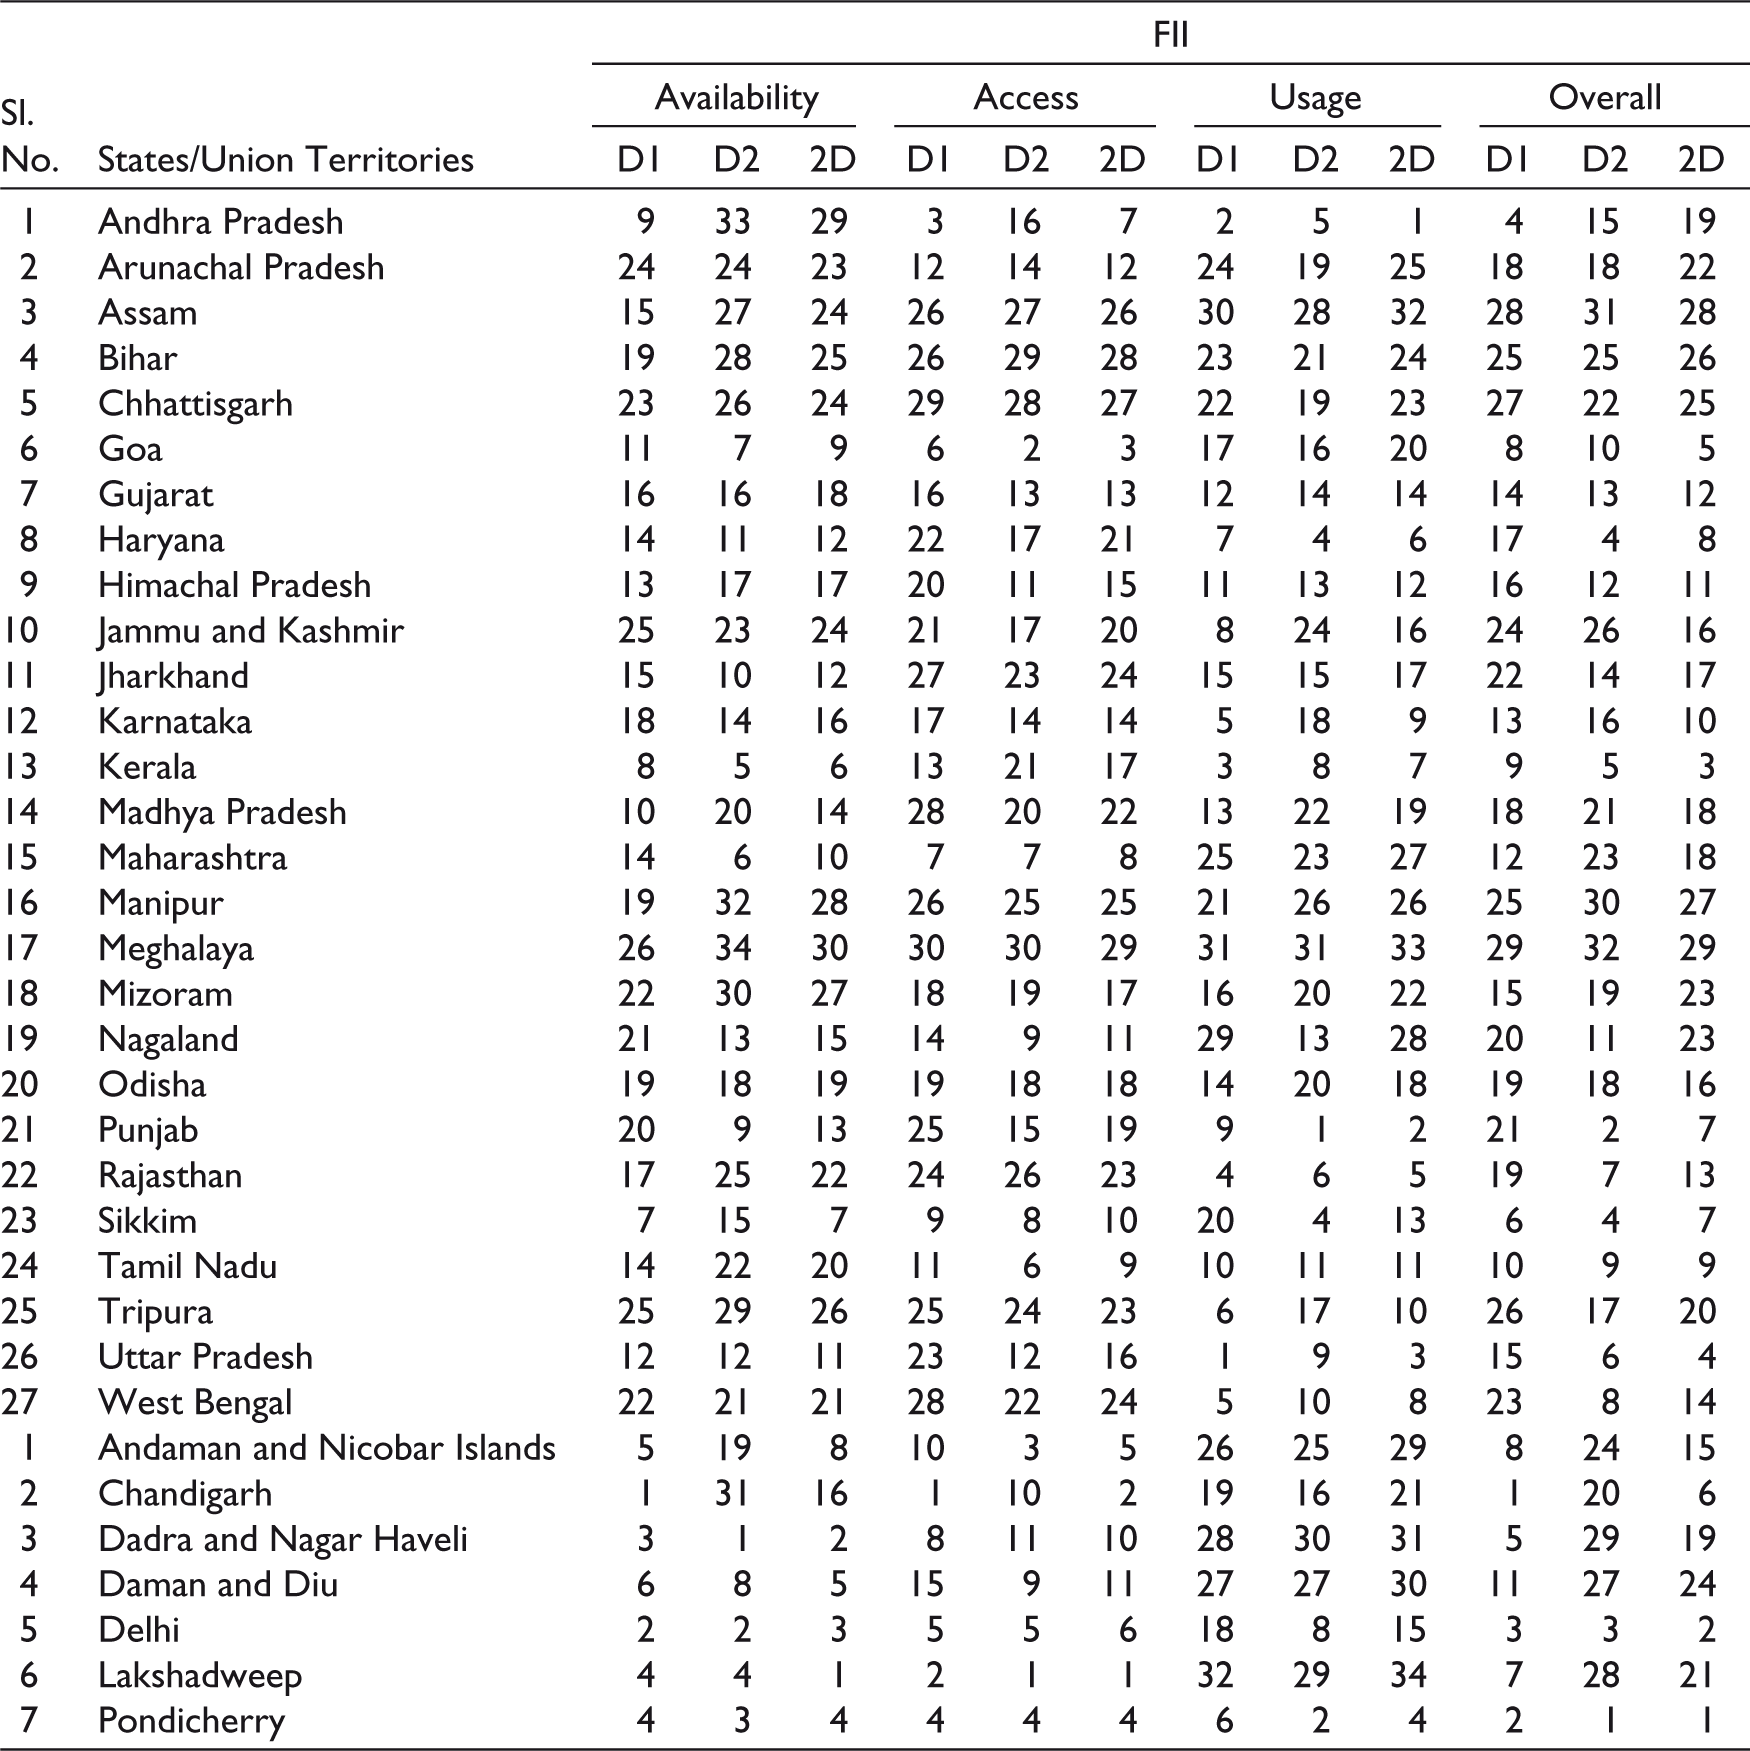
From Table 3, the top five and bottom five performers are identified and presented in Table 4.
Table 4 highlights the following facts as regards the performance of the states/union territories.
Performances of the States/Union Territories in the Dimensions of Banking Services.

The availability of banking services during 2001–2019 has remained satisfactory for the people residing in Delhi, Lakshadweep, Pondicherry, and Dadra and Nagar Haveli in a consistent manner.
The people of Lakshadweep and Pondicherry have steadily accessed banking services during the entire study period.
Access to financial services does not always imply utilization of the services. Though Lakshadweep and Pondicherry are ahead of access to financial services, Andhra Pradesh has done well in terms of usage during the entire study period.
The availability of banking services has remained low in Meghalaya during the entire study period.
The people of the states such as Meghalaya, Chhattisgarh and Assam seek awareness to improve the access to banking services.
Lakshadweep, Meghalaya, Assam, and Dadra and Nagar Haveli need attention to improve the usage of banking services.
The performance of Meghalaya has remained low in terms of all three dimensions of banking services during the entire assessment period.
In Pondicherry, maximum number of people were able to grasp the facilities of banking services compared to any other state/union territory in India during the study period.
Assessment of Human Development
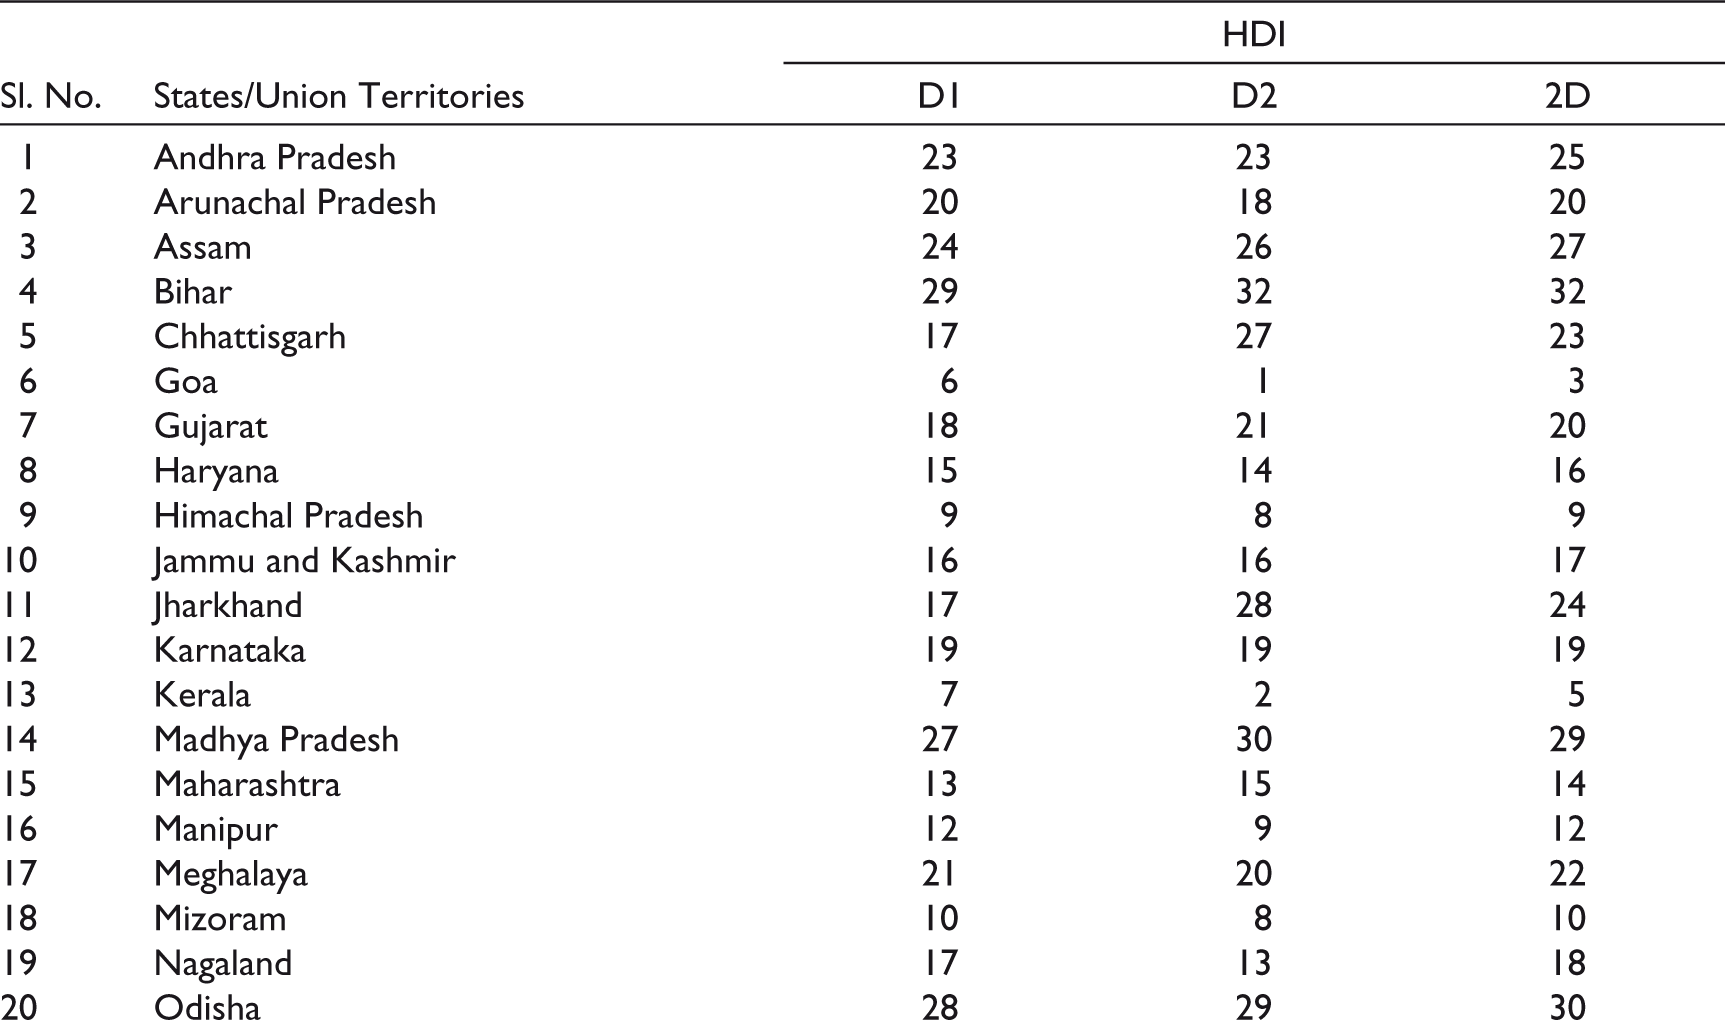
To deal with the third objective, ranking of the states/union territories in India in terms of the Human Development Index (HDI) has been done 14 for the two decades separately and over the entire study period, which is depicted in Table 5.
Rank of the States/Union Territories in Terms of Human Development.

In Figure 5, the index values of the three indices of human development—health, education and income are plotted over the entire assessment period 15 . HDI value is the geometric mean of the three index values (three dimensions) of HDI, with putting equal importance on each dimension. Life expectancy at birth (to assess a long and healthy life) is considered for the health index and gross national income per capita (to assess the standard of living) is considered for the income index. The education dimension is the arithmetic mean of the two education indices: average years of schooling (to assess access to knowledge of the older generation) and expected years of schooling (to assess access to knowledge of the older generation). The method of ‘Max–Min procedure to convert indicators into indices’ is followed for the normalization of data. UNDP sets the ‘Goalposts’ of the maximum and minimum limits on each metrics. With the actual value for a given country, and the global maximum and minimum, the dimension (indices) value for each metric is calculated. The index values lie between 0 and 1.
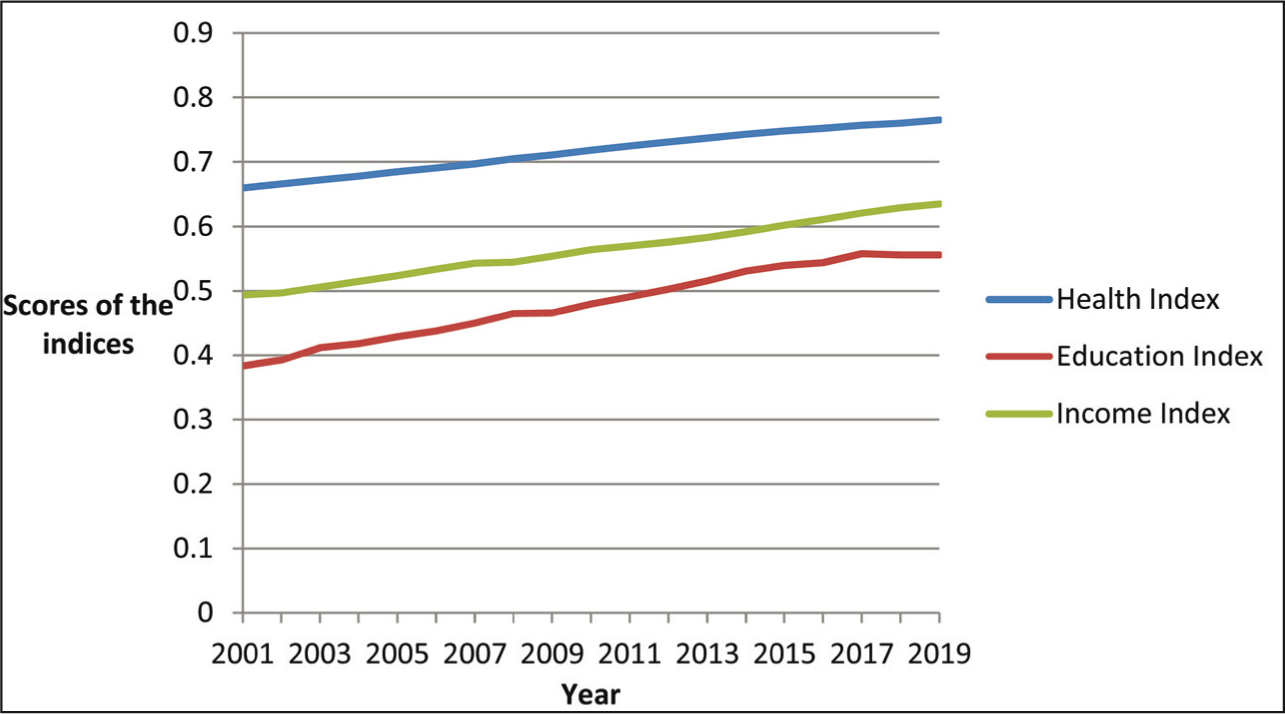
Figure 5 depicts that the three components of HDI have persistently performed well.
Relationship between Financial Inclusion and Human Development
The performances of the states/union territories in terms of financial inclusion and human development have been assessed simultaneously in the study to address the fourth objective. According to the overall values of FII and HDI, the top five and bottom five performers are detected in each category for the two decades separately and for the entire assessment period and presented in Table 6.
The following observations are derived from Table 6.
Performances of the States/Union Territories in Terms of Human Development and Financial Inclusion.
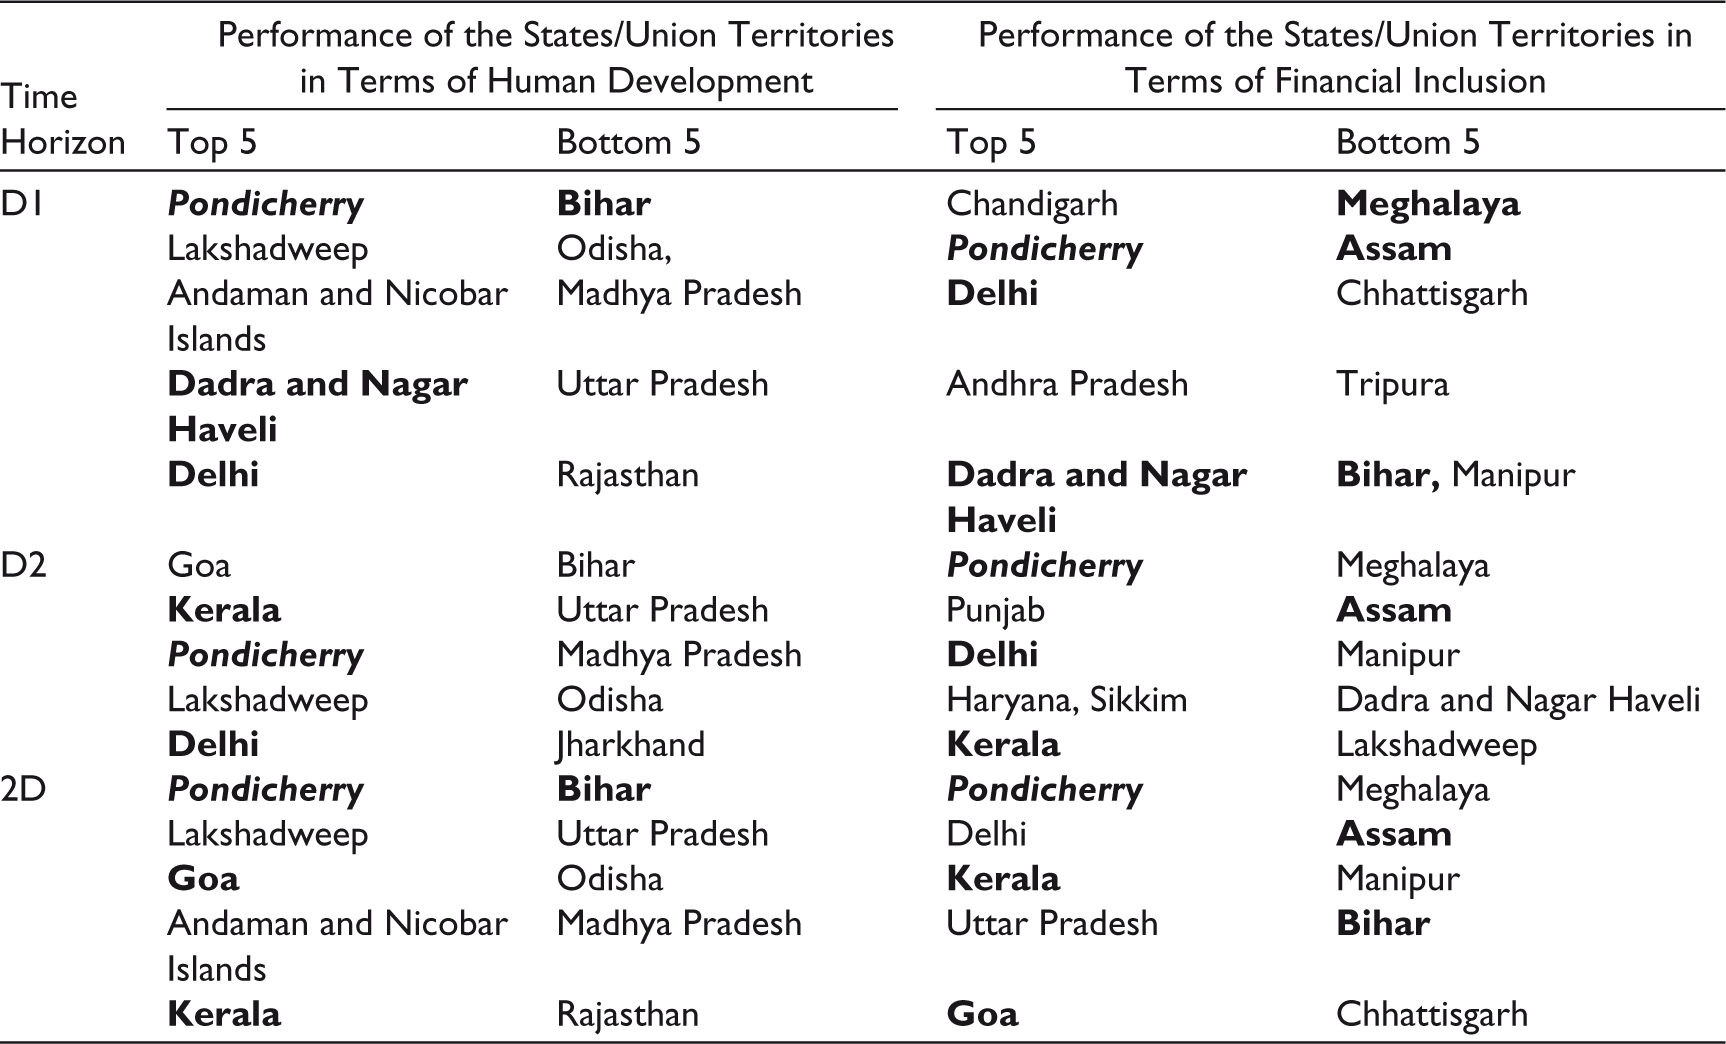
Among the top performing states/union territories in terms of financial inclusion during 2001–2010 and 2011–2019 separately, the analysis reveals that 60% of them are included in the list of HDI as the top performers. Pondicherry is the most consistent good performer among all.
Even among the top-performing states in terms of financial inclusion during the entire assessment period, the analysis reveals that 60% of them are included in the list of HDI as the top performers.
In Pondicherry, both—the success of financial inclusiveness and human development have remained highest compared to any other state/union territory in India over the entire assessment period.
In the north-east states such as Meghalaya, Manipur and Assam, the level of financial inclusion has remained low consistently.
In the states such as Bihar, Uttar Pradesh, Madhya Pradesh and Odisha, the level of human development is always low during 2001–2019.
The trends of financial inclusion and human development over the entire assessment period are shown in Figure 6.
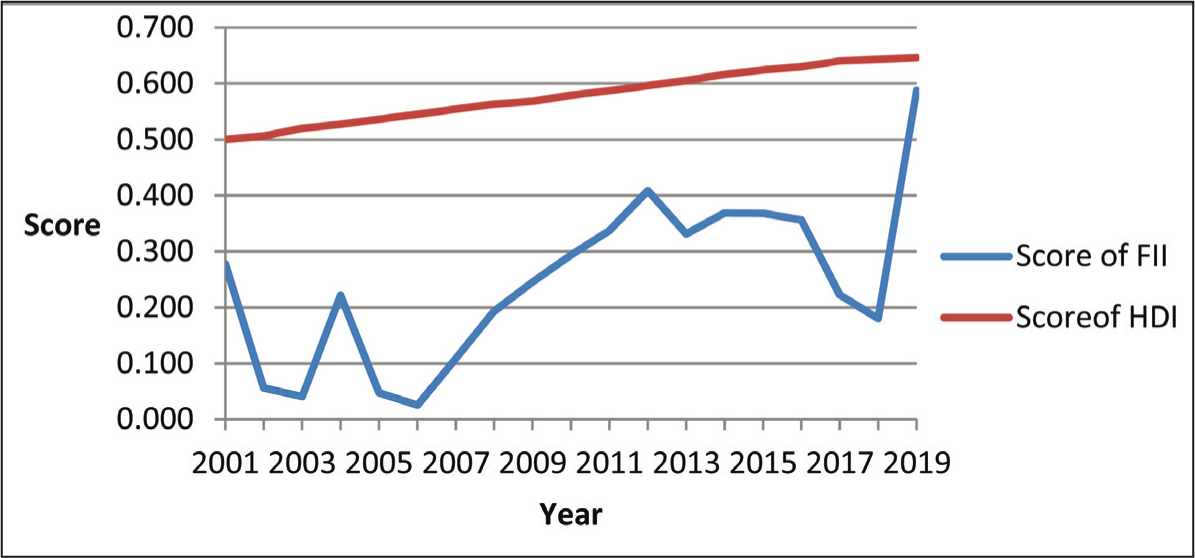
Figure 6 shows an increasing trend in human development, while a fluctuating trend for financial inclusion in India during 2001–2019. The Government’s investment in health and education, and the increase in per capita GDP over the assessment period have resulted in the steady growth of human development. In India, the revision of the National Education Policy, the Supreme Court Order on the mid-day meal programme (in 2001) and then the free and compulsory education bill with the revised mid-day meal programme in 2004 helped in improving the education level. Further, the formation of human capital is closely associated with education and health as an investment in those makes the labour force more productive and efficient to contribute to economic growth. In line with this view, the public sector outlay on social services as a proportion of total expenditure increased from 22.8% in the 10th Five-Year Plan (2002–2007) to 30.2% in the 11th Plan (2007–2012) and was projected at 34.7% in the 12th Plan (2012–2017) in India 16 . According to the budget estimates for fiscal years 2017 and 2018, about 1.17% and 1.28% of India’s GDP were spent on public healthcare services 17 respectively. All these actions ensured school enrolment, primary (percentage gross) and life expectancy at birth, total (years) to increase 18 over time. The renewed focus on attaining social sustainability helped per capita income to increase in the economy which is reflected in the World Bank data 19 .
Though the values of FII were quite fluctuating in the initial phase, from 2007 onwards and until 2012, a steady increasing trend has been observed. It might be due to the effect of the official launch of the financial inclusion mission (in 2005) and the steps towards efficient implementation of the related programmes in India. After that, a more or less staggering trend has been found. A notable fall in 2017 might be a consequence of the Demonetization Policy (in 2016) of the government which continued up to 2018. Then again a hike in financial inclusion indicates a slow recovery of the economy.
The summary statistics of the Values of FII and HDI are shown in Table 7.
Summary Statistics of the Variables in Terms of Index Values.
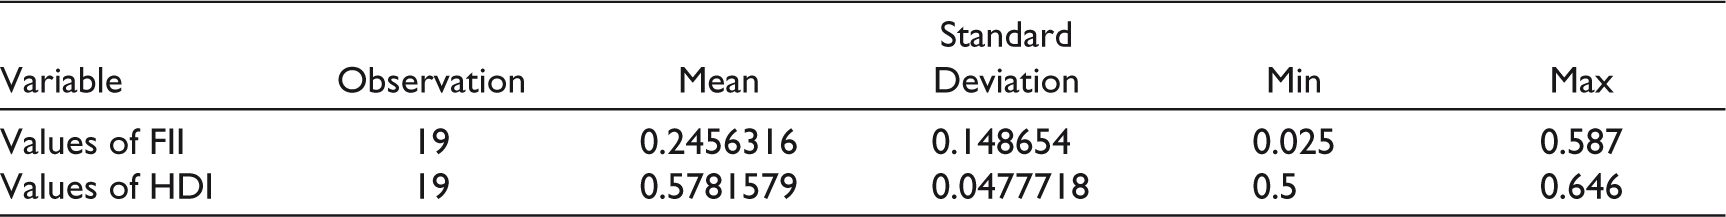
The correlation coefficient between the Values of FII and HDI is found as 0.6541*, which indicates a positive linear relationship between them and it is significant at a 5% level. Since financial inclusion and human development have a significant positive association, so the government policies related to the development of the banking sector towards achieving financial inclusion should be linked with the policies related to human development. In addition to this, the rates of change of the Values of FII and HDI in India during 2001–2019 have been calculated and the summary statistics of these two variables are depicted in Table 8.
Summary Statistics of the Variables in Terms of Rates of Change of Index Values.
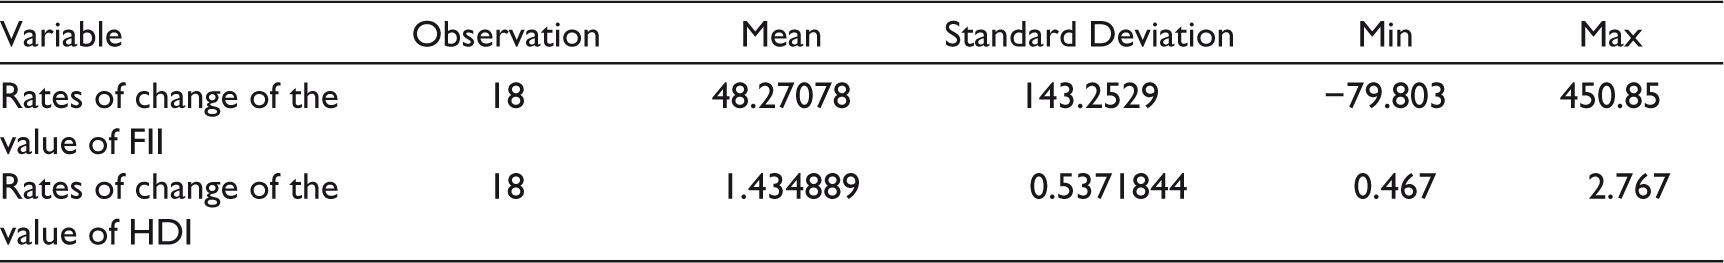
The correlation coefficient between the rates of change in the values of FII and HDI is −0.1607, which is insignificant and indicates a weak and negative association between them. Therefore, the focus should be more on the linking of government policies for banking sector development to achieve financial inclusion and for human development, which is not significant in India.
Regional Differences of Financial Inclusion and Human Development
Subsequently, to address the fifth objective, the regional differences in financial inclusion and human development have been assessed in India. In this regard, the average values of FII and HDI over the entire assessment period have been derived by isolating seven regions in India, which are depicted in Table 9.
Regional Differences of Financial Inclusion and Human Development during 2001–2019.
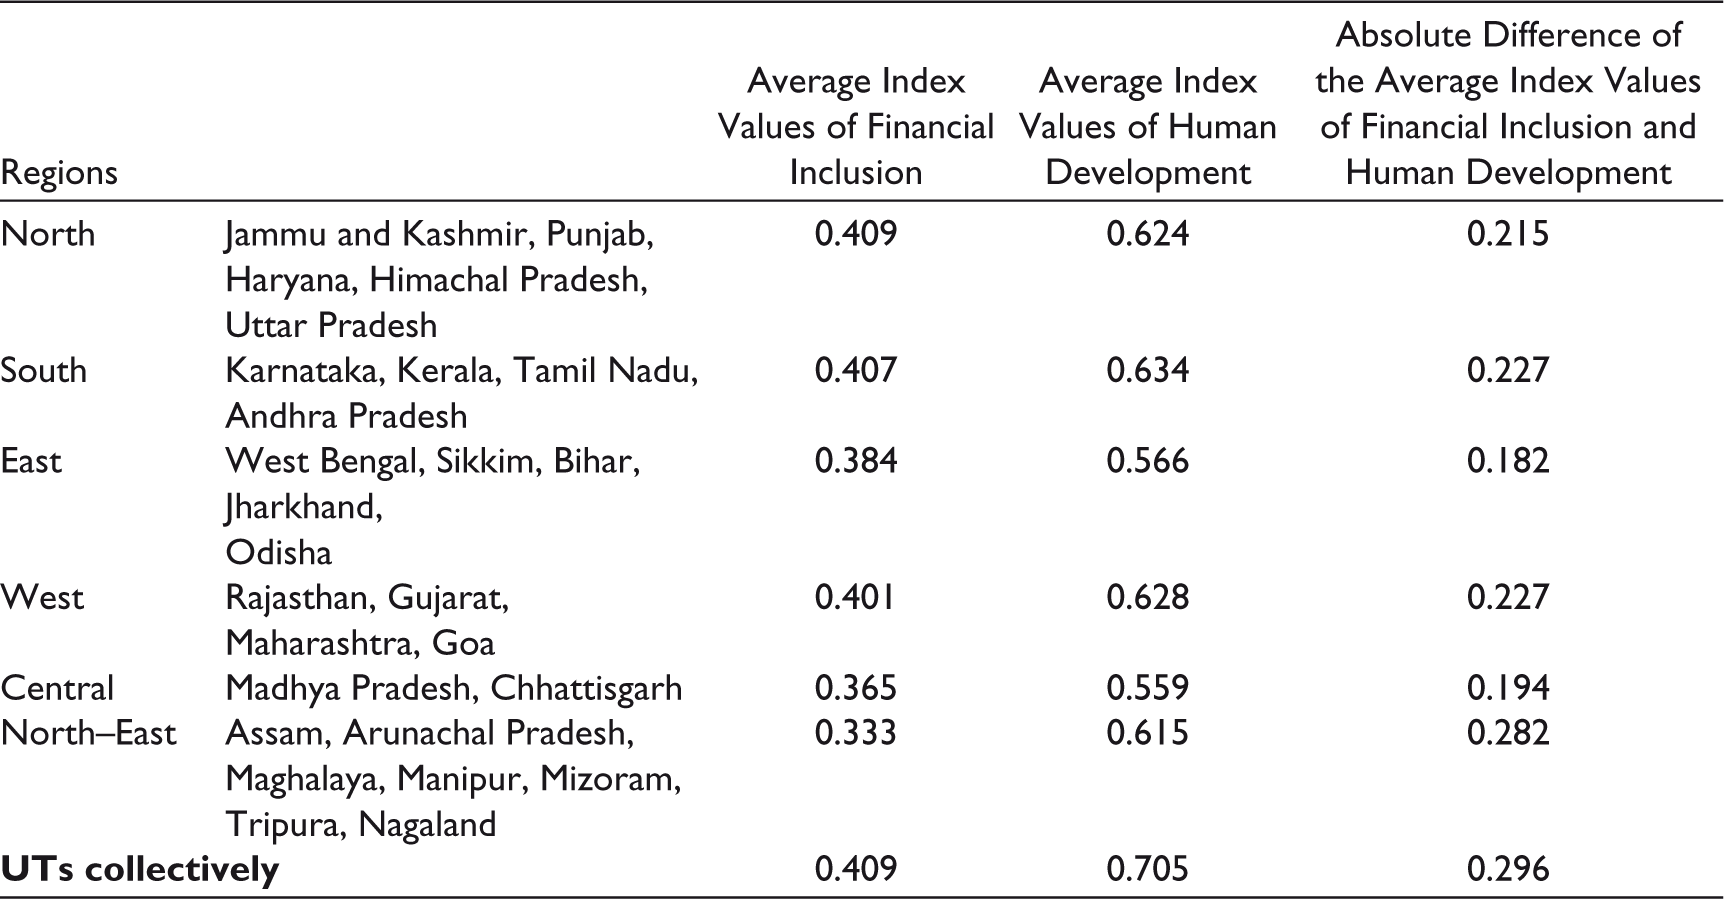
Table 9 emphasizes the following facts.
The northern, southern, western regions of India and the union territories collectively have performed well in achieving financial inclusiveness compared to the other regions. The performance of the north-east region is the most fragile.
The union territories collectively contributed the most to human development in India. The performances of northern, southern, western and north-east regions are good too. But the eastern and central regions have shown stumpy performances.
In the north-east region and union territories collectively, the discrepancy between financial inclusion and human development is very acute, which is followed by the western, southern and northern regions respectively. However, the eastern and central states of India have experienced comparatively low gaps between financial inclusion and human development.
In the north-east region, the performance of the banking sector is not pleasing as revealed in the study. But in terms of human development, the average score is moderate there. So, the attention should be on providing banking facilities and motivating the people for using financial services simultaneously through the financial literacy programmes in this region.
In the union territories collectively, the average score of human development is very high compared to the other regions. Therefore, policies should be directed towards achieving added financial inclusion as the scope persists.
Eastern and central regions should be strongly focused upon in terms of both—human development and attaining financial inclusiveness.
Environmental Analysis of Financial Inclusion
Environmental analyses of financial inclusion strategies help detect the internal and external factors responsible for threats and opportunities present in the system, and align better strategies for the future. So, to address the fifth objective, using a PESTEL Framework in Table 10, the financial inclusion of India towards fulfilling the goals of Sustainable Development is analyzed.
PESTEL Framework for Assessing Financial Inclusion.

Conclusions
Financial inclusion aims to create and maintain financial sustainability so that the vulnerable group gets a certainty of acquiring funds which they often struggle for in need. Financial inclusion also tries to shrink the unorganized financial sector, so that the less fortunate people come out from the clutches of money lenders who often charge a high interest rate for informal lending. Therefore, the kind of study undertaken here might be useful in developing countries where governments try to facilitate the mass population through promoting and providing several financial services, but still, there is a lot of scopes to do further for the commons.
Even though many government agencies and Non-Government Organisations (NGOs) work for financial inclusion, lack of literacy in remote areas often becomes a hindrance. Availability and accessibility of financial services are not only sufficient for financial inclusiveness, but responsible usage has a significant role to play. In this direction, human development is necessary to make the people educate first. Government policies should be directed to make the disadvantaged group financially educated. Since the study reveals a significant positive relationship between human development and financial inclusion, so the development planning and government policies should be oriented in that direction. Even the region-wise different strategies might work well.
Although the study covers the two decades of recent past to assess financial inclusion in India through bank led initiatives, limitations of the study are rooted in much more in-depth analysis incorporating the other banking service indicators such as ATM service, pension scheme, mutual funds, insurance, and so on. The spatial analysis increasing the time horizon might enrich the study foreseeing the trends of financial inclusion and human development and the long-term relationship between them. A gender-based analysis incorporating account ownership might also contribute to the study. However, reliable precise data are needed for such analysis.
Footnotes
Declaration of Conflicting Interests
The authors declared no potential conflicts of interest with respect to the research, authorship and/or publication of this article.
Funding
The authors received no financial support for the research, authorship and/or publication of this article.