



Abstract
Shocks are responsible for significant setbacks in development progress because it persistently inflicts a negative impact on livelihood. As a result, those who are poor continue to be poor, and those who are not poor become vulnerable to falling into poverty. The analysis of the link between risks and vulnerability to poverty in developing countries is a major focus of development policy to ensure the resilience of vulnerable households. However, there is a lack of research in India that examines the potential impact of shocks on poverty and future deprivation. The objective of this study is to estimate vulnerability to multidimensional poverty (VMDP) and analyse the factors that lead to loss of well-being after experiencing adverse events in rural Odisha. Using survey data from 479 households, the study first estimated multidimensional poverty (MDP), adopting a counting approach. Secondly, the estimation of VMDP is performed using the three-step feasible generalised least squares approach. The results show that 55% of the surveyed households are vulnerable to MDP in rural Odisha. It is also observed that 35% of currently poor households are likely to remain poor and 20% of non-poor households are at risk of sliding into poverty. The study suggests that poverty alleviation policies should cover not just those in poverty today but also those at risk of becoming poor in the near future.
Introduction
The global economic loss has been recorded as a total loss of US$ 2.97 trillion (or 0.15 trillion annually) between the years 2000 and 2019 as a result of various adverse events [Center for Research on Epidemiology of Disasters (CRED, 2020)]. Both the economic damage and the frequency of unfavourable events have seen significant increases over the course of the past two decades. For example, the number of disasters that have been reported has increased to 7348 during the period of 2000–2019, compared to 4212 during the period of 1980–1999 (CRED, 2020). Further, the prediction of such events is expected to be more frequent and severe in the future (IPCC, 2014). Importantly, the damage will be more severe for the less developed countries (CRED, 2020).
In developing economies, a significant proportion of the population lives in rural areas, and their livelihoods are reliant on agriculture and natural resources, exposing them to greater risks and shocks (Townsend, 2015; McCarthy et al., 2016). These households are often subjected to extreme shocks of different natures, which can be categorised as idiosyncratic or covariate. While the former is exclusive to individuals or households, such as sickness, accident or unemployment of household members, the latter is correlated across households within a community such as droughts, floods, or cyclones (Günther & Harttgen, 2009; Nguyen et al., 2020). In general, households in low-income countries tend to have limited access to social insurance mechanisms and credit markets, which often results in them having to sell productive assets and reduce spending on essential consumption items such as nutritious food or education. This economic reality underscores the financial constraints faced by households in low-income countries and the difficulties they encounter in building and maintaining sustainable livelihoods (Deloach and Smith-Lin, 2018; Nguyen et al., 2020). Because of the lack of coping measures and the severe impact of various covariate and idiosyncratic shocks, many households are at high risk of falling into poverty (Günther & Harttgen, 2009; Dercon, 2005; Berman et al., 2010; Bonu et al., 2007; Garg & Karan, 2009; Shahrawat & Rao, 2012). In the last two decades, investigating such vulnerability and the livelihood effects of shocks has become an important matter of research and discussion in development economics. In the literature on vulnerability, several methodological studies (Morduch, 2005; Christiaensen & Boisvert, 2000; Skoufias & Quisumbing, 2004; Dercon, 2004; Glewwe and Hall, 1998; Dercon & Krishnan, 2000; Jalan & Ravallion, 1999; Gallardo, 2018) and empirical studies (Günther & Harttgen, 2009; Dercon, 2005; Khosla & Jena, 2022; Khosla et al., 2023) have been conducted using different approaches and country cases. The empirical studies have observed that the share of households at risk of falling into poverty is higher than the currently classified monetary poverty rate. This is the crux of the vulnerability analysis, which indicates that more households are likely to slip into poverty as a result of risks and a lack of coping measures. Thus, identifying vulnerable households would help design policies to prevent them from falling into poverty.
In addition, in recent years, the literature on measuring multidimensional poverty (MDP) has expanded rapidly (Dehury & Mohanty, 2015; Alkire & Seth, 2015). This is reflected in the post-2015 global development agenda known as Sustainable Development Goals (SDGs) 2030. The SDGs aim to end poverty in any form, such as malnutrition and access to basic healthcare, education and clean drinking water. In this context, the United Nations Development Program (UNDP) estimated that 1.5 billion people are multidimensional poor at the global level (UNDP, 2015; Alkire et al., 2015). Further, the UNDP report stressed that the global multidimensional poverty index (MPI) complements the $1.25/day measure of poverty and observed that 29.6% are MDP poor and 23.3% are monetary poor. In fact, UNDP reports and studies using cross-sectional and panel data have observed that the headcount poverty reduction is higher in terms of monetary measures than multidimensional measures (UNDP, 2019; Baulch & Masset, 2003; Günther & Klasen, 2009; Clark & Hulme, 2005; Tran, 2013; Salecker et al., 2020). While the current anti-poverty policy design is based on the headcount poverty rate, results from vulnerability to MDP facilitate the design of policy measures to prevent the households from falling into MDP. Although past empirical studies focused on multidimensional ex-post poverty, limited studies estimated ex-ante vulnerability (Gallardo, 2020; Tigre, 2019; Azeem et al., 2018; Feeny & McDonald, 2016). Therefore, a thorough study of the effects of different types of shocks, coping strategies and the outcome in terms of multidimensional vulnerability is an important contribution to the literature on vulnerability.
Given this backdrop, the primary goal of the study is to address the following two research objectives: (a) to estimate the MDP of rural households in the eastern Indian state of Odisha and (b) to identify households who are at risk of falling into MDP and extent benefits of social schemes to them. The results have been estimated in two steps. The study first estimates MDP by adopting a counting approach developed by Alkire & Foster (2011a; 2011b), with the particular specification proposed by Alkire & Santos (2010; 2014). In the second part, household vulnerability to poverty (VtP) has been estimated using the feasible generalised least squares (FGLS) approach (Chaudhuri et al., 2002; Azeem et al., 2018; Feeny & McDonald, 2016).
The empirical dataset used for the analysis comes from a cross-sectional survey of 479 rural households living in the southern region of Odisha. This study contributes to the literature on estimating VtP in the following ways. First, unlike previous studies that provide an ex-post MDP, this study investigates ex-ante household vulnerability to multidimensional poverty (VMDP). Estimating vulnerability is a crucial aspect as it forecasts the households that may remain poor, those that may escape poverty, those that may fall into poverty, and those that may remain non-poor. This prediction is particularly helpful in identifying the most deserving beneficiaries for social protection programmes, as past studies have shown errors in beneficiary inclusion and exclusion, leading to deserving candidates being left out of the scheme (Balani, 2013; Taneja & Taneja, 2016; Boyanagari & Boyanagari, 2019). Second, the current research examines vulnerability at the sub-national level, generating insights for poverty reduction at the disaggregated level. This is critical as the study area is underdeveloped in terms of the infrastructure development index (IDI), Human Development Index (HDI), and health indicators (Government of Odisha [GoO], 2013). Thus, boosting economic development in the region by improving education, health, and living standards while supporting social protection programmes for deserving beneficiaries can effectively reduce poverty.
Methodology
The Concept of VtP
The key distinction between the idea of poverty and being vulnerable to poverty is that the latter refers to potential risk. Poverty can be defined as an ex-post measurement of the well-being of a household that is reflected in the inability to satisfy some fundamental requirements. Vulnerability, on the other hand, is a measurement of the expected future well-being of households, which is dependent on their exposure to shocks and their ability to cope with them. The metrics of vulnerability and ex-post poverty would be the same if future hazards were not taken into consideration. In light of this, vulnerability is invariably a function of both the predicted mean and the variation of the consumption of households. The average level of consumption for households and the community as a whole is influenced by their respective characteristics. On the other hand, the variation in consumption is determined by the stresses and challenges that households face, as well as the coping strategies they employ.
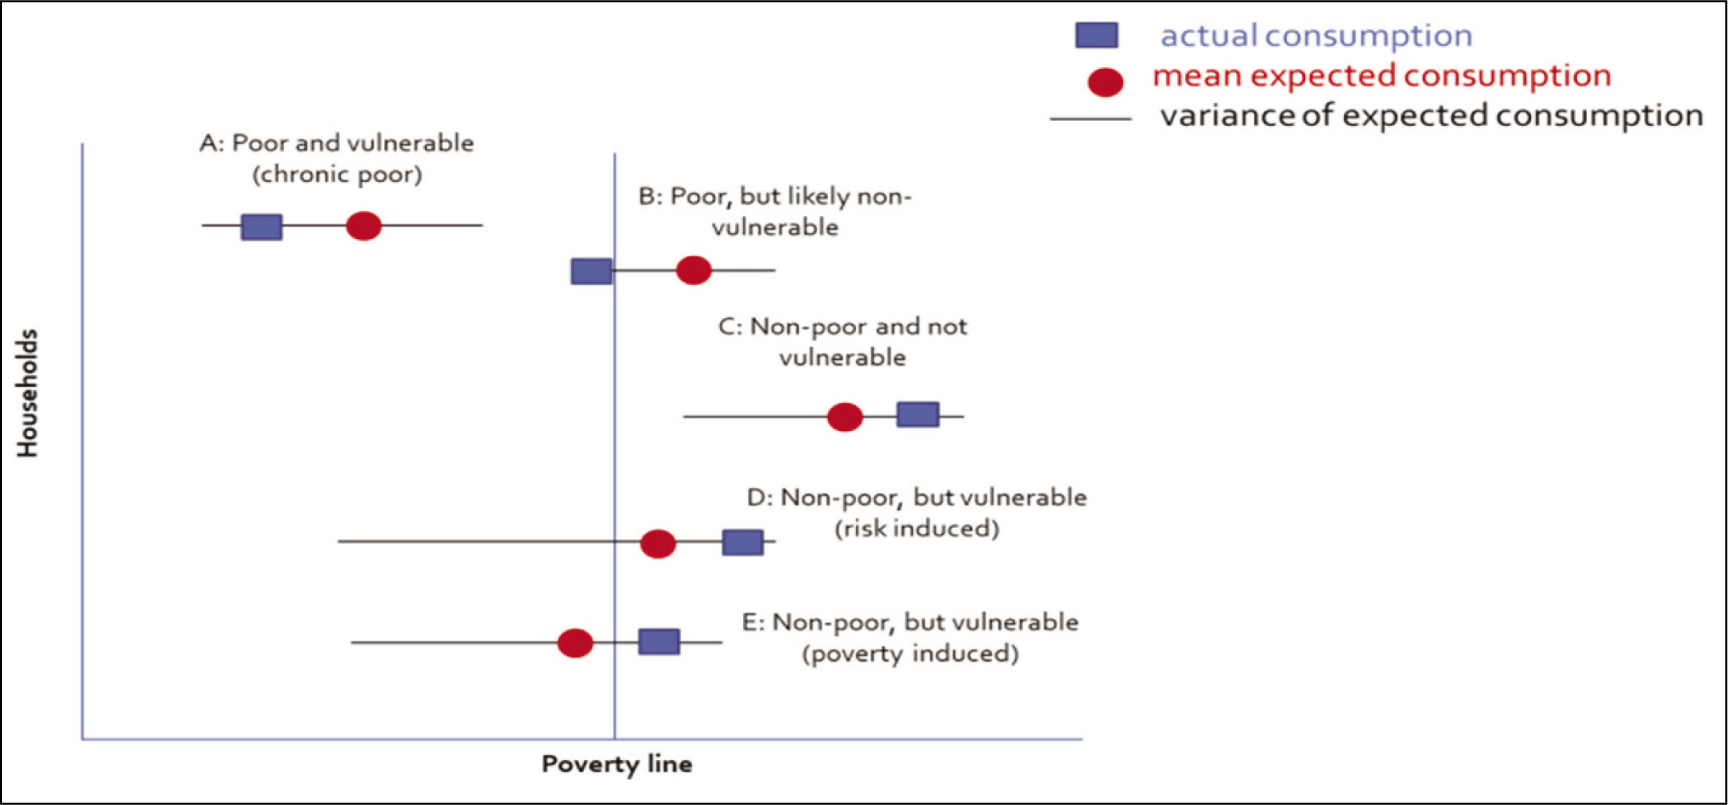
The notions of vulnerability in relation to poverty are represented graphically in Figure 1, which plots the predicted consumption as well as the variation of households (adopted from Atamanov et al., 2022). The mean value is represented by a horizontal line, and the width of the black lines drawn around it indicates the variation in consumption. The red circles represent the average consumption associated with a number of shocks or different time periods, and the width of the black lines around the mean value illustrates consumption variation. As a result, different households are differentiated from one another according to the mean consumption and the variation of that consumption. The graphic also depicts real consumption at a given point in time (blue squares), as well as the poverty line, which enables us to determine that households A and B fall below the poverty line.
The likelihood of a household slipping below the poverty line in the not-too-distant future is referred to as vulnerability, and it is calculated as a function of both the average consumption and the variance of the household’s expenditures. For instance, if the assumption is made such that a household is vulnerable if there is a greater than 50% chance that it will fall below the poverty line at some point in the next two years (In Figure 1, this would suggest that a household has an average consumption below the poverty line, and/or more than 50% of its variation line falls below the poverty line). In accordance with this criterion, households A, and E are vulnerable, which shows that their expected mean consumption will be below the threshold level. The last two households, B and C, do not fall into the vulnerable category. Because neither their average consumption nor their variation falls below the poverty line, household C is not at risk of falling into poverty. Even if the B household’s actual consumption was lower below the poverty line, the B household is not at risk of becoming vulnerable. It is not vulnerable because in the near future, there is a very low probability of having consumption that falls below the poverty line again.
Data
The collection of primary data took place through a survey conducted between July 2018 and February 2019 in three districts located in the western region of Odisha. The districts selected for the survey, namely Kandhamal, Koraput and Nabarangpur, were purposely chosen because they share similarities in terms of their size and level of development. These districts have a higher poverty rate (GoO, 2017; Khosla & Jena, 2020), and the key development indicators such as the HDI, gender development index and IDI in these districts are considerably lower compared to other districts of the state (GoO, 2012). Within each of the three districts, we exclude the urban areas and confine the sample to the rural areas. Within these districts, blocks and villages are randomly selected using population density weights. There are in total 479 sample households are considered for the analysis after completing the cleaning process. Of the total 479 sampled responses, 201 were collected from Koraput, 103 from Kandhamal and 175 from the Nabarangpur district.
The survey conducted was a typical household survey, covering a wide range of areas of interest. The survey covered rich information on household demographics, various aspects of social and economic responses and, in particular, the experiences of households in addressing shocks that affected them, as well as the coping mechanisms they followed. The variables included in the estimates are classified into three categories: household characteristics, household-reported risks and coping strategies. The descriptive statistics of these variables are provided in Table 1. In relation to occupation, households are grouped into three major income categories: farm-employed, wage earners in non-farm, and self-employed in non-farm. In relation to occupation, 46.35% of households derive livelihood from agriculture, 42.38% from wages in non-farm, and 11.27% from self-employed in the non-farm sector. It is expected that households deriving livelihoods from self-employed in non-farm to be better off than other categories of livelihoods (Albert & Vizmanos, 2018).
Previous studies have shown that households headed by a male person are less likely to be poor or vulnerable compared to female-headed households (Azeem et al., 2018). However, studies have also found the converse finding showing that female-headed households are less vulnerable (Amin et al., 2003). The households in the sample are predominantly male-headed, that is, 89.6%. The variable age of the household head is used as a proxy for work experience, suggesting a positive association between age and household well-being (Jha & Dang, 2010; Tsehay & Bauer, 2012; Azeem et al., 2018). The average age of household heads is 43.45 years. Again, household size and dependency ratio are expected to have negatively associated with household well-being (Jha & Dang, 2010). On average, each household has about five family members. The role of human capital is crucial in economic development. It is expected that higher education levels would lead to a better standard of living (Jha & Dang, 2010). It was observed from the survey result that about 53% of households are literate, with an average year of schooling of 3.2 years of the household head. There is a positive association between ownership of assets and household well-being (Tsehay & Bauer, 2012). Households interviewed in the survey reported that about 64% of households owned farmland. Studies have observed that land ownership enables households to engage in agricultural activities that generate income or use it as collateral to obtain other benefits (Tsehay & Bauer, 2012). In the case of durable and productive assets, the average households in the study areas possess durable and productive goods in number are about six and about one, respectively. The findings from past studies show a lower vulnerability level for the household with higher assets (Ersado, 2006).
In relation to household reported shocks, the survey sample results indicated that most respondents (88%) experienced severe illness, and about 17% of households lost income earners during the specified period. As anticipated, the majority of respondents who participated in the research reported experiencing natural shocks. Among the household-reported shocks, the survey sample results indicated that drought (68%) and cyclone (69.7%) were experienced by more than 50% of the respondents. However, the households affected by the flood is 36% which shows that the western part of Odisha is less affected by the flood, which is on the expected line. During the rainy and winter seasons, the price of agricultural products goes down, resulting in losses for the farmers. On the contrary, they experience increasing prices for input and other products that cause them to reduce another important expenditure on education and health. To mitigate such negative events, if households do not have enough coping strategies, they fall into extreme poverty or the poverty trap.
The survey data shows that the households adopt many coping mechanisms when they experience a shock based on the severity, as indicated in Table 1. Generally, households retained the traditional system of coping with a shock by borrowing from the informal sector. In the case of coping strategies, it was common for households to borrow money from relatives (51%). Further, 38% of respondents admitted that they had borrowed from moneylenders to overcome the situation. It emerges from the results that households are more reliant on external support to deal with negative events. Seeking loans and credit from a moneylender, relatives and friends suggests that households frequently rely on the informal sector. This also implies that social capital plays a major role in reducing the severity of shocks, especially during a critical economic situation. Khosla & Jena (2020) observed that social capital helps households from escaping poverty. The majority of households are reported to have participated in various forms of social capital, such as self-help groups (SHG) (59%), attending public meetings (51%), and saving groups (14.4%). SHG is playing a crucial role in rural areas by supporting microcredit to low-income groups (Swain & Floro, 2012). Attending gram sabha at the village level provides important information regarding the government programs and also helps to enrol as a beneficiary for different government schemes (Jha & Dang, 2008). Membership in a savings group helps accumulate more money, leading to investing money in a profit-oriented business. Hence, it is expected that households being part of a saving group has a positive association with household well-being (Tsehay & Bauer, 2012). On the other hand, households attempted to overcome adverse events by selling various assets such as livestock, gold, and land. In particular, 4.2% of households sold gold, 9% of households sold land, and 24.4% of households mitigated negative events by selling livestock. It was observed from past research that these asset losses could push many households into a poverty trap (Carter et al., 2006).
Descriptive Statistics.

The Context: Rural Odisha
In rural Odisha, there are compelling reasons to analyse the relationship between poverty and risk using the concept of VtP. As of 2011, an overwhelming majority of rural households were still living in poverty, accounting for around 33% of the state’s total poor population (GoO, 2012). A recent study by Suryanarayana et al. (2016) observed that Odisha has improved in HDI from 22 ranks in 2007–2008 to 19 in 2011, but still, it is considered a state with a low HDI. The economy is contributing to the national GDP through the service sector (41%) and industrial sector (39.5%) (GoO, 2018). However, agricultural dominance for livelihood remains high in the state, where about 60% of households still depend on their livelihood (GoO, 2018).
Given the status of the lowly ranked HDI state, poverty alleviation has been the priority of the state. Over the period of the last four decades, the poverty rate (headcount) in India, as well as in Odisha, has been declining gradually. It was observed that the poverty rate in the state of Odisha has been consistently 10% higher than the national average over the last four decades (1970–2010). Poverty in Odisha has declined from 66.18% in 1973–1974 to 47.15% in 1999–2000 and 32.59% in 2011–2012 (GoO, 2012, 2013, 2014). The poverty rate in India declined from 54.88% to 26.1% and 21.92% over the same period, respectively. Despite the fact that the poverty rate in Odisha has decreased, it still stands at 32.59% in 2011–2012 (GoI, 2015), which is a cause of concern. The statistics may change if the calculation is done in multidimensional measures. Therefore, VMDP is necessary to remove poverty in rural areas. Further, the majority (83%) of people live in rural areas (GoO, 2013) with poor infrastructure, low HDI, and inadequate access to education.
In terms of geographical location, Odisha consists of 30 districts and is located in the eastern geographical area of India. These districts are further classified into three geographical divisions: southern Odisha consists of 12 districts, northern Odisha includes nine districts, and coastal Odisha consists of nine districts (GoO, 2010). In terms of economic development (e.g., living standard, net district domestic product), coastal Odisha is ahead of northern and southern Odisha (GoO, 2012). The coastal belt of Odisha is well-connected to the rest of India via rail and air transportation. Northern Odisha is located at the border of Jharkhand and Bihar states with few established industries such as Aluminium and steel plants. Southern Odisha is economically backward, wherein the majority of tribal people dwell. World Bank (2016) observed that 87% of households are poor in the southern region, 50% in the northern region, and 35% in the coastal region. Further, the poverty rate varies across the districts; some of the extremely poor districts are Kandhamal, Koraput, Malkangiri, Boudh and Balangir (GoO, 2017).
Assessment of Multidimensional Poverty
Utilising Alkire & Foster’s (2011a, 2011b) counting method and the precise specifications provided by Alkire & Santos (2010; 2014), three steps are followed to estimate MDP. In the first step, various dimensions and indicators of household well-being are defined. Three core dimensions—education, health and living standards—are used (Table 2). The second step in the calculation of MDP is to assign weights to each dimension and indicator and specify cut-off points for the selected indicators. We assigned equal weights to each core dimension as well as to the indicators under each dimension (Table 2). Further, two cut-offs are used, that is, deprivation and poverty cut-offs. The total deprivation score is calculated using the weights, which is the total weighted sum of its deprivation. We used the poverty cut-off of 33% and the household is considered multidimensional poor if the deprivation score is greater than the specified poverty rate.
Dimensions, Indicators, Weights, Cut-off Points and Resulting Rates of Deprivation for Rural Odisha.

In the final step, using the following formula, the MPI or adjusted headcount ratio (Mo) is calculated as:

where H is the proportion of multidimensional poor households and A is the average deprivation intensity share among the poor. The further development of this approach to estimate MDP and vulnerability can be found in Gallardo (2020).
Assessment of Vulnerability to Multidimensional Poverty
Following Feeny & McDonald (2016), and recent literature such as Azeem et al. (2018), this study uses cross-sectional data to estimate VMDP in rural Odisha.
The reduced form equation of deprived household is given as:

where, dit denotes the household i’s weighted deprivation score. Xi represents household characteristics, including demographic characteristics, major income sources, and asset ownership. Sit is the shocks (flood, drought, illness and death of breadwinner, etc.) experienced by the household i, and Cit represents various coping strategies (e.g., sold livestock, borrowed from an informal moneylender and sold land) adopted to overcome the shocks by the household i. eit is the mean-zero disturbance term.
The detailed derivation of the estimation process can be found in Feeny & McDonald (2016) and Tigre (2019).
The VtP of household i with its characteristics Xh can be calculated by estimating Equations (2) and (3) such that the probability of household i that is the deprivation score will be above the critical threshold (z) at time t + 1 can be expressed as;

To estimate VtP a model, the model can be written as:

Where di is the deprivation score of household i, β0 is the intercept, β1 is the slope coefficients, Xi is observable household characteristics, and ei is the zero-mean disturbance random error term that captures the variability of household consumption due to unobserved covariates and the idiosyncratic factors.
For calculating the variance in the consumption of households, the heteroscedastic term (ei) is allowed to depend on the same household characteristics as given in equation (3). The equation is as follows;

Since the error term is assumed here as the heteroscedastic, therefore, Ordinary Least Squares (OLS) method cannot be applied to measure VtP. Thus, the three-step FGLS method suggested by Amemiya (1977) is used in this study. We proceed in three steps to obtain the asymptotically efficient estimates ofandusing FGLS. The first step involves estimating equation (3) using the OLS method. In the subsequent step, the estimated residuals obtained from equation (3) are squared and allowed to depend on the same household characteristics used in equation (3). Equation (4) is transformed using the predicted values obtained from equation (4) in the following manner:
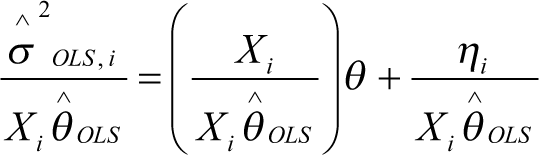
After the transformation, the equation is estimated using the OLS method, resulting in an asymptotically efficient FGLS estimate of the variance of household consumption. The equation for calculating the standard deviation involves taking the square root of the variance as follows:
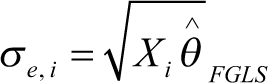
We use the estimates 
The estimates obtained from the OLS method using the transformed equation are consistent and provide asymptotically efficient estimates. The FGLS estimates of
are utilised to estimate the expected mean and variance for each household as:


After estimating variance and estimated deprivation means, using the following formula directly VMDP can be estimated.
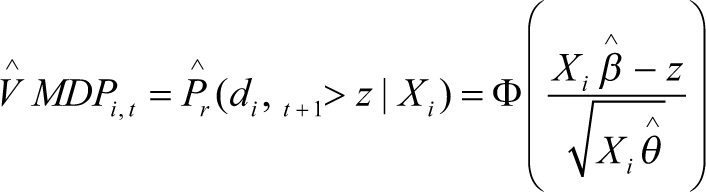
Where
Like other empirical studies, the current study uses the vulnerability threshold of 0.5 (50% probability) to estimate vulnerable or non-vulnerable households. Further, based on the literature, different categories of VtP households are identified (Khosla et al., 2023; Atamanov et al., 2022). The vulnerable households are grouped into four sub-categories. Those that are poor and vulnerable are considered ‘chronic poor’, and those that are poor and non-vulnerable are considered to have ‘escaped’ poverty. Similarly, non-poor and vulnerable are considered as ‘transient poor’, and those that are non-poor and non-vulnerable are considered ‘non-poor’.
Results
Household VtP: Multidimensional Approaches
This section presents the findings of the study in two parts. The first part discusses the analysis of MDP. The second part shows the econometric results of VMDP. The section begins with an explanation of MDP where it compares with different livelihoods and among the districts.
Multidimensional Poverty Index
The estimates from the counting approach show that 47.18% of households are multidimensional poor (Table 3). The findings indicate that households in the study area have poor education, poor health and low living standards. Since the MDP measure is based on the three dimensions, education, health and standard of living, understanding the deprivation in each indicator helps us to understand the processes underpinning the likelihood of being MDP. In the case of education, our results show that 25.68% of households had not received primary education, and children not attending primary education have been observed for 5.22% of households (Table 2, Column 5). This result is in line with the state’s educational status. In fact, in terms of education ranks, these districts’ education falls in the bottom-most category within the state as per the 2011 census data. For example, 43.9% of people are literate in Nabarangpur, 42.4% in Koraput and 61.5% in Kandhamal as compared to Jagatsinghpur (86.5%), Cuttack (83.5%), Puri (84.2%) and Khurdha (83%) (GoO, 2012).
In the health dimension, a significant proportion of households suffer from severe health issues such as a disability or chronic disease. In the second indicator of the health dimension, child death occurred in 8.35% of households. The official reports show that the infant mortality rate, birth rate, and death rate are high in these districts (GoO, 2012). Further, it is also observed from the standard of living indicators that the majority of households use firewood for cooking and reside in kutcha/tiled houses (Table 2, Column 5).
Table 3 presents the MDP estimates across livelihood categories and districts. In this study, we have categorised households into three livelihood groups: self-employed in the farm sector, wage-earning in the non-farm sector, and self-employed in the non-farm sector. As expected, the MDP rate is observed to be highest in the self-employed in the farm sector (54.5%) compared to the households working in wages in non-farm (43.35%) and self-employed in the non-farm sectors (31.48%).
MDP Estimates Across Livelihood Categories and Districts (%).

Factors Influencing the Vulnerability to Multidimensional Poverty
The results from Table 4 show the key factors influencing the vulnerability to multidimensional poverty. The result from the FGLS model for factors influencing MDP indicates that there is a negative association between the years of schooling of the household head and deprivation. This result is established in the literature (Fenny & McDonald, 2016; Azeem et al., 2018), indicating that households with more educated household heads are more resilient to shocks. An additional year of schooling of the household head reduces the deprived score by 1%. The coefficient of the variable household size is negative and significant, which indicates that a household with a large number of family members and dependent members has lower well-being. Studies have argued that larger households with less dependency ratio supply more labour hours (Tsehay & Bauer, 2012). This finding is consistent with the study that observed a negative association between household size and lower deprivation (Tran, 2013).
Factors Influencing Household VtP.

Standard error is created by Bootstrap replication of 1000.
In the case of asset ownership, the coefficient of durable asset ownership shows a significant and negative association with deprivation, which implies that possessing more durable assets leads to lower deprivation. This finding is consistent with a past study that observed a lower vulnerability for the household with higher assets (Ersado, 2006). Recently, the estimation of poverty has been extended to asset ownership, suggesting that households with better access to assets have more chances to escape poverty (Carter et al., 2007; Carter & Barrett, 2006). This study adds to the growing body of evidence demonstrating the vital importance of preserving a strong asset base in order to combat poverty and vulnerability. Turning to the household’s observed experiences of shocks, it is observed that having experienced illness and death of income earners is positively associated with deprivation. This result is the core issue of VtP and is consistent with the past VtP literature (Günther & Harttgen, 2009; Azeem et al., 2018). The probability of becoming deprived increases by 7% and 3% when household members suffer severe illness and are affected by the flood, respectively, keeping all other variables in the model constant. Generally, rural households, due to less coping capacity unable to mitigate adverse events. Considering the low income per capita, any shock can cause severe damage to the livelihoods of the households. And to overcome these negative events, households apply several strategies, and such choices can lead to persistent poverty (McCarthy et al., 2016). It is observed that if the household had borrowed from informal moneylenders to cope with the negative events, the likelihood of deprivation increases by 5.3%. The finding shows the importance of insurance for coping with negative events.
Social capital within the community is expected to play a key role in disseminating information. This is confirmed by the negative association between participation in group membership and the deprived score of the household. Specifically, if the household is associated with a social network such as a member of a savings group and attending a public meeting like gram sabha, the probability of becoming deprived reduces by 5.7% and 3.2%, respectively. There is a positive association between saving and household well-being, and it helps households accumulate more money for further investment (Tsehay & Bauer, 2012). It is expected that households with good savings can use the amount to overcome negative adverse events. Similarly, household attending gram sabha gets more information on the available government policies and can enrol to avail of various benefits from the programs. One of the reasons for households attending gram sabha being relatively better off can be that attending gram sabha may also be an indicator of awareness and political connectivity and hence a relatively higher chance of availing social schemes. It was observed from the literature that due to a lack of information, a significant proportion of households could not enrol in various programs (Devadasan et al., 2013).
Household Vulnerability to Multidimensional Poverty
The findings from the FGLS estimate show that 55.11% of households are VMDP (Table 5). This finding is consistent with the previous VMDP studies, which have observed that the vulnerability to MDP rate is more than the current multidimensional headcount poverty rate (Azeem et al., 2018; Feeny & McDonald, 2016; Tigre, 2019). Based on the VtP categories, we find that 35.49% of poor households are likely to be chronically poor, and 19.62% of non-poor households are at a high risk of becoming multidimensional poor. Among the districts analysed, nearly 70% of the households in the district of Koraput are at a high risk of falling into poverty, followed by the districts of Nabarangpur (46.29%) and Kandhamal (44.66%) (Table 5).
Household Vulnerability to Multidimensional Poverty (%).

The findings also show that 11.69% of households are currently poor but are expected to escape poverty according to their vulnerability score. This ‘Escape from Poverty’ is more in Nabarangpur and Kandhamal, compared to Koraput. Notably, Table A1 shows that households with a higher likelihood of escaping poverty have experienced fewer shocks compared to other categories. This finding is consistent with past empirical studies that asserted that households move into and out of poverty and households that are likely to escape poverty are comparatively better in an adaptive capacity like education, access to social capital and diversified livelihood (Khosla & Jena, 2020; Khosla et al., 2023). Based on these findings, it is recommended to target both households that are currently living in poverty and those that are currently non-poor but at risk of falling into poverty. This approach can help to ensure that resources and assistance are directed towards those who need it the most and may help to prevent further impoverishment. Further, households’ access to regional factors, such as roads, healthcare facilities, education and infrastructure, can play a crucial role in helping them escape poverty (Khosla & Jena, 2020). Research has shown that households with such facilities are less likely to be poor compared to those without them (Khosla et al., 2023; Godfrey‐Wood & Flower, 2018). A comparison of the deprivation rates based on health, education, and standard of living indicators reveals that the Koraput district has a higher rate of deprivation than the Kandhamal and Nabarangpur districts (see Table 3). This suggests that households in the Kandhamal and Nabarangpur districts have better access to these indicators and, therefore, a greater chance of escaping poverty than those in the Koraput district. This manuscript focuses solely on the estimation of various categories of VtP, and future studies should expand the scope to include an examination of the factors that aid households in escaping poverty, including regional issues. The decomposition of VMDP across the livelihood sectors is presented in Figure 2. Figure 2 illustrates that the self-employed in the farm sector exhibits the highest VtP rate (61.26%), followed by wage-earning in the non-farm sector (51.72%) and self-employed in the non-farm sector (42.59%).
Vulnerability to Multidimensional Poverty at Occupation Level (%).

To substantiate the above findings, we report the results of vulnerability decomposition by various shocks for different VtP categories in Table A1. We find that chronically poor households are more likely to be affected by both covariate and idiosyncratic shocks. Specifically, it was observed that death of household members, flood, and illness are more affected by chronic poor compared to other groups (Table A1). This finding is consistent with the past empirical VtP study, which observed that households are more likely to remain poor if they experienced illness, death of a breadwinner, flood and cyclone compared to other categories of households (Khosla et al., 2023). This finding also corroborates the above discussion (Factors influencing vulnerability to multidimensional poverty) which shows that there is a negative association between flood, illness and household well-being. Similarly, transient poor households are associated with exposure to shocks, and as a result, they are at risk of falling into poverty. The finding is in line with past results, showing that there is a negative association between various shocks (death of breadwinners, illness, flood and drought) and transient poverty (Khosla et al., 2023). This suggests that poverty remains high due to the risk household experience and falls into poverty, in line with past empirical findings (Günther & Harttgen, 2009; Khosla & Jena, 2022; Khosla et al., 2023). However, we find that the non-poor are comparatively less affected by the various shocks. This underlines the significance of coping measures to support poor and vulnerable households.
Conclusion
The emerging evidence from the analysis shows that 55% of the surveyed households are vulnerable to multidimensional poverty, which is higher than the currently classified poverty rate of 47.18% in rural Odisha. Further, shocks accentuate this vulnerability, that is, households who experienced shocks such as illness and death of income earners are associated with increased vulnerability. On the other hand, the findings indicate that households that rely on assets, and participated in social capital, such as members of saving groups, and households with higher education levels are found to be less vulnerable to multidimensional poverty. It is also observed that 35% of currently poor households are likely to remain poor and 20% of non-poor households are at risk of sliding into poverty.
The findings suggest that improvement in education, access to health care, and infrastructure development for a better standard of living should be prioritised for rural Odisha. Therefore, the study suggests that increasing investments in education, particularly, skill-based training and vocational training (training in hairdressing, embroidery, masonry, weaving, cabinet making and plumbing) enhance the potential of the labour force. This skill improvement will equip the rural population to engage in diversified income streams. The study also suggests that forward-looking poverty alleviation policies should cover not just those in poverty today but also those at risk of becoming poor in the near future.
This study also has some limitations. While the empirical analysis has assessed vulnerability to MDP using cross-sectional data, it is acknowledged that utilising panel data would likely result in more precise estimated values and strengthen the reliability of the findings. Moreover, since various social protection measures are implemented to enhance household well-being and build resilience, evaluating their effectiveness in achieving these goals could have significant implications. These limitations create future research gaps to be bridged.
Footnotes
Declaration of Conflicting Interests
The authors declared no potential conflicts of interest with respect to the research, authorship and/or publication of this article.
Funding
This work was supported by the Scheme for Promotion of Academic and Research Collaboration (SPARC), Ministry of Education (Ministry of Human Resource Development), Government of India [grant number SPARC/302].
Data Availability Statement
The dataset is available with the corresponding author and can be provided on reasonable request.