
Abstract
The purpose of this article is to explore the changing patterns of women’s empowerment and son preference at the Indian sub-national level. We have measured the state-level degree of women’s empowerment and son preference for two different periods, that is, 2015–2016 and 2019–2020 using the fourth and fifth rounds state-level National Family Health Survey data. The sample of the study consists of women who can potentially have son preference. The study has examined whether the mean level of women’s empowerment and son preference has changed significantly between the two concerned time periods. The categorisation and cluster analysis of the states is done based on the degree of women’s empowerment and son preference. To explore the degree of association between son preference and women’s empowerment and its indicators, a correlation matrix is formed. No significant increase in the mean level of son preference is found whereas the average value of the degree of women’s empowerment increased significantly in 2019–2020 compared to 2015–2016. Further, the states categorised as having comparatively strong women’s empowerment do not necessarily have a comparatively low level of son preference. No significant association between women’s empowerment and son preference is explored through the correlation matrix as well. Thus, the study leads to the conclusion that son preference in India has no significant association with women’s empowerment.
Introduction
Son preference is a deep-rooted phenomenon in some East and South East Asian countries such as India, China and Korea. The cultural preference for sons prevails historically in India. In patrilineal Indian society, a boy child is treated as an asset while a girl child is considered a liability. A testimony of this fact might be the statement of the blessing given to a young married woman which says ‘shata putra vati bhaba’ meaning be a mother of hundred sons. The strong desire for having son and the availability of sex-selective abortion, although illegal, has had an abysmal impact on India’s child sex ratio, that is, the number of girls per 1,000 boys among children in the age group 0–6. According to the Census data 2011, it was the lowest since India’s independence in 1947. Sons have been idolised and celebrated from time immemorial in India and this ideology remained equally profound instead of great economic liberalisation and a robust growth performance since the early twentieth century.
The sex ratio at birth, that is, the number of male births per 100 female births, has shown an increasing trend since the 1980s in many Asian countries. The sex ratio at birth was 111.9 in China in 2017, 109.6 in India during 2015–2017 and 105.4 in South Korea in 2018, registering reasonably larger values compared to the standard biological value of 105 (UNFPA, 2020).
A skewed sex ratio towards the boy child has an overall negative impact on the health and welfare of Indian women and more importantly on the human development of India as a whole (Klaus & Tipandjan, 2015). Son preference is slowing the process of transition from higher to lower fertility rate as in many parts of India; women continue to give birth until the desired number of son is born to them. Further, the strong son preference leads to sex-selective negative outcomes such as infanticide, sex-selective abortion and sex-specific health care and nutrition.
The aspect of son preference is a complex process culminating from the individual level, household level as well as societal level (Pande & Astone, 2007). The potential fear of being deprived of care in old age and the last rites after death, the practice of marital exogamy where girls enter a completely new family, dowry and high wedding expenses of girl’s marriage—all these lead to son preference and daughter aversion. A common thread of all these issues is associated with less control of women over their own lives. In this article, an attempt has been taken to examine the nature of association between son preference and women’s empowerment at the sub-national levels in India.
Literature Review
Taking a cue from empirical studies, Duflo (2012) has argued that although son preference does not always lead to discrimination and worse treatment of a girl child in India even in those states with a highly skewed sex ratio towards a male, in a poor Indian household which faces extreme poverty, girl child remains significantly deprived compared to a boy child in terms of nutrition and health care. Saha et al. (2015) also found that in Indian urban slums, a boy child has a higher immunisation rate and better educational facilities compared to a girl child. However, son preference is something with very complex dynamics and cannot be blatantly associated with poverty only. Literature suggests that economic development and a higher level of wealth are not effective instruments for reducing son preference (Pande & Malhotra, 2006). Further, dowries have grown larger with economic development in India (Vanneman et al., 2012) and hence more daughters imply more drainage of resources.
The son preference and daughter neglect are so intriguingly profound in India that India is one of the worst performers in terms of excess under-five mortality of girl child in the world (UNICEF et al., 2021). The term excess mortality implies that the girl child is subject to the risk of mortality that is higher than biologically expected. Considerable literature has identified explicit factors such as withdrawal of family resources and lack of health-seeking behaviour (Callister, 2018; Kashyap & Behrman, 2020) and implicit factors such as the mother giving birth until and unless the desired number of sons is not reached (Jayachandran, 2017; Kashyap & Behrman, 2020; Pande & Malhotra, 2006) responsible for this excess under-five mortality rate. Sex-selective abortion, although illegal, is largely practised in India. The extremely high survival threat of girls at the tender phase of their lives who either die in their mother’s womb before birth or die at a premature age due to negligence has been termed famously by Sen (1992) as the phenomenon of ‘missing women’.
Indian law is biased against women and various literature identifies this gender-discriminating legal system as an instrument towards son preference. Singh (2013) has argued that laws about dowry death, abetment to suicide, gender-based abortion leading to female feticide and forced marriage especially for girl child below the legal minimum age—all have low conviction rate implying a reluctant attitude towards punishing the guilty and providing justice to the victims.
Beyond this gloomy scenario with an overall son-to-daughter explicit and implicit preference, it should be noted that girls are not always unwanted. According to the National Family Health Survey, although a majority of Indian women want a boy child, a large proportion of them want at least one daughter as well.
Vast literature can be found that focuses on identifying the potential factors associated with son preference in India. One of the most important among them is the lower level of women’s empowerment. The aspect of son preference and women’s empowerment are strongly associated (Phan, 2016). The association between women’s empowerment and son preference has been explored by the studies of Mancuso (2020) as well which suggests that a higher level of empowerment and equality of rights creates a just and gender-neutral behaviour among women. Vlassoff (2013) examines the relationship between various aspects of rural society and women’s role in India and concludes that the economic and social empowerment of women has a significant role in reducing sex preference and reproductive behaviour in rural India. Dasgupta et al. (2003) argue in their article that an overhaul in women’s status, in general, can lead to a greater gender-neutral attitude towards the next generation. Hernandez et al. (2020) find that a lower level of women’s empowerment is primarily responsible for altered sex ratio in Asian countries like India, Pakistan and Afghanistan, while this altered sex ratio is the manifestation of the profound presence of son preference in societies of these countries. Kishore and Gupta (2004) have also taken lower level of son preference as an indicator of women’s empowerment where son preference is measured through the use of contraceptive methods among married women based on the number of sons and daughters they have.
In the literature, driving factors for son preference are identified and categorised at various levels such as individual level, family level, societal level and demographic level. At the family level, they are per capita household income and type of family, that is, nuclear or joint (Dutta, 2019), at the societal level they are rate of urbanisation (Pande & Astone, 2007; Pande & Malhotra, 2006; Vanneman et al., 2012) and at the demographic level the number of girls and boys present in the family (Gillany & Shady, 2007; Jayachandran, 2017; Yadav et al., 2020).
Most notably, the factors at the individual level identified as responsible for having a direct negative impact on son preference are the factors that are also identified as driving forces of women’s empowerment in the literature. Pande and Astone (2007) and Lei and Pals (2011) have found that years of education play a significant role in reducing son preference among mothers. At the same time, literature is vast where education is identified as a strong enabler of women’s empowerment across various countries (Acharya et al., 2010; Cannonier & Mocan, 2014; Kishore & Gupta, 2004). Mothers’ higher exposure to media is considered another driving factor behind gender neutrality (Pande & Malhotra, 2006) while higher media exposure also ascertains a higher level of women’s empowerment (Gupta & Yesudian, 2006; Jensen & Oster, 2009). Similarly, workforce participation, a largely discussed instrument of women’s empowerment (Anderson & Eswaran, 2009; Hossain, 2012) is again an enabler towards reduced son preference (Pande & Malhotra, 2006). Thus, literature is rich in exploring and establishing direct and indirect linkages between women’s empowerment and son preference.
Objectives
There is ample literature suggesting the profound presence of son preference and factors responsible for son preference in India. Literature is also vast on various aspects of women’s empowerment and its association with son preference in India. Nevertheless, there lies a gap in finding out the pattern of movement of women’s empowerment as well as son preference across Indian states. Literature is also dearth in discussing whether women’s empowerment and son preference has changed significantly over the years in India. Against this backdrop, the article has the following objectives:
First, we find out whether the level of son preference as well as women’s empowerment have changed significantly over the two time periods concerned, namely 2015–2016 and 2019–2020.
Second, this study explores the positions of the states in respect of the degree of son preference and women’s empowerment at two different time points.
Third, we examine whether the level of women’s empowerment as well as the indicators of women’s empowerment are correlated with the level of son preference in each of these two time points.
Methodology and Data
We have calculated Women’s Empowerment Index (WEI) as well as son preference for each state at both time periods. Revealed or implicit son preference can be measured through the willingness of a mother to have more children in the backdrop of the present number of son(s) and daughter(s) born to her. The percentage value of mothers with two girls who want to have more children is used as the indicator of revealed son preference in a state. Empowerment is calculated only for those women who can potentially have son preference. For this, only those women who have two daughters are included in our study.
This study has computed WEI using the six state-level indicators of women’s empowerment proposed by the National Family and Health Survey (NFHS) along with two other important socio-economic parameters. These two parameters are percentage of women having decision-making power in family planning by using contraceptive methods and percentage of women who have achieved education at least up to higher secondary level. Six NFHS indicators are percentage of women having decision-making power in the family, labour force participation rate of women, percentage of women having a physical asset like land or house, percentage of women having their own bank account, percentage of women having their own mobile and percentage of women using hygienic method during menstrual period. Thus, eight indicators are considered to measure state-level women’s empowerment. Usually, arithmetic mean of the normalised value of the indicators is considered for computing the index. However, the arithmetic mean remains silent regarding the inequality in the distribution and the possibility of complementarity of the indicators. The descriptive statistics of the indicators (Table 1) show that there is prominent inequality across the Indian states for most of the indicators of women’s empowerment. Against this backdrop, WEI is calculated as the geometric mean of all the selected indicators after normalising the proportional values by dividing them by 100.
Description of the Variables Relating to Son Preference and Women’s Empowerment.
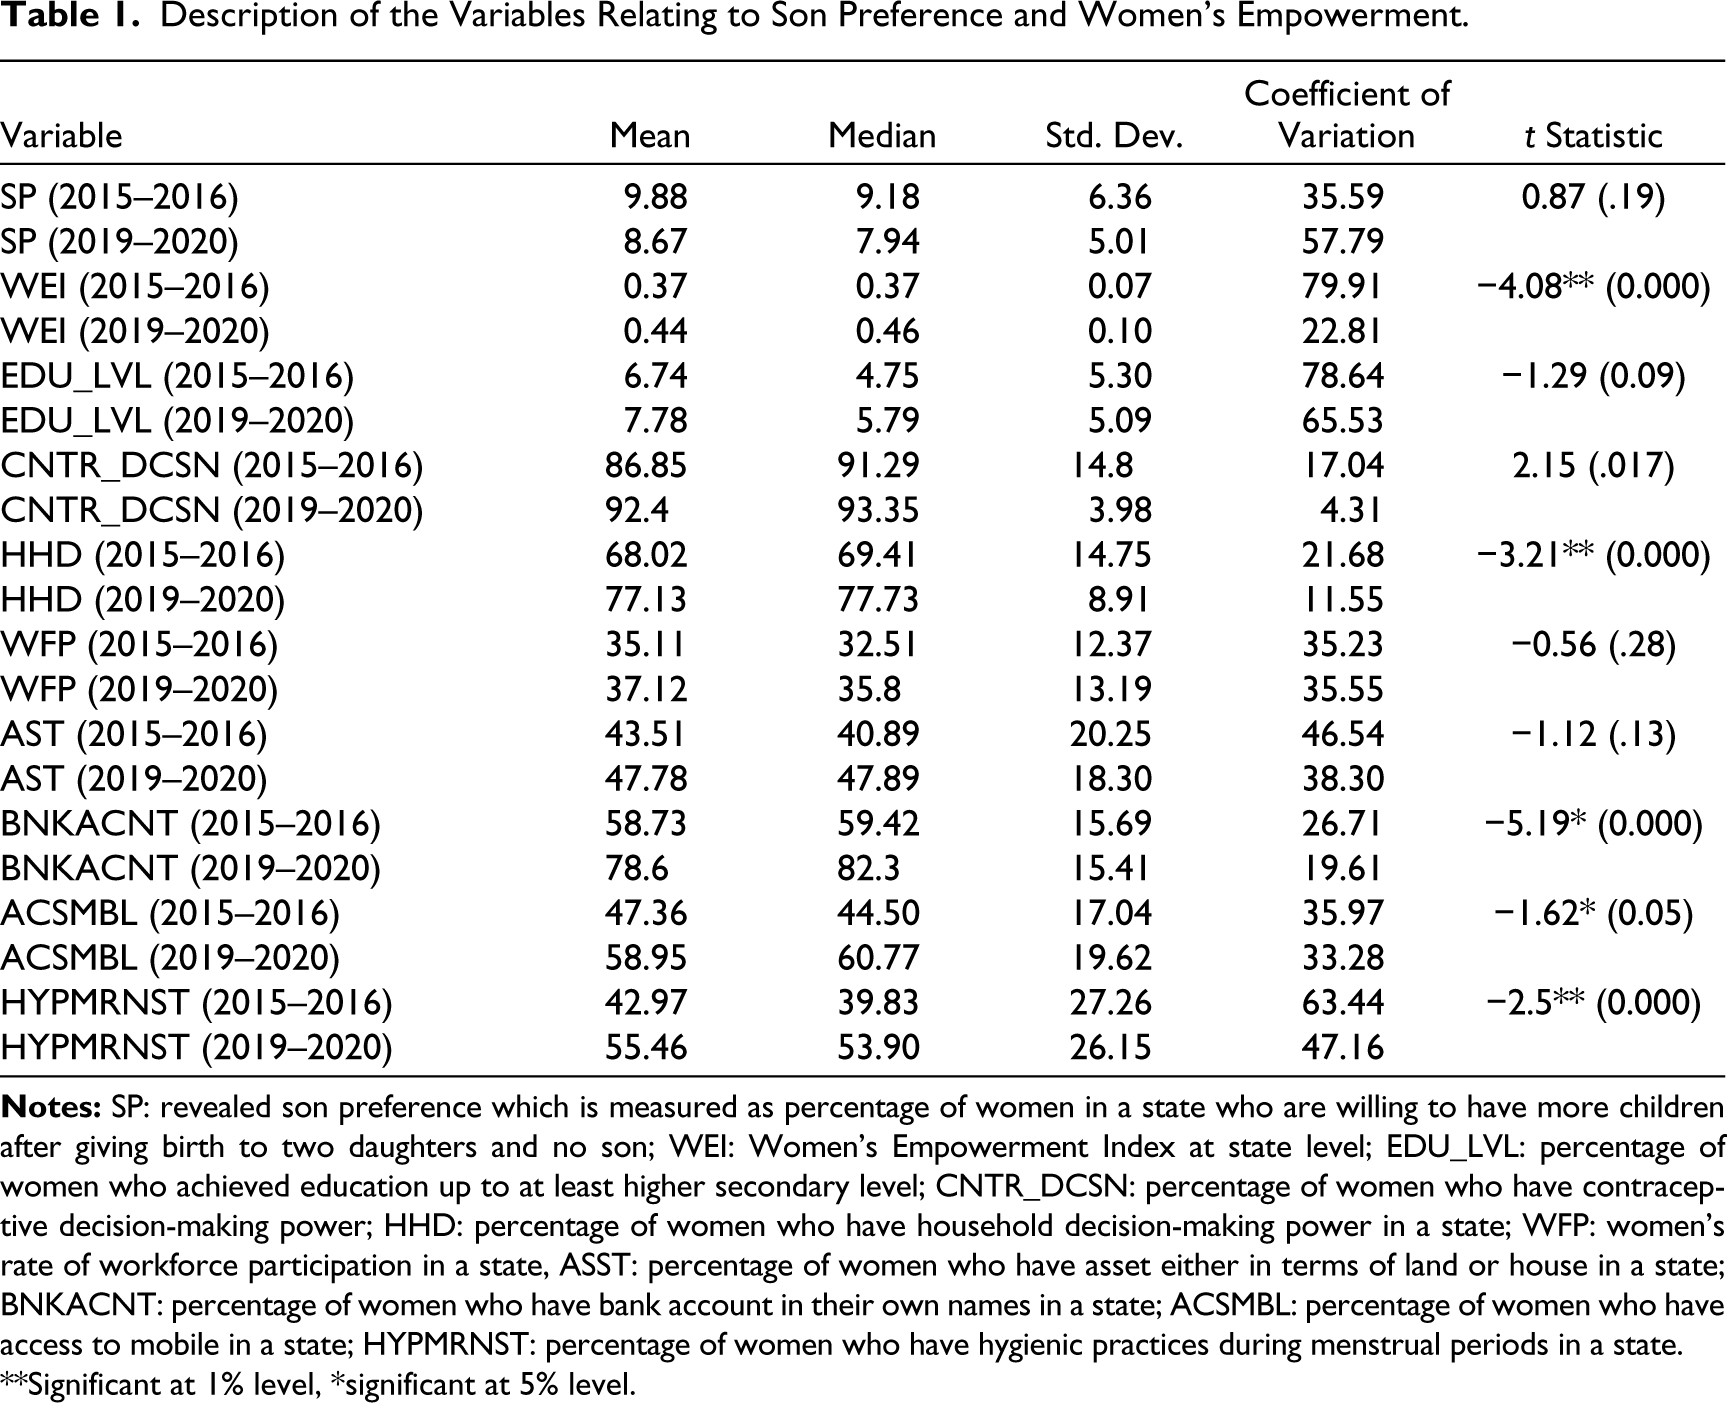
**Significant at 1% level, *significant at 5% level.
The normalised value of the indicator i for state j at time t is
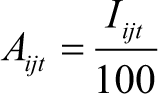
where Iijt is the value of ith indicator for jth state at time period t. i = 1,…, 8 and j = 1, …, 35 as there are eight indicators and 35 states and union territories. A WEI (WEI jt ) is constructed for each state at two different time points which is the geometric mean of each of the achievement index Aijt. 1
Thus,

Note that this formula of indexing, that is, geometric mean, computes the arithmetic mean eliminating the inequality in the distribution.
Based on the WEI scores, the states are ranked in four categories in terms of women’s empowerment, namely very strong, strong, moderate and low. The states whose WEI score is higher than the mean + SD value are categorised as having very strong empowerment, score between mean and mean + SD are categorised as having strong empowerment, score between mean − SD and mean are categorised as having moderate empowerment and score below the mean − SD are categorised as having low empowerment of women. Following the same methodology, we have done a categorisation of states based on son preference.
As the correlation coefficient is a measure of the degree of association, each element of the correlation matrix shows the association between possible pairs of variables in a dataset where all the diagonal elements are one. The correlation matrix is used in our study to understand the degree of association between son preference, WEI and each of the indicators of WEI as well.
We have also performed a cluster analysis to understand how the states are clustered in terms of both parameters. Cluster analysis is an exploratory data analysis technique that creates groups combining homogenous subjects in our case which is a state. There are two broad approaches of performing cluster analysis, namely hierarchical clustering and non-hierarchical clustering. Under hierarchical clustering, again there are two different approaches to form clusters-agglomerative clustering and divisive clustering. Under agglomerative clustering, each case is considered a different cluster and then the two most similar observations are combined to form a new cluster where similarity is measured through distances between cases. There are various ways to measure distance, however, the most widely accepted measure of distance is Euclidean distance. If we want to find out Euclidean distance d between B and C then, where a and b are the two cases being compared for jth variable and k are the number of variables. There are certain advantages of hierarchical clustering over non-hierarchical clustering. The biggest disadvantage of non-hierarchical clustering is that it ascertains the numbers of clusters a priori. Hence, hierarchical clustering is often preferred over non-hierarchical clustering if the sample size is not too large. In our study, there are only 35 observations as there are 35 states and union territories, hence hierarchical clustering is applied. The dendrogram is drawn to identify the possible number of clusters of states having similar degrees of women’s empowerment or similar degree of revealed son preference.
In our article, the state-level data from the NFHS fourth round (2015–2016) and fifth round (2019–2020) have been used for the comparative analysis. NFHS questionnaire covers the same socio-economic domains over all the rounds to maintain comparability of all the information collected. In the fourth round of NFHS, total sample size of studied women across all states and union territories is 94,697 while in the fifth round it is 96,184.
The Patterns of Women’s Empowerment and Son Preference
The Pattern of Women’s Empowerment
Women’s empowerment, which is essentially qualitative in nature, is quantified by WEI. In each state, WEI is measured by using eight indicators of women’s empowerment as discussed above. The WEI value varies greatly across states during both periods of NFHS.
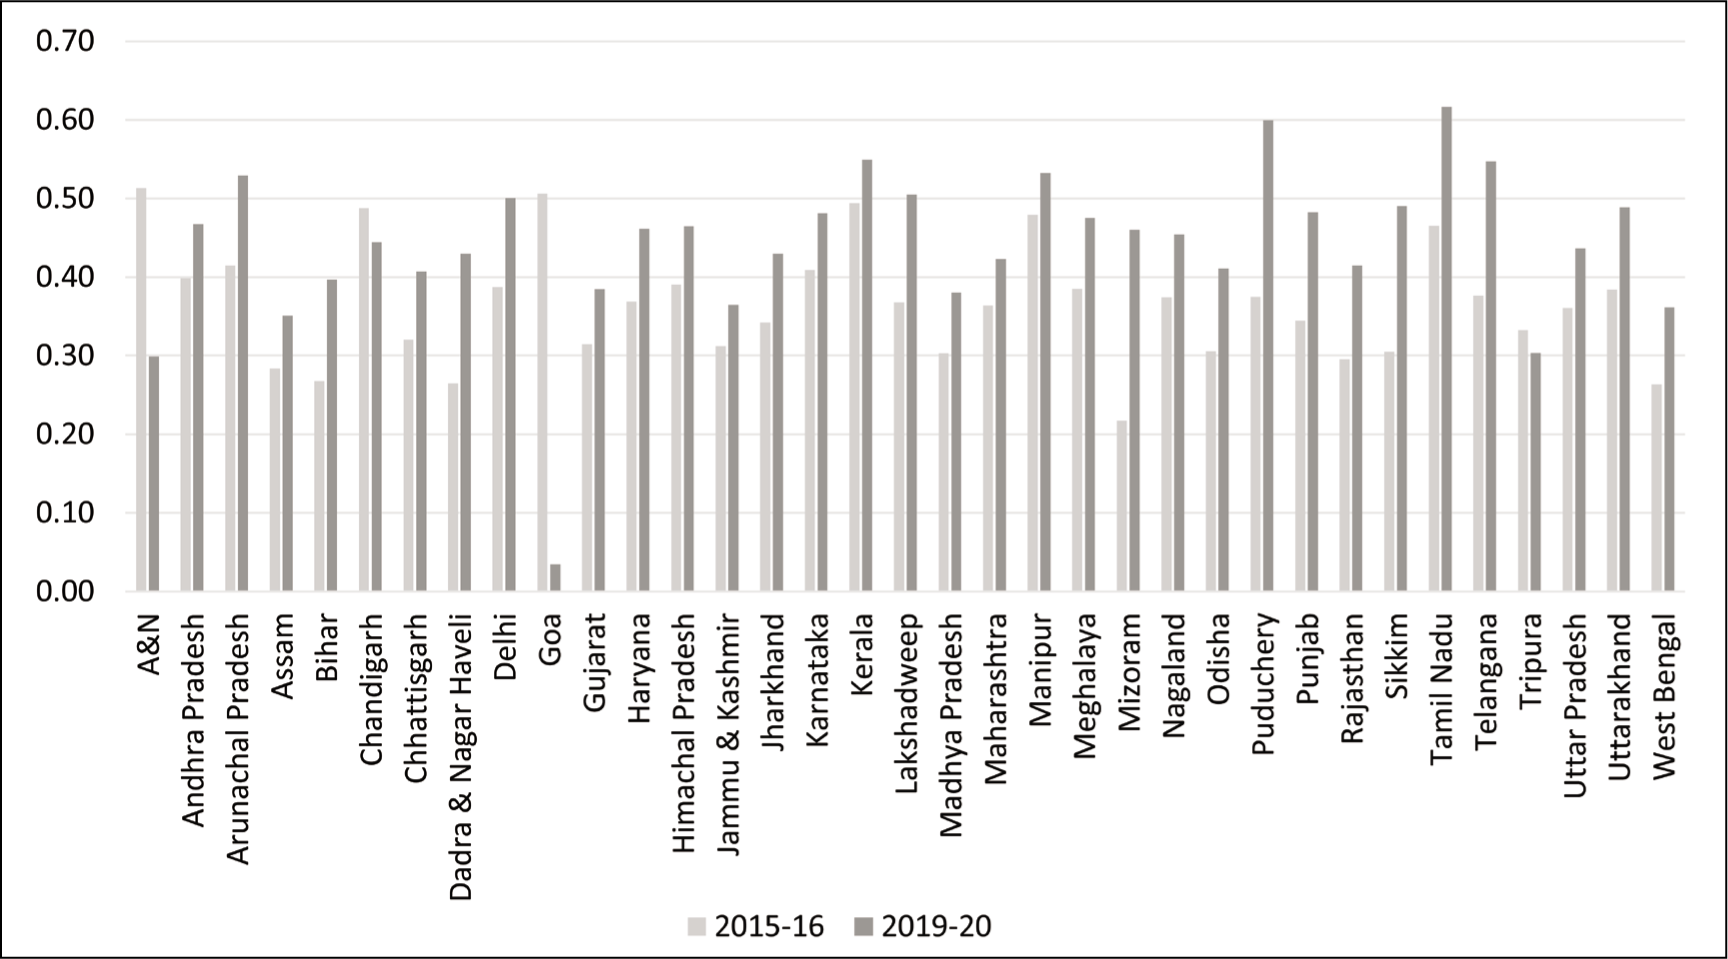
During NFHS4, Goa along with the Union Territory of Andaman and Nicobar have the highest level of women’s empowerment with an index value of 0.51 closely followed by Kerala (0.49), Chandigarh (0.49) and Manipur (0.48). On the other hand, Mizoram has the lowest level of women’s empowerment (0.22) followed by West Bengal (0.26).
In the fifth round of NFHS, the index value of women’s empowerment is the highest for Tamil Nadu (0.62) followed by Puducherry (0.60) and Kerala (0.55). Notably, Goa (0.30) and Andaman and Nicobar (0.03), the state and union territory with the highest level of empowerment in NFHS4, have the lowest level of empowerment in NFHS5 along with Tripura (0.30). If we compare the women’s empowerment scenario in two different time periods, that is, 2015–2016 and 2019–2020, we can see that in most of the states, the absolute value of women’s empowerment has increased which is an encouraging achievement from empowerment perspective (Figure 1).
Percentage of Women with Empowerment During 2015–2016 and 2019–2020.
Pattern of Son Preference
India is a country characterised with strong patriarchy and patrilineal society. Concomitantly strong son preference exists among Indian sociocultural layers. Data from NFHS seconds the fact. The desire for having more children depends on the number of girl child and boy child already present in the family.
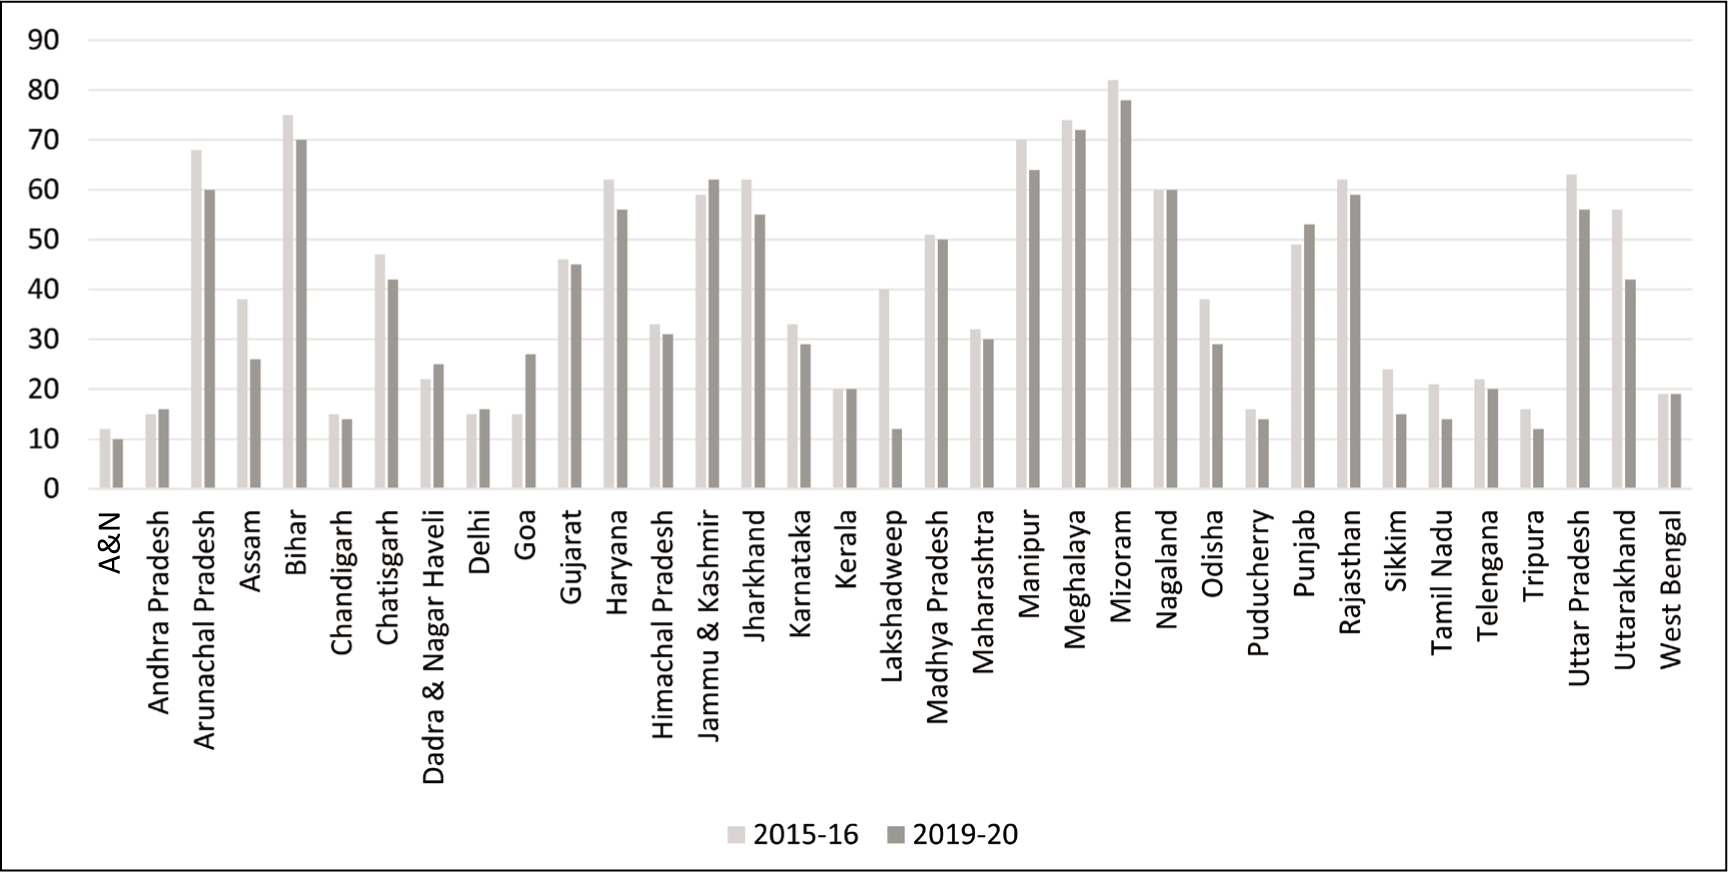
Indian women exhibit a robust desire for having son over daughter and this phenomenon is typical across almost all Indian states. On that basis, in 2015–2016, Mizoram (82%) followed by Bihar (75%) have the highest level of son preference. On the other hand, Goa and Andhra Pradesh (15%) followed by Tripura (16%) have the lowest level of son preference (Figure 2).
During the fifth round of NFHS, there are lots of changes in terms of state ranking. Goa, the state with the least son preference in the fourth round of NFHS, has shown sharp reversal in the latest round. With 27% women desiring to have more children among the mothers with two girl child and no boy child, the state slipped to the ninth position in terms of no son preference. During the fifth round, Tripura secured the first position with only 12% women willing to have more children after having two girls followed by Tamil Nadu (14%). Again Mizoram (78%), followed by Meghalaya (72%), registered the highest level of revealed son preference. It is notable that there is a general and positive trend of declining son preference across the Indian states with few exceptions like Punjab, Jammu and Kashmir, Andhra Pradesh and Goa (Figure 2).
Percentage of Women with Two Daughters Who Want More Children (Son Preference) During 2015–2016 and 2019–2020.
It is heartening to note that the average value of son preference in India has declined from 45.13% to 41.79% from 2015–2016 to 2019–2020. Similarly, the value of WEI has also shown an increasing trend in average terms, during the same period. Now if we look at the indicators of WEI, we can see that women have performed better in 2019–2020 compared to 2015–2016 in terms of each of the eight indicators. The mean value of educational attainment of higher secondary level and beyond has increased from 6.74% to 7.78%, while for contraceptive decision-making power, it increased from 86.85% to 92.4%. The average household decision-making power of women across all states has increased from 68.02% to 77.13% from 2015–2016 to 2019–2020. The average workforce participation of women has increased from 35.11% to 37.12% during the same period. The average percentage value of women having own asset in terms of land or house has increased from 43.51% to 47.78% during the same period. Women having own bank account has increased substantially in average percentage value from 58.73% to 78.6% while average percentage of women having access to mobile phones has also increased from 47.36% in 2015–2016 to 58.95% in 2019–2020. The average share of women having access to hygienic practice during menstrual period has increased from 42.97% to 55.46% during the same period.
Further, the t test shows that although WEI has increased significantly from 2015–2016 to 2019–2020, the decrease in the average value of son preference is not significant between the two time periods. Among the indicator variables, the mean values of household decision-making power, having own bank account and hygienic practices during menstrual days also have changed significantly (Table 1).
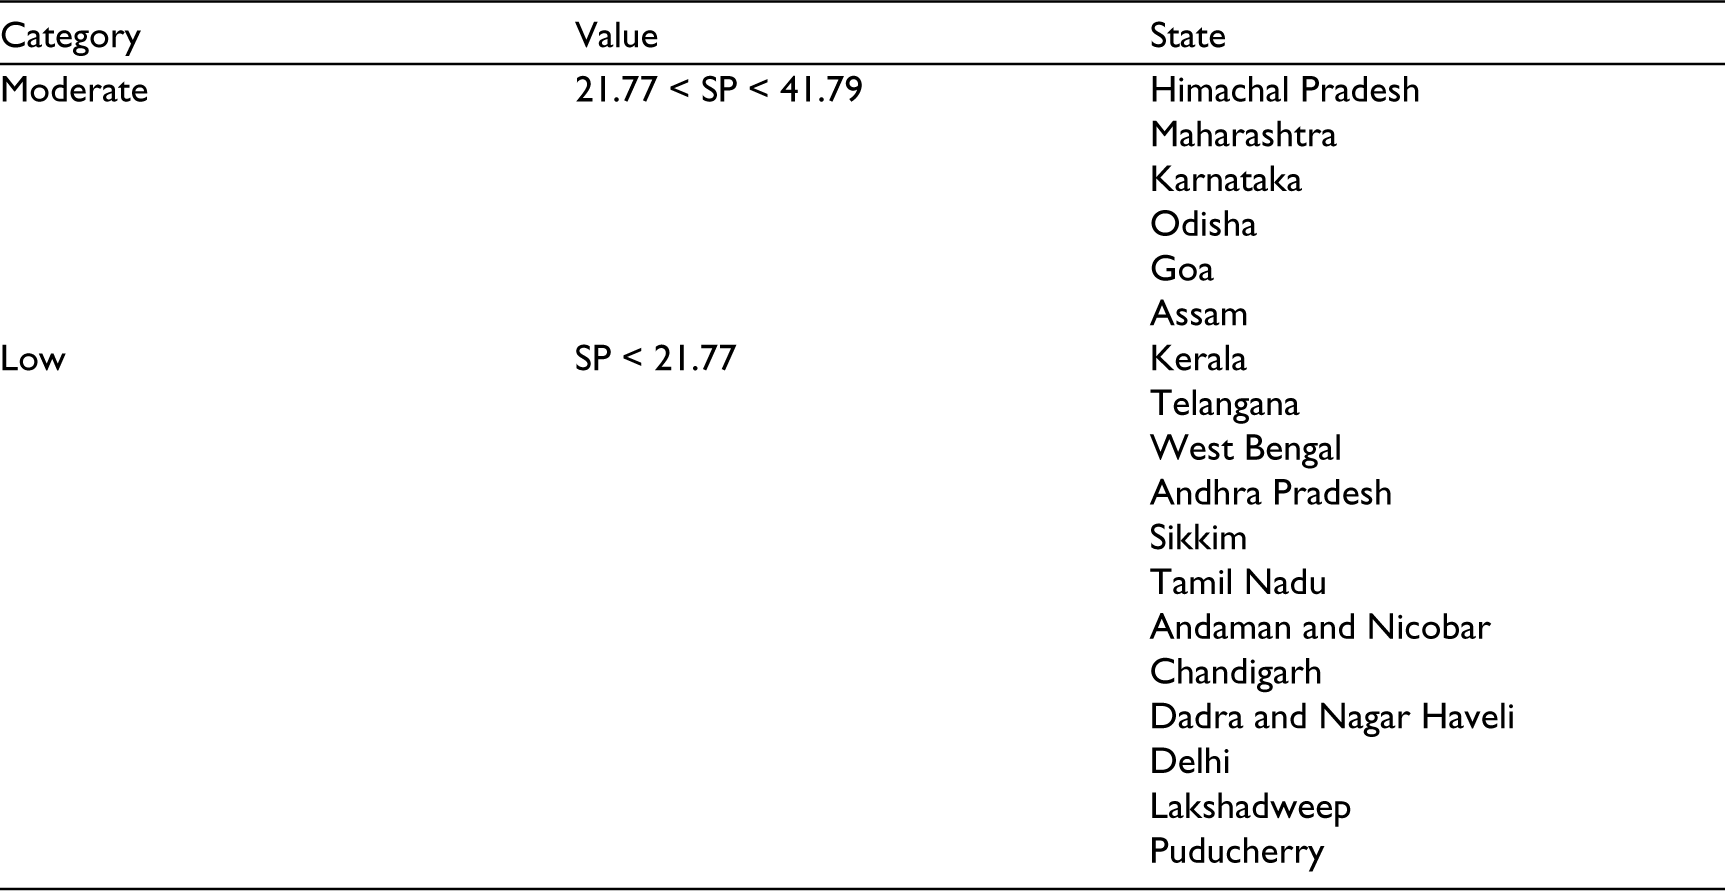
From the categorisation of the states broadly into four groups, we can see the state of Goa, northeastern state of Manipur, southern state of Tamil Nadu and Kerala along with Union Territories of Andaman and Nicobar and Chandigarh have comparatively very strong women’s empowerment in 2015–2016. The southern states of Karnataka, Andhra Pradesh, Telangana, northeastern states of Arunachal Pradesh, Meghalaya and Nagaland, northern states of Himachal Pradesh, Uttarakhand, Uttar Pradesh, Haryana, western state of Maharashtra along with Union Territories of Delhi, Puducherry and Lakshadweep have strong empowerment. Eastern states of Jharkhand, Odisha, Chhattisgarh, northeastern states of Tripura, Sikkim, western state of Gujarat, northern states of Punjab, Jammu and Kashmir, Central states of Madhya Pradesh, western state Rajasthan, along with union territory of Daman and Diu have moderate empowerment. Eastern states of Assam, Bihar, West Bengal and northeastern state of Mizoram along with union territory of Dadra and Nagar Haveli register a low level of empowerment (Table 2).
Categorisation of States Based on Women’s Empowerment with Son Preference in 2015–2016.

In 2019–2020, Telangana and Puducherry make a new entry in the very strong category while Goa, Manipur, Andaman and Nicobar and Chandigarh could not sustain their position in this category. Maharashtra slipped from the strong to moderate category while Assam, Bihar and West Bengal along with Dadra and Nagar Haveli marked an improvement by moving from low category to moderate category while Tripura’s position deteriorated from moderate to low category (Table 3). There is a sharp deterioration in the position of Goa and Andaman and Nicobar as they slipped from very strong category to low category. Notably, with few exceptions, we find some region-specific clustering patterns in the categorisation of the states in terms of degree of empowerment.
Categorisation of States Based on Women’s Empowerment with Son Preference in 2019–2020.

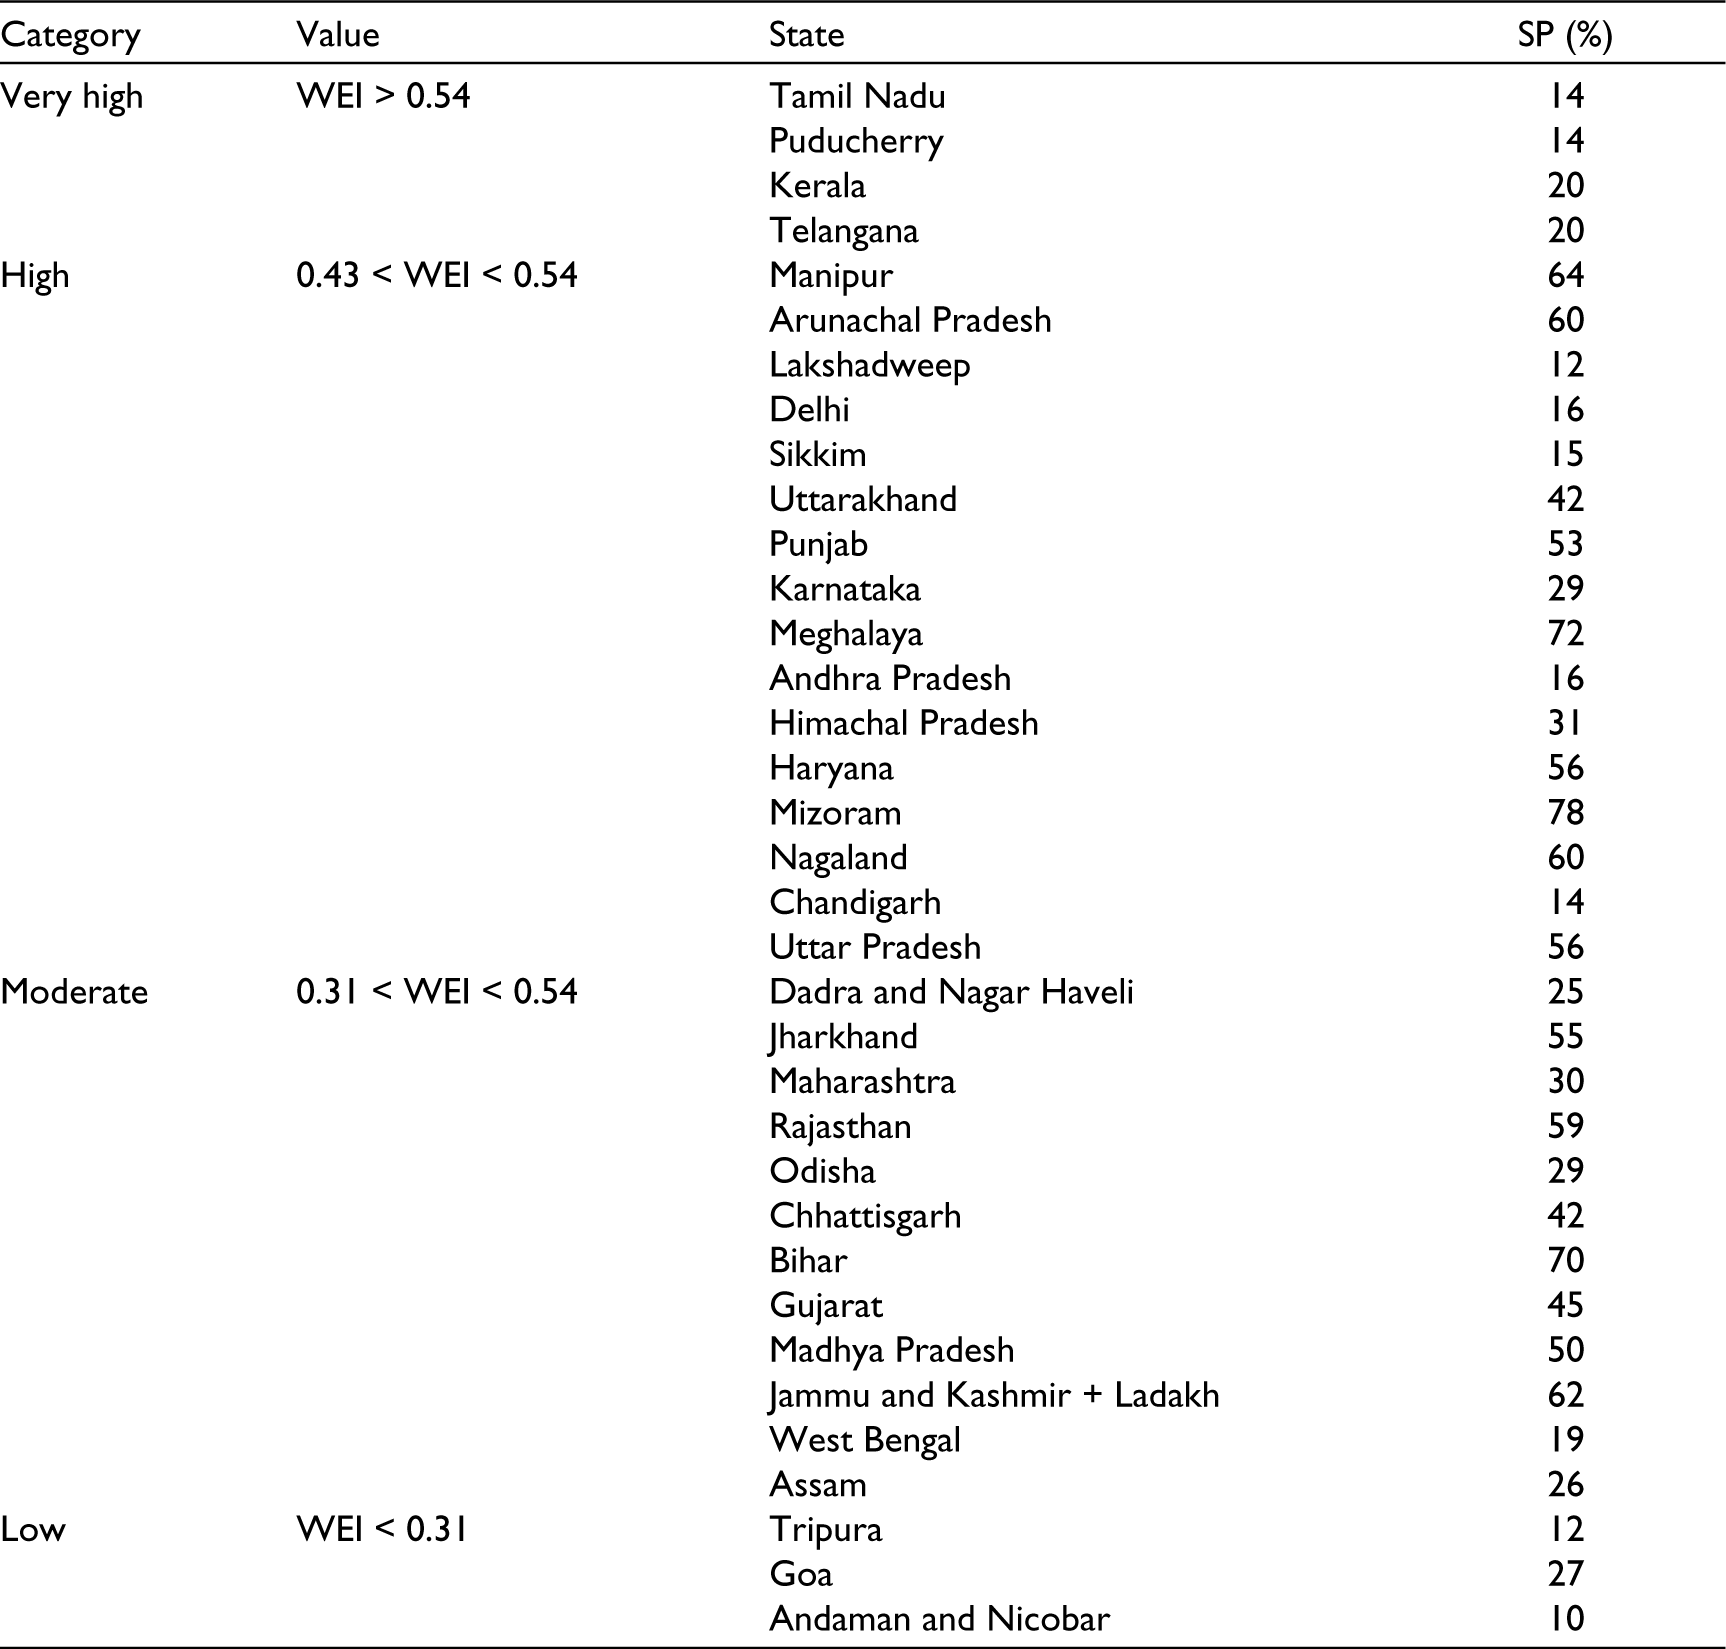
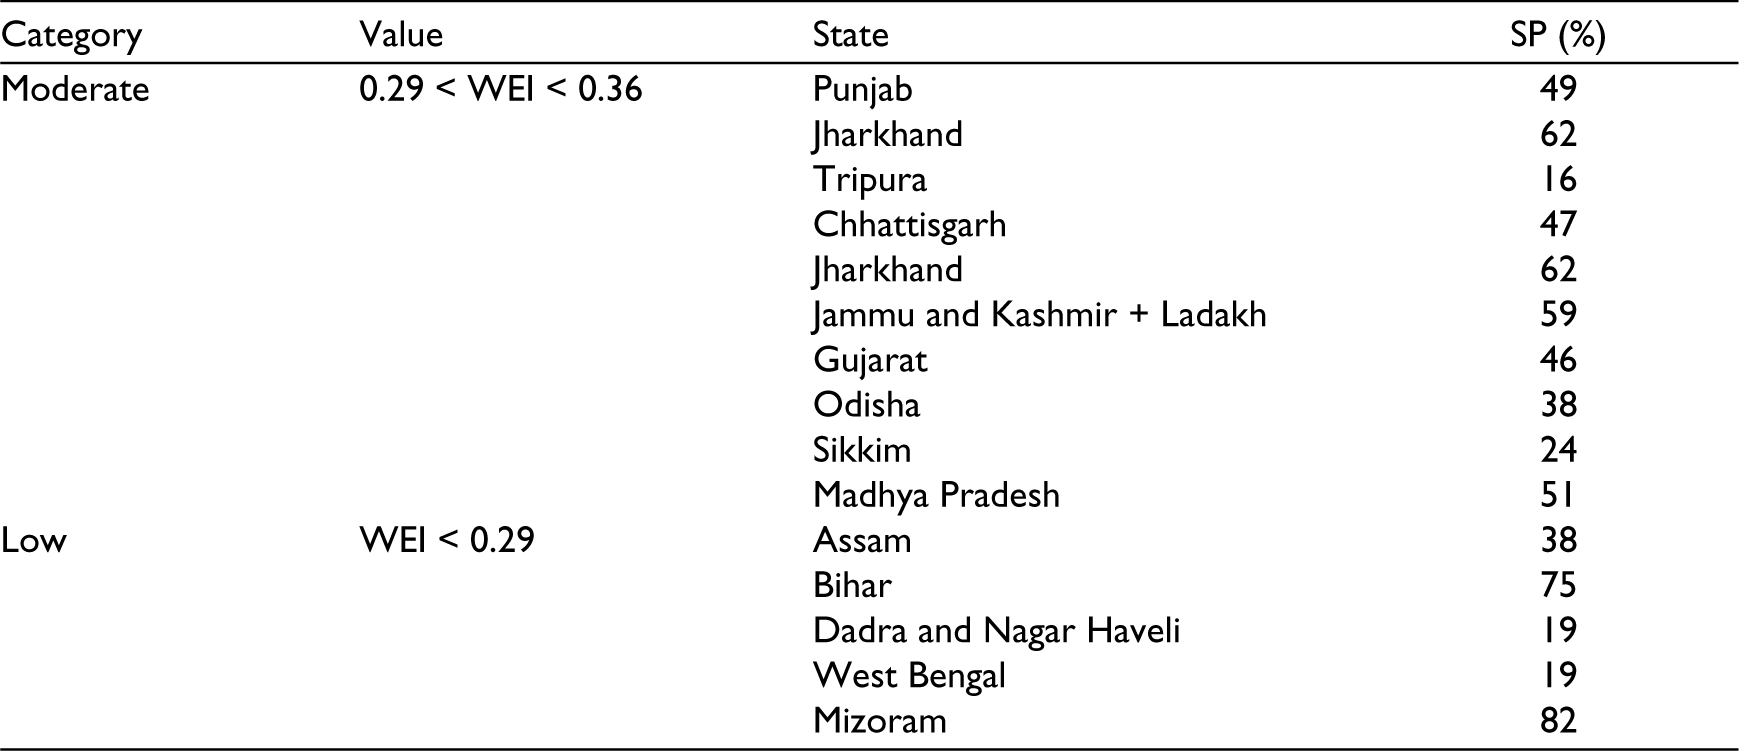
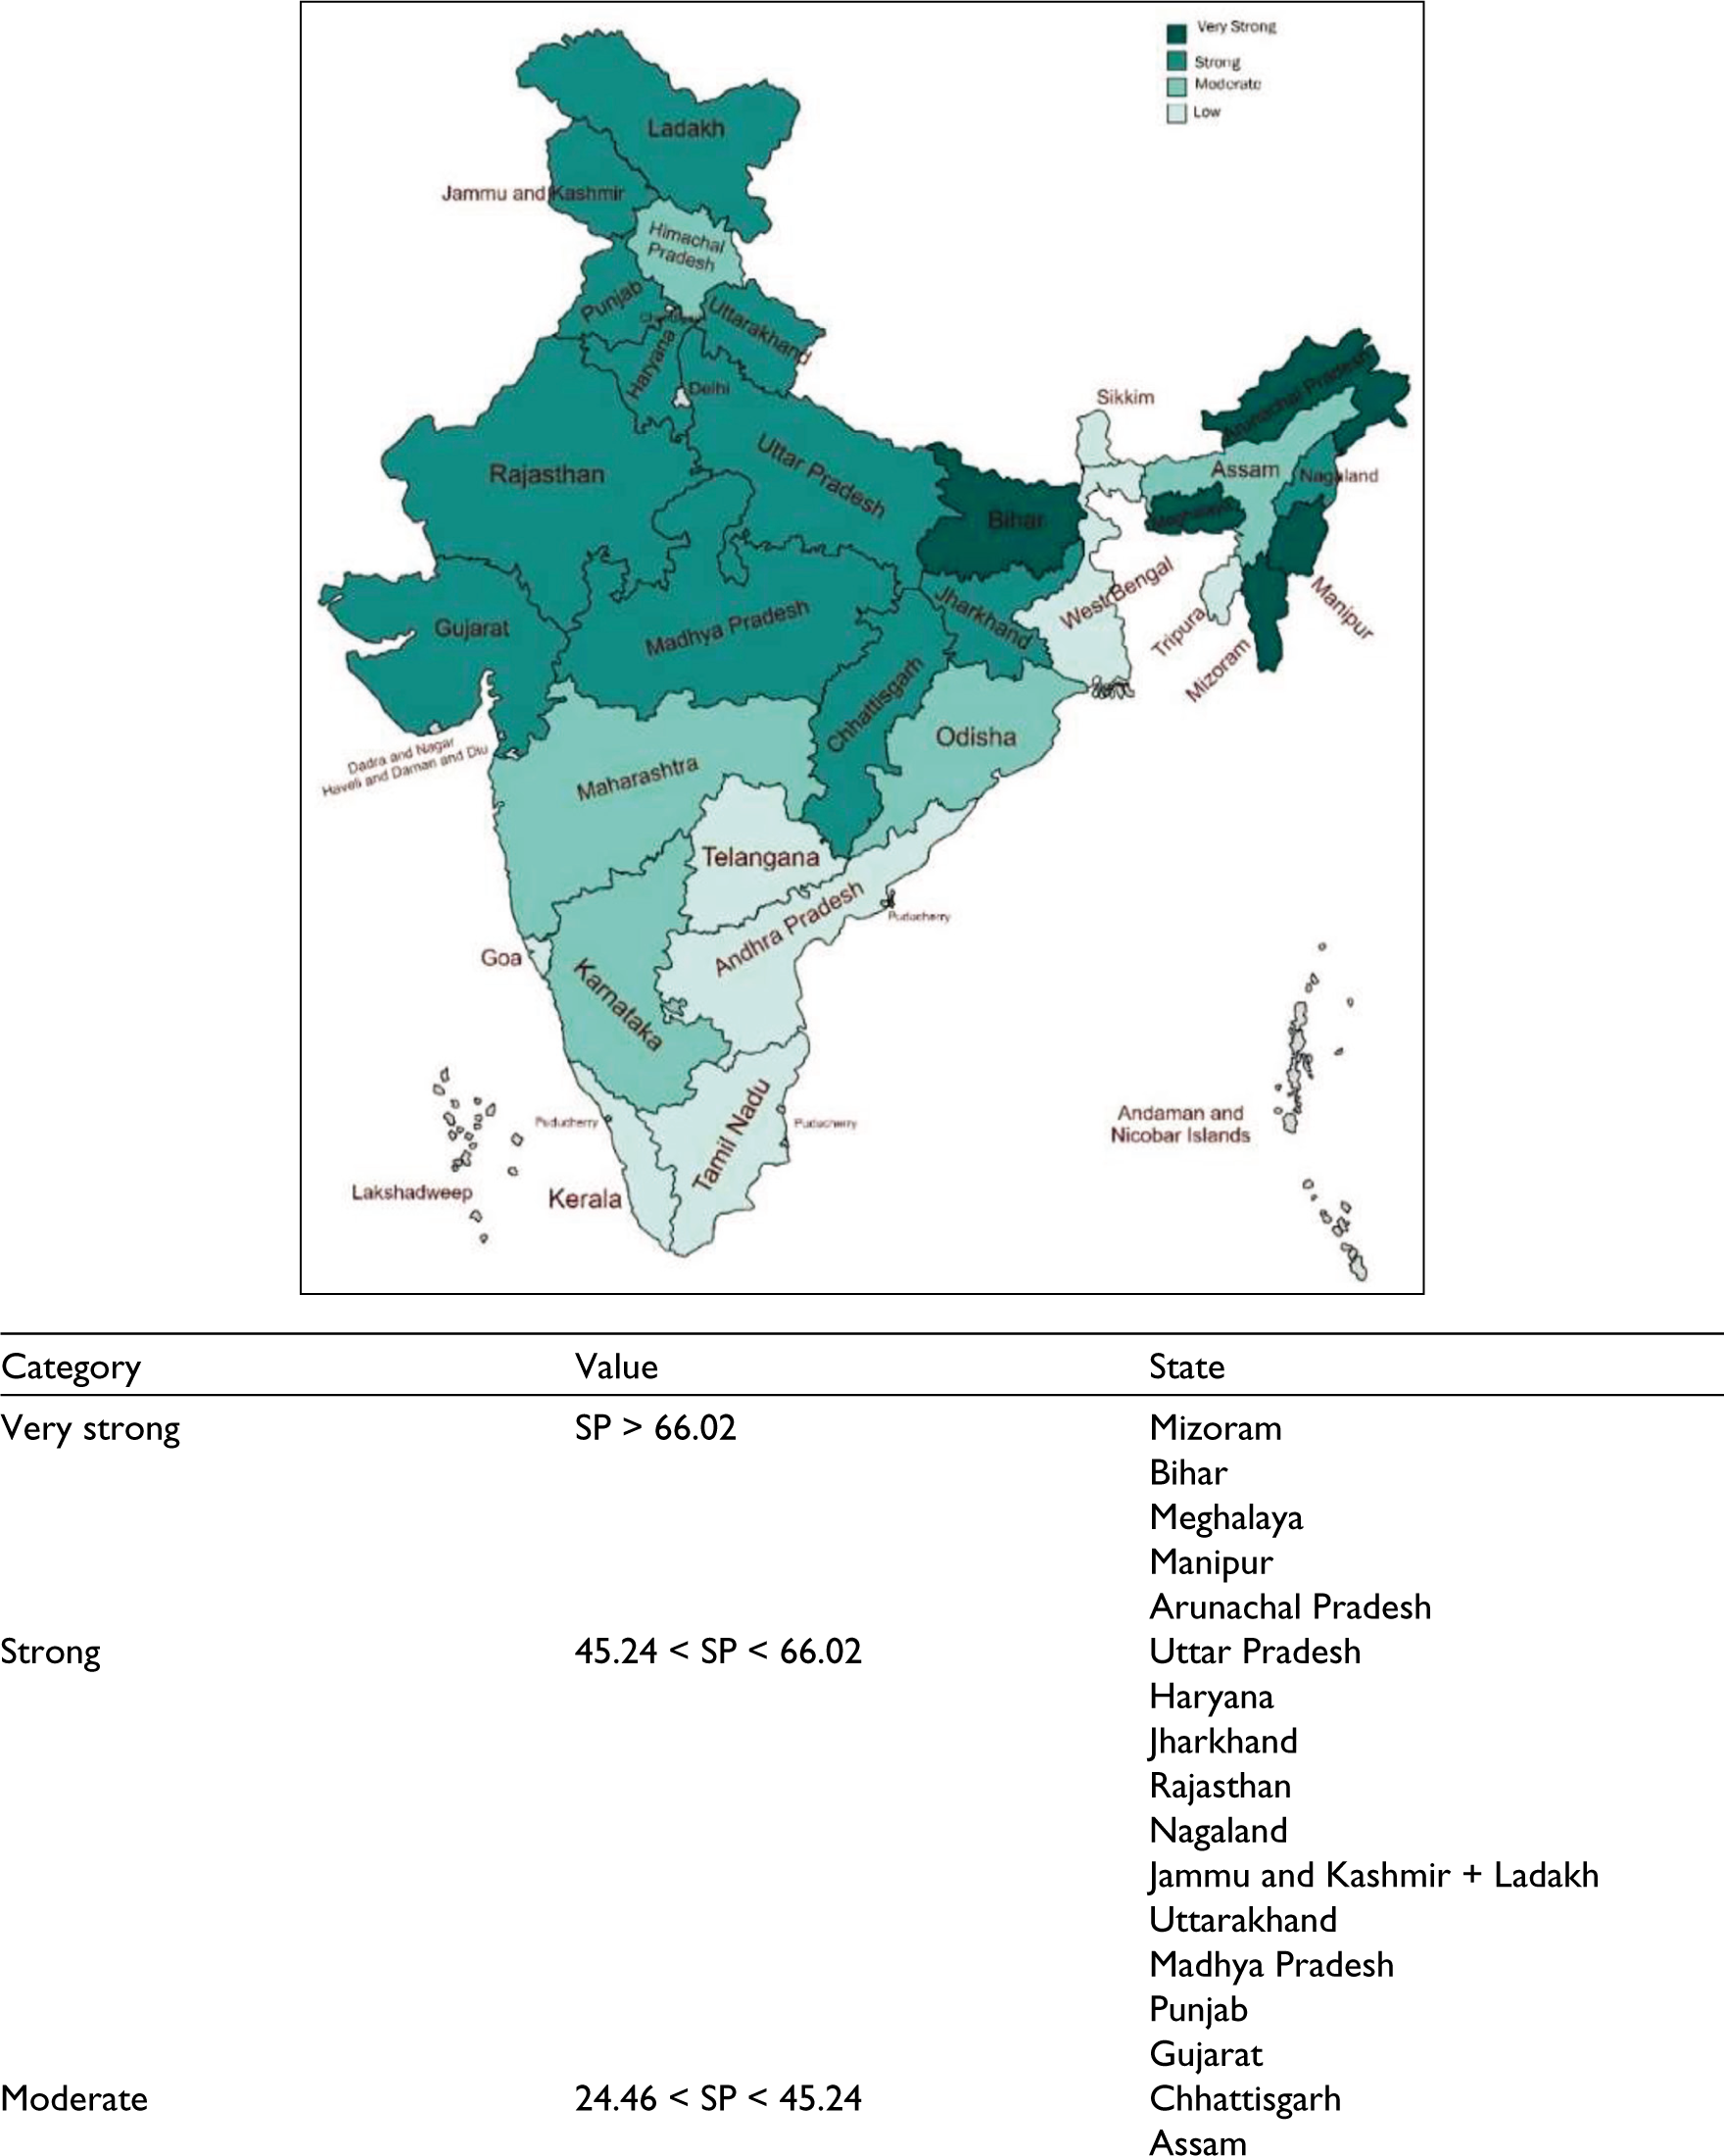
Coming to son preference, we can see that northeastern states, namely Arunachal Pradesh, Meghalaya, Manipur and Mizoram and eastern state of Bihar register very strong son preference during 2015–2016. Gujarat, Haryana, Jammu and Kashmir, Jharkhand, Madhya Pradesh, Nagaland, Punjab, Rajasthan, Uttar Pradesh and Uttarakhand show strong level of son preference. Eastern states of Assam, Odisha, southern states of Karnataka along with Maharashtra, Chhattisgarh and Himachal Pradesh have shown moderate son preference. Southern states of Andhra Pradesh, Kerala, Tamil Nadu, Telangana along with eastern states of West Bengal, Tripura, northeastern state Sikkim and Goa have low level of son preference during 2015–2016 (Table 4).
Categorisation of States Based on Son Preference in 2015–2016.

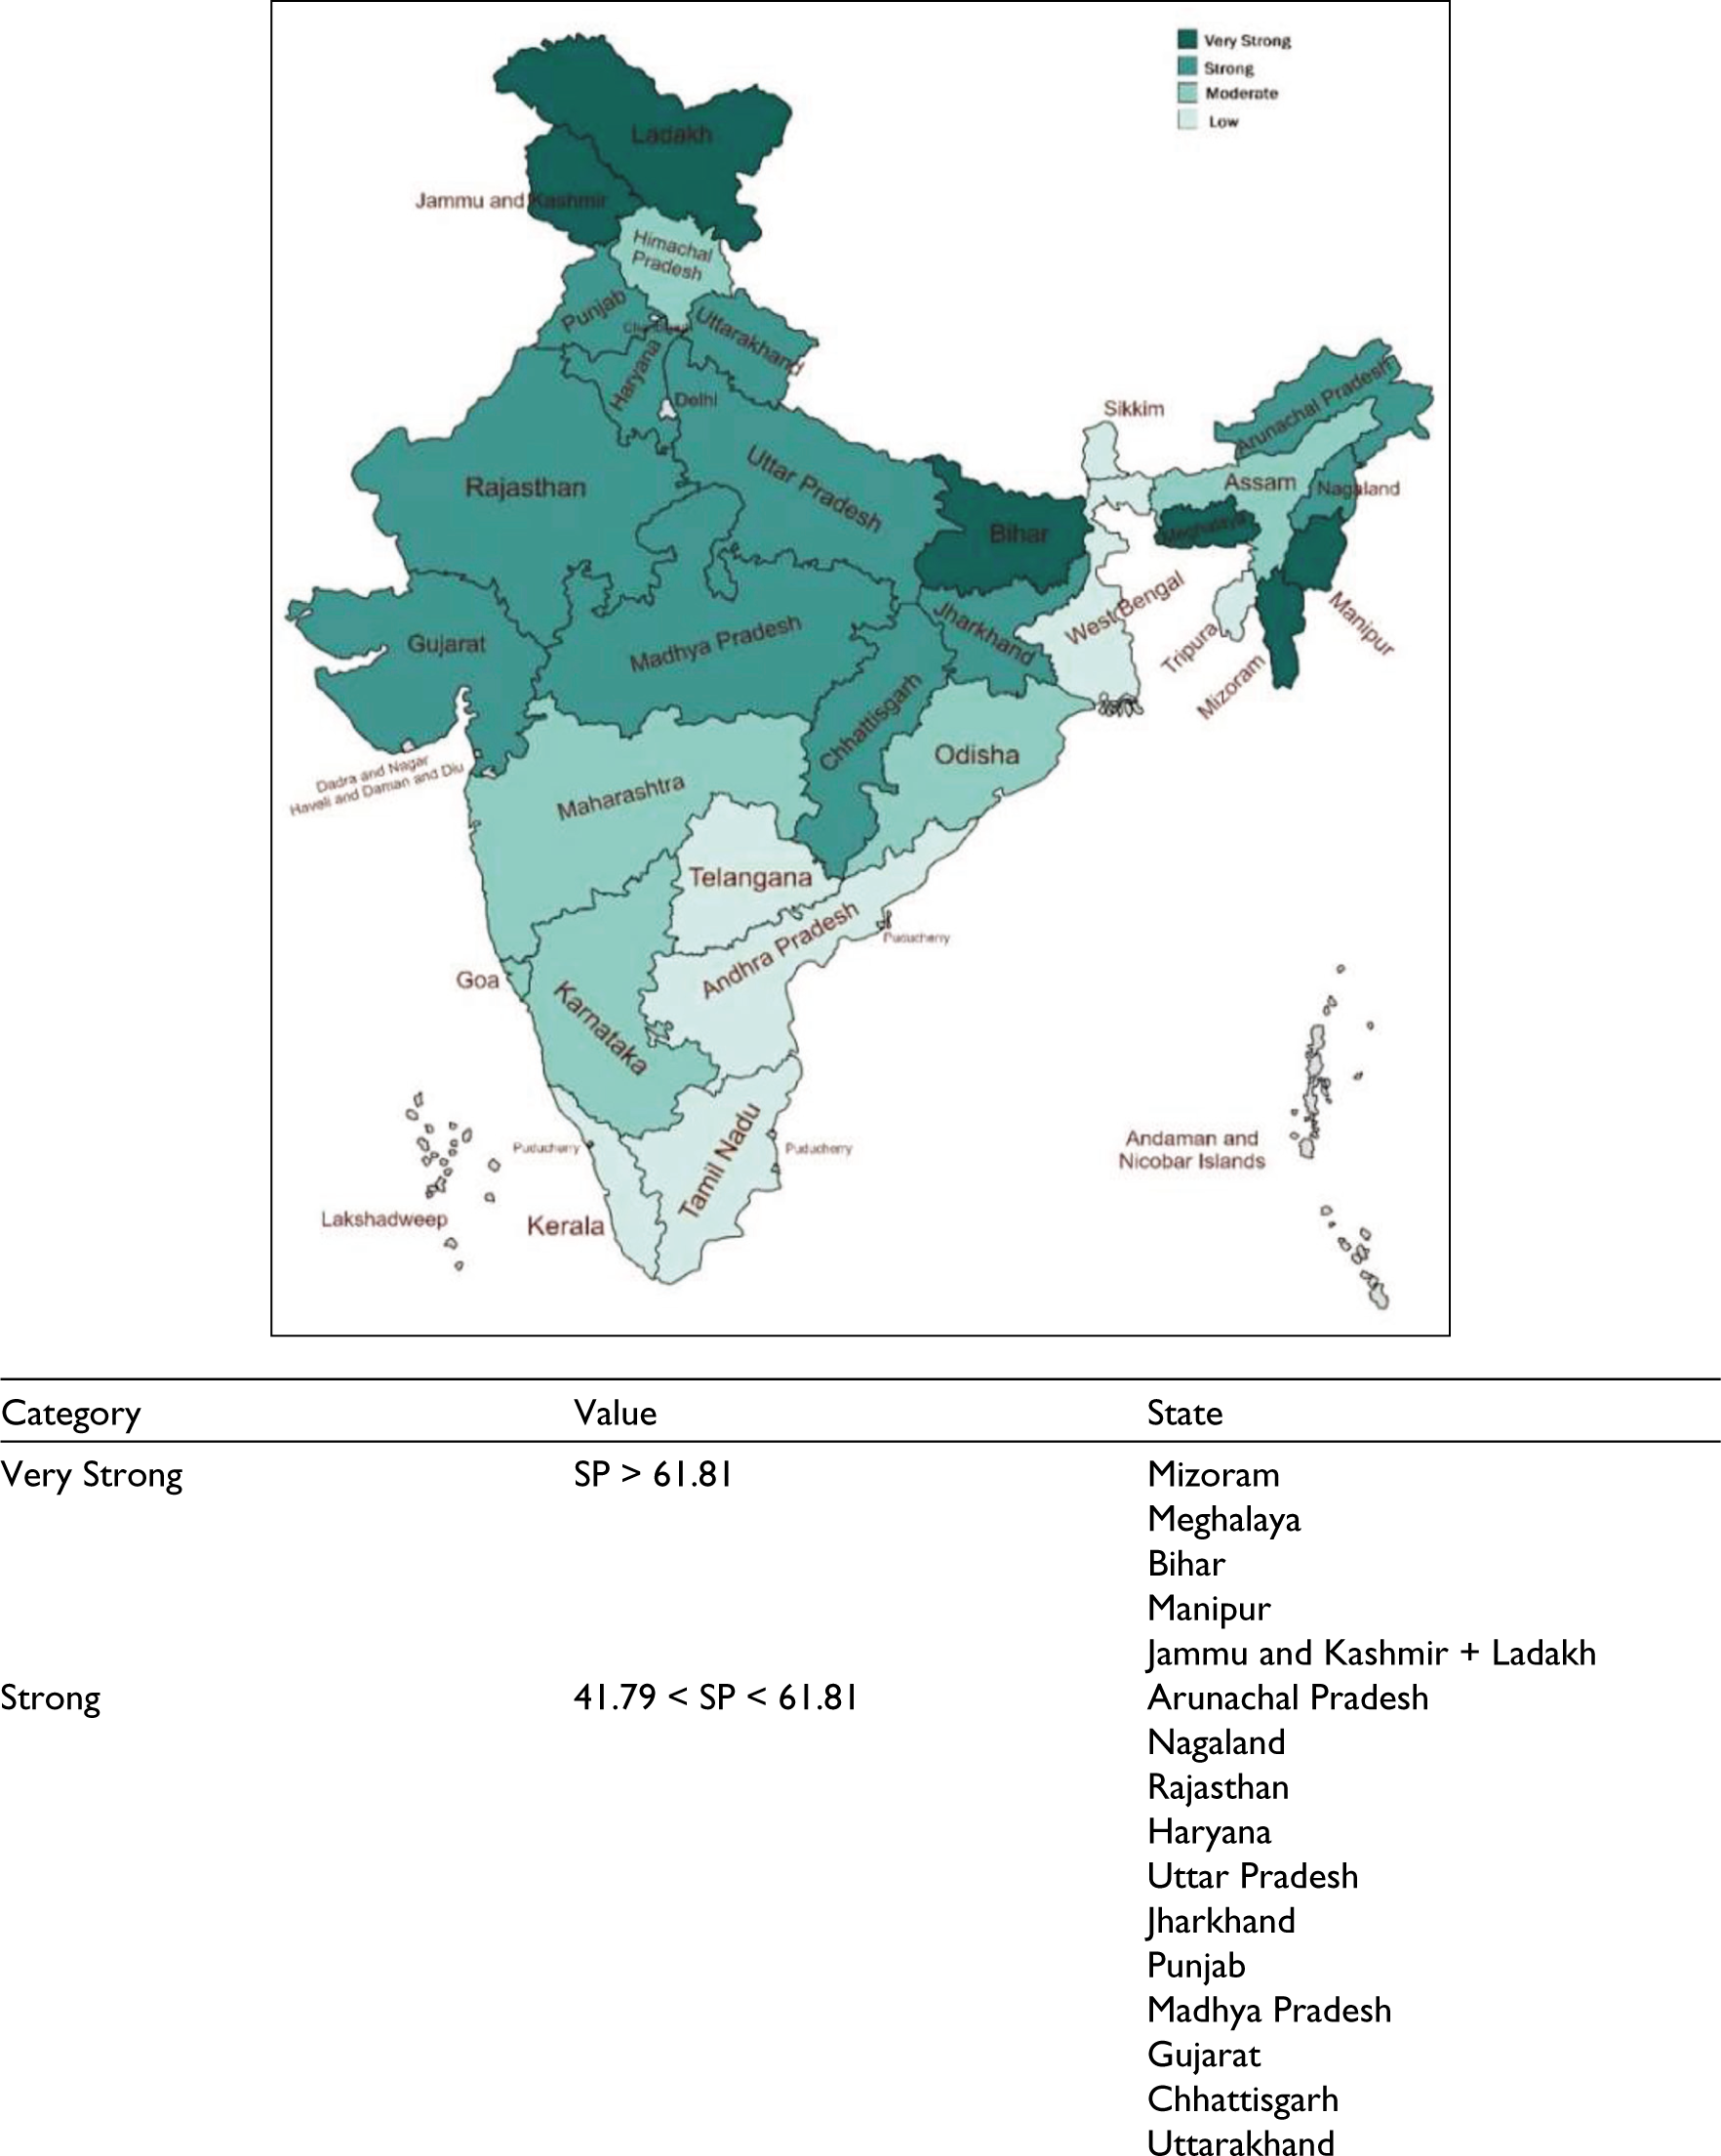
During 2019–2020, we see some changes in the categorisation of states based on son preference. While Jammu and Kashmir shows an increase in desire for sons among mothers and moves from the strong son preference category to very strong category, in Arunachal Pradesh, there is a decline in son preference and the state moves from very strong to strong category. Even Goa, the state with least son preference in 2015–2016, worsened its position by moving from low son preference to moderate son preference category in 2019–2020 (Table 5).
Categorisation of States Based on Son Preference in 2019–2020.
From the categorisation of states in terms of women’s empowerment and son preference, we can see that for some states the desire to have more sons is negatively associated with women’s empowerment. Rajasthan, Madhya Pradesh and Bihar show such negative association as these states registered high levels of son preference and low levels of women’s empowerment in both rounds of NFHS. However, that is not true for all the states. States which have a high level of women’s empowerment do not necessarily fall in the low son preference category. Northeastern states like Manipur, Meghalaya, Mizoram, which have a very strong or strong level of women’s empowerment, also have very strong or strong level of son preference in both the rounds of NFHS. Similarly, Tripura which falls in the low category of empowerment in 2019–2020, fall in the low category of son preference in both periods. Further, just like women’s empowerment, with a few exceptions, a regional pattern is also revealed through the categorisation of son preference implying women’s empowerment, as well as son preference in India depending on the region from where a woman belongs.
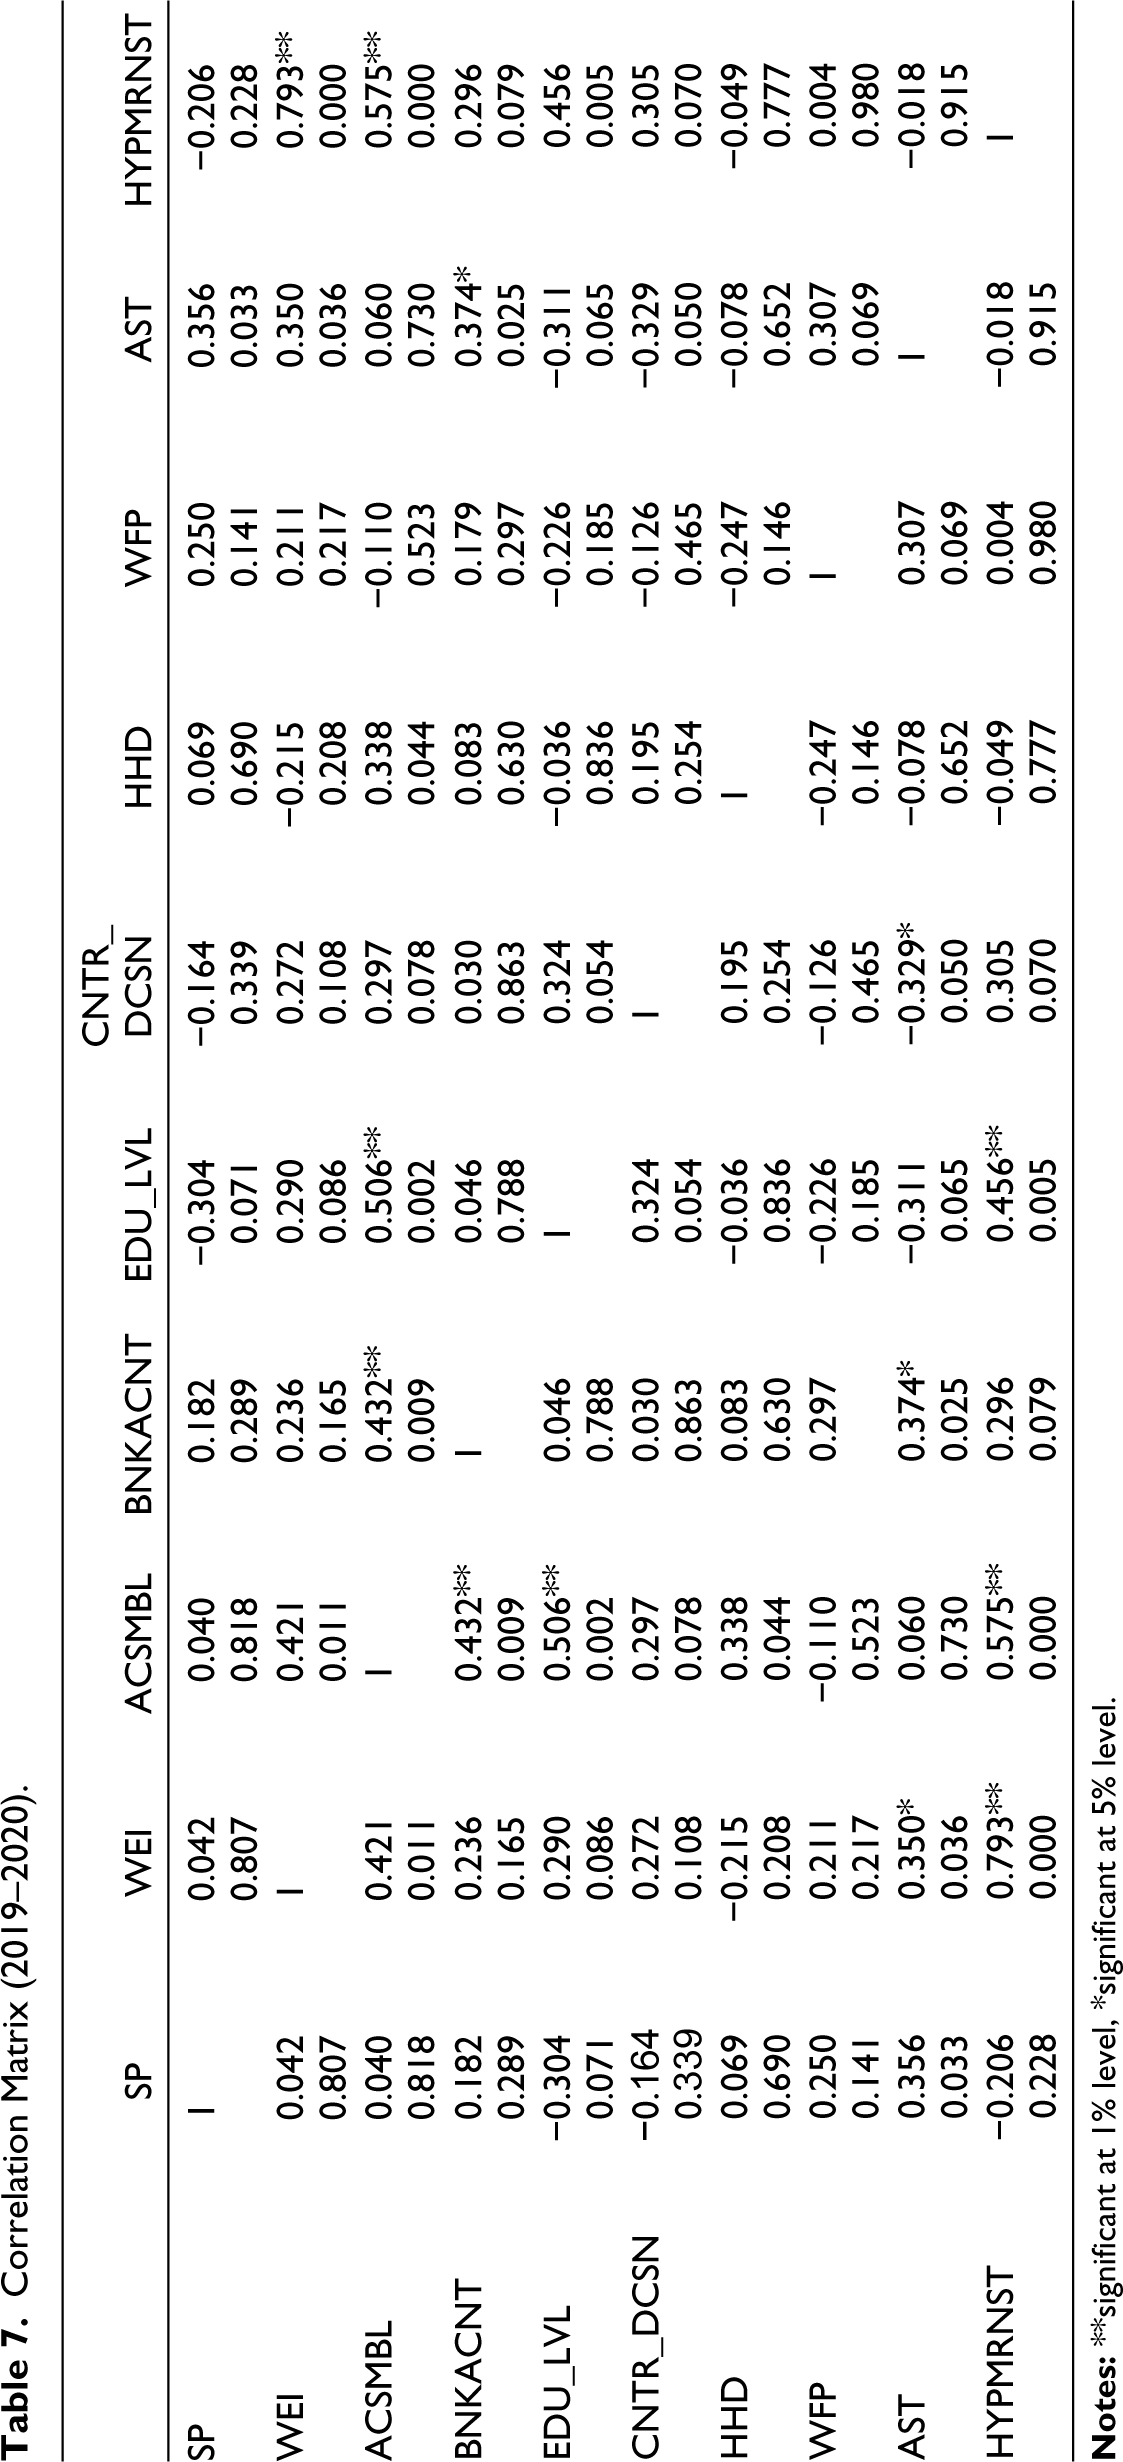
The correlation matrix (Table 6 and 7) for both the periods reveals the degree of association between the son preference, WEI and each of the indicators of WEI. In both the time periods, no indicator has any significant association with the level of son preference except the negative significant association between the indicator of having own bank account and son preference in 2015–2016. We also find some random associations between the indicators of women’s empowerment themselves. However, the most notable result from the correlation matrix is that for both the rounds, the association between WEI and son preference is not significant at all.
Correlation Matrix (2015–2016).
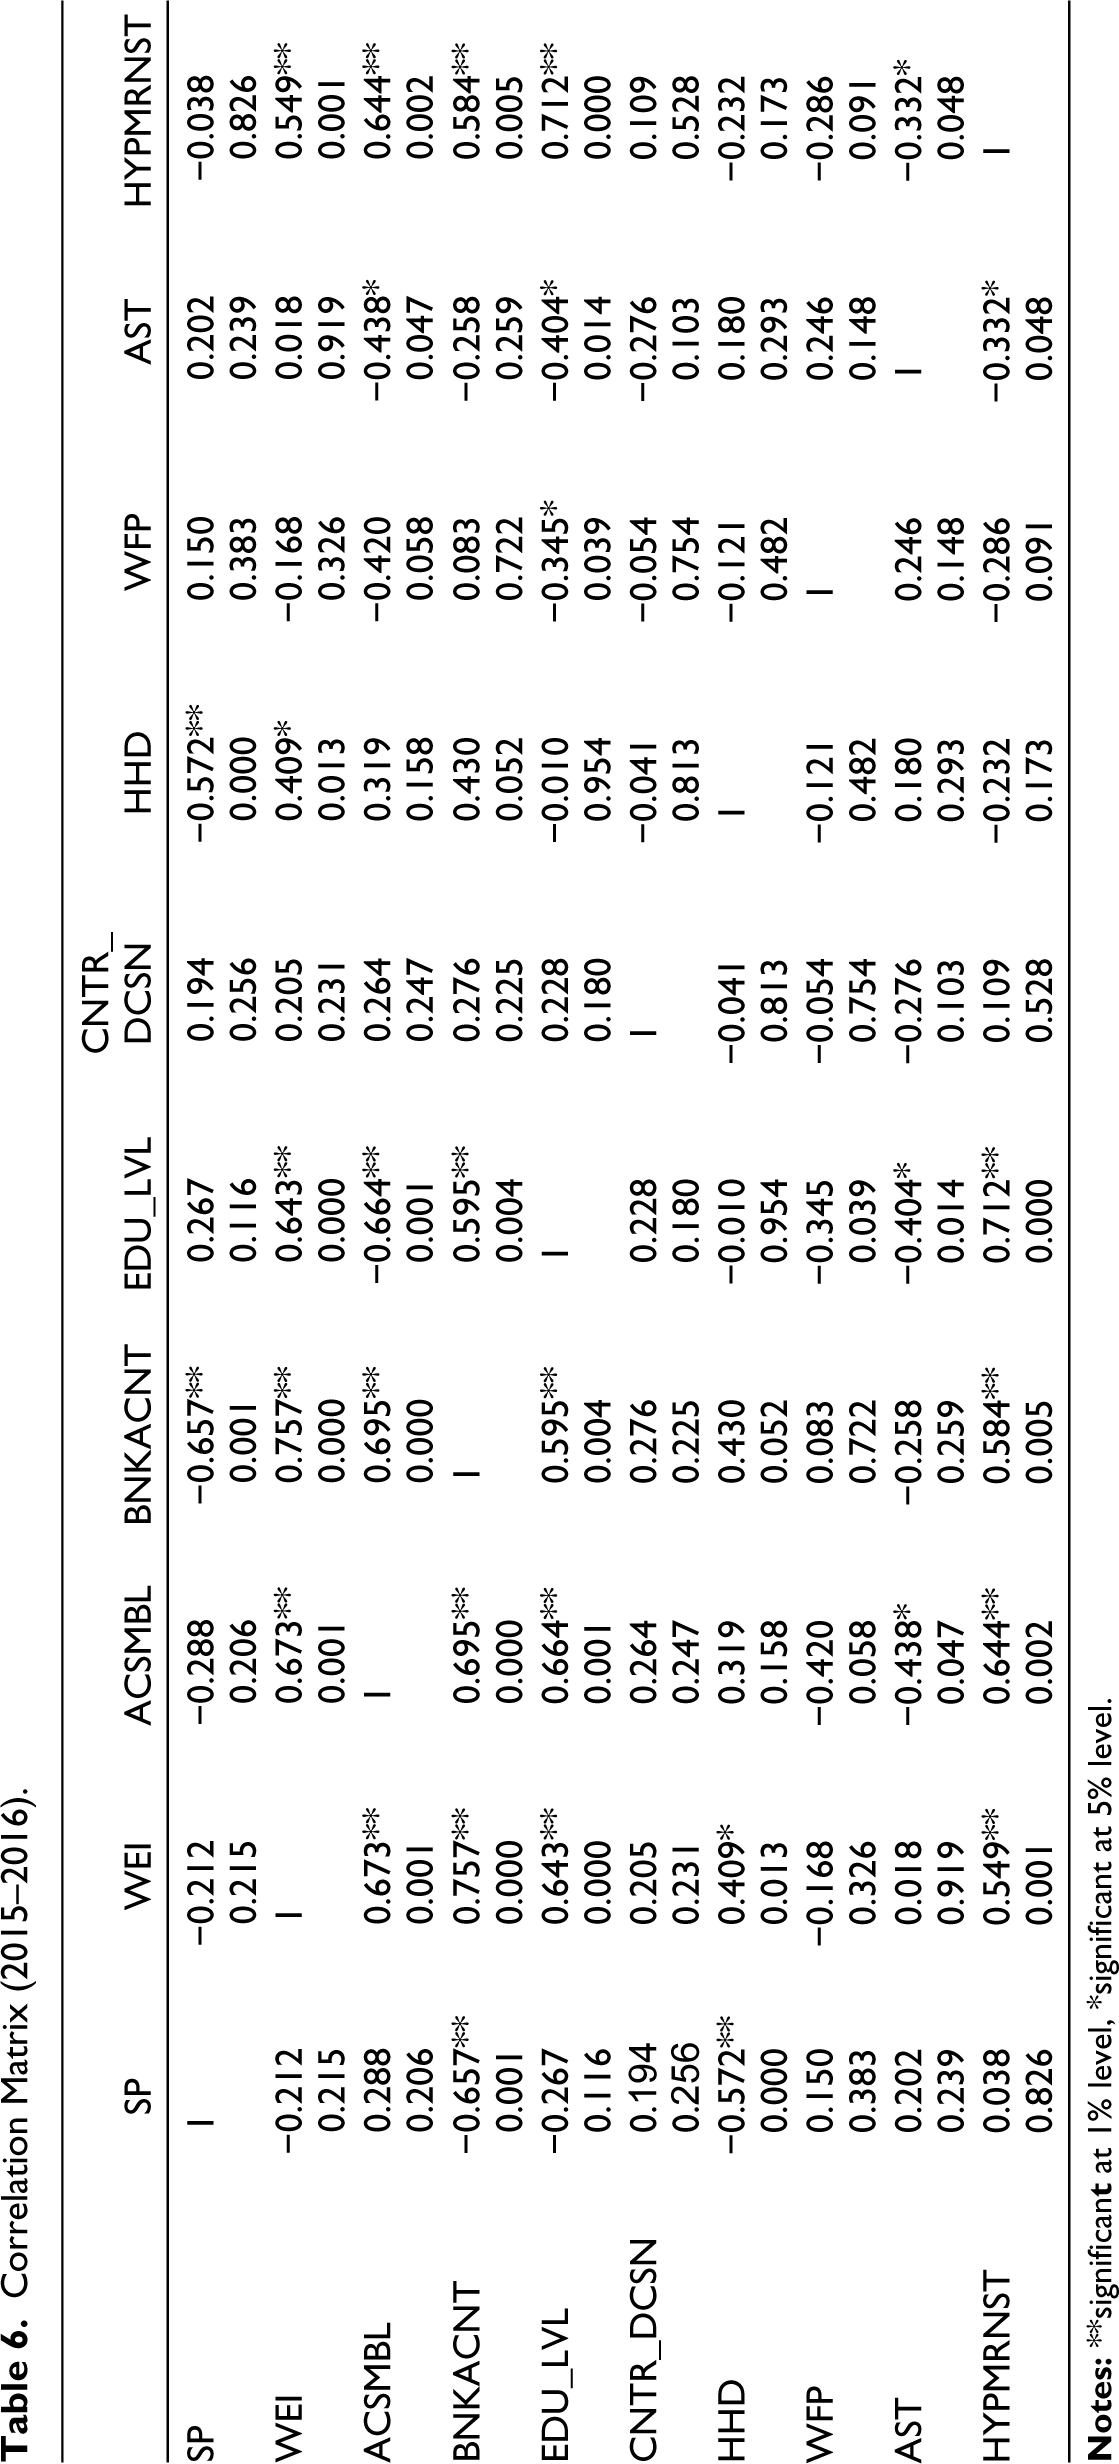
Correlation Matrix (2019–2020).
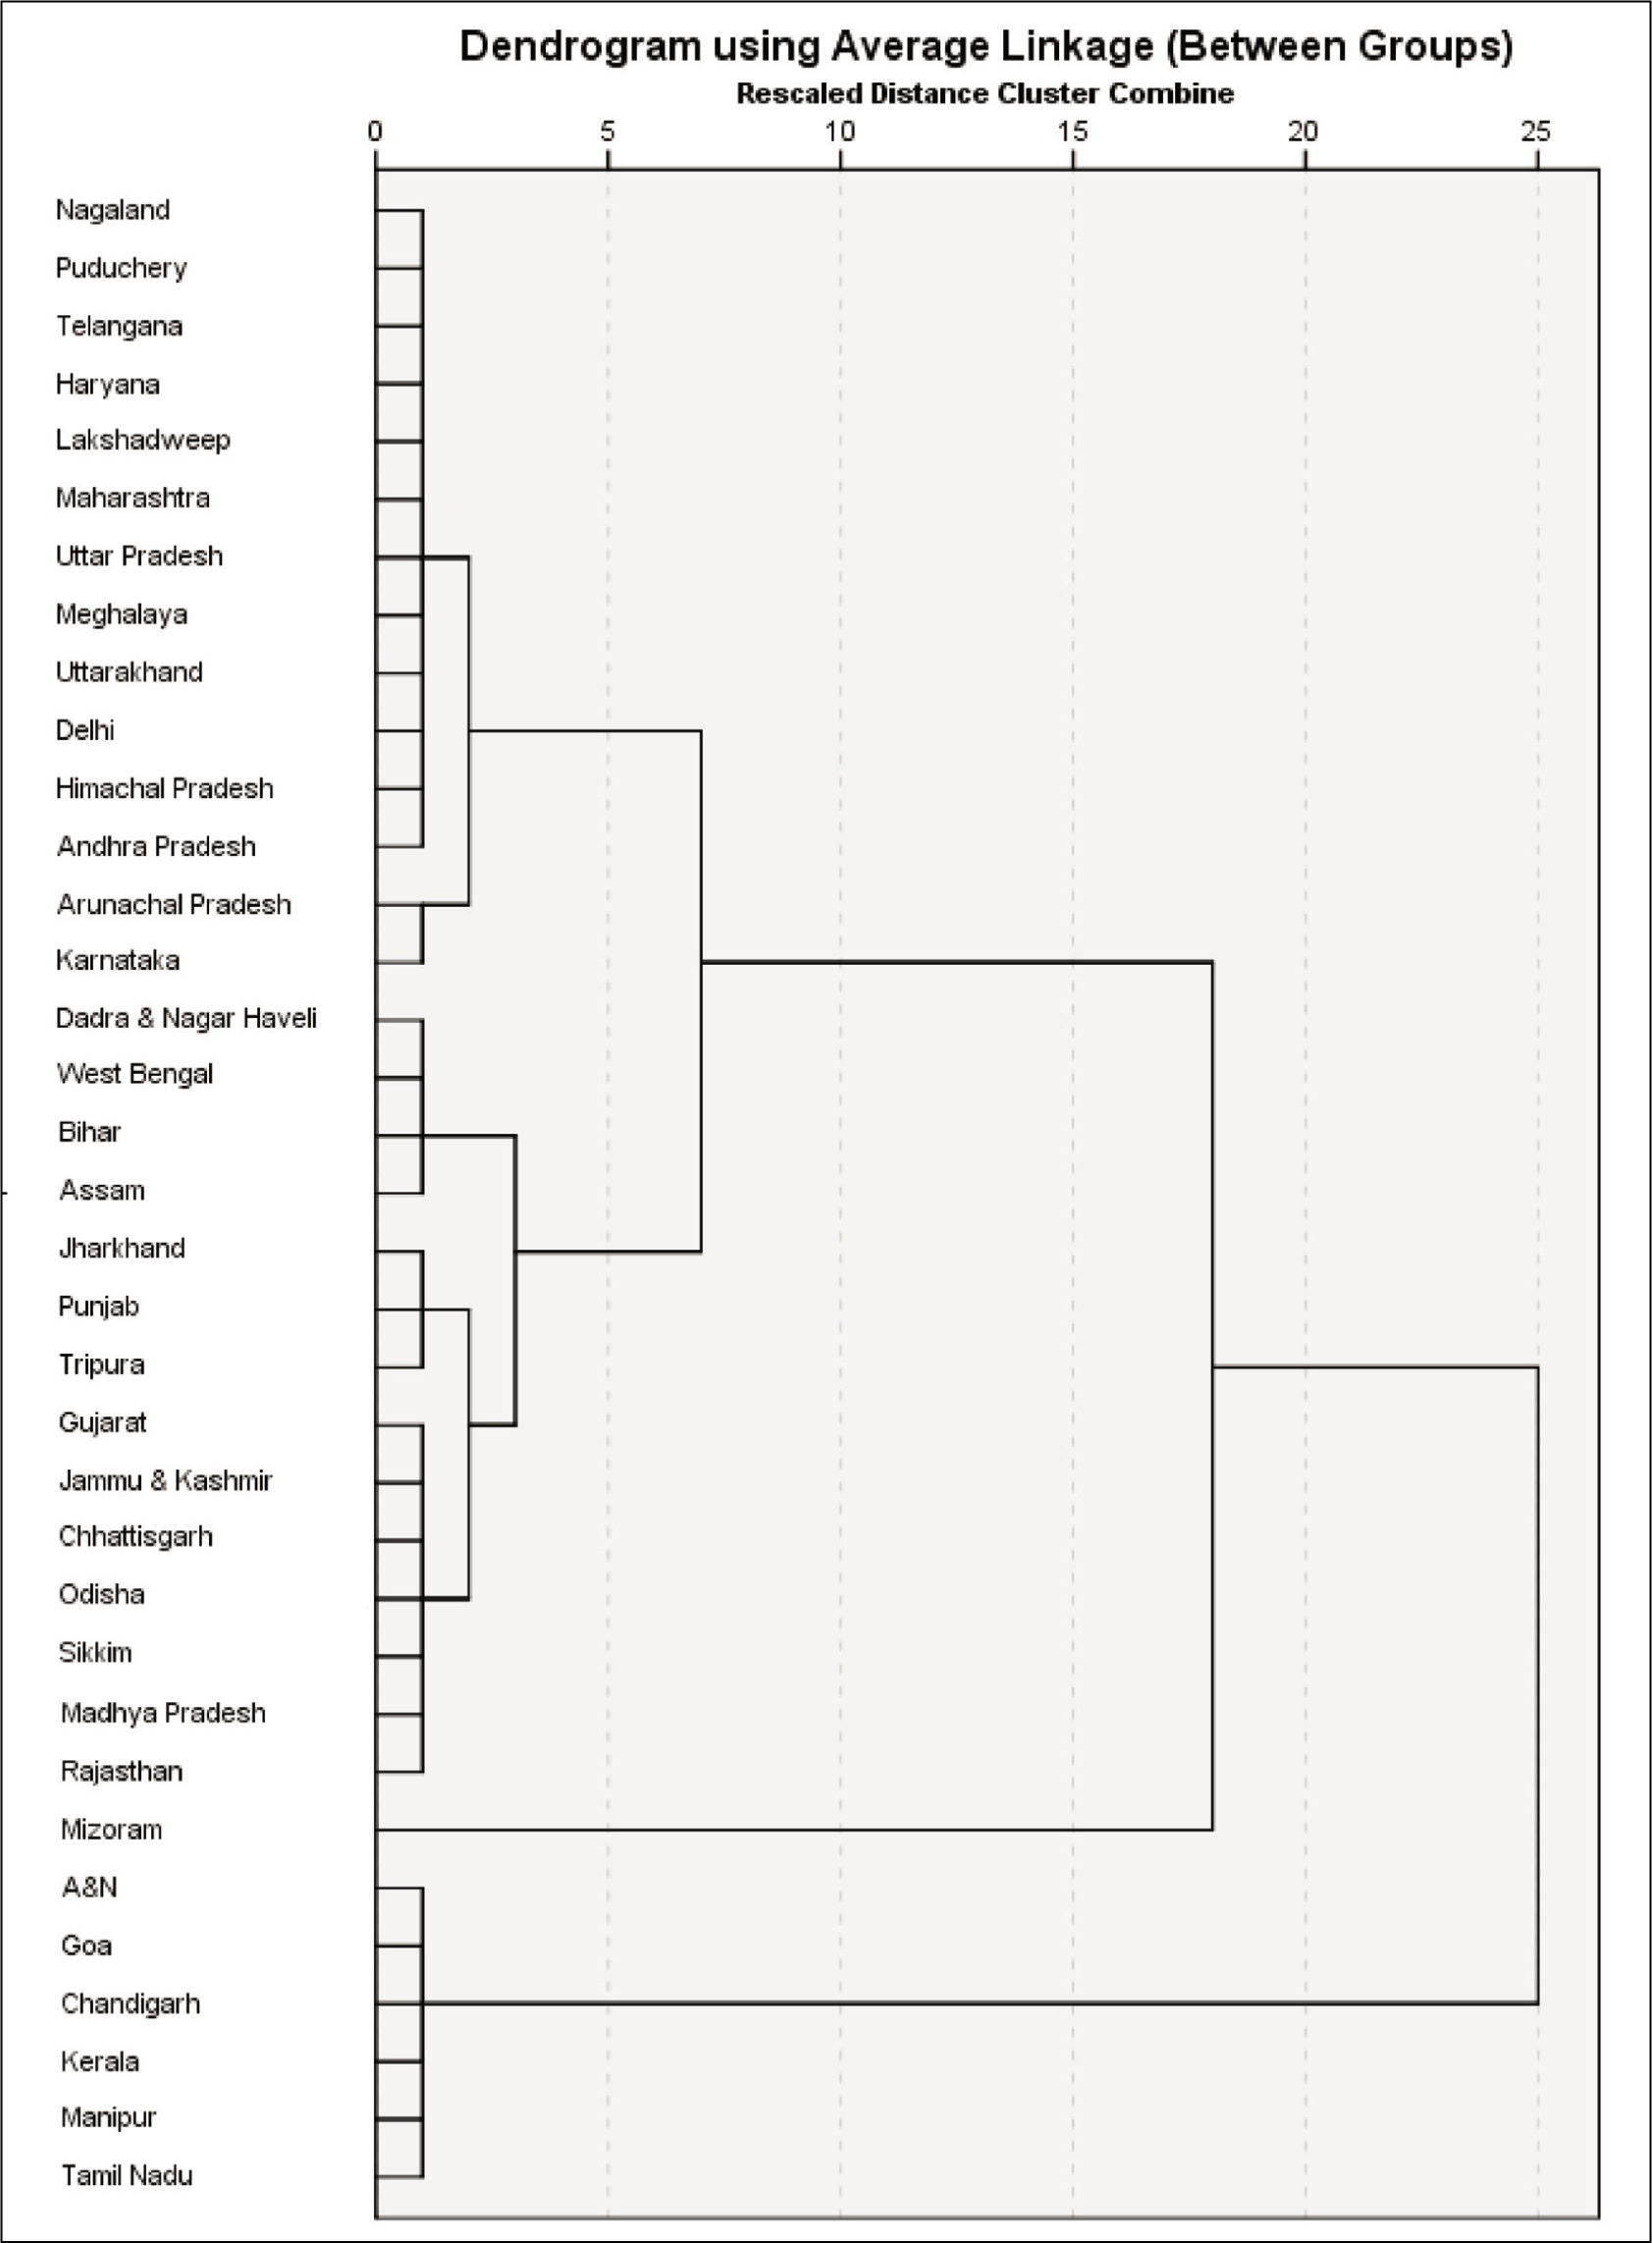
Apart from the ranking of the states and correlation matrix analysis, we find out the closeness of the values of the WEI as well as son preference across states by performing cluster analysis. The dendrograms have been used to explore the clusters of the states in respect of the indicators of women’s empowerment and in respect of the degrees of son preference. On the x axis, we have dissimilarity of the cases which is rescaled on a scale of 0–25 and on the y axis we have the names of the states.
As per the analysis suggested by the dendrogram in NFHS4, the states with low empowerment, namely states of Bihar, Assam, West Bengal along with Dadra and Nagar Haveli form one cluster. Similarly, all the states with high level of empowerment form a single cluster (Figure 3). According to the dendrogram analysis in NFHS5, the clustering of states follows the similar pattern like NFHS4. States with high or very high level of empowerment forms single cluster while states with low level of empowerment fall in the same cluster of moderate empowerment (Figure 4).
Cluster Analysis Based on Women’s Empowerment Index in 2015–2016.
Cluster Analysis Based on Women’s Empowerment Index During 2019–2020.

We can see, in 2015–2016, states with strong son preference, namely Uttar Pradesh, Jammu and Kashmir, Uttarakhand, Haryana, Rajasthan, Nagaland and Jharkhand fall in the same cluster. Punjab and Madhya Pradesh, the other states categorised as having strong son preference along with Chhattisgarh and Gujarat, states with moderate son preference fall in the same cluster. Bihar, Arunachal Pradesh, Meghalaya, Manipur and Mizoram—the states with very strong son preference fall in the same cluster. States of Assam, Odisha, Himachal Pradesh, Maharashtra and Karnataka—all the states with moderate son preference form one cluster. Similarly, states of Andhra Pradesh, Kerala, Tamil Nadu, Telangana, Tripura, West Bengal, Sikkim, along with Goa all the states with low son preference fall in the same cluster (Figure 5).
Cluster Analysis of States Based on Son Preference in 2015–2016.

In the fifth round of NFHS, Chhattisgarh, Uttarakhand and Gujarat, states with strong son preference fall in the same cluster. Arunachal Pradesh, Nagaland, Manipur, Jammu and Kashmir, the states with very strong son preference along with Rajasthan, the state with strong son preference fall in the same cluster. Haryana, Uttar Pradesh, Punjab, Jharkhand and Madhya Pradesh, the other states with strong son preference form another cluster. Bihar, Meghalaya and Mizoram, the states with very strong son preference fall in the same cluster. Assam, Goa, Karnataka, Odisha, Himachal Pradesh, and Maharashtra, the states with moderate son preference fall in the same cluster. Finally, all the states with low son preference, namely Kerala, Telangana, Tamil Nadu, Andhra Pradesh, West Bengal, Tripura and Sikkim form one cluster (Figure 6).
Cluster Analysis of States Based on Son Preference in 2019–2020.

Conclusion
The issue of son preference is complex and factors triggering this problem are multi-layered. A woman wants to have more children both due to family pressure and due to societal norms that are an integral part of her upbringing, or for the individualistic reason as being the mother of a son enhances an Indian woman’s societal status. Against this backdrop, we performed categorisation as well as cluster analysis of the states based on women’s empowerment and son preference in two different periods, namely 2015–2016 and 2019–2020 which give us very similar inference. Grouping of states reveals that many states which are categorised as having very strong or strong levels of women’s empowerment have very strong or strong level of son preference as well, indicating that a higher level of women’s empowerment does not necessarily lead to a lower level of son preference. The correlation matrix analysis reaffirms similar results where no significant association between son preference and women’s empowerment is found. Further, a statistical test has shown that although over time India’s degree of women’s empowerment has significantly improved, the level of son preference has not changed significantly. All the different techniques lead to similar inference—the degree of women’s empowerment has been increasing with a robust imprint at the national level but that did not lead to any significant reduction in son preference in India.
Footnotes
Declaration of Conflicting Interests
The authors declared no potential conflicts of interest with respect to the research, authorship and/or publication of this article.
Funding
The authors received no financial support for the research, authorship and/or publication of this article.