
Abstract
This article estimates bank-specific profit efficiency of three broad ownership groups of Indian banks during the period 1995–96 to 2011–12, using the stochastic frontier methodology. Results reveal that during the post-liberalisation period, public sector banks in India are the best performers in terms of estimated profit efficiency. Further, foreign banks operating in India record higher profit efficiency levels compared to domestic private banks. The introduction of prudential regulations, such as capital adequacy ratios, has had a significant positive impact on the profit efficiency of Indian banks, while loan defaults adversely affect their profit efficiency. Market power does not necessarily lead to an increase in profit efficiency, while bank mergers have had a significant positive effect. Contrary to the expectation that the Indian banking system is highly resilient and sufficiently robust to cope with external shocks, the results reveal that the ongoing global financial crisis has had a significant adverse effect on the profit efficiency of Indian banks.
1. INTRODUCTION
The efficiency of India’s banking system has been a major issue in the context of a changing economic and regulatory environment, both from the microeconomic as well as the macroeconomic point of view. From the micro viewpoint, banks are exposed to competition amongst themselves, not only through price competition but also through non-price competition (such as the provision of financial services), which motivates bank management to enhance efficiency levels, particularly profit efficiency. From the macro perspective, the efficiency of the banking sector influences the costs of financial intermediation and the overall stability of financial markets. Moreover, the recent global financial crisis has presumably put bank profitability under pressure, given that India’s domestic financial markets are integrated with global markets, even though domestic financial intermediaries are assumed to be highly regulated with regard to capital as well as liquidity.
Thus it becomes necessary to examine the profit efficiency of banks. However, despite wide agreement on the importance of analysing the profit efficiency of banks, most studies on efficiency have focused on cost efficiency or technical efficiency and pay little academic attention to issues related to profit efficiency. This is particularly so in the context of banking systems in developing countries such as India. This article focuses on the profit efficiency of banks for several reasons. First, the profit efficiency of banks is a broader concept than cost efficiency as it takes into account the effects of the choice of a vector of production, both on costs and revenues. The objective of maximising profits requires that goods and services be produced at minimum cost and also that the maximum volume of revenues to be generated. Second, very often the concept of profit efficiency is considered superior to cost efficiency as an indicator of the quality of bank management. Since it takes into account both the revenues and costs of a bank, a bank manager is likely to have some control over both these factors and any qualitative difference between the findings on profit efficiency and cost efficiency could be attributable to differences in the revenue performance of banks owing to better managerial efficiency. Third, banks very often resort to costly activities (for example, computerisation of banking activities, installing new machines to facilitate transaction services, hiring more efficient personnel) which may exert an adverse impact on cost efficiency but increase profit efficiency after a time gap. In this sense, estimating profit efficiency constitutes a relatively more important source of information for a bank than merely analysing cost efficiency (Berger and Mester, 1997, 2003; Maudos et al., 2002). Fourth, the deregulation of financial services provided by the banking system through the substantial removal of entry barriers, easing of the branch licensing policy, etc., seems to have created a competitive environment in the banking business. It is argued that competitive-friendly deregulations foster competition (Cetorelli, 2004) and that increased competition, in turn, augments profit efficiency of banks by providing incentives to managers to keep costs as low as possible.
The current analysis of profit efficiency of Indian banks takes into account important developments in the banking system. First, banking sector reforms were introduced in the 1990s in phases related to various quantitative and functional restrictions, which were aimed at improving the operational efficiency, competitiveness and profitability of Indian banks. These reform measures have favourably changed the composition of assets and liabilities across bank groups, improved the asset quality of banks and reduced interest spreads, the costs of intermediation and non-performing assets (Mohan, 2005). These have been assumed to exert a positive impact on the profitability of Indian banks, thereby improving efficiency in the banking system. Deregulations introduced in the last 15 years or so also reduced the risks of new challenges and competition ushered in by deregulation. An important consequence of these measures is that a bank can now raise equity in the stock market and thereby absorb a greater degree of risk than before. Banks of different ownership types, however, vary in the extent to which they assume risks. It is of considerable interest to verify how the greater risk exposure in the deregulated environment affects the profit efficiency of banks.
Second, the global financial crisis triggered by the sub-prime crisis in the US during 2008 is, in general, thought to have adversely affected banking systems globally and put bank profitability under pressure. However, it is claimed that the Indian banking industry exhibited the resilience and robustness to withstand the financial shock mainly due to the fact that: (a) Indian banks are properly capitalised and well regulated with the introduction of prudential measures for capital and liquidity; and (b) banks are subject to strict asset-liability management (ALM) guidelines prescribed by the Reserve Bank of India (RBI). So, the economic crisis reemphasises the importance of bank regulations to hedge against risks associated with imbalances in banks’ balance sheets. Excessive regulations, however, might also have adverse effects, by increasing the cost of intermediation and reducing profitability.
Third, the wave of bank mergers and acquisitions (M&A) post-liberalisation, following the recommendations of the Narsimham Committee (GOI, 1991, 1998) is assumed to have improved the profit efficiency of banks through greater consolidation and an increase in economies of scale and scope. However, the evidence on most aspects of bank performance after bank mergers is mixed. In the US banking industry, Akhavein et al. (1997) found that, after mergers, banks experience higher levels of profit efficiency, which is similar to the findings by Gourlay et al. (2006) for Indian banks for the period 1991–92 to 2004–10. However, Bagchi et al. (2005) raised doubts regarding the efficacy of M&A activities in banks, arguing that M&As of banks aim at improving the balance sheet of weak banks, which could become potential acquisition targets. They also point out that bank consolidation through M&As would improve bank profitability but at the cost of access to bank credit by small borrowers and in economically backward regions.
Against this background, we evaluate the profit efficiency levels of banks and analyse the behaviour of profit efficiency over time across different ownership groups post-liberalisation in India. The rest of the article is organised as follows. Section 2 provides a brief review of the relevant literature. Section 3 discusses the methodological framework of the stochastic frontier approach (SFA) used for measuring profit efficiency. The details of the sources of data used and specification of bank inputs and outputs are reported in Section 4. Section 5 discusses the empirical findings and Section 6 concludes.
2. SURVEY OF LITERATURE
Berger and Humphrey (1997) note that studies on profit efficiency of banks across countries are few and the main ones are Maudos and Pastor (2003), Casu and Girardone (2004) and Pastor and Serrano (2005). Empirical evidence on the profit efficiency of banks across countries, particularly with respect to deregulation in banking and type of ownership is, however, mixed. While deregulation results in a substantial increase in profit efficiency in the case of US banks (Berger and Mester, 2003), in other countries such as Spain, it has not led to an improvement in efficiency (Kumbhakar et al., 2001). Ownership effects on profit efficiency of banks indicate that in countries such as Pakistan and China, foreign banks are more profit-efficient than state-owned banks and domestic private banks (Berger et al., 2007; Bonaccorsi and Hardy, 2005). However, profit efficiency estimates of banks in the European transition economies find that foreign banks are less profit-efficient than both domestic private and state-owned banks (Yildirim and Philippatos, 2007).
Studies on efficiency of Indian banks have evolved since the 1990s. However, most of the existing studies focus on the productivity and cost efficiency, using different parametric and non-parametric methodologies and pay little attention to estimation of profit efficiency. We find several applications of DEA and SFA while estimating technical and cost efficiency of Indian banks (Chatterjee, 2006; Das et al., 2005; Das and Ghosh, 2006; Kumbhakar and Sarkar, 2003a, 2003b, 2005; Rammohan and Ray, 2004). Studies on the profit efficiency of Indian banks are, however, very few (Mahesh and Bhide, 2008; Sensarma, 2005, 2008). Sensarma (2005) estimates cost efficiency as well as profit efficiency of Indian banks during 1986–2003 through SFA and finds that private banks have higher profit efficiency than public sector banks. He also finds that new private banks and foreign banks are least efficient in terms of profit efficiency. Mahesh and Bhide (2008) employ SFA to estimate bank-specific cost, profit and advance efficiencies and find that profit efficiencies show varying trends for different bank groups. Sensarma (2008) estimates profit efficiency and productivity of Indian banks from 1986 to 2005 and analyses the effects of deregulation on efficiency across different ownership group of Indian banks. He finds that profit efficiency and productivity decline in the post-deregulation period. Foreign and new private banks turn out to have the highest levels of profit productivity. Das and Ghosh (2009) examine the impact of financial deregulation on cost and profit efficiency of Indian commercial banks during the post-reform period (1992–2004) using DEA. The results indicate lower levels of profit efficiency, reflecting the importance of inefficiencies on the revenue side of banking activity.
This article contributes to the extant literature on efficiency, in general and the literature on profit efficiency, in particular, in several ways. First, the period of analysis (1995–2011) covers the extended period of reforms as well as other important phenomena in Indian banking such as mergers and acquisitions and the global financial crisis which are likely to impact on profit efficiency. Second, unlike previous studies on profit efficiency, it considers a broad unbalanced panel dataset of 98 banks covering public sector banks, old private banks, new private banks and foreign banks operating in India. Third, unlike very few previous studies, it examines the role of those variables on profit efficiency such as market share, prudential measures such as capital adequacy ratio, loan default, M&A among banks apart from ownership factors and size of banks. One important finding of this article is that bank mergers during the post-liberalisation period significantly increase the profit efficiency of Indian banks (Table 5b).
3. CONCEPTS AND METHODOLOGY
Profit efficiency measures how well a bank is predicted to perform on the profit front, relative to a ‘best-practice’ bank. Specifically, it relates the profits generated with a specific production vector (P) to the maximum possible profit associated with that vector as determined by the frontier (P*). Depending on whether or not we consider the existence of market power in the pricing of outputs, Berger and Mester (1997) distinguish two types of profit frontiers: the standard profit frontier and the alternative profit frontier. The standard profit frontier assumes that the markets for outputs and inputs are perfectly competitive. Given the input and output price vectors (p) and (w), a bank maximises profits by adjusting the amounts of inputs and outputs. In general, the standard profit frontier can be expressed as:
where, u is the level of inefficiency of profits that captures the difference between the efficient levels of profit for given output levels and input prices and the actual profit. V is the random error term incorporating the effect of errors in the measurement of variables and luck that may temporarily give banks high or low profits.
Thus, the standard profit efficiency (SPE) of a bank is defined as the ratio between observed profit (P) and the maximum profit (P*) attainable as determined by the standard profit frontier given the prices of inputs and outputs:
(2) implies that it would be possible to increase the profits of the bank by (1 – SPE)*100 per cent given the input and output prices faced by the firm. However, the exogenous nature of prices in the above concept of profit efficiency assumes the existence of no market power in pricing decisions of the firm.
If, instead of taking prices as given, we assume the possibility of imperfect competition, we would take as given the output vector along with the input prices and not output prices. The alternative profit frontier can be expressed as:
In the alternative profit frontier, the bank maximises profit by adjusting the vector of output prices and the quantity of inputs. Following the alternative profit frontier, we can similarly define profit efficiency as the ratio between observed profit (P) and the maximum profit attainable as determined by the alternative profit frontier (AP*):
Berger and Mester (1997) and Rogers (1998) suggest that the concept of alternative profit efficiency closely resembles the reality whenever the assumption of perfect competition in the setting of prices is restrictive and when there are differences in output quality among individuals of the sample. For these reasons, the alternative profit efficiency concept has been popular for estimating the profit efficiency of a bank and this article is no exception to that. We estimate profit efficiency of Indian banks using SFA (Battese and Coelli, 1995) in which the inefficiency term is drawn from a truncated normal distribution. 1 In SFA, a flexible functional form is specified for the frontier and one part of the composite error term is the inefficiency factor.
Following Battese and Coelli (1995), the alternative profit frontier model, in general, can be expressed as follows:

where yit denotes total profits if uit ≥ xit is a vector of output and input prices, β is a vector of unknown parameters to be estimated.
The Battese and Coelli (1995) model assumes that vit, the random fluctuations are distributed as two-sided normal and denote random errors that are identically and independently distributed (iid) and follows N(0, σ2v). These random errors are independently distributed of uit. uit represents the departure from the efficient frontier and follows a non-negative half-normal distribution (since inefficiency can only have a positive value) and are assumed to take care of technical inefficiency. These are also assumed to be independently distributed as truncations at zero of the normal distribution, N (µit, σ2U) where µit = zit δ. Here, zit is a 1 × p vector of variables which may influence the inefficiency of a bank and δ is a p × 1 vector of parameters to be estimated.
In the case of estimation of profit efficiency, the inefficiency component of the error term, however, is negative, that is, higher bank inefficiency is associated with lower profits compared with the best bank. Specifically, the inefficiency model can be written as:

where uit accounts for technical inefficiency; uit has a systematic component, zitδ, associated with exogenous variables and a random component, wit, which is defined by the truncation of the normal distribution with zero mean and variance σ2, such that the point of truncation is zitδ. wit ~ N (0, σ2w).
Battese and Coelli (1995) show that when equation (6) is assumed, the profit efficiency of an individual bank can be defined as:
In order to derive the profit efficiency of each bank, we estimate the commonly used translog functional form of the alternative profit function defined in(5):
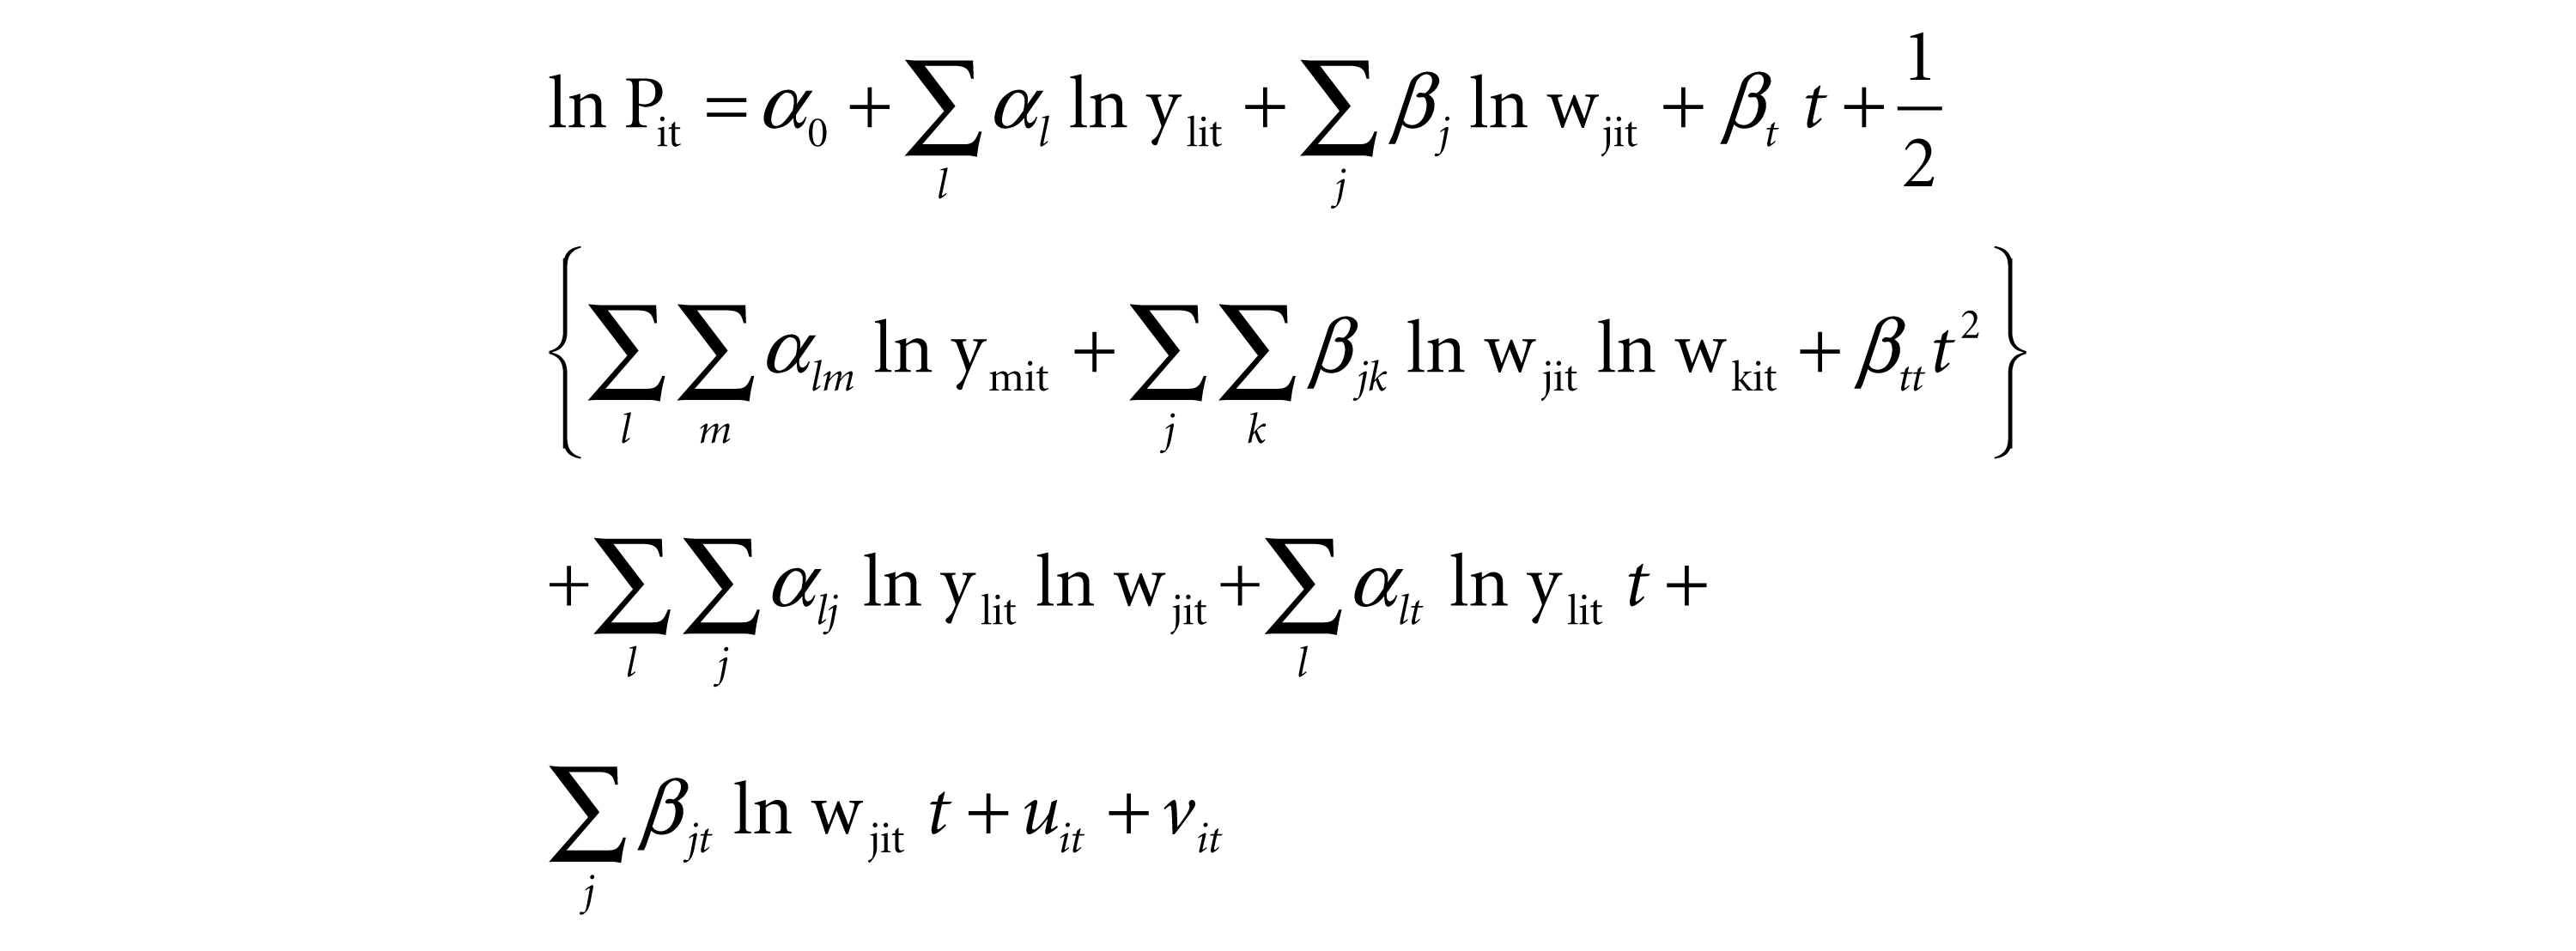
In expression(8), profit (P) is treated as the dependent variable. In the alternative specification of the profit function, banks take as given the quantity of output (y) and the price of inputs (w) and maximise profits by adjusting the price of the output (p) and the quantity of inputs. In order to avoid negative values, we transform the profit variable by adding to all individual values of profit, a constant equal to the maximum loss (minimum value of the net profit) experienced by any bank in the sample plus one where the minimum value indicates the absolute value of the minimum value of net profit over all banks. After this transformation, the bank experiencing the maximum loss will have a value of the transformed variable equal to one (or zero in logarithmic terms). Thus, the constant {Πmin+1} is added to every bank’s profit so that the natural log becomes a positive number, since minimum profits are typically negative. Thus, for the bank with the lowest value of profit, the dependent variable will be ln(1) equals zero.
To ensure that the estimated profit frontier is well-behaved, following Berger and Mester (2003), standard restrictions of linear homogeneity in input prices and symmetry of the second order parameters are imposed while estimating the parameters of equation (8). These restrictions are follows:
Net profit and input prices are normalised by the price of capital before taking logarithms to impose linear input price homogeneity restrictions. After specifying the model as in(8), the technological and inefficiency parameters are estimated by the maximum likelihood estimation (MLE) technique. In(efficiency) estimates of individual banks at different time points are obtained by a method developed by Jondrow et al. (1982).
As has been pointed above, the inefficiency of bank i at time t is defined as exp (–
To ascertain the factors which affect profit inefficiency of banks, we consider the following multivariate regression model:
All the parameters of the stochastic-frontier function in(8) as well as those of the inefficiency model(9) are estimated together in a single MLE procedure following Battese and Coelli (1995) and we use the ‘FRONTIER’ (version 4.1) econometric software developed by Coelli (1996). 2 In(9), INEj,t is the profit inefficiency estimate of the jth bank in period t obtained from the estimation of the stochastic frontier model. The details of each right hand side variable in(9) are explained in the next section. β0 is the intercept term, β1, β1,….β10 are coefficients of the inefficiency model and εj,t is the error term.
4. DATABASE
The current study covers commercial banks operating in India under different ownership groups. Our sample consists of 28 public sector banks, 23 old private banks, 11 new private banks and 36 foreign banks. While these banks belong to different ownership groups, they are fairly homogenous in their functioning and are subject to the same regulatory bindings. Our period of analysis covers 17 years from 1995–96 to 2011–12. However, not all the banks in our sample have all the information in all the years due to mergers with other banks and so on.
Variables Used in Profit Efficiency Estimation
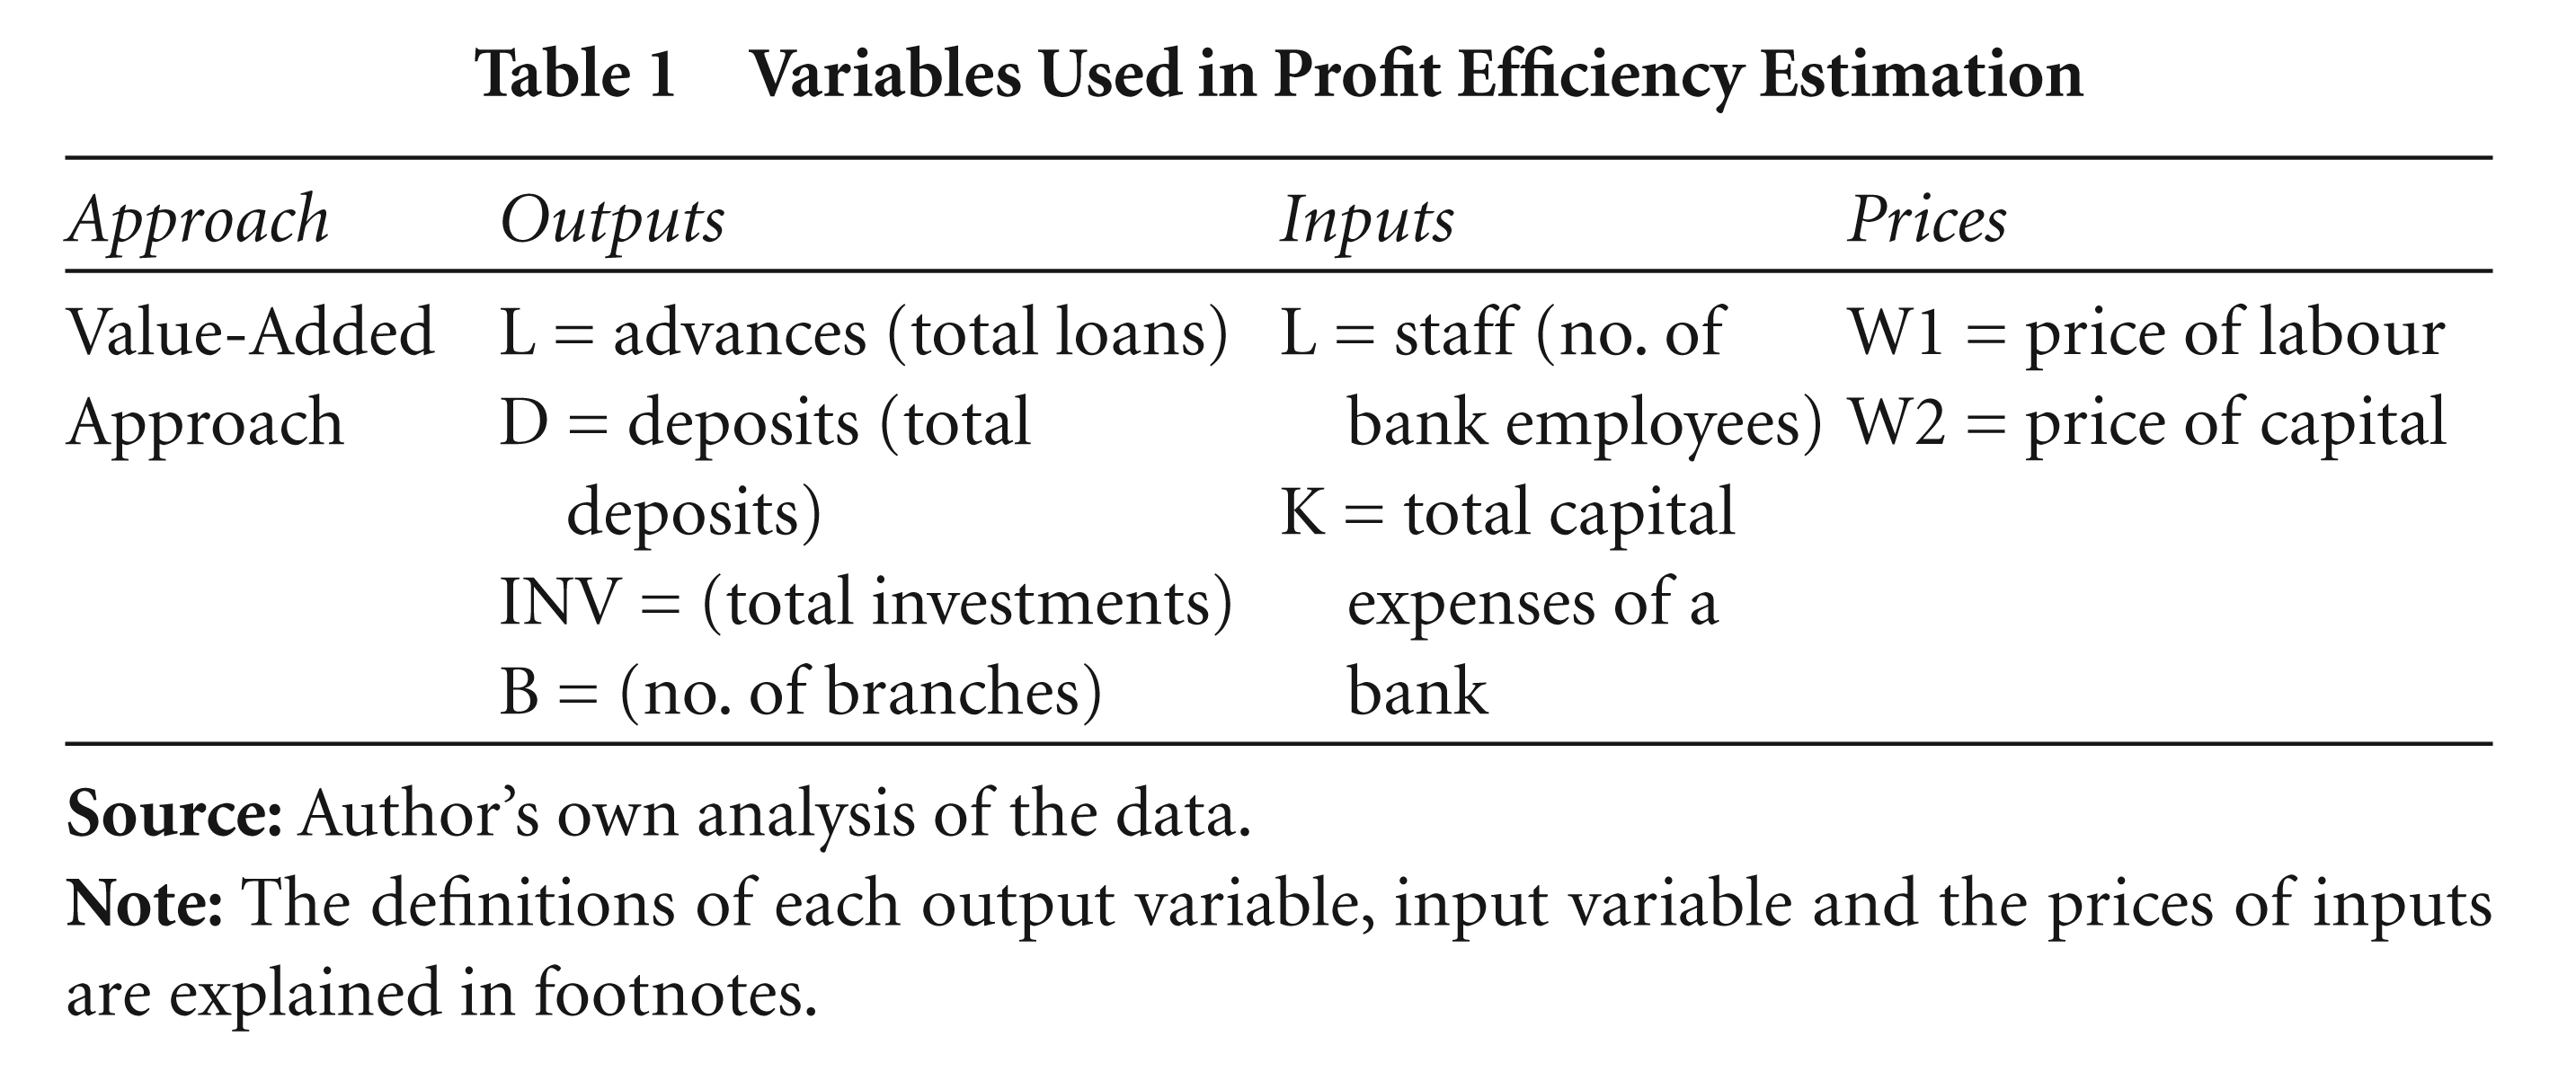
We have an unbalanced panel of 1,389 observations for 98 banks over the sample period of 17 years. As far as the choice of outputs and inputs variables are concerned, we follow the production approach (Berg et al., 1993) where banks are considered to be generating various types of accounts maintained with them such as loan and deposit accounts. 3 The numbers of accounts of various types, according to this approach, are considered as measures of output produced by the use of capital and labour. In our present study, we consider the production approach and so loans and deposits are considered to be measures of output of a bank. 4 Most of the studies on efficiency of Indian banks use the production approach (Kumbhakar and Sarkar, 2003a, 2003b; Sensarma, 2008). This approach seems to be appropriate for Indian banks as deposit mobilisation is a key objective, apart from making loans and advances. Moreover, deposits also serve as a proxy of the quality of services provided by banks. Under this approach, various components of deposits add to a significant proportion of value addition. Details of the output and input variables are presented in Table 1.
In this article, we consider four outputs of a bank (loans, investments, deposits and branches 5 ) and two inputs (labour and capital). As far as the price of factors of production is concerned, the price of labour is calculated as the ratio between personnel expenses and total number of employees. 6 The price of capital is measured as the ratio of capital expenses (operating costs net of personnel expenses) to fixed assets. 7 Variables included in the z vector of the inefficiency equation are the size of a bank, three ownership dummies (public, old private, new private), a measure of the bank’s risk management (for example, its capital adequacy ratio 8 ), a measure of its loan default (that is, NPA, defined as the ratio of net NPAs to net advances) and a measure of its market share. 9 Size is measured by the total assets of a bank. 10
All nominal variables are converted into real terms by deflating by appropriate price indexes. Net profits, loans, investments and deposits, have been deflated by the GDP deflator (base: 2004–05) and the nominal values of staff expenses have been deflated by the consumer price index (CPI) for urban non-manual employees (Source: Labour Bureau and the CSO, Government of India). The size of a bank is measured by its total assets. Bank-wise profit efficiency scores are derived from a profit function in which net profit depend on the prices of variable inputs, the quantities of variable outputs, fixed inputs, a set of environmental factors, the random error and an inefficiency term.
5. EMPIRICS
In this section we present the empirical findings. In subsection 5.1, we present a brief analysis of the descriptive statistics. Subsection 5.2 presents the estimation results of the profit efficiency frontier. Subsection 5.3 presents an analysis of the profit efficiency scores of Indian banks.
5.1 Analysis of Descriptive Statistics
Tables 2, 3 and 4 provide descriptive statistics for a few variables in some years for public sector banks, private banks and foreign banks. We report sample means and standard deviation of the selected variables. The results reveal that public sector banks in our sample traditionally dominate the banking system in India in terms of mean absolute figures for most of the variables. Although average net profits are negative for the public sector banks in our sample in 1995–96, they become positive and gradually increase thereafter. All the output variables in our analysis are higher in average absolute values for public sector banks than for private banks and foreign banks. However, in terms of the rate of growth between 1995–96 and 2011–12, we find that for most output variables, the growth rate has been highest for private banks followed by foreign banks and public sector banks (Tables 2, 3 and 4). The growth of branches of private banks has been highest (347 per cent) followed by foreign banks (74 per cent) and public sector banks (58 per cent). This is clearly an outcome of banking reforms introduced regarding the opening of new branches to allow foreign and private banks greater autonomy and to create a more competitive environment. On the other hand, during the period under investigation, the rate of growth in the number of employees was highest for private banks (448 per cent) and lowest for public sector banks (–13.02 per cent). The net NPAs of banks which are assumed to adversely affect the profitability performance of banks, significantly reduces over the period 1995–96 to 2011–12 for all bank groups.
Summary Statistics of Key Variables: 1995–96 to 2011–12 (Public Sector Banks)
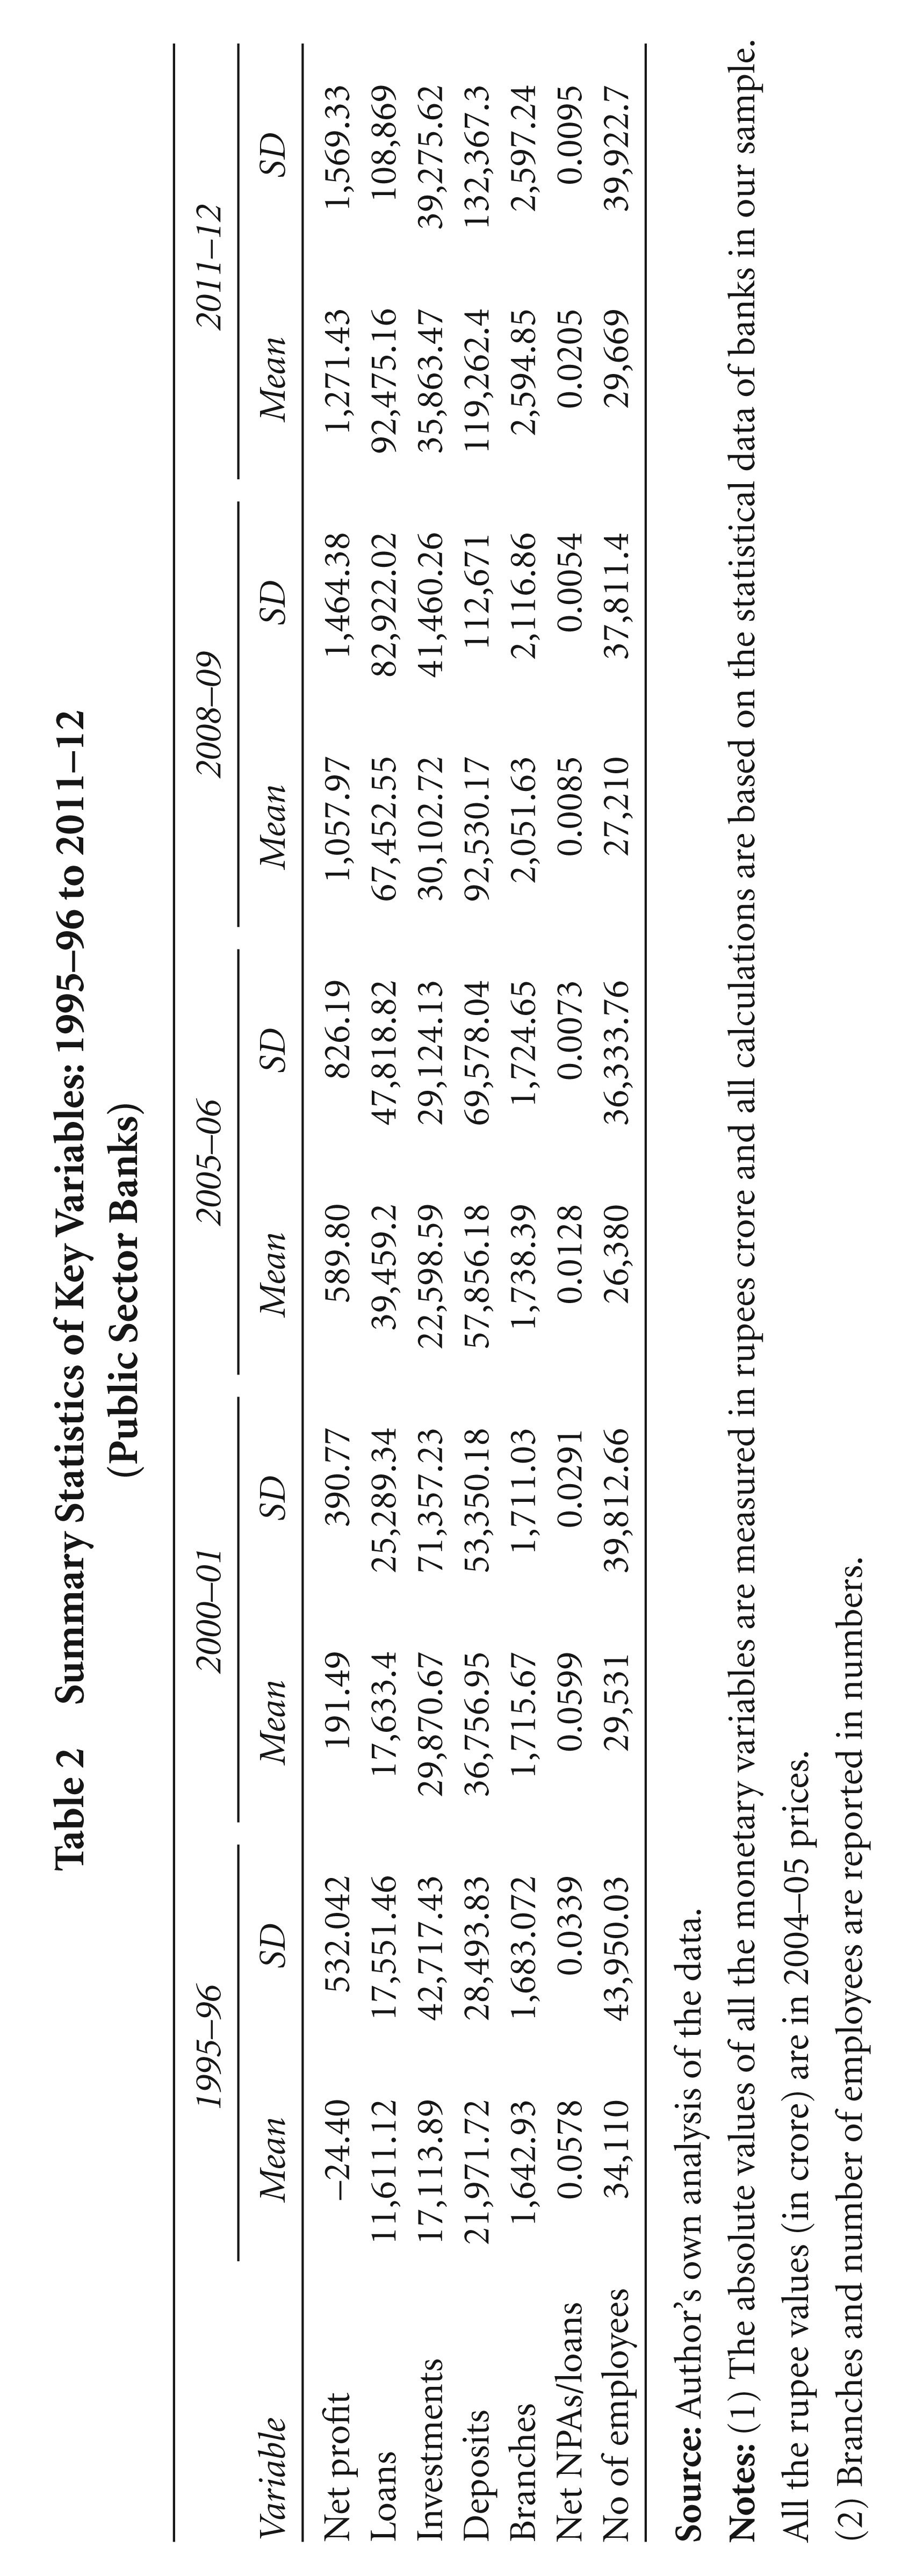
(2) Branches and number of employees are reported in numbers.
Summary Statistics of Key Variables: 1995–96 to 2011–12 (Private Banks)

(2) Branches and number of employees are reported in numbers.
Summary Statistics of Key Variables: 1995–96 to 2011–12 (Foreign Banks)
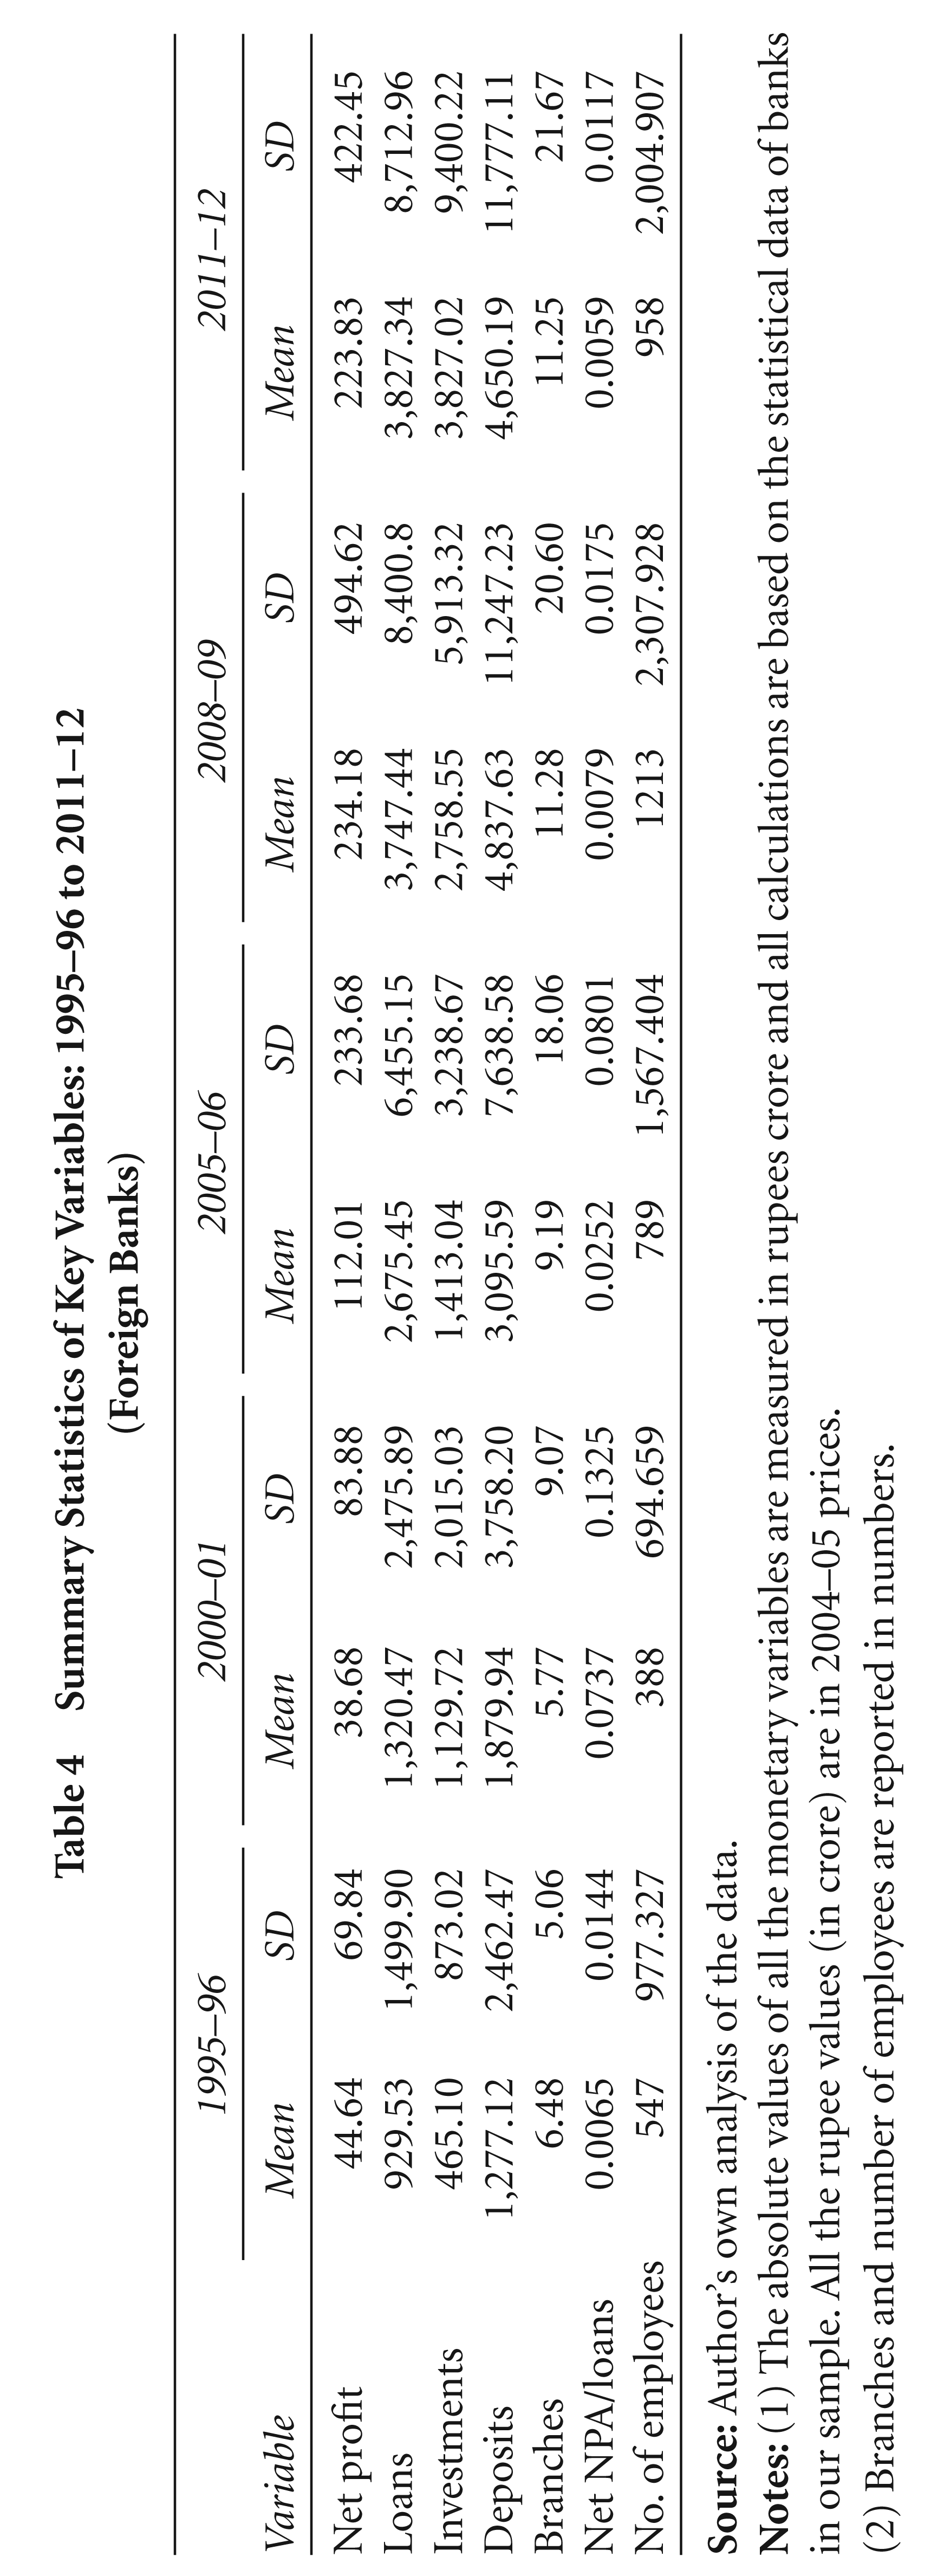
(2) Branches and number of employees are reported in numbers.
5.2 Profit Efficiency Estimates
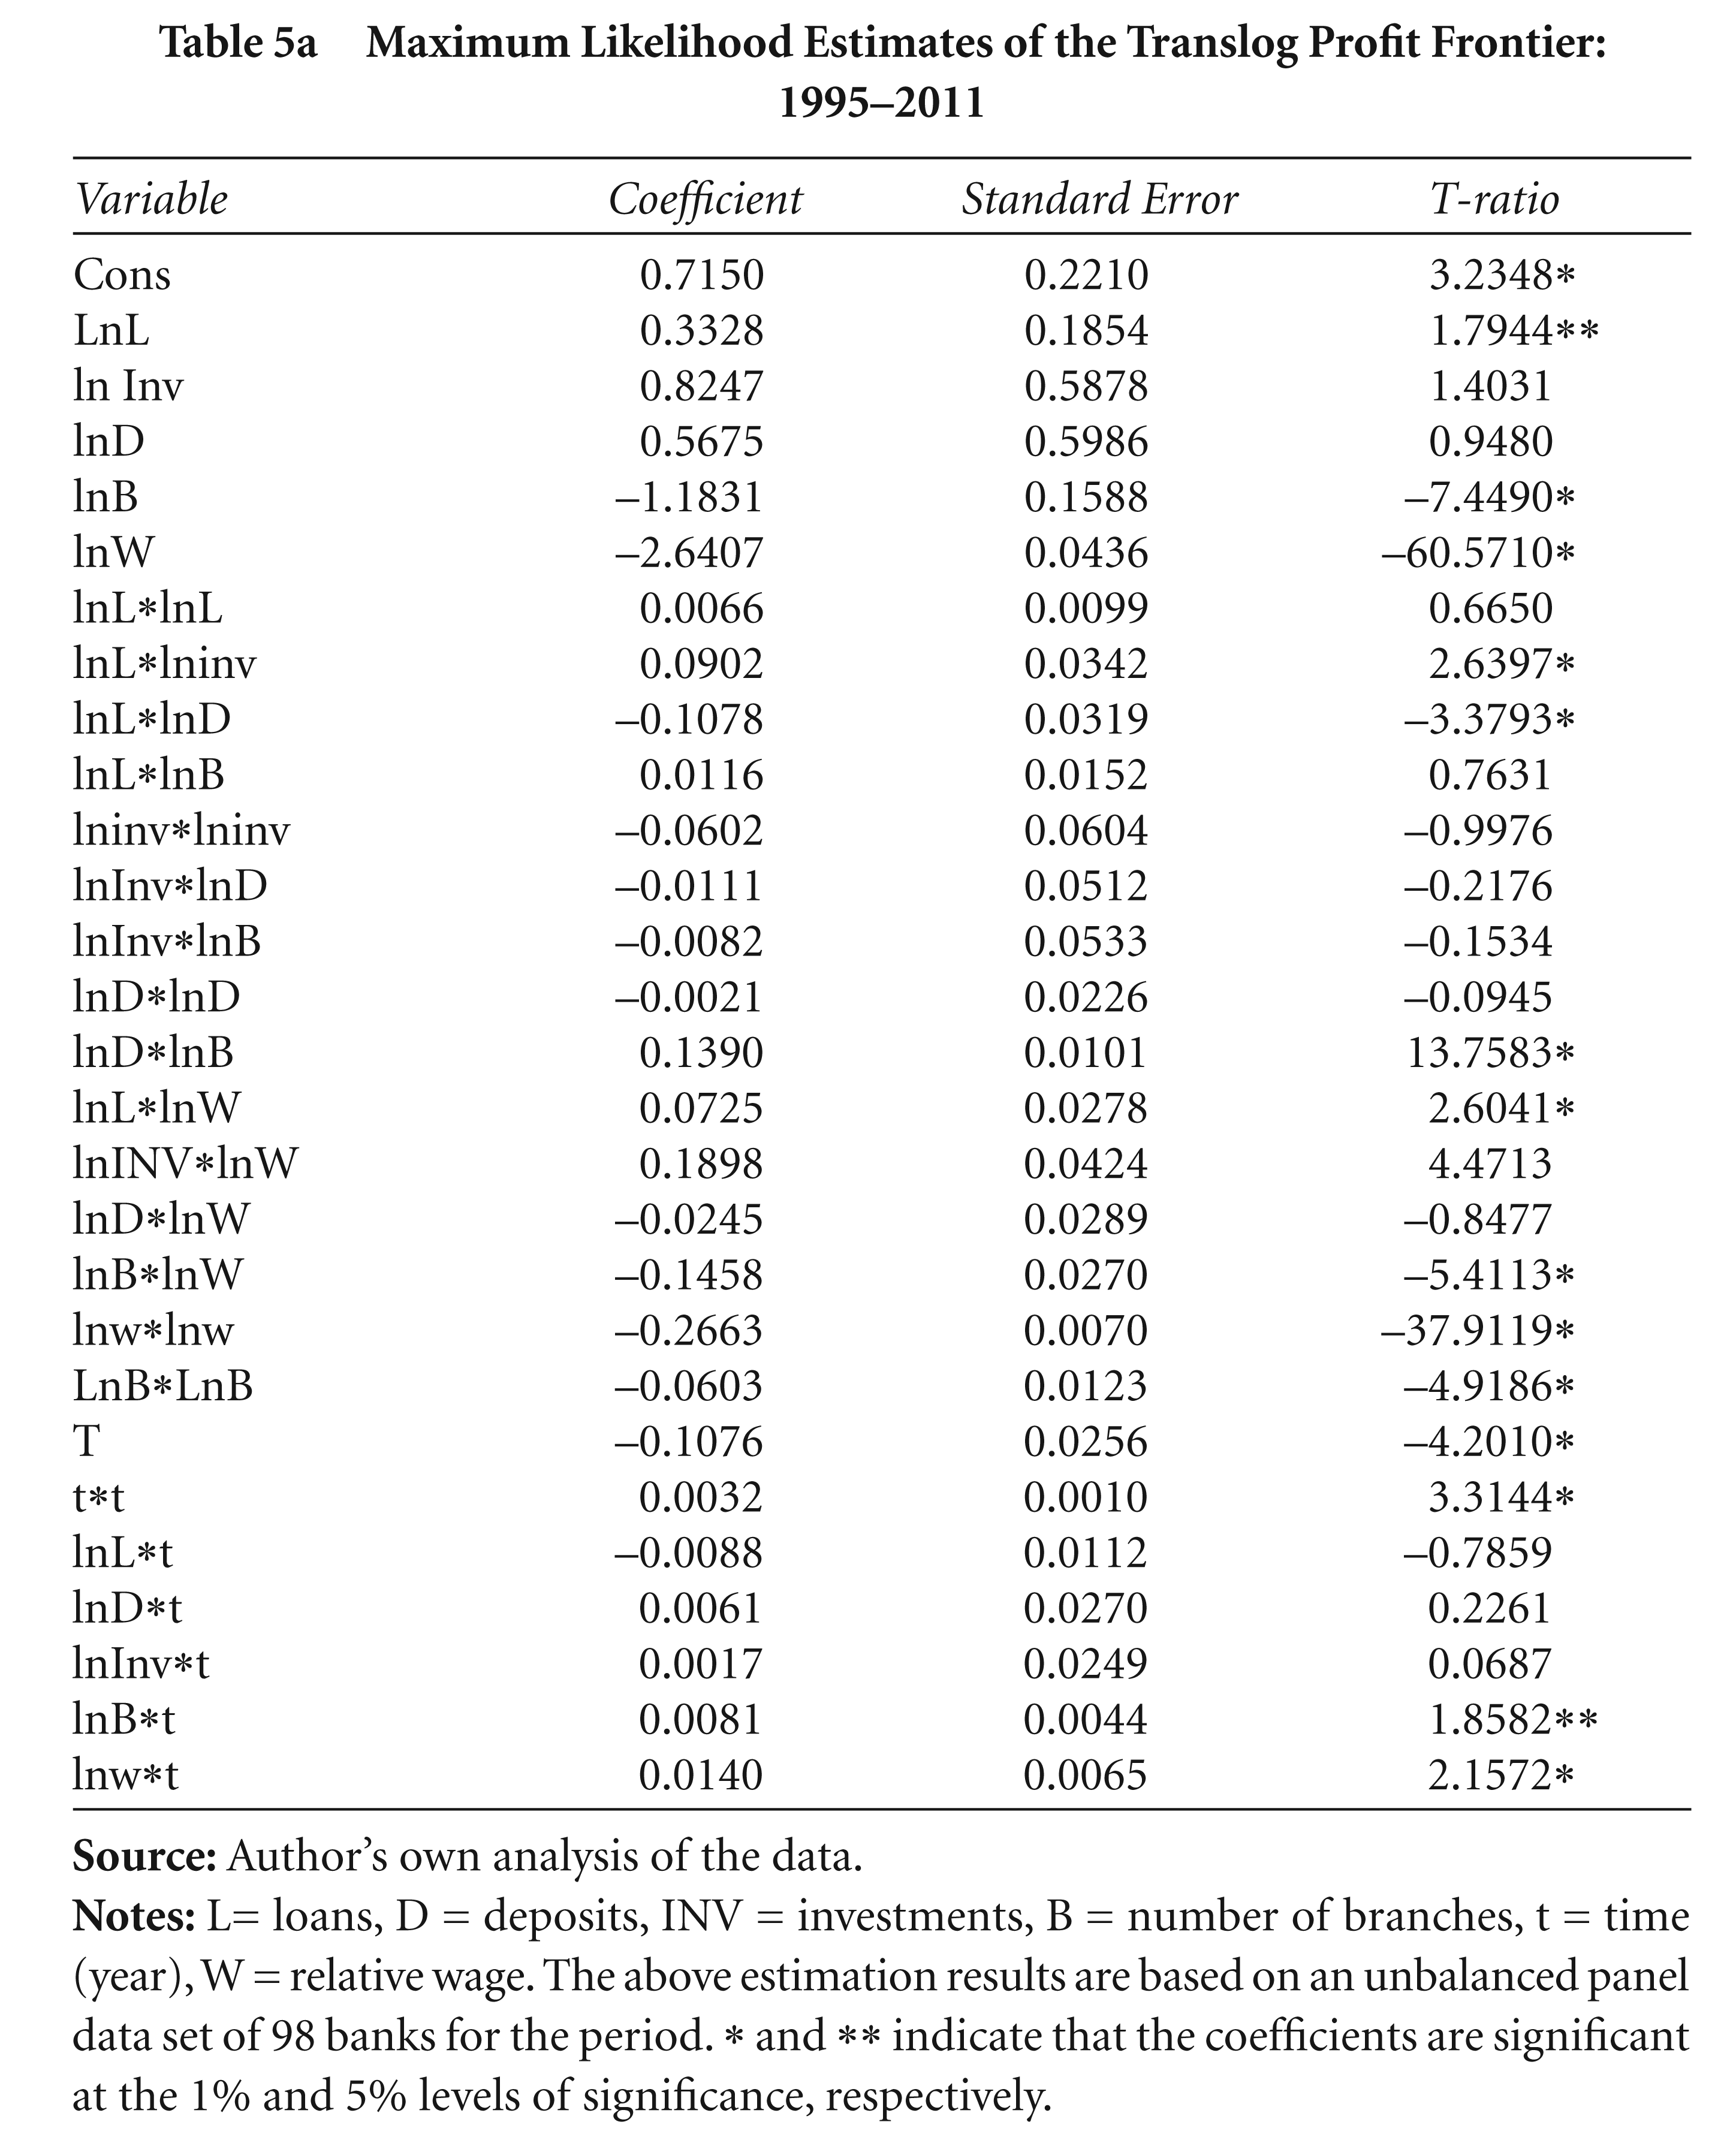
The MLE of parameters of the stochastic profit frontier and of the inefficiency model are reported in Tables 5a and 5b. 11 We first estimate a common benchmark profit frontier by pooling the data set for all banks from 1995–96 to 2011–12 following Battese and Coelli (1995). In Table 5a, we present the estimated coefficients 12 and associated t-ratios of the translog profit function (eq 8) and in Table 5b, we present the estimated coefficients of the correlates of inefficiency and a few parameters that can be used to judge the suitability of the SFA. Calculated inefficiency scores, according to the Battese and Coelli (1995) methodology, vary between zero and infinity. Therefore, profit efficiency scores are measured by the reverse which varies between zero and one. In the case of the profit inefficiency model, SFA assumes that the inefficiency component of the error term is negative, that is, higher bank inefficiency is associated with lower profits.
Maximum Likelihood Estimates of the Translog Profit Frontier: 1995–2011
Estimates of the Inefficiency Model
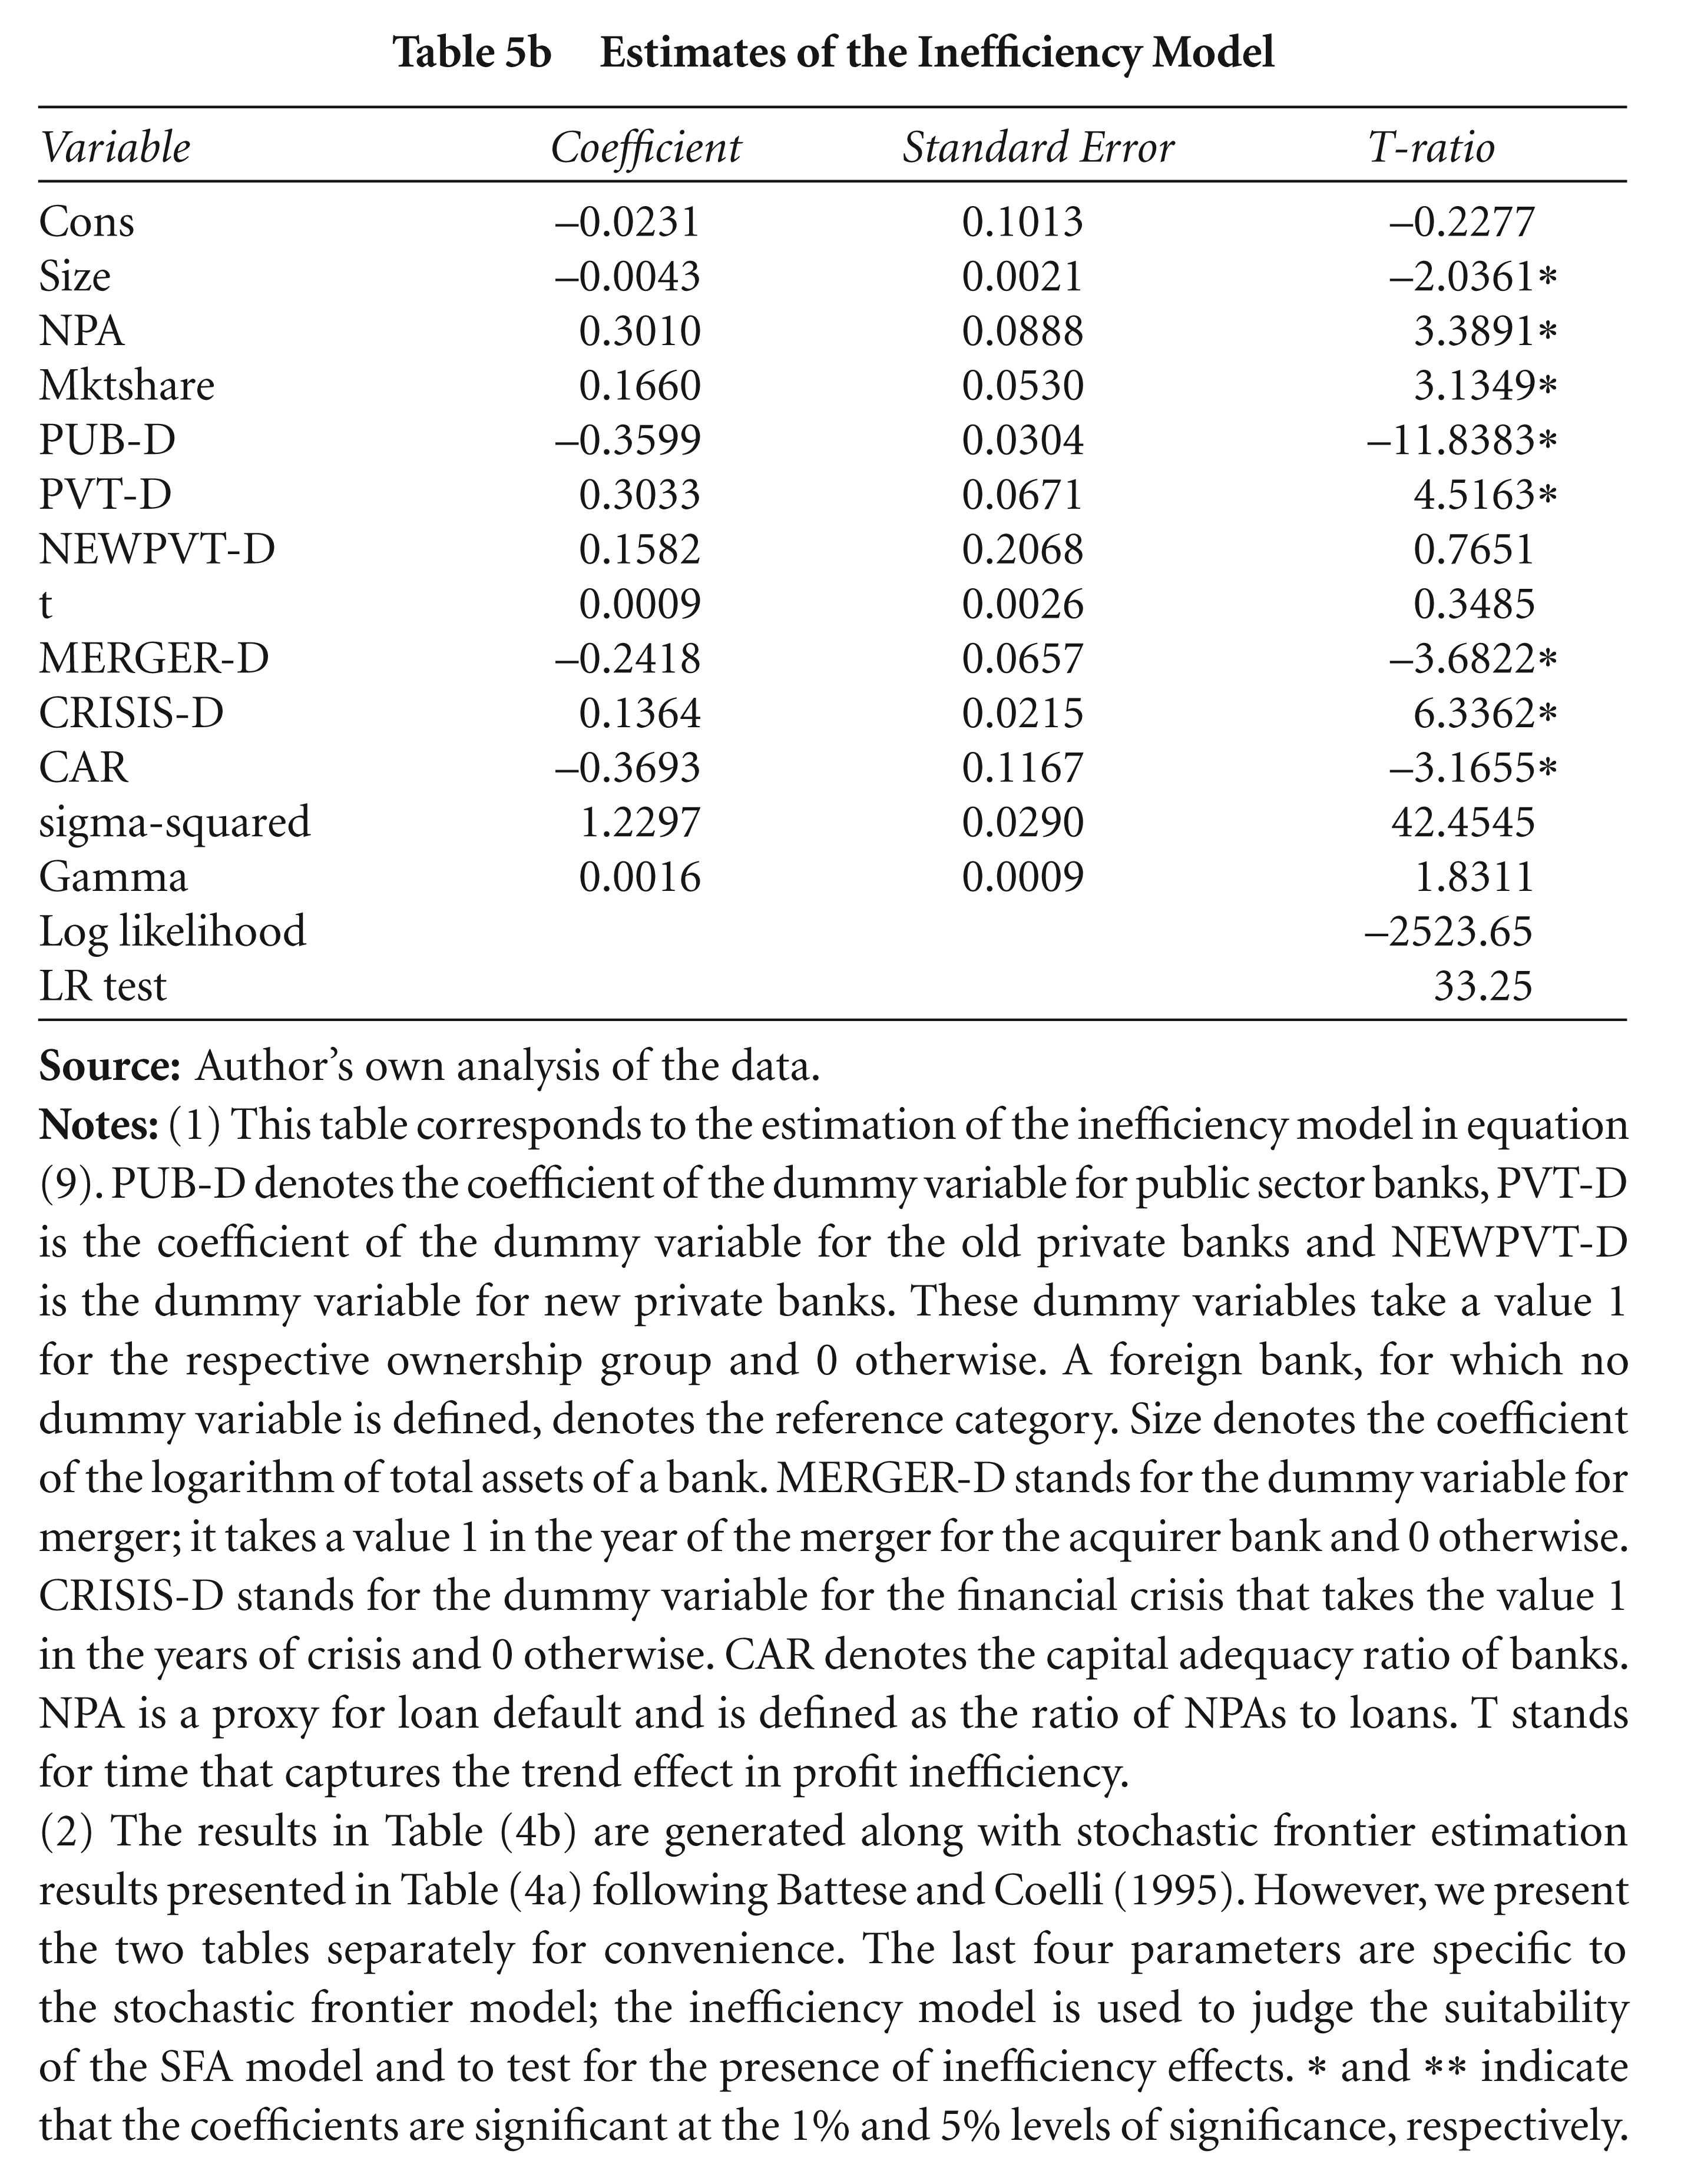
(2) The results in Table (4b) are generated along with stochastic frontier estimation results presented in Table (4a) following Battese and Coelli (1995). However, we present the two tables separately for convenience. The last four parameters are specific to the stochastic frontier model; the inefficiency model is used to judge the suitability of the SFA model and to test for the presence of inefficiency effects. * and ** indicate that the coefficients are significant at the 1% and 5% levels of significance, respectively.
We find that 17 out of 27 variables of the translog profit function are significant and in many cases, we have the desired sign (Table 5a). In order to judge the suitability of the SFA and examine whether the inefficiency effects are at all present while looking at the profit inefficiency model, the usual likelihood-ratio (LR) test is used. The LR statistic confirms whether the stochastic frontier specification is appropriate for analysing profit efficiency. The value of the LR statistic reported in Table 5b has a mixed chi-square distribution (Battese and Coelli, 1995). The value of this test statistic (33.25) in our specified model is much larger than the critical value and thus significant at the 1 per cent level, which leads to the rejection of the null hypothesis and justifies the suitability of using the SFA. We note that in our case, the estimated value of is less than one which reconfirms that the exogenous variables included in the inefficiency function explain a significant part of the unconditional variance of the one-sided error term (Table 5b). 13 By this, we also reject the null hypothesis that bank-specific inefficiencies are absent.
The profit inefficiency of banks in this study is modelled in terms of ownership group dummies, time, size, market share, a measure of loan default, that is, NPAs and a measure of prudential regulation such as the capital adequacy ratio (CAR). The inefficiency model also examines the effects of the global financial crisis and M&A on the profit efficiency of banks by defining appropriate dummies. As far as the parameters of the profit inefficiency model (eq 9) are concerned, we observe that the coefficient of size in the inefficiency function is found to be negative and significant, which implies that as the size of the bank increases, its profit inefficiency decreases. Even though bigger banks maintain a large branch network and mobilise larger amounts of deposits, they can manage their operations more efficiently, enjoy the economies of scale and maintain higher profit efficiency. However, the empirical results on bank size are mixed, since some studies find economies of scale for large banks (Berger and Humphrey, 1997) and others find diseconomies of scale for larger banks (Vennet, 1998). Loan defaults, as measured by the proportion of net NPA to net advances, is found to have a positive and significant coefficient in the inefficiency model, which implies that higher credit risk through greater incidence of loan default adversely affects the profit efficiency of Indian banks (Table 5b). Higher NPAs affect the profitability of commercial banks in two ways: assets that become NPAs yield no return; and banks have to make certain provisions for NPAs from the profit they earn, which further reduce their profit levels.
The coefficient of the dummy variable defined for public sector banks (PUB-D) is negative and significant which implies that as a group, these banks perform efficiently. However, the coefficient of the dummy variable for old private banks (PVT-D) is positive and significant. It does not support the notion that private banks are always profit efficient. The coefficient of the dummy for new private banks (NEWPVT-D) is also positive, but insignificant. Thus, ownership turns out to be a significant factor in determining the profit efficiency of public sector banks.
So, in the post-liberalisation period, even if more private banks are allowed to operate in the Indian banking system, these banks are not always able to compete with existing government banks and generate more profit. A possible reason is that the small size of several private banks, particularly the old ones, acts as a hindrance to the generation of higher profits and operational efficiency. They cannot reap the benefits of scale economies and having to maintain the capital standards as other banks, adversely affects their profit efficiency. The coefficient of time (t) indicates the time behaviour of the profit inefficiency of banks which is positive but insignificant. This suggests that the profit efficiency of Indian banks exhibits a positive declining trend and that deregulations introduced in Indian banking did not, in fact, have a dampening effect on this trend.
In order to control for the effect of M&A on the profit inefficiency of banks, we have introduced a merger dummy (MERGER-D) in the inefficiency model for the acquirer bank in the year of merger. The results indicate that the coefficient of merger-D is negative and significant, implying that mergers significantly increase the profit efficiency of Indian banks. This is very much in line with the theoretical prediction that the merger of two banks is treated as the faster and less costly way of improving profitability rather than spurring internal growth. 14 In general, mergers in Indian banking during the pre-reform period focused mainly on the restructuring of financially weak banks in order to protect the interests of depositors (although a few have taken place with the objective of diversification, growth and expansion). So, the merger wave in Indian banking is expected to exert a positive impact on the profit efficiency of Indian banks.
We have also introduced a market share variable as a proxy for the market power 15 of banks in the inefficiency equation in order to examine whether market power affects profit efficiency. The results indicate that an increase in the market share of Indian banks leads to a significant increase in inefficiency and hence decreases profit efficiency as is evident from the positive and significant coefficient of market share (Mktshare). This result is consistent with the hypothesis that the higher the market power, the lower the effort of managers to maximise profit efficiency. 16 We have also introduced a dummy variable for the global financial crisis (CRISIS-D) to take care of the likely contagion effects on the profit efficiency of Indian banks. The coefficient of CRISIS-D is significant and positive, which implies that the global financial crisis has adversely affected the profit efficiency of Indian banks. Contrary to the claim that the Indian banking sector is highly resilient to shocks due to strict prudential regulatory measures, the financial crisis had had an adverse effect on the profit efficiency of Indian banks.
The CAR as a specific prudential regulatory measure has desired sign and significant coefficient in the inefficiency equation. This suggests that the profit efficiency of Indian banks increases with the introduction of prudential regulation such as the capital adequacy ratio. The significant negative relationship between the CAR and profit inefficiency (Table 5b) implies that Indian banks with more capital, tend to be healthy. With adequate capital, banks are free to make potentially more profitable commercial loans and desirable investments that can enhance their profit efficiency.
5.3 An Analysis of Profit Efficiency Scores
The findings on profit efficiency of foreign banks in this article (Table 6) closely resemble the results of previous studies. Taking all banks together, the average profit efficiency score hovers around 87 per cent in the period 1995–96 to 2011–12. However, Indian public sector banks, on average, turn out to be relatively more profit efficient than the other groups: private banks, new private banks and foreign banks, over the same period. In fact, government-owned banks appear to be the best performers. However, foreign banks in our sample appear to be relatively more profit efficient than private banks and new private banks, as a group. The RBI policy for foreign banks in India has been substantially liberalised in the post-reform era. Since the middle of 1990s, a significant number of foreign banks opened branches; their access to the latest banking technology and improved banking services, enabled them to expand their customer base quite rapidly. Rezvanian and Mehdian (2008) find that the efficiency gains of foreign banks in India have been consistent and that these banks dominate the list of scheduled commercial banks in terms of efficiency. Moreover, access to low-cost funds, diversification of income and adequate ‘other income’ to fully finance operating expenses are factors that promote the profit efficiency of foreign banks vis-à-vis other bank groups in India.
Average Profit Efficiency Estimates by Ownership—Group of Banks Based on Battese and Coelli Model (1995)

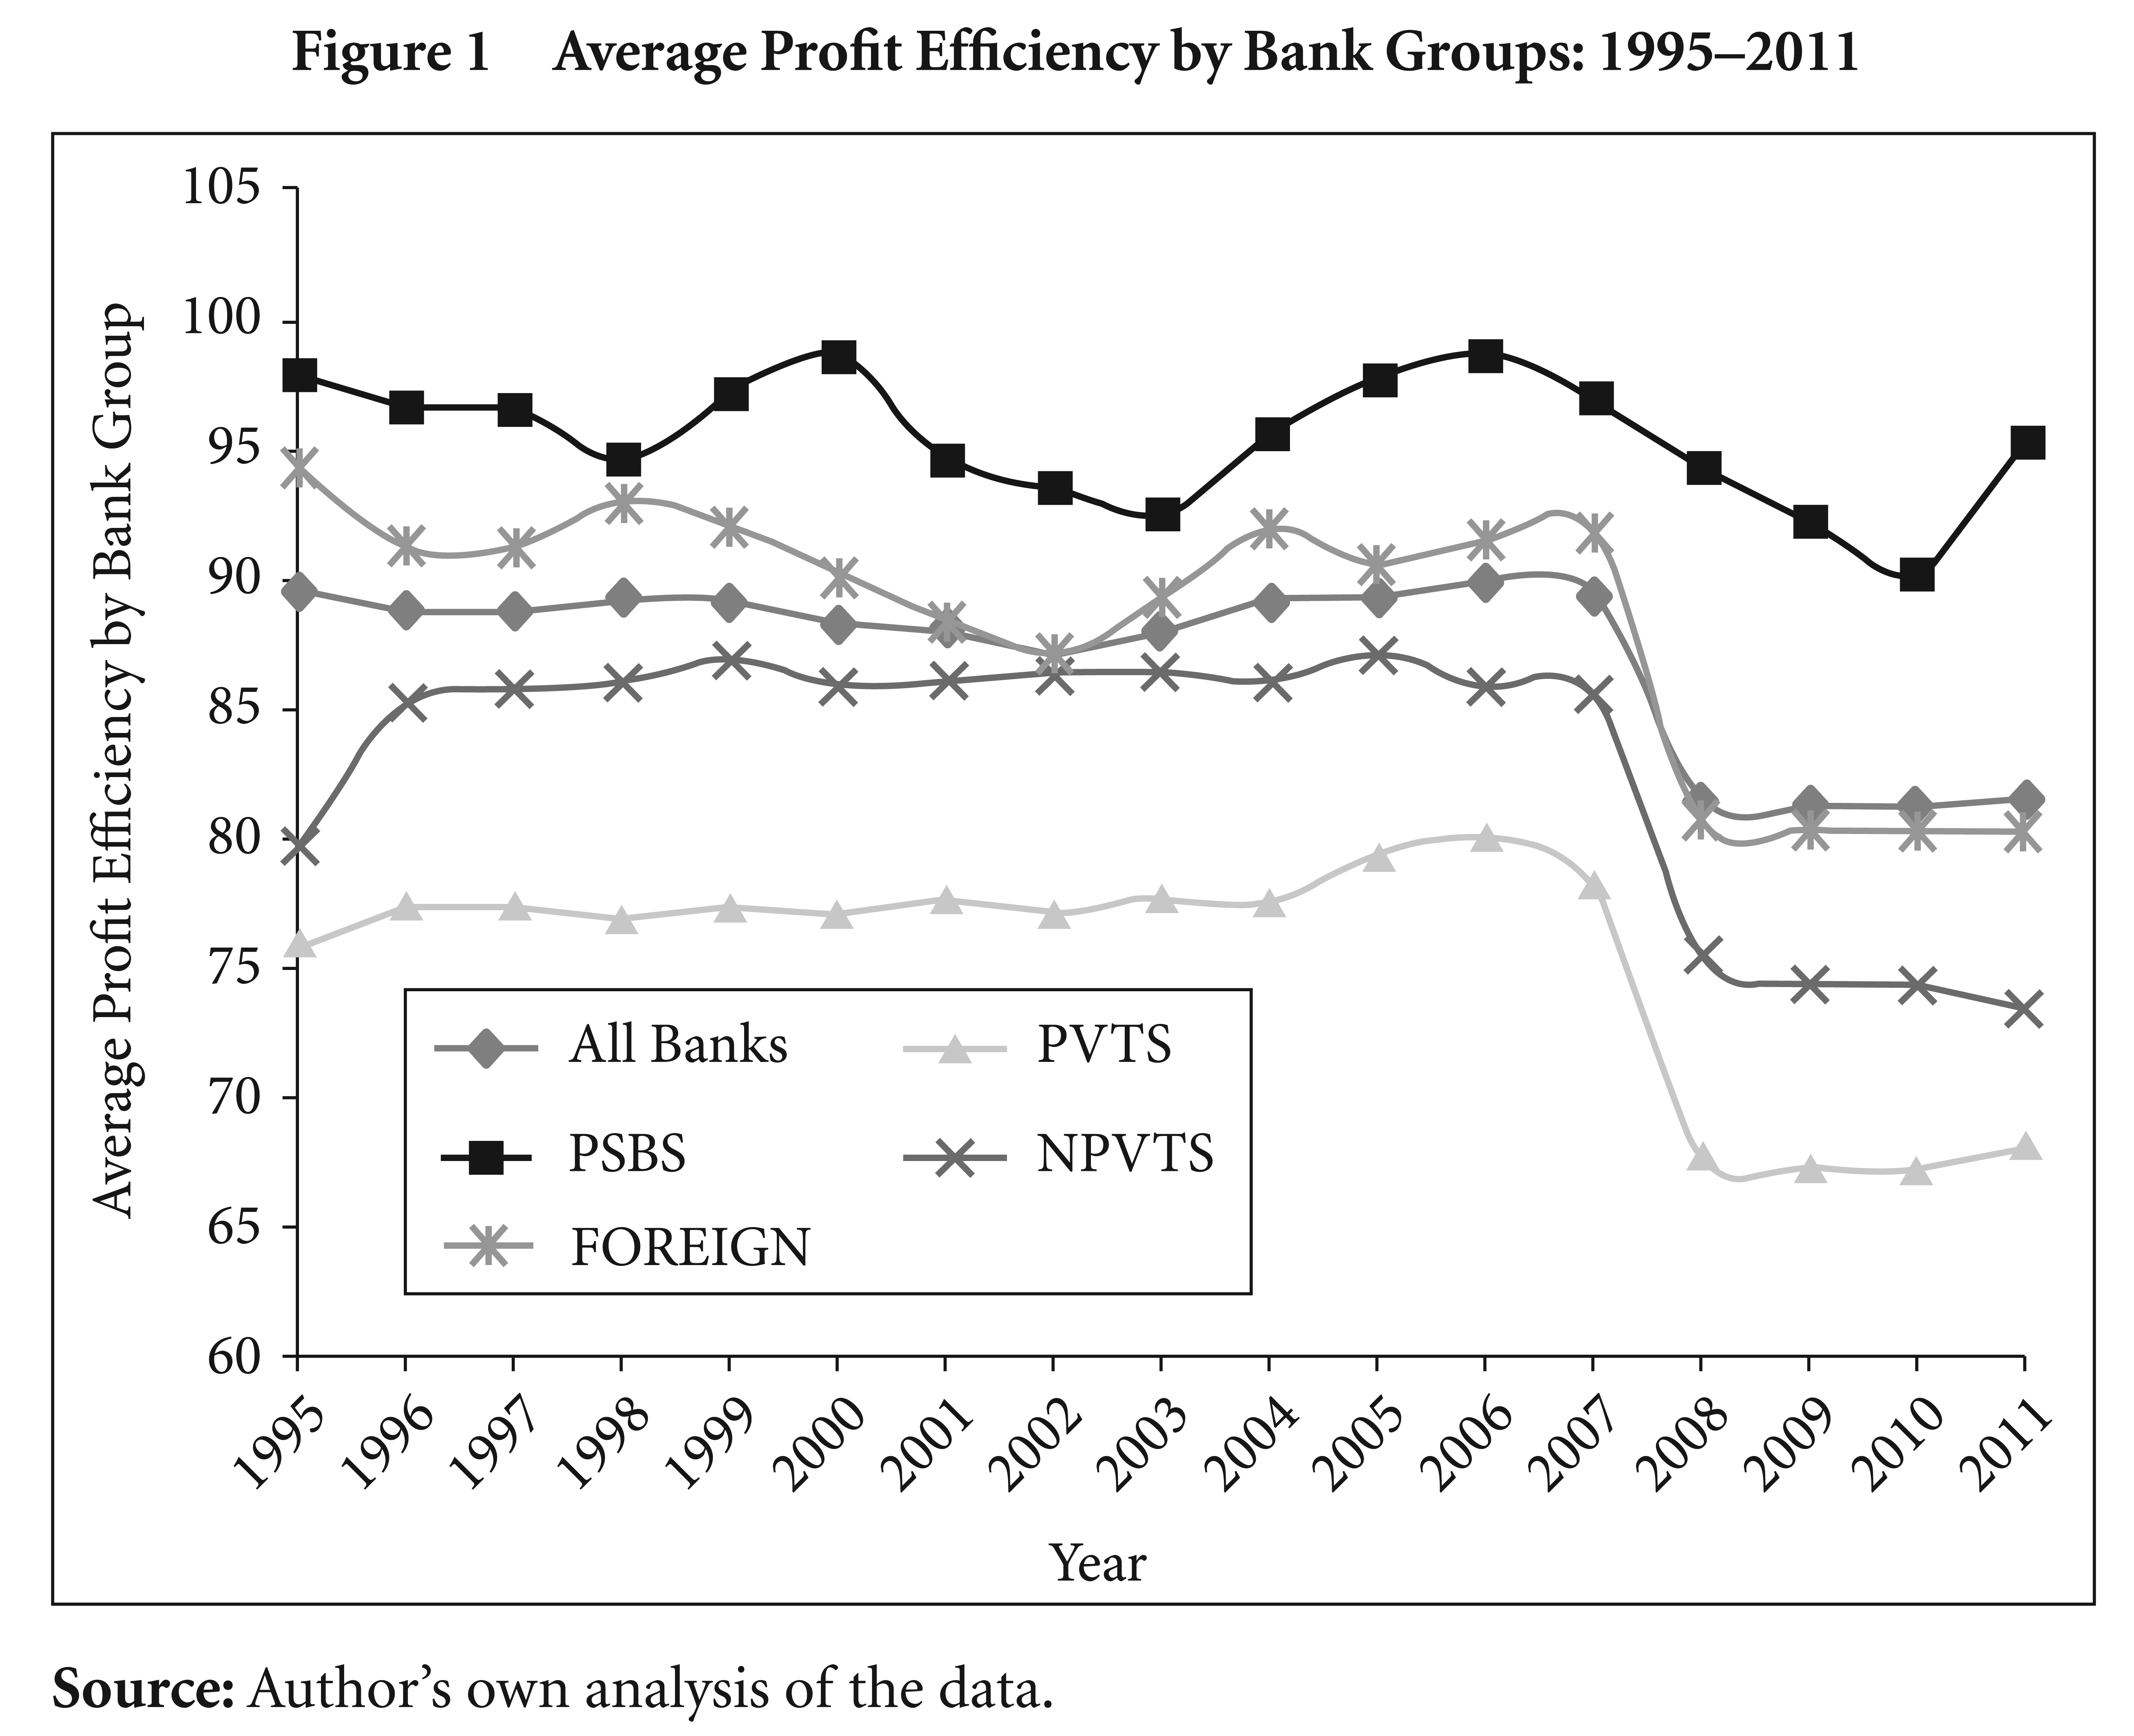
Another important finding is that in terms of year-to-year variations, average profit efficiency for all banks taken together, has sharply declined from 89 per cent to 81 per cent. Looking at individual groups, we find that for private banks, average profit efficiency significantly declines from 76 per cent to 68 per cent, for new private banks from 80 per cent to 73 per cent; and for foreign banks, from 94 per cent to 80 per cent. However, some sort of stability in profit efficiency has been maintained for public sector banks over time (Table 6). Another important finding is that foreign banks over the period under investigation, record on an average, higher profit efficiency (88 per cent) than private banks (75 per cent) and new private banks (83 per cent). The average profit efficiency estimates of different broad ownership groups are plotted in Figure 1.
6. CONCLUSION
The study attempts to measure the profit efficiency of Indian commercial banks in the context of deregulations, the global financial crisis and the wave of mergers and acquisitions experienced by the Indian banking system. We derive bank-specific profit efficiency by estimating a translog profit frontier using stochastic frontier methodology (Battese and Coelli, 1995). In the inefficiency model, we find that ownership is a significant factor affecting profit efficiency of banks. In fact, public sector banks turn out to be relatively more profit efficient. Size of banks is found to be inversely related to inefficiency. The market power of banks does not necessarily lead to an increase in their profit efficiency. We also find that profit efficiency increases with the introduction of prudential regulation such as capital adequacy ratios. Loan defaults adversely affect the profit efficiency of Indian banks. The global financial crisis significantly affected the profit efficiency of Indian banks during the period under investigation. Bank mergers during the post-liberalisation period exerted a positive impact.
As far as the average estimated efficiency scores of different bank groups is concerned, we find that public sector banks are the best performers in terms of profit efficiency. However, the average profit efficiency scores of foreign banks are much higher than private banks. The results reveal that over the years, average profit efficiency declined across all bank groups, probably as an outcome of intense competition among Indian banks. With the introduction of liberalisation measures, more private and foreign banks were allowed to operate in the banking system and were no longer confined to price competition through changes in interest rates but also exposed to service completion. This, in general, had an adverse impact on the profitability performance as well as profit efficiency of Indian banks.
Footnotes
Acknowledgements
I thank the anonymous referee for detailed comments and constructive suggestions on an earlier version of this article. I would also like to thank Subrata Sarkar and Smruti Ranjan Behra for their help on the estimation segment. The usual disclaimer applies.