
Abstract
This article examines the economic impact of trade facilitation between Commonwealth country members, using a global computable general equilibrium framework. We document enormous economic impact, much higher than a complete tariff liberalisation amongst these countries. The economic impact is quite visible in terms of welfare, gross domestic product, employment and trade in several sectors. We abstract from the costs involved in such trade facilitation—accounting for them is beyond the scope of this study.
Introduction
Trade facilitation (TF) refers to all measures towards simplification of procedures and reduction of costs in the course of international trade. TF aims at ensuring the movement and clearance of goods across borders within the shortest time at minimum cost. It involves reduction of trade cost associated with regulations, enforcement, unnecessary administrative burdens on cross-border movement of goods and services for every involved party (Staple, 2002). In broad terms, TF can be regarded as dealing with the efficiency of border procedures in international trade. The potential benefits of TF are afforded through firms obtaining inputs more quickly and at a lower overall price. Consumers can gain from lower prices and reduced delays for the receipt of goods (Australian Government Productivity Commission [AGPA], 2010). As trade costs associated with these regulations are very high, reduction in this cost will play an important role in international trade and economic development.
While there have been no formal trade agreements among the Commonwealth members, it is worthwhile to examine the benefits of such agreements among them. Given that further tariff reductions in many sectors are not realistically feasible, TF is one area which has been widely discussed as a relevant trade policy tool to be considered by developing countries in general. With this background, the objective of this study is to examine the impact of TF in Commonwealth countries on various macro-economic indicators under different scenarios by using computable general equilibrium (CGE) modelling. This study focuses on TF as a policy tool and the impact on GDP, employment, welfare and trade itself.
This article is organised as follows: section 2 briefly reviews the literature; section 3 explains the methodology employed; section 4 discusses the results and section 4 concludes the study.
Trade Facilitation: A Brief Review of the Literature
Various studies have examined the impact of TF on different macroeconomic indicators. Hufbauer and Schott (2013) estimated that due to TF agreements, global exports would increase by US$1,043 billion, total global jobs supported by export expansion could number 20 million and global GDP would increase by US$960 billion. OECD (2014) estimated the potential impact of a TF agreement under two scenarios: (1) WTO members would implement all the options contained in the agreement; and (2) a scenario where WTO members would only implement the mandatory provisions contained in the agreement, leaving aside discretionary provisions. The results show that under the first scenario, there would be a 14.1 per cent reduction of trade costs for low-income countries, 15.1 per cent for lower-middle-income countries and 12.9 per cent for upper-middle-income countries. Under the second scenario, the reduction in trade cost would be 11.7, 12.6 and 12.1 per cent for low-income countries, lower-middle-income countries and upper-middle-income countries, respectively.
Spence and Karingi (2011) estimated the impact of the TF mechanism on export competitiveness in Africa, confirming the hypothesis that TF can bolster productivity levels in Africa and TF indicators are positively associated with total factor productivity in Africa. Wilson, Catherine, Mann and Tsunehiro Otsuki (2003) examined the relationship between TF and trade flows in the Asia-Pacific region. Country-specific data for port efficiency, customs environment, regulatory environment and e-business usage are used to construct indicators for measuring TF. The benefits of specific TF efforts are estimated by quantifying differential improvements in these four areas among members of the Asia-Pacific Economic Cooperation (APEC). The results show that intra-APEC trade could increase by US$254 billion or 21 per cent of intra-APEC trade flows due to improved TF.
Hillberry and Zhang (2015) estimated the impact of various TF indicators on the time necessary to clear customs and the associated cost. The results show that improved TF would reduce the predicted time spent in customs by an average of 1.6 days for imports and 2 days for exports. Using a conservative estimate of the value of time in trade, such comprehensive reforms imply a mean tariff equivalent reduction of 0.9 percentage points on imports and 1.2 percentage points on exports. The study by APEC (2009) examined the option of a Free Trade Area of the Asia-Pacific (FTAAP) and provided a more concrete rationale for APEC member economies discussing a possible FTAAP by addressing the possible advantages and challenges by using gravity and CGE modelling. It found that improved TF through a 5 per cent reduction in trade cost would lead to an increase in welfare by US$256 billion to US$505 billion.
Cheewatrakoolpong and Ariyasajjakorn (2012) examined the impact of TF improvement in the ASEAN+6 on various macroeconomic variables, trade flows and welfare gains that member countries can obtain from preferential trade agreements in the region by using augmented gravity and Global Trade Analysis Project (GTAP) modelling. Due to the fact that the share of costs related to TF in total trade costs is high, the reduction in such costs plays an important role in the promotion of international trade, improvement in competitiveness, increase in foreign direct investment, increase in the utilisation of preferential trade agreements and promotion of real outputs and economic growth. The results show that a reduction in logistic costs will increase output and trade growth in the ASEAN+6 region benefitting the agriculture sector most among all other factorable sectors.
APEC (2000) found that the elimination of TF costs has a more favourable impact on countries’ GDP than a tariff reduction. By using CGE modelling many studies like Minor and Tsigas (2008) have examined the economic impact of TF. In broad terms, TF can be regarded as dealing with the efficiency of border procedures in international trade. The potential benefits of TF are afforded through firms obtaining inputs more quickly and at a lower overall price. Consumers can gain from lower prices and reduced delays for the receipt of goods. Hufbauer and Schott (2013), AGPA (2010), Mirza (2009), Zaki (2010), Park, Park and Kim, (2010), Stone and Strutt (2008) and Walkenhorst and Yasui (2003) shown that improved TF has significant positive impacts on welfare and other macroeconomic indicators. We found hardly any discussion on the investments needed for TF, apart from a somewhat ad hoc assumption on the initial level of investment needed in this regard, by Mirza (2009). Overall, all the studies have shown a positive impact on various macroeconomic indicators from TF.
Methodology
This study is conducted with a multi-country, multi-sector general equilibrium model. WTO (2012) states that the purpose of the CGE simulations is to determine the effects of an improvement in TF on several variables of the model—GDP, employment, exports, imports and welfare. The simulation represents what the economy would look like if the policy change or shock had occurred. The difference in the values of the endogenous variables in the baseline and simulation represents the effect of the policy change. All the policy simulations as well as results reported in the article, as in other major models of this type, may be thought of as occurring in one-shot over a time-period that is needed for equilibrium to be achieved. This time-period is akin to what is widely thought of by economists as the ‘medium run’, possibly 3–5 years at a stretch. So the model should be able to foretell the effects on trade and production patterns if the trade policy was changed. Furthermore, based on the change in welfare, the policy-maker would be able to judge whether the country benefited from the change in policy or not. Similarly, Gilbert and Tower (2013) mention that the idea behind CGE is to programme a large-scale mathematical system representing the global economy and to combine that theoretical system with a benchmark set of real world data representing the status quo. The equilibrium is then disturbed to generate insights into the direction and magnitude of the economic effects of policy intervention and/or other changes in the economic system.
The impact of regional integration on different regions is estimated using a GTAP static model. The model assumes perfect competition, constant returns to scale and profit and utility-maximising behaviour of firms and household, respectively. Hertel (1997) provides detailed information about the structure and overview of the GTAP model. The data used in this study are version 9 (the most recent version available, currently in beta form, documented in Narayanan, Aguiar, & McDougall, 2015) of the GTAP database. The reference year for this database is 2011.
Aggregation Strategy
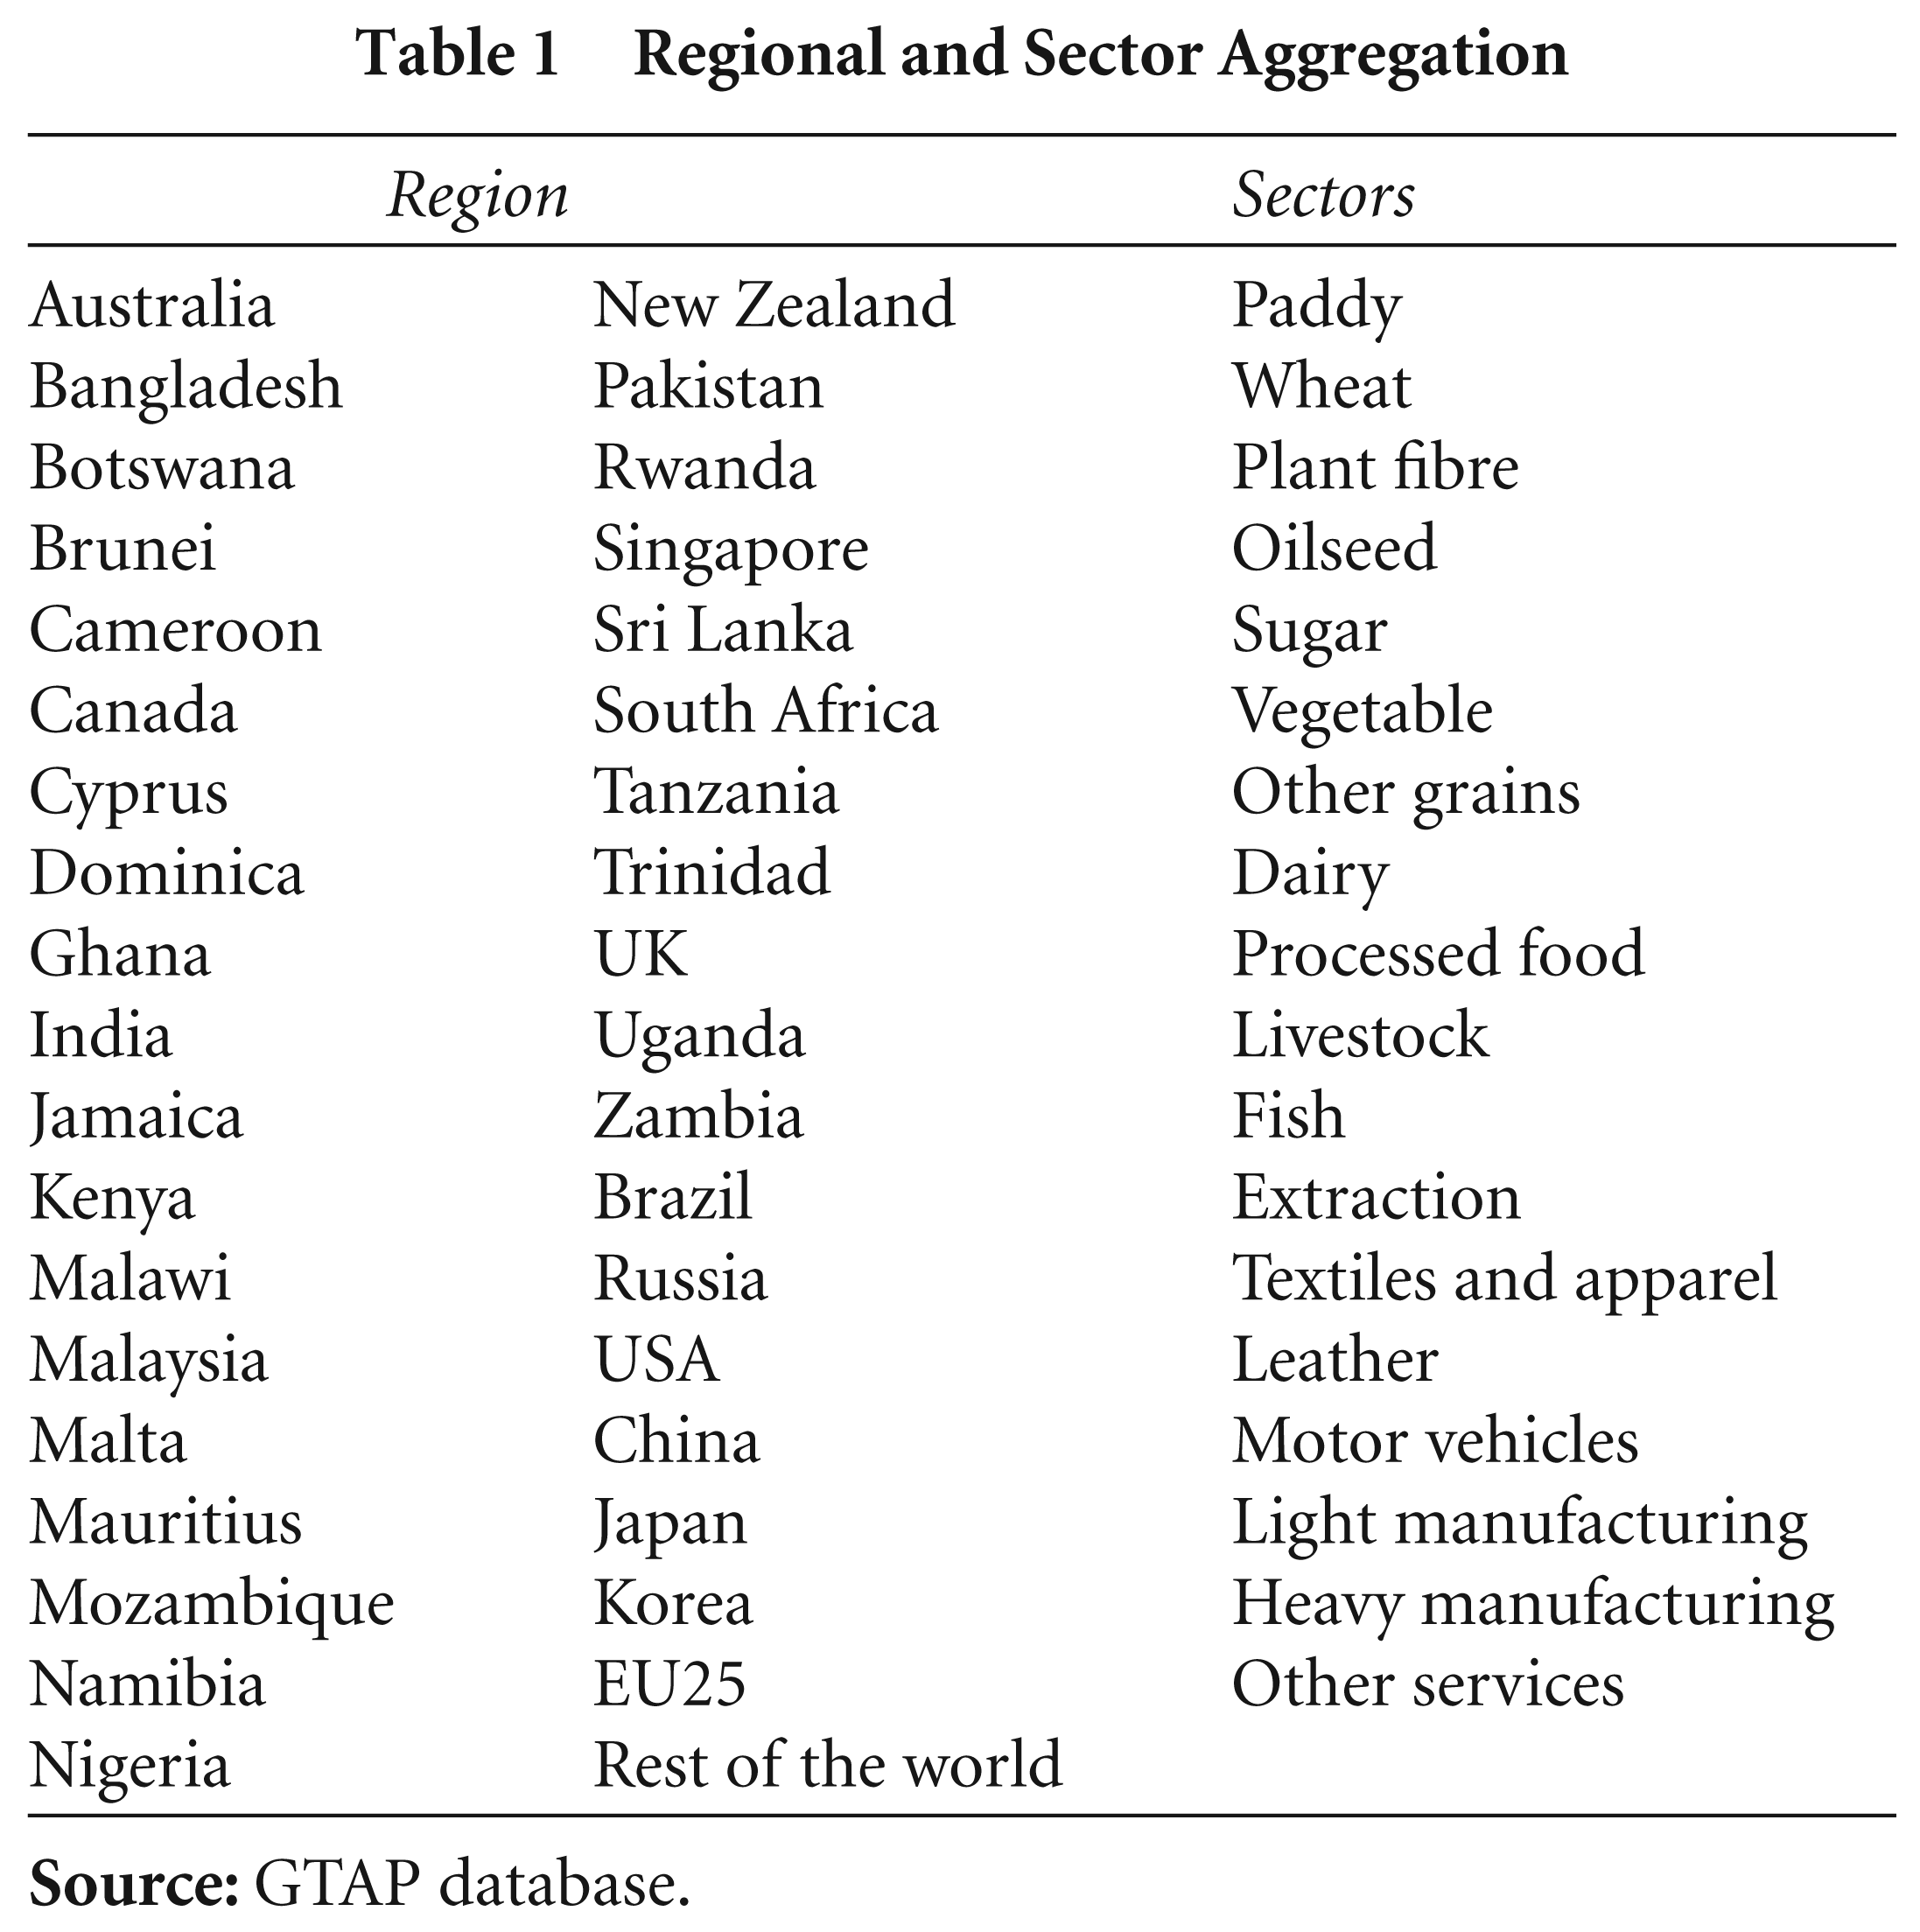
The GTAP database is compiled for 140 countries/regions across the world and for 18 tradable commodities of the world. In this study, the 140 countries/regions given in the GTAP data base are mapped to 38 regions. The analysis is done for 18 sectors given in the GTAP database. The 57 sectors of the GTAP data base are mapped into 18 sectors (Table 1).
Regional and Sector Aggregation
Regional and Sector Aggregation
Given the current unstable economic environment, unemployment is a general phenomenon around the world. Therefore, to make this study more realistic, the standard closure of the GTAP is altered by changing the assumption of full employment for skilled and unskilled labour. This study begins with GTAP 9 data base (Narayanan et al., 2015) with a base year of 2011, aggregated to the set of regions and sectors specified in this article. The ITC MacMAP dataset, which is the source of tariff data used in the GTAP, accounts for all the tariff preferences, FTAs and PTAs that were in effect in the year 2011 across the world.
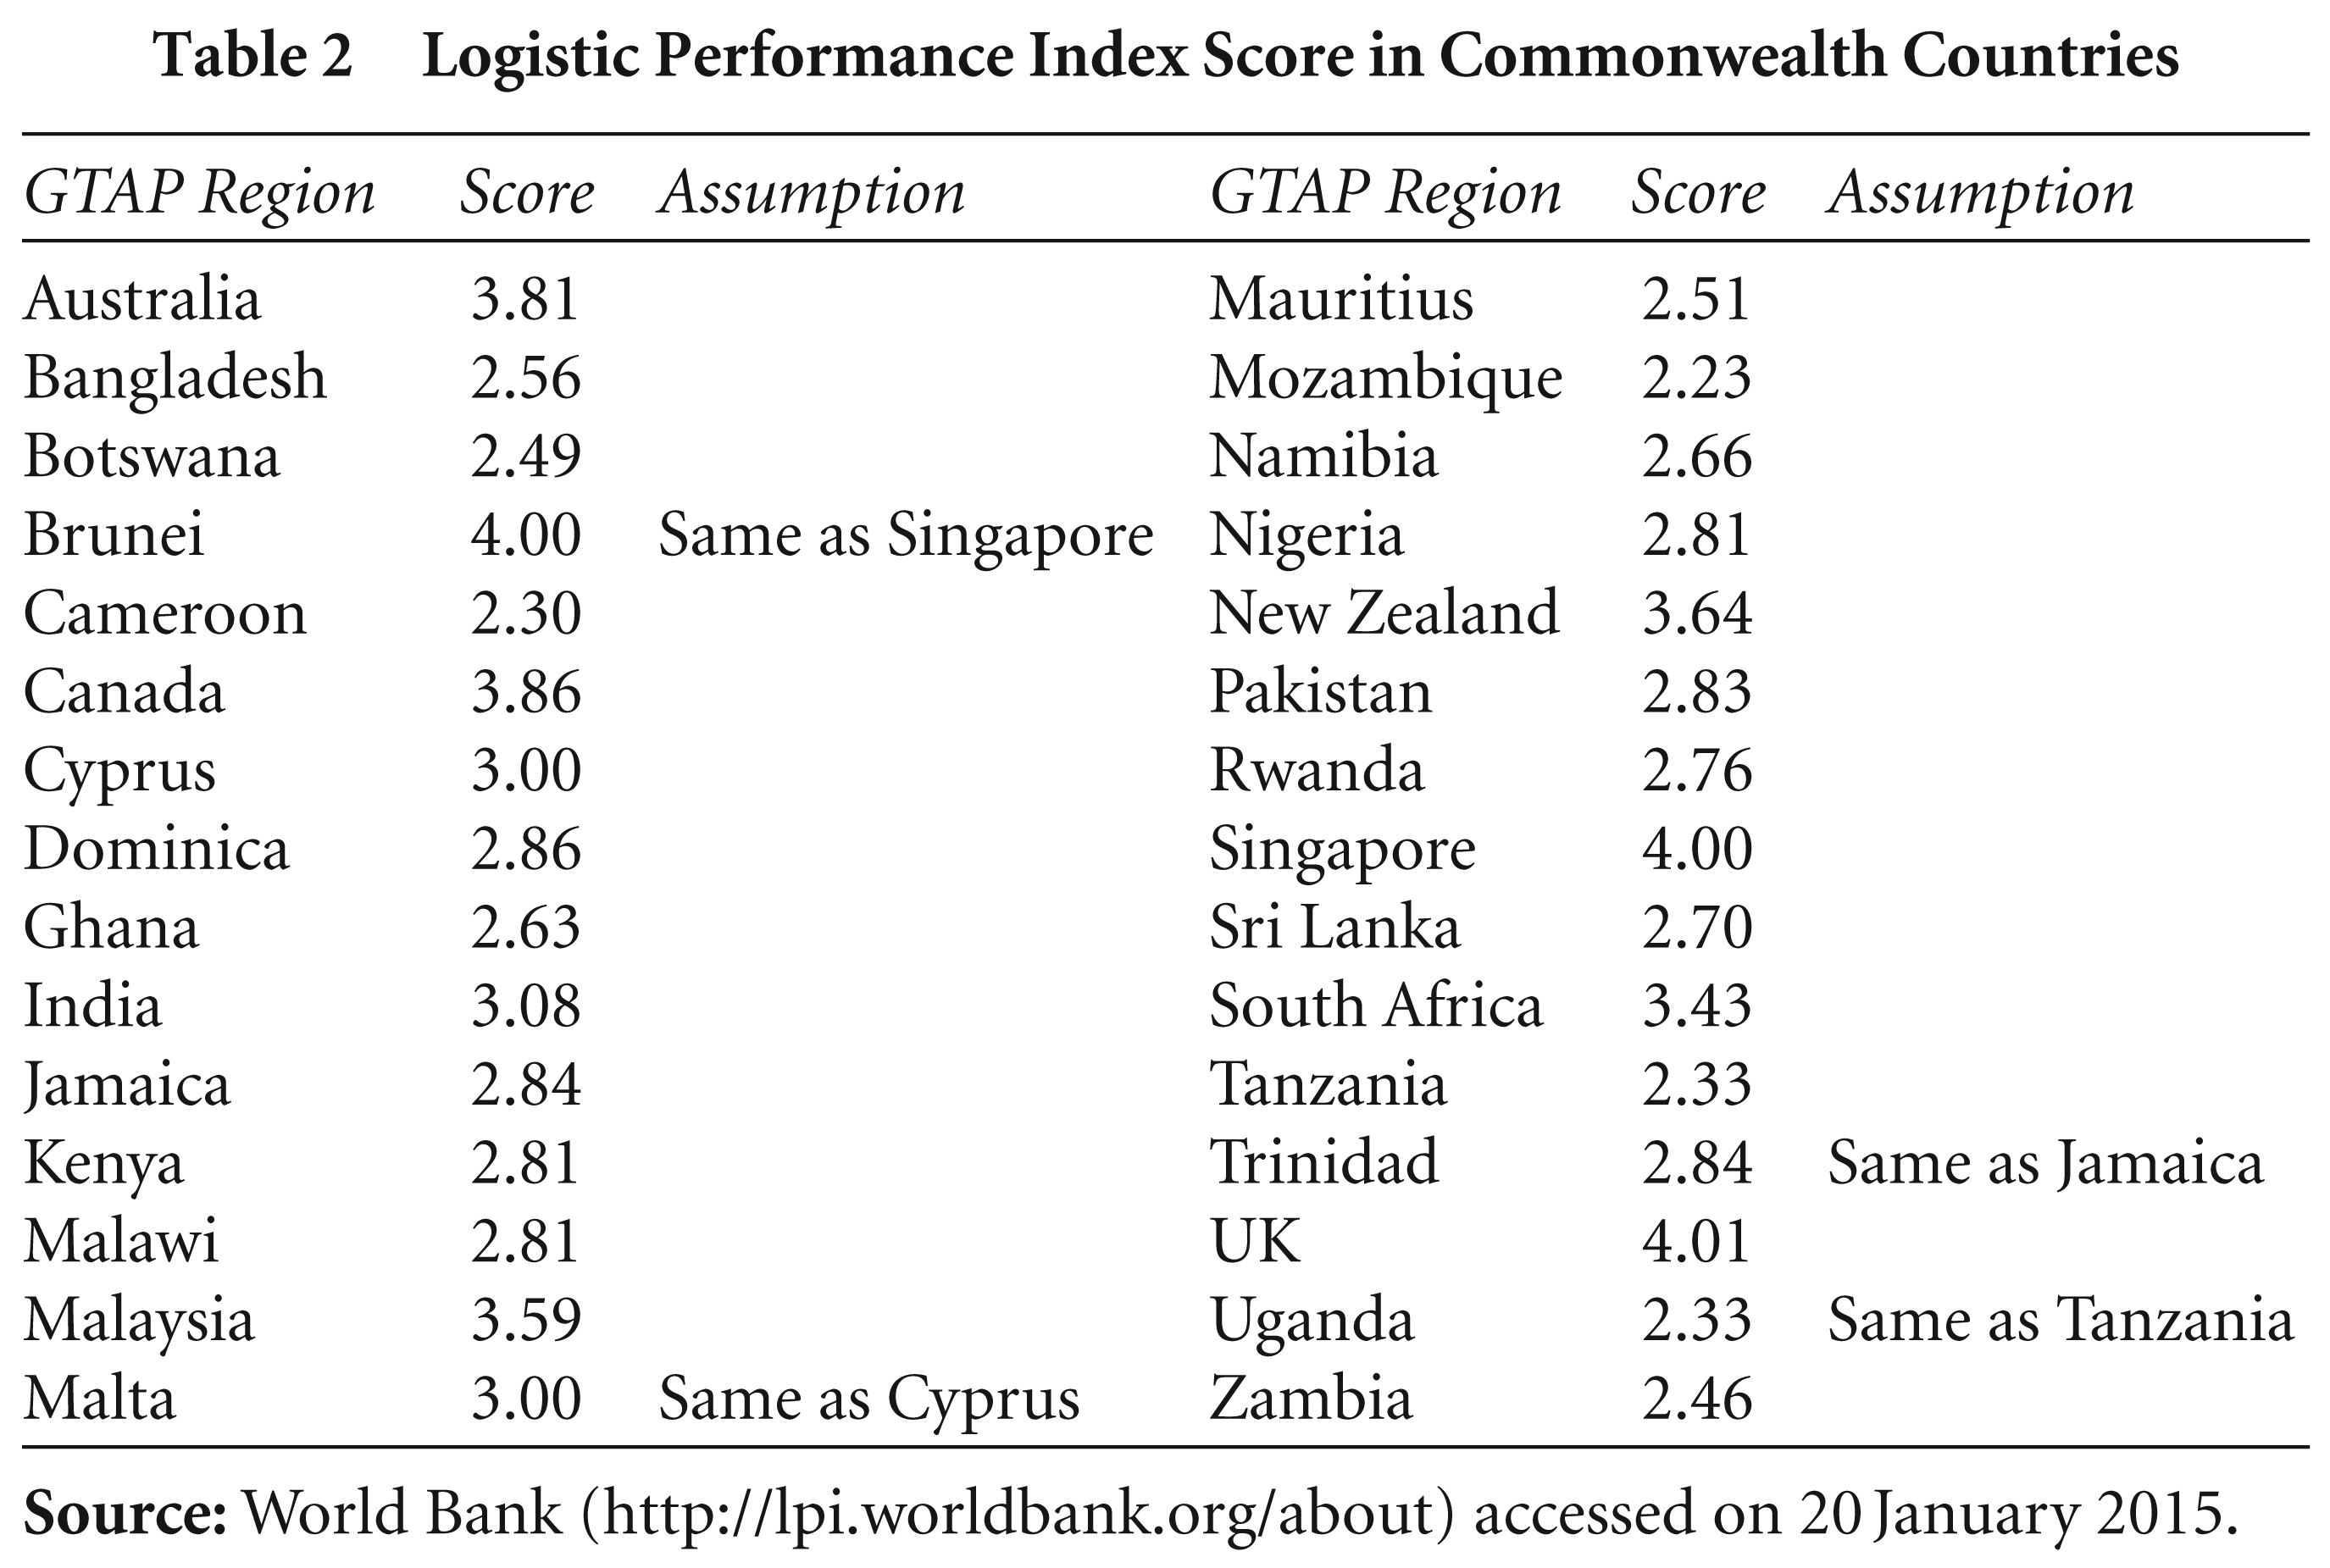
To examine the impact of improved TF on the Commonwealth countries, this study used the Logistics Performance Index (LPI) published by the World Bank for the year 2014. The LPI is created to help countries identify the challenges and opportunities in trade logistics. The LPI includes overall trade logistics performance—both ‘soft’ and ‘hard’ infrastructural issues. While one could argue that the LPI is not the most perfect proxy for TF, which encompasses ‘soft’ infrastructural issues, we assume that the percentage change in the LPI would reflect changes due to the ‘soft infrastructure’ part. This is due to the possibility of a strong correlation between the two types of infrastructure. We have some evidence to support this assumption. The World Bank has not developed recent datasets relating to hard and soft infrastructure, but Portugal-Perez and Wilson (2010) estimate this for the years 2004–07. We estimated the correlation between the LPIs for hard and soft infrastructure and found it to be 0.88. We also found that the LPI was almost the same, even in an absolute sense, for most of the Commonwealth countries, for both hard and soft infrastructure. This means that all measures of the LPI, when evaluated in a relative sense across countries, are going to be similar. The way we arrive at our shock is using this relative difference (with respect to South Africa and Singapore) and hence we strongly believe in the validity of our assumption that our LPI shocks capture the changes to soft infrastructure.
The LPI (2014) provided data for 160 countries, which is extracted on the basis of a worldwide survey of operators on the ground (global freight forwarders and express carriers), providing feedback on the logistics ‘friendliness’ of countries in which they operate and those with which they trade. Feedback from operators is supplemented with quantitative data on the performance of key components of the logistics chain in the country of work. The LPI consists therefore of both qualitative and quantitative measures and helps build profiles of logistics friendliness for these countries (World Bank, 2014). It is to be noted that the LPI for some Commonwealth countries is not available—these are shown in Table 2. Therefore, we used the LPI of other countries as an alternative to measure the performance of a country whose LPI index is not available (Table 2).
Logistic Performance Index Score in Commonwealth Countries
Logistic Performance Index Score in Commonwealth Countries
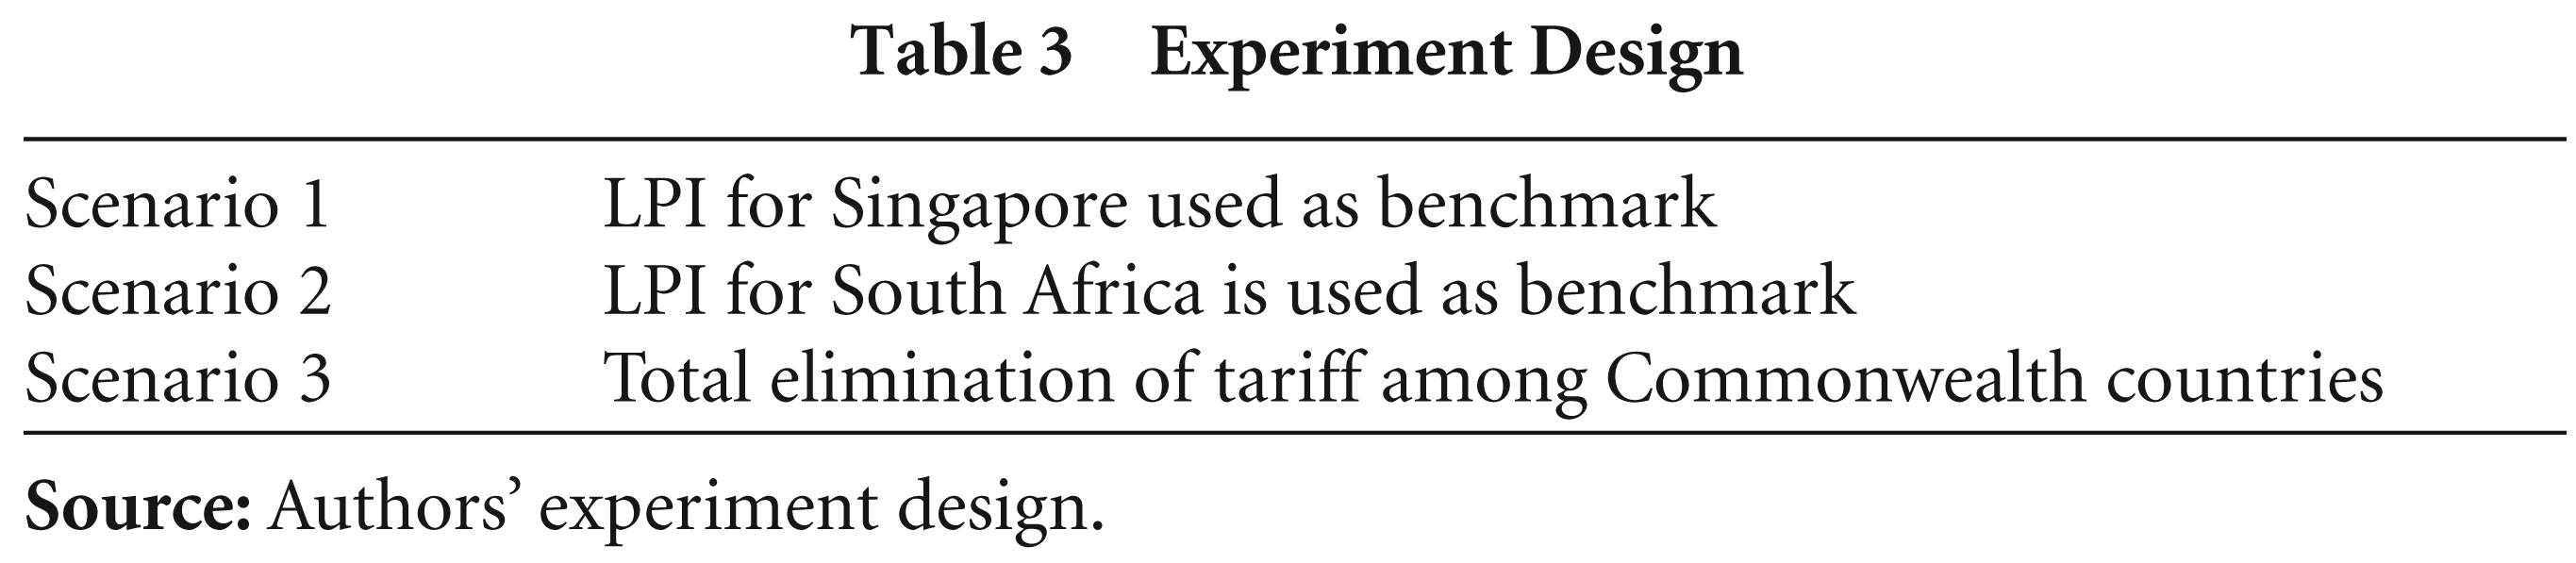
In order to analyse the reduction of trade infrastructure barriers, it will be nice to have a comparative perspective of different scenarios; here are the scenarios we examine in this study:
An improvement in the LPI, as defined by the World Bank as a trade policy intervention, could raise GDP, employment and exports from a Commonwealth country. We examine this in two different ways/degrees of policy reforms. The first target LPI would be for Singapore, which is the highest amongst the Commonwealth countries. The second LPI target is South Africa, which has relatively ‘above-average’ infrastructure. Removing all intra-Commonwealth tariffs in all sectors.
Table 3 summarises the experimental details of the simulations done in this study. The implications of improving TF and a reduction in tariff across various sectors would vary between various regions, as these regions have comparative advantages in different commodities. Similarly the effects of regional integration on welfare and macroeconomic indicators would be varied due to different socio-economic conditions prevailing in these regions.
Experiment Design
For the first two scenarios, we compute the shock as the percentage change required in the LPI for a given country to reach the LPI levels in Singapore and South Africa, respectively. Modelling the LPI in any trade model is not straightforward. We employ the following strategy.
To explain our procedure, it is essential to give a background on how trade is determined in the GTAP model. In particular, percentage changes in bilateral trade flows in the GTAP model are determined by percentage changes in three factors:
The prices of bilateral imports (driven by market prices in the exporting country, export taxes/subsidies, transportation margins and import tariffs); Aggregate imports in the domestic market; and All other factors unobserved in the model, called ‘import-augmented technological change’ (let us call it A), which captures effects other than prices and domestic demand for imports. Increases in this variable would lead to increased demand for imports as well as their reduced ‘effective’ prices, as seen in the equation below, wherein all variables are in percentage changes:
Bilateral imports = Domestic demand for imports + A – Armington-CES * (Bilateral import price – A – Aggregate import prices) Thus, for example, when no other prices and quantities change and ‘A’ increases by 1 per cent, bilateral imports increases by (1 + Armington-CES) per cent. This is the channel in which we implement LPI shocks in this model.
It is important to understand the policy modelling implications of the choice of this variable to represent TF. A positive import-augmented technological change leads to higher effective demand and lower effective prices; thus, its effects are much more pronounced than a commensurate degree of tariff shock. Therefore, even small changes in this can result in big economic changes. Most papers in the literature capture non-tariff barriers through this variable and typically the shocks are quite small. For example, Francois, Narayanan, Norberg, Porto and Walmsley (2012) employed this variable to model the reduction in NTBs by the EU on Colombian and Peruvian exports by a 2 per cent increase in this variable. Thus, we do capture a reasonable extent of real-world features, when we identify the shock needed to move Bangladesh to the level of Singapore to the tune of 60 per cent (based on calculations from Table 2).
An alternative way of modelling TF could be to estimate trade costs associated with soft infrastructure, in ad valorem tariff equivalent form, and then remove them as if they were tariffs—to the extent that they are similar to tariffs in the GTAP database, such a simulation might have resulted in numbers similar to Scenario 3. This approach appears to be more direct and logical, but has several serious problems. Firstly, treating trade costs as tariff equivalents leads to biased welfare results, since they include the ‘imaginary’ tariff revenue gains and losses associated with TF. In this context, we should remember that welfare changes are associated with regional income, which is partly an aggregation of various tariff and tax revenues. Secondly, estimation of trade costs attributable to the lack of soft infrastructure is extremely challenging if not impossible, given the lack of data and difficulties in estimation. Thirdly, the tariff-equivalent mechanism grossly ignores the fact that TF reduces prices and increases demand simultaneously, in addition to the elasticity-induced demand responses to prices. Thus, from the theoretical, practical and computational viewpoints, our choice of the technology variable to proxy TF is more reasonable than the tariff-equivalent way of representing trade costs associated with TF.
In this section, we discuss the results of our analysis in the following sequence. Firstly, we look into the macroeconomic and more aggregate sectoral results in section 3.1 and then we focus on India’s bilateral exports and imports specifically in important sectors in Section 3.2, distinguishing intra-Commonwealth and other trade.
Aggregate Global Results
In the GTAP model, tariff elimination or reduction leads to a reduction in the domestic market prices of imports. This results in increased demand for imports by firms for intermediate inputs, as well as by private households and government. Cheaper imported intermediate inputs for firms may also reduce the cost of production across the spectrum of commodities. Further, reduced demand for domestic production may result in an excess supply situation, which can be rectified by the reduction of market prices to reach equilibrium. In bilateral terms, when an importer reduces tariffs on many or all of its partners, the degree of increase or decrease of imports from each of them would depend on two opposite effects—trade creation enabled by overall expansion in demand for cheaper imports and trade diversion created by the expansion of exports by partners facing higher tariff reduction at the cost of others, accomplished in terms of a response to price differentials. This is similar to the income and substitution effects in standard microeconomic theory. This is the major mechanism that affects bilateral trade, which adds up to sectoral consumption, which, in total, equals output. Our shocks on TF act in a similar fashion, by reducing the effective prices of imports and also raising the demand for imports.
All these sector-specific results add up to the macroeconomic results. Table 5 shows the GDP results, while Table 4 focuses on the welfare results of several countries. In the GTAP model, welfare changes are measured in equivalent variations. This is the amount of money consumers in any region would pay instead of facing the changes in prices and quantities resulting from the simulations. In other words, it is the implicit economic value of the policy changes for the whole economy. This is entirely different from GDP which measures the total value added in the economy.
Impact on Welfare under Different Scenarios (million US$)

Impact on Welfare under Different Scenarios (million US$)
Every Commonwealth country gains from TF as modelled in this article. Of course, the higher the extent of TF, the more pronounced are the welfare and GDP results. We observe a combined welfare gain of US$397 billion by the Commonwealth, when every country in there enhances its LPI to Singapore’s level; if South Africa is the target, the gain is at US$138 billion. Comparing this with the Commonwealth gain of a paltry US$78 billion with a complete tariff reduction, we get the impression that TF is not only a less political (than tariff elimination) and lower-hanging fruit than a tariff reduction, but is also a much more welfare-enhancing policy option.
While the numbers we show here appear enormously high, a comparison with those identified in the literature suggests they are not. Hufbauer and Schott (2013) show a US$960 billion gain in global GDP due to TF, while Wilson et al. (2003) suggest a export gain of US$254 billion across the APEC members, and OECD (2014) suggests a US$40 billion income gain for every 1 per cent decline in trade costs.
Welfare gains appear to be bigger for larger economies in general, indicating that economic size matters more than the extent to which each country improves its TF. In other words, although Australia would hardly improve its TF in this simulation, it gains a lot when other Commonwealth countries pursue TF. Major non-Commonwealth countries lose, pulling down the global welfare effects, but this is still a positive outcome for the whole world.
In GDP terms, as seen in Table 5, the effects are even more conspicuous. The Commonwealth as a whole gains over US$500 billion in GDP when its members enhance their LPIs to Singapore’s level, for instance, compared with a small gain in GDP of US$80 million by tariff removal. GDP increases in these countries mainly stem from two factors: effectively cheaper and larger amount of imports and exports. Cheaper imports benefit consumers as well as producers, who end up producing cheaper commodities that can be exported. All the values in this report are in current prices.
Impact on Gross Domestic Product under Different Scenarios

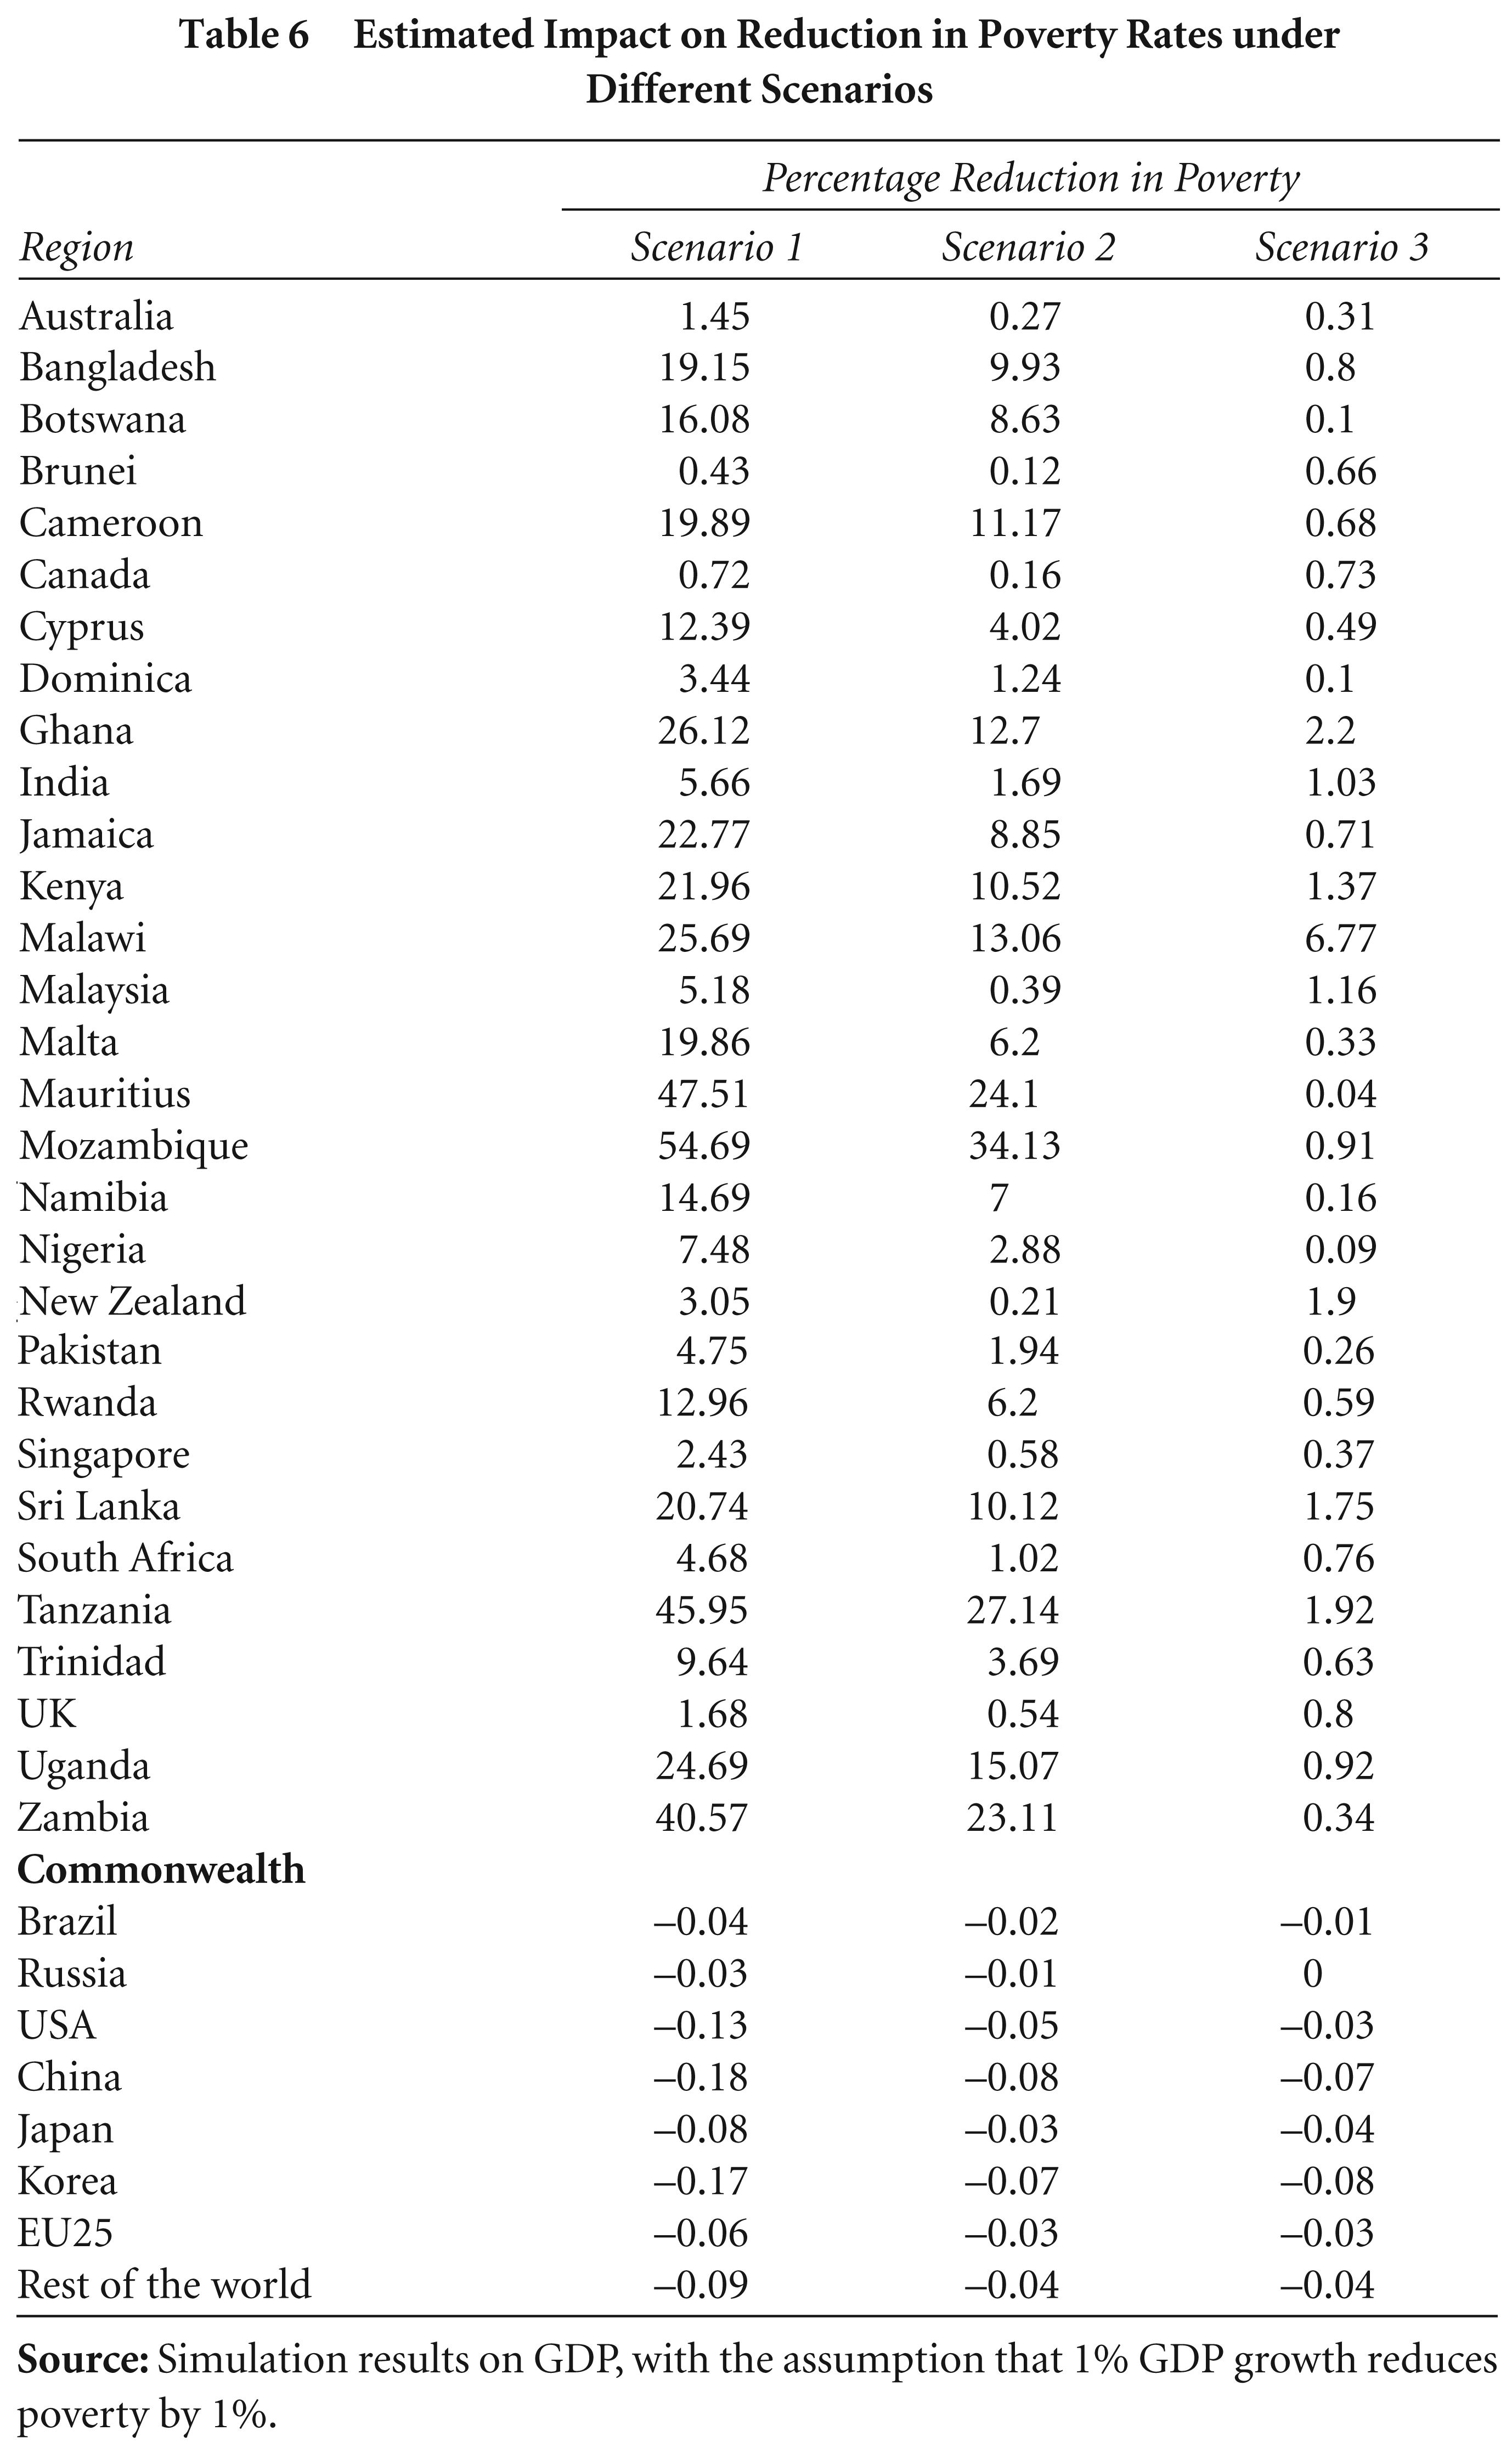
The extent of poverty reduction due to an increase in growth has been estimated at between 2 and 3 per cent for a 1 per cent increase in income (Ravallion & Chen, 1997; World Bank, 2001). Even at a conservative assumption of a one-to-one reduction in poverty when GDP grows, the poverty reduction effects of TF are phenomenally high, mainly for the poorer countries. This is even more striking when compared with those of tariff elimination, as seen in Table 6. For example, for Mozambique and Mauritius, the reduction in poverty is about 50 per cent with the ‘best-case’ scenario for TF, and almost 0 per cent with the scenario of tariff removal. Even a large economy like India is expected to see a six-fold improvement in poverty reduction with TF as opposed to tariff elimination.
Estimated Impact on Reduction in Poverty Rates under Different Scenarios
Employment gain is another huge benefit of TF. Over 52 million jobs may be created in the Commonwealth if its members upgrade their LPIs to Singapore’s level; if South Africa is the target, the gain is over 24 million, much higher than what can be achieved by tariff elimination—about 9 million, as seen in Table 7. Table 10 breaks down the employment effects across two skill levels—given the way labour categories are treated (alike) in the model, we do not observe a lot of deviation from the aggregate labour changes among the skill types.
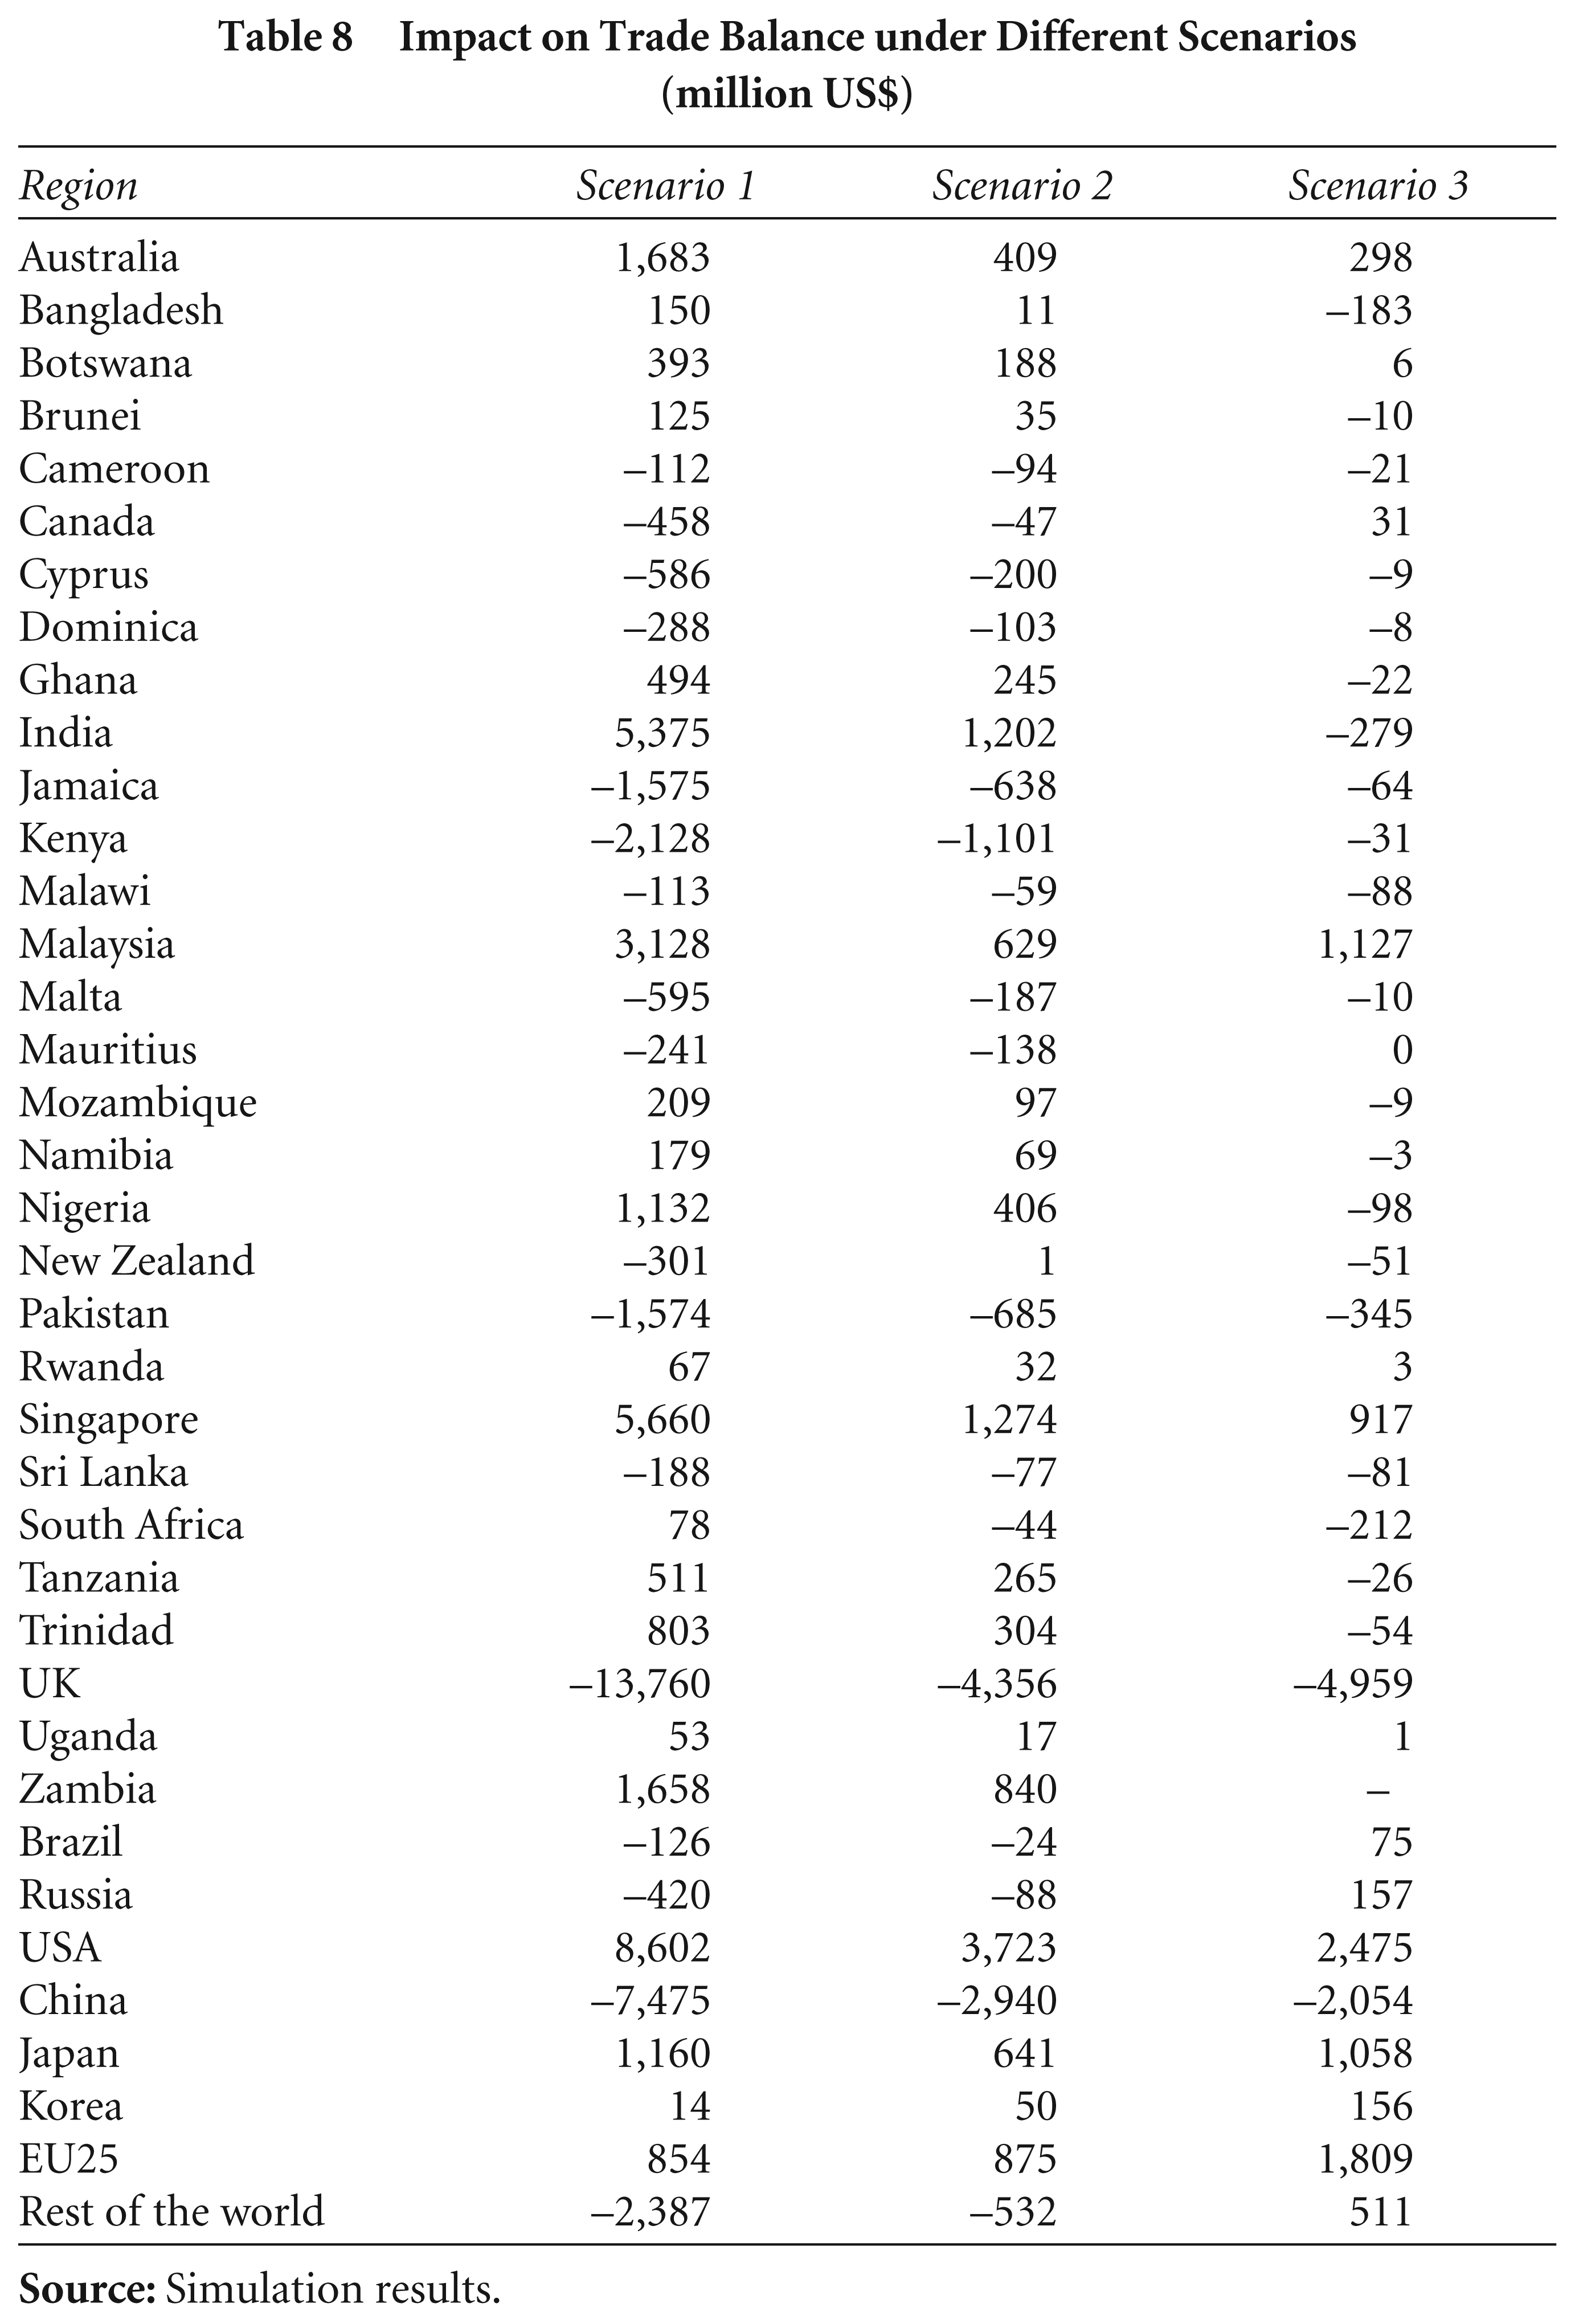
The trade balance shows a mixed picture in different countries, but many in the Commonwealth do gain in this compared to the non-Commonwealth members (Table 8). However, it is surprising to see that UK’s trade balance decreases a lot in all scenarios. This is mainly because, to begin with, UK imports a lot from the Commonwealth and these imports get further expanded in every scenario owing to the reduced effective import price in the UK. On the other hand, exports from the UK to the Commonwealth do not expand so much, resulting in a decline in the trade balance.
Absolute Change in Employment
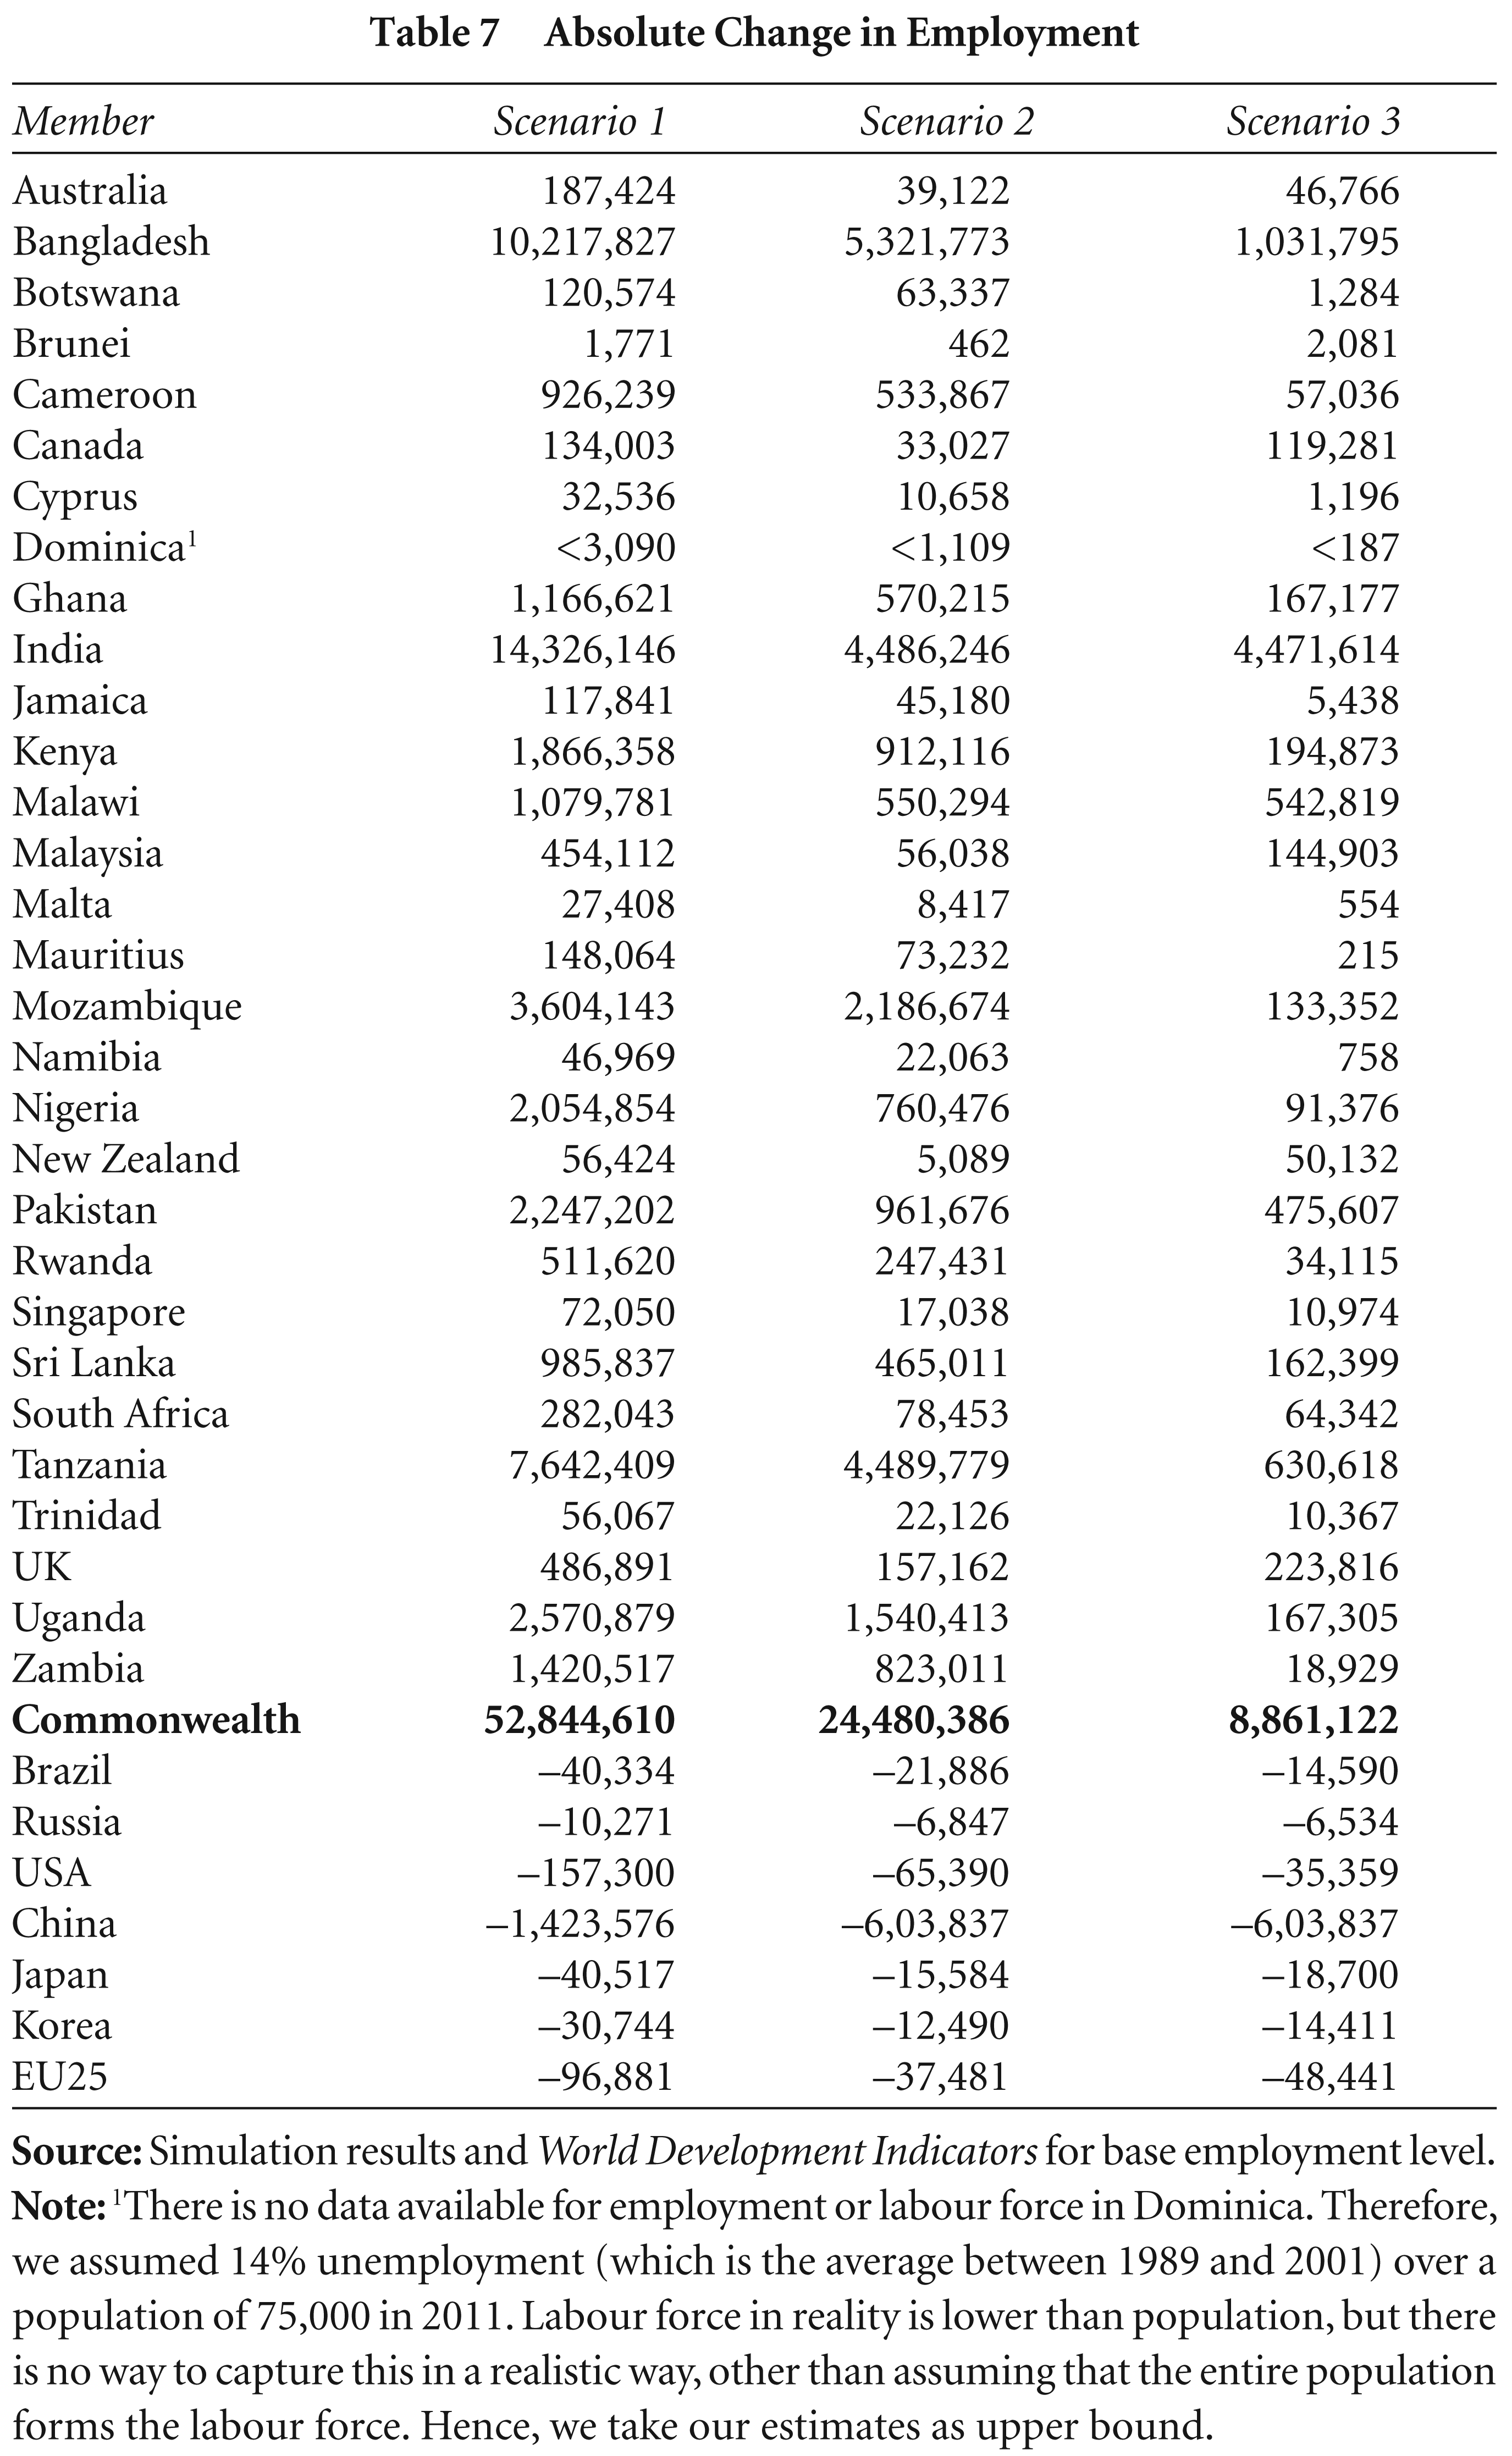
Note:1 There is no data available for employment or labour force in Dominica. Therefore, we assumed 14% unemployment (which is the average between 1989 and 2001) over a population of 75,000 in 2011. Labour force in reality is lower than population, but there is no way to capture this in a realistic way, other than assuming that the entire population forms the labour force. Hence, we take our estimates as upper bound.
Impact on Trade Balance under Different Scenarios (million US$)
Change in Demand for Exports and Imports (per cent)

Change in Demand for Skilled and Unskilled Labour (per cent)
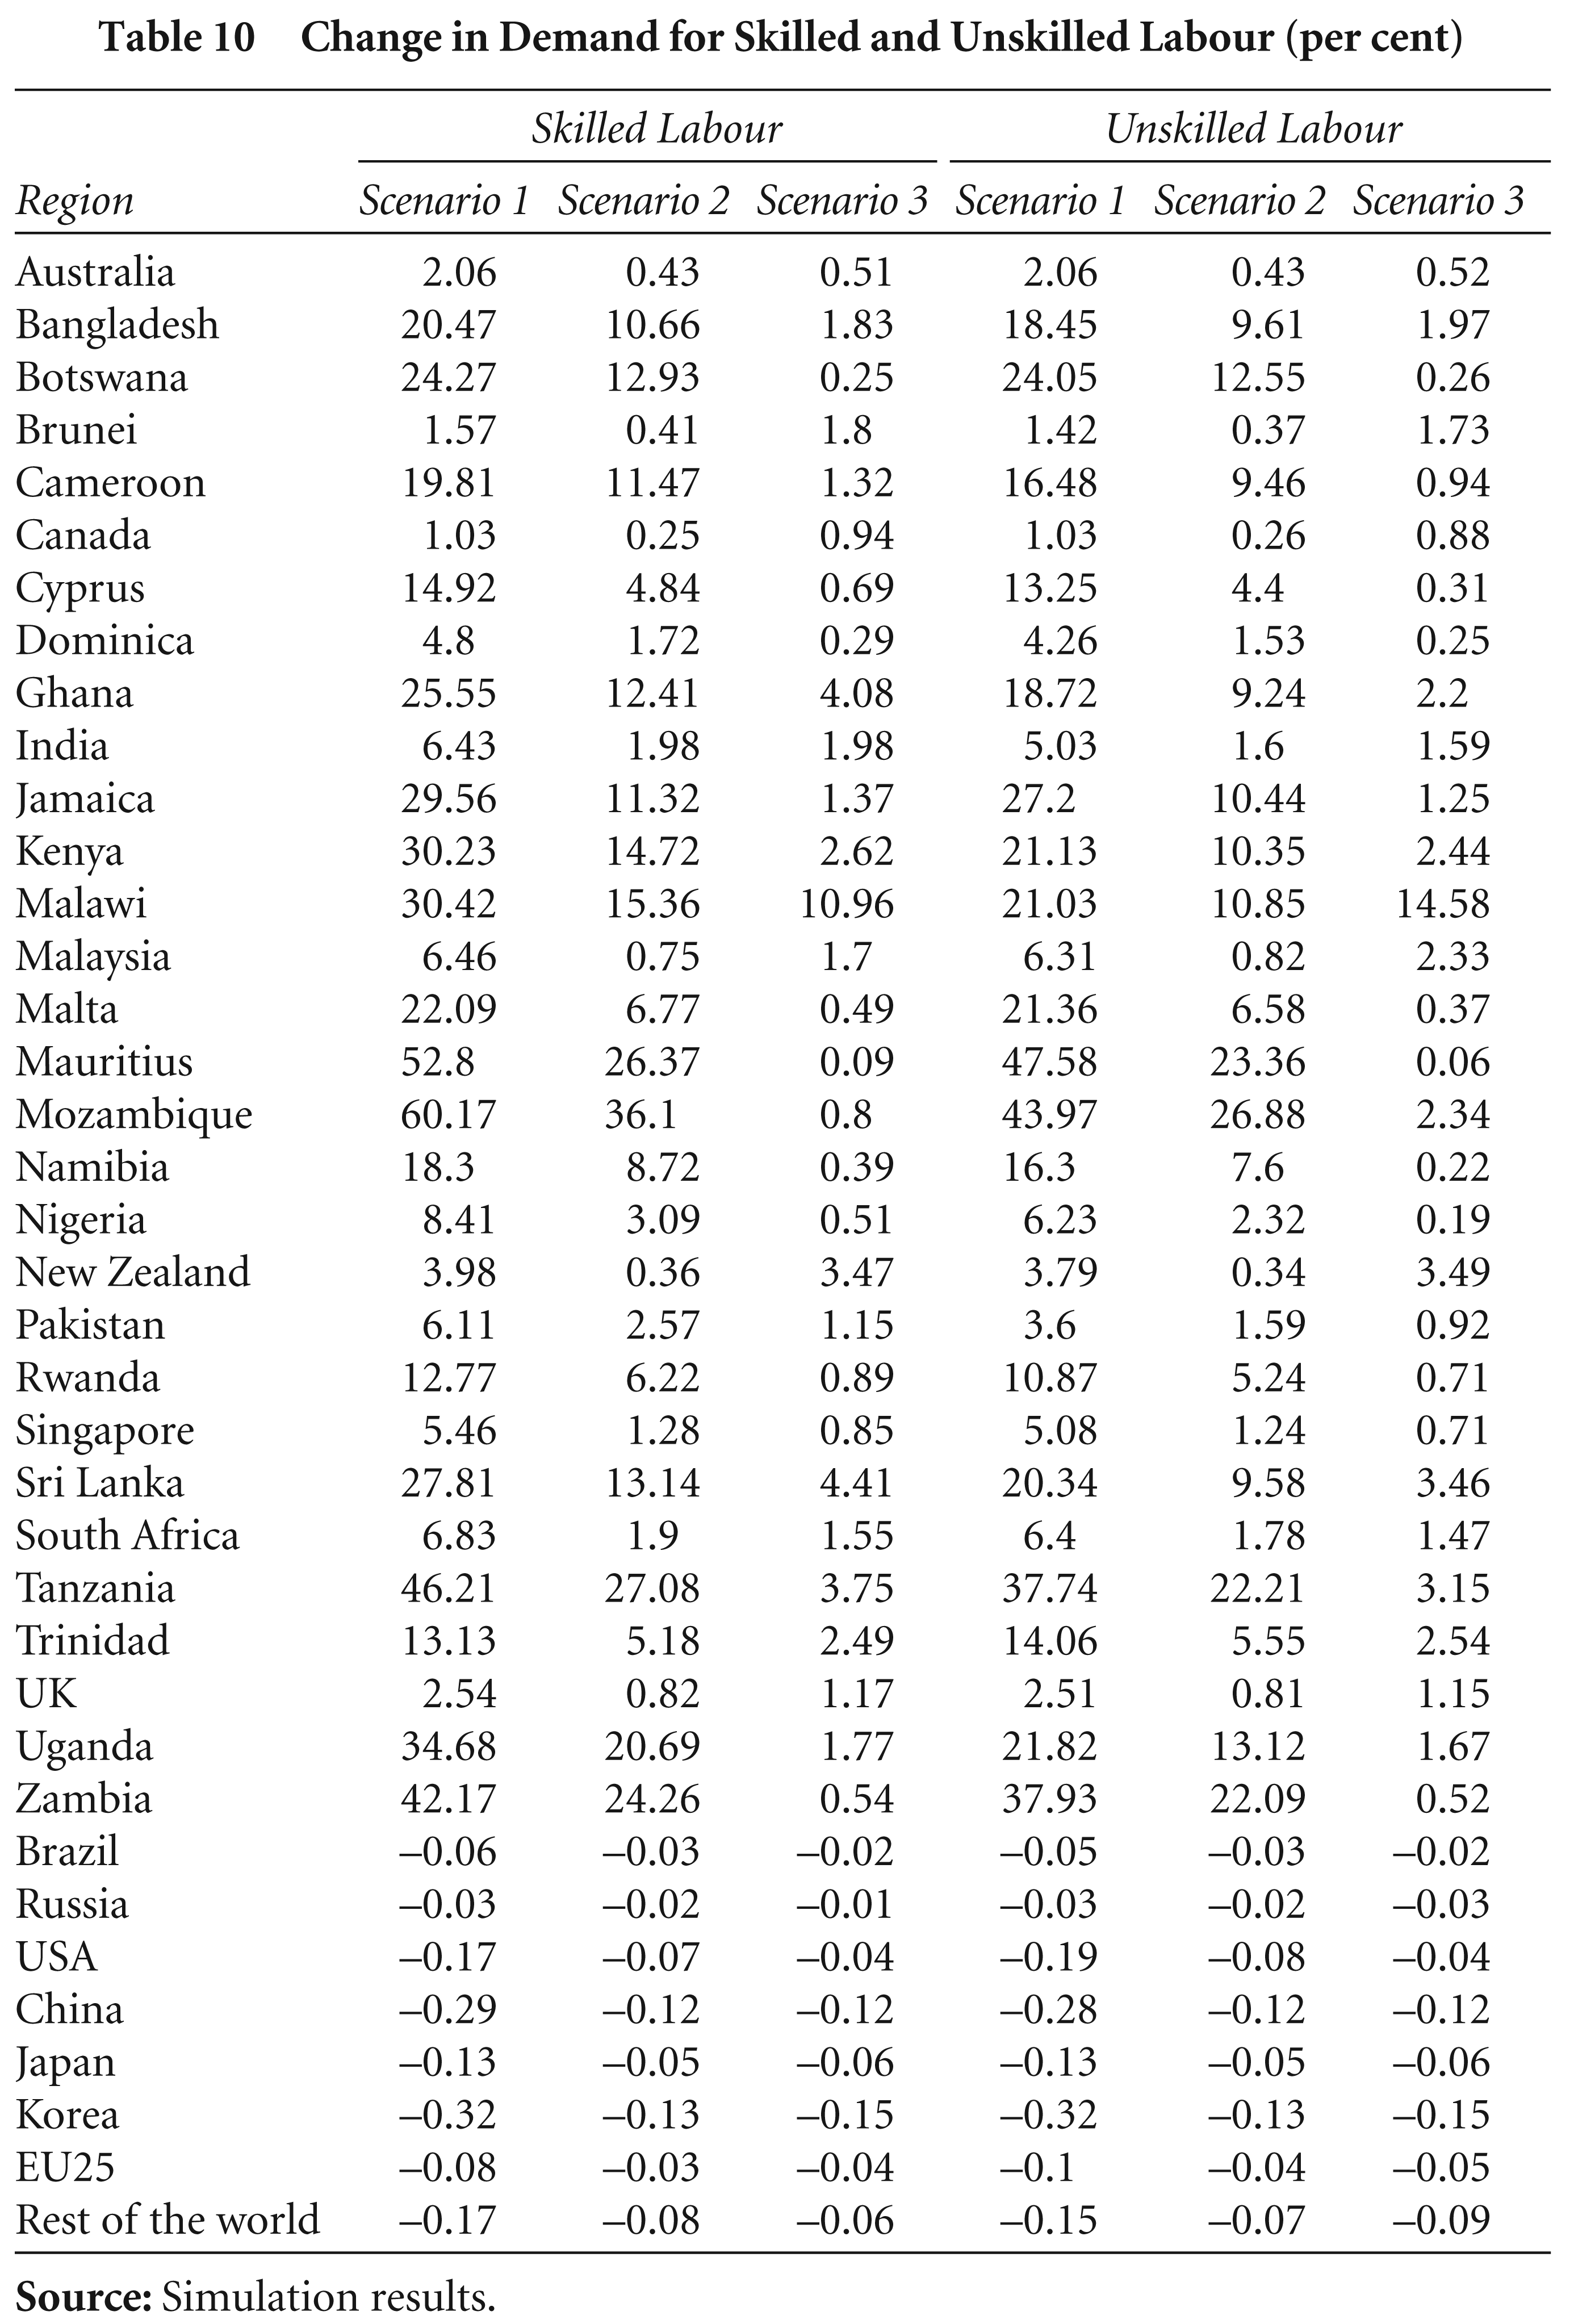
As Table 9 shows, exports rise more than imports in many Commonwealth countries in the scenarios involving TF. Smaller countries expand their exports much more sharply than the larger ones, mainly on account of lower initial values. In the later section of this article, we shall delve into greater details at the commodity and bilateral level. Table 10 breaks down the employment effects across two skill levels—given the way labour categories are treated (alike) in the model, we do not observe a lot of deviation from the aggregate labour changes among the skill types.
In this section, we have a detailed look at trade in aggregated groups 1 of commodities. In general, agricultural exports to and imports from non-Commonwealth countries decline, while both expand for Commonwealth countries, as shown in Table 11. All Commonwealth countries see a rise in imports of agricultural products, while we observe a huge reduction in non-Commonwealth agricultural imports. Despite a reduction in Commonwealth nations’ agricultural imports from non-Commonwealth countries, imports within the Commonwealth increase so much from enhanced TF that the net changes in imports are positive, and quite high (>US$1 billion) for countries like Bangladesh, India, Ghana, Kenya, Malaysia, Nigeria, Pakistan and South Africa. Barring Australia, Dominica, India, Jamaica, Kenya, Sri Lanka and the UK, all Commonwealth countries expand their exports, mainly due to the expansion of intra-Commonwealth trade. In short, we observe enormous expansion in intra-Commonwealth agricultural trade and considerable reduction in agricultural trade between Commonwealth as a group with other countries. On the other hand, trade between non-Commonwealth countries also expands quite notably.
Table 12 shows the results for trade in primary sectors (agriculture, minerals, extraction and forestry). Intra-Commonwealth trade expansion is clear in this table, but unlike agricultural products, primary sector exports and imports within non-Commonwealth countries do not expand much in these sectors. Trade gains among the Commonwealth countries at the cost of other countries are much more visible and clear in the case of manufacturing exports and imports, as shown in Table 13.
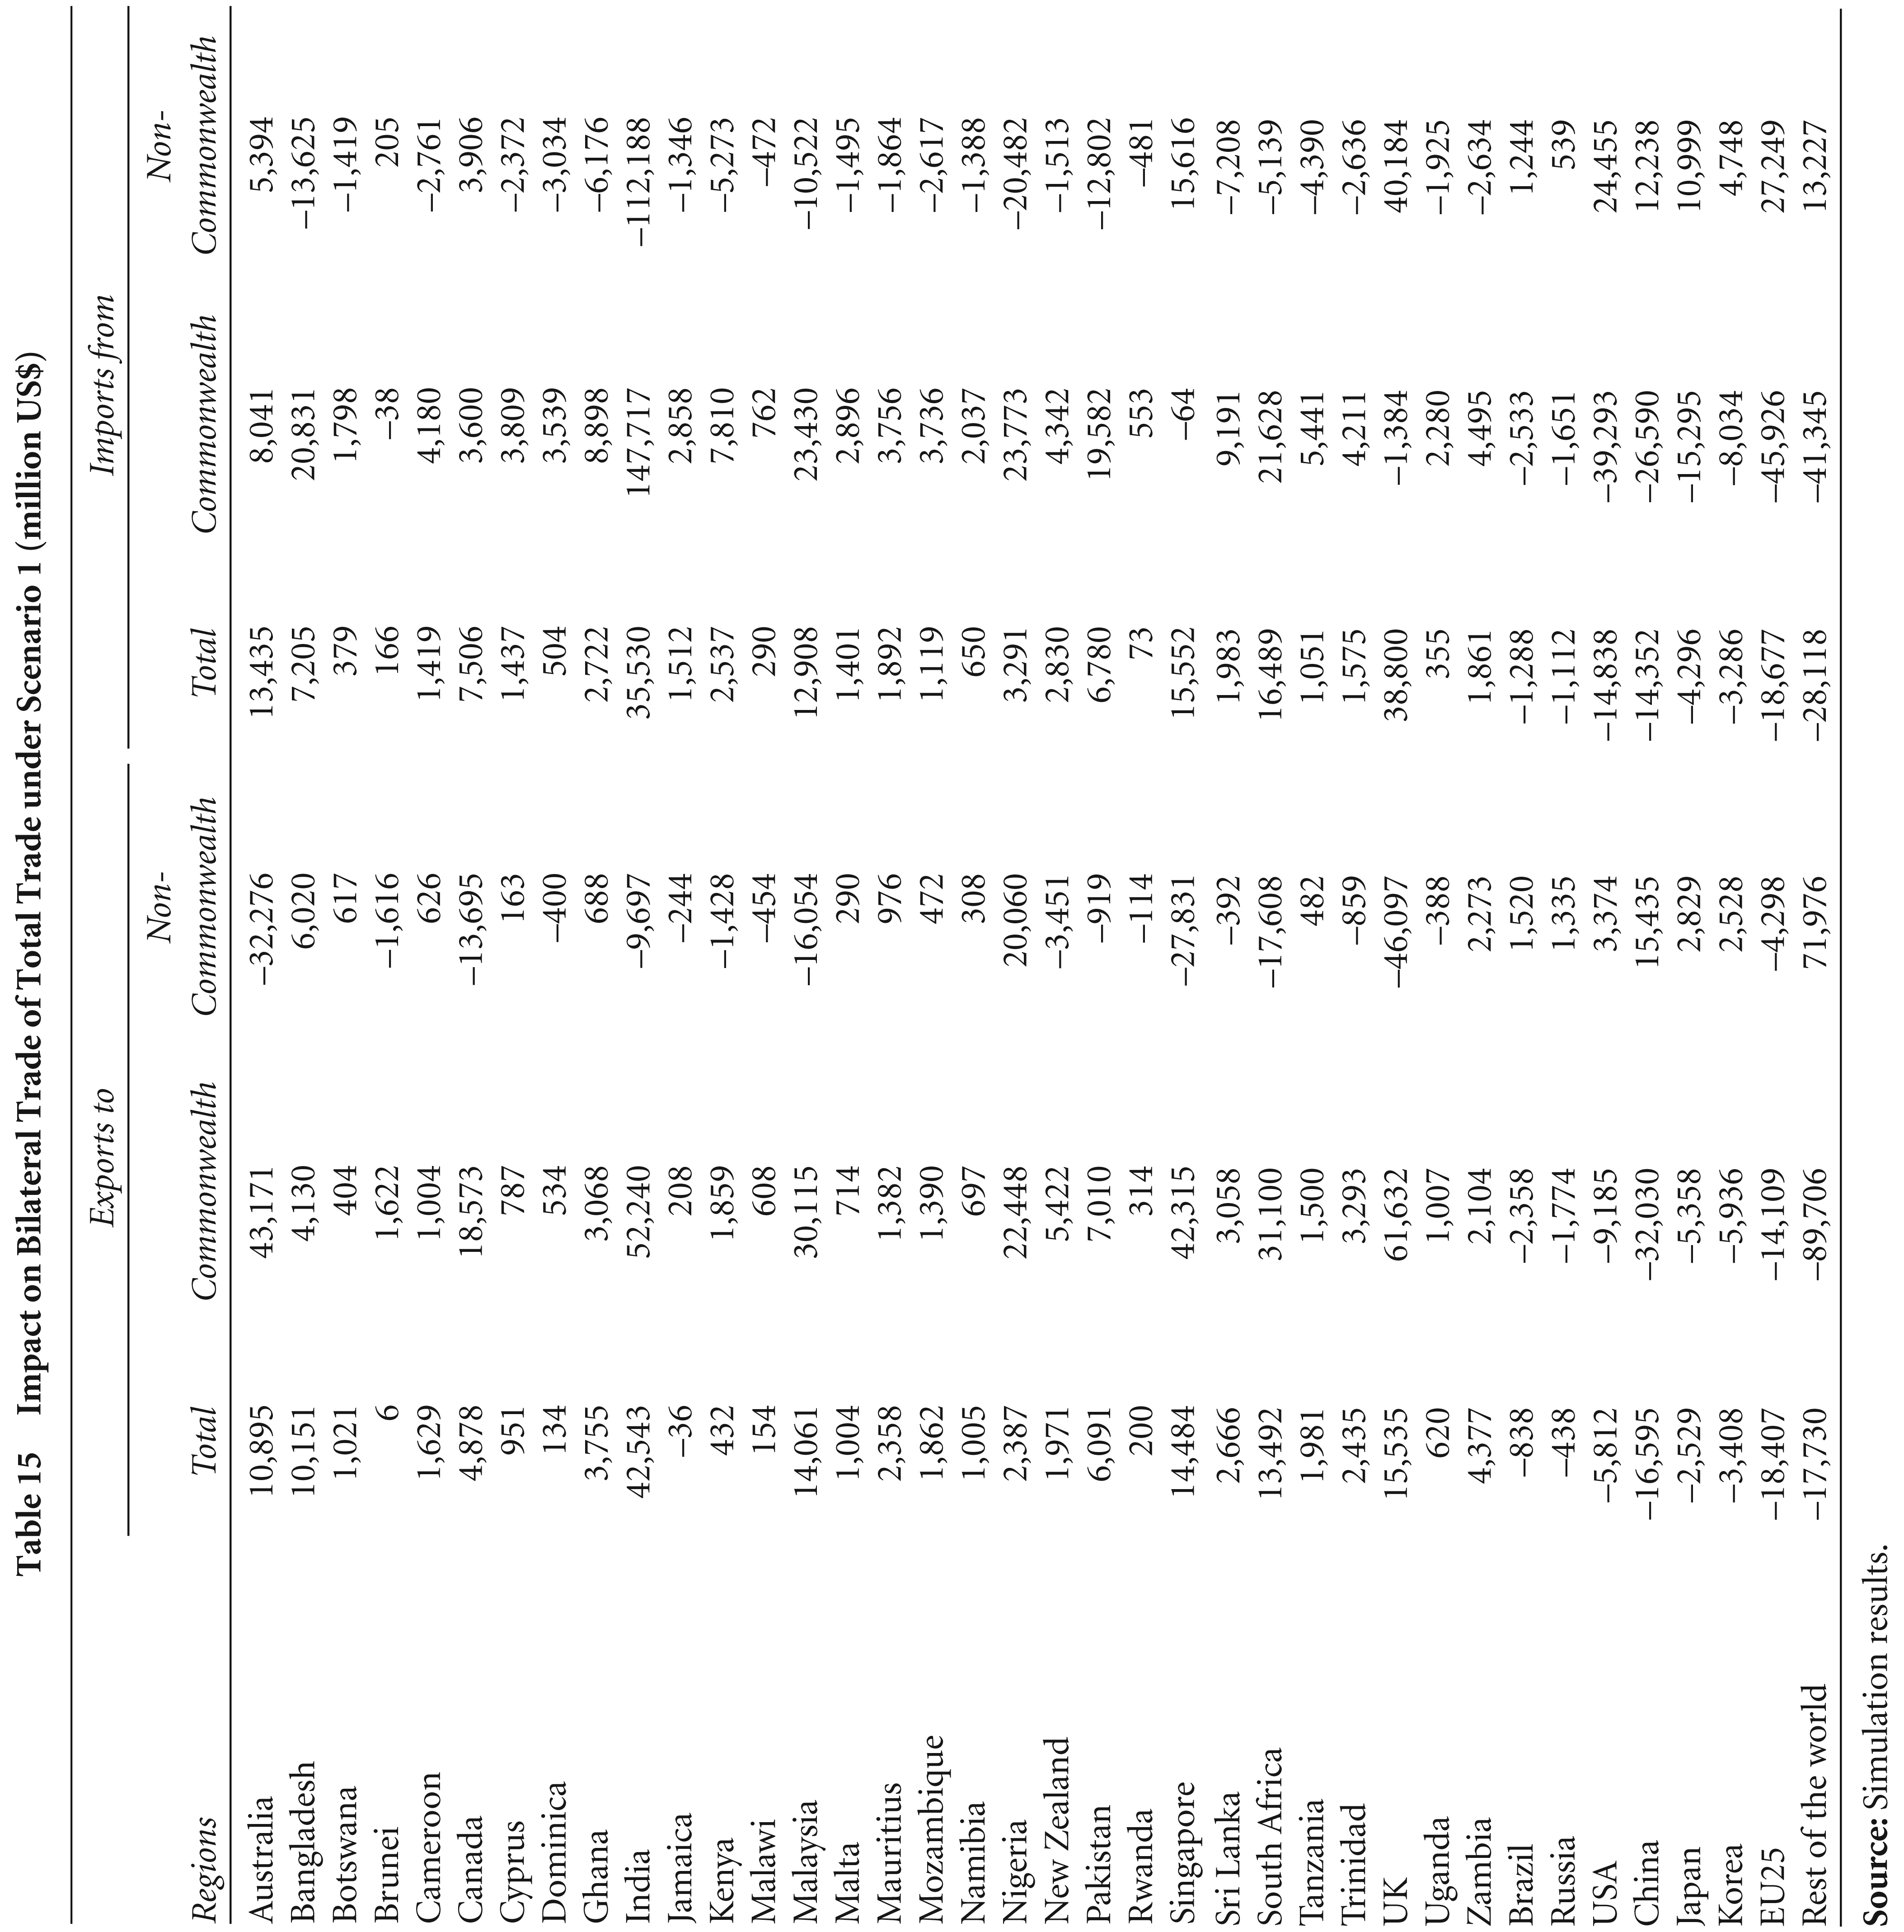
Table 14 shows the story of services sector trade. Given that Commonwealth countries such as India trade a lot of services with non-Commonwealth countries, improved intra-Commonwealth TF has little, no or negative effects on exports. In terms of overall trade, we observe that the Commonwealth expands hugely both in terms of exports and imports in total, mostly coming from expansion of intra-Commonwealth trade. Table 15 shows the results in changes of total trade, summing up the observations noted above in different broad sectors.
Impacts on Bilateral Trade of the Agriculture Sector1 under Scenario 1 (million US$)

Impacts on Bilateral Trade of the Agriculture Sector1 under Scenario 1 (million US$)
Note: 1This includes paddy, wheat, fibre, oilseed, sugar, vegetables, other grains, dairy, processed food, meat and fish.
Impact on Bilateral Trade of the Primary Sector Under Scenario 1 (million US$)
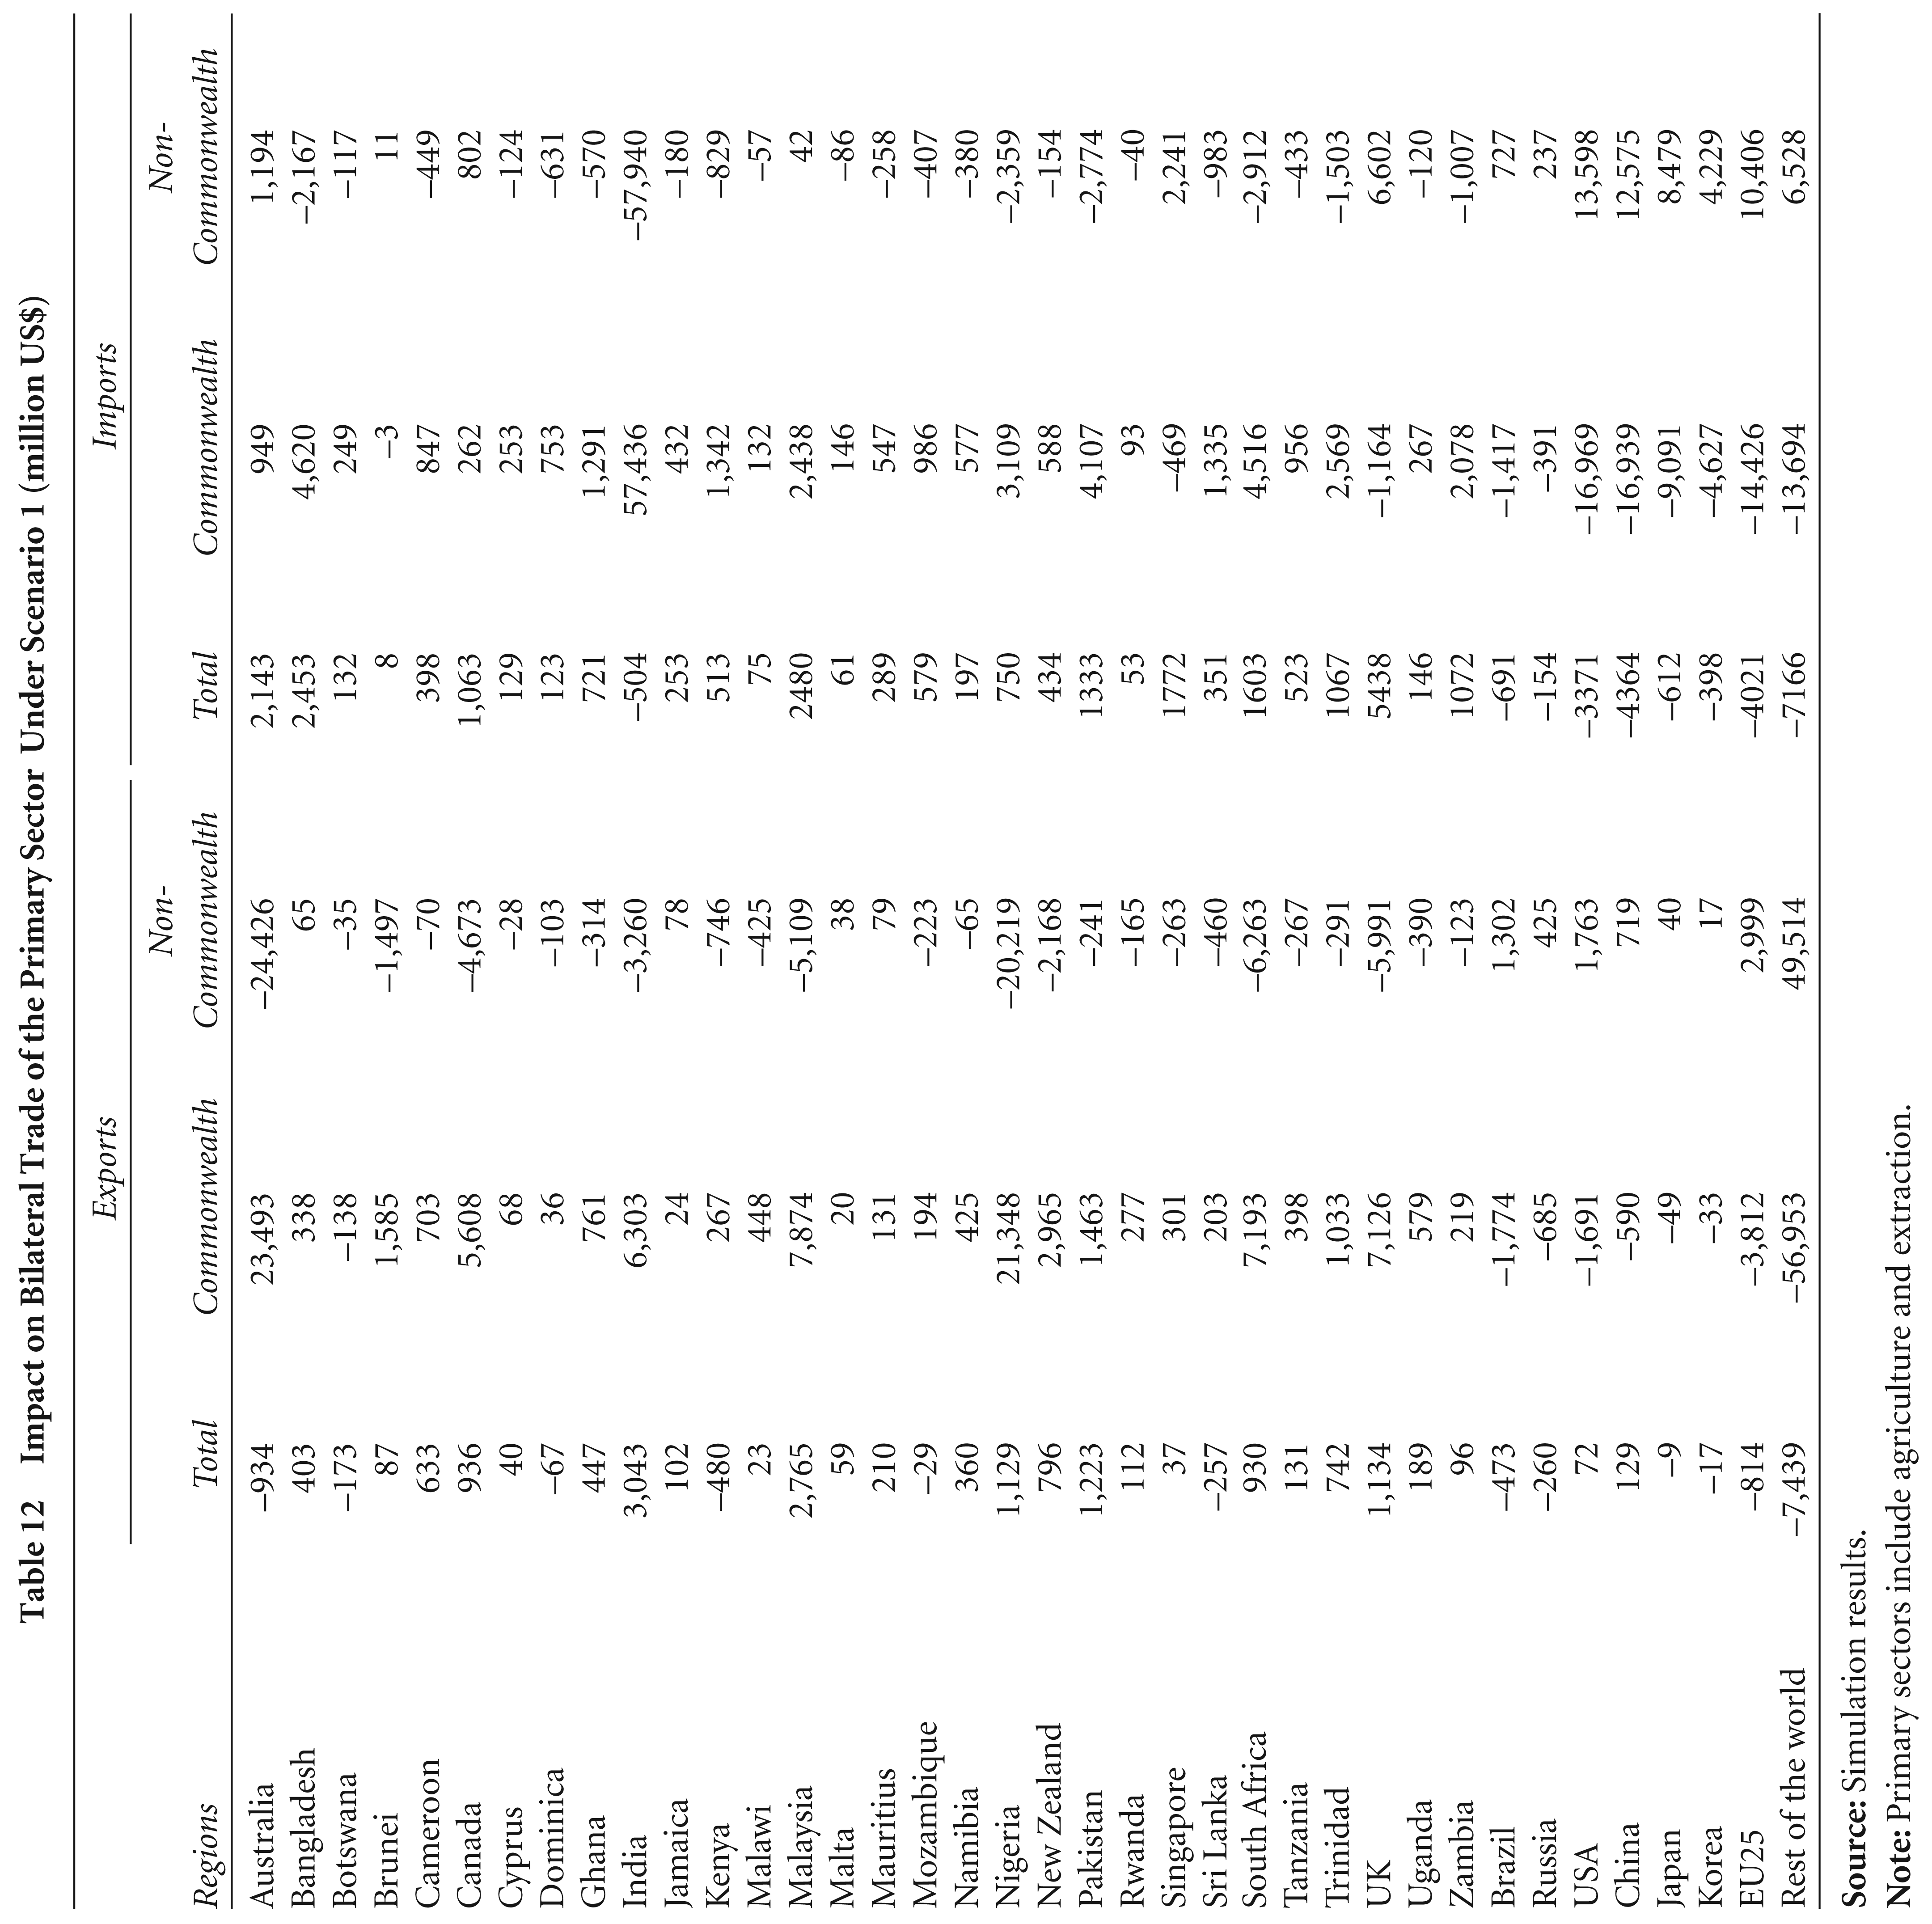
Note: Primary sectors include agriculture and extraction.
Impact on Bilateral Trade of the Manufacturing Sector under Scenario 1 (million US$)
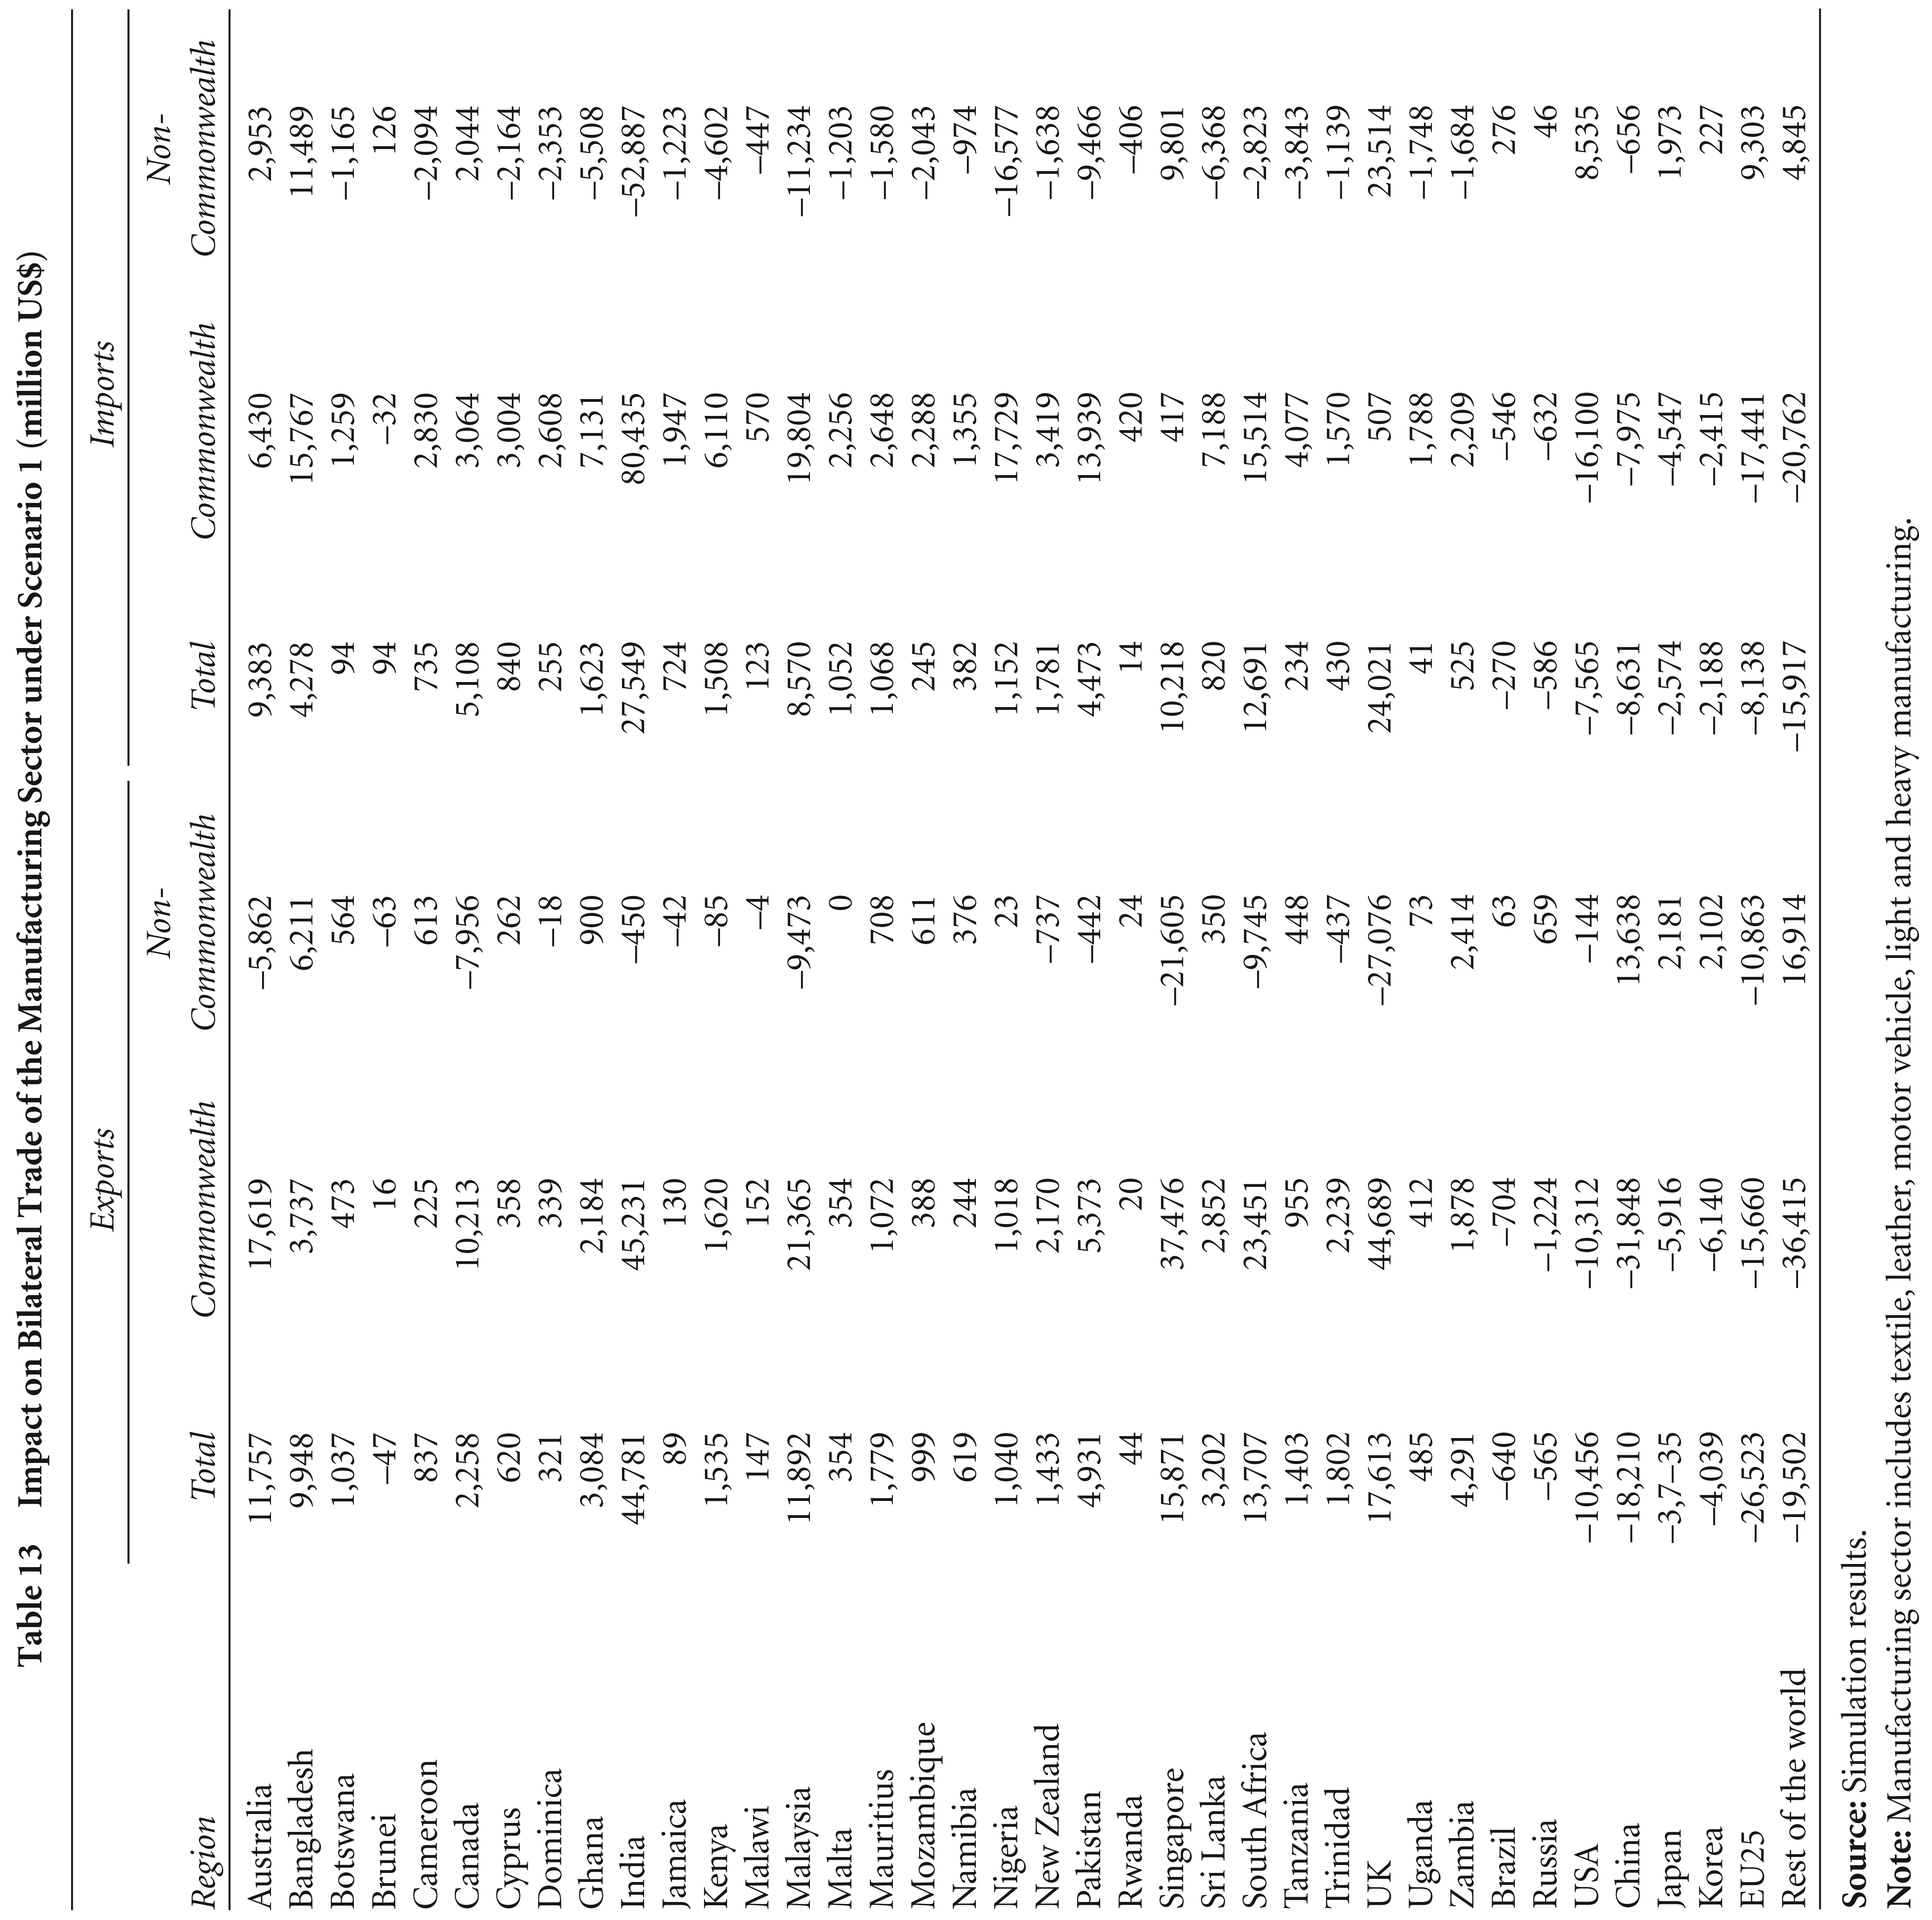
Note: Manufacturing sector includes textile, leather, motor vehicle, light and heavy manufacturing.
Impact on Bilateral Trade of Service Sector under Scenario 1 (million US$)

Impact on Bilateral Trade of Total Trade under Scenario 1 (million US$)
This study is aimed at assessing the impact of TF in Commonwealth member countries. We compared three scenarios: one in which all Commonwealth members are assumed to enhance their TF to the level of Singapore; another in which they enhance it to the level of South Africa; a third in which every member eliminates tariffs on all imports within the Commonwealth. This first scenario is most optimistic, while the second one is not very unrealistic, since South Africa could serve as a reasonable target for most developing countries.
We find the results for the first scenario are the largest and most positive among all three scenarios, in terms of welfare, GDP, employment and trade, mainly within the Commonwealth and to an extent, beyond the Commonwealth, mainly in the agricultural sector. Extending the results to infer the poverty-reduction effects, we observe that even in the most conservative case, poverty reduction could be immense if all member countries strive to attain the TF levels of Singapore. The trade balance improves in most of the poorer Commonwealth countries, with TF. A huge reduction in the trade balance of the UK arises because of increased reliance on imports from the now-easier-to-trade Commonwealth countries, which already trade substantially with the UK.
In the most optimistic scenario of TF, agricultural exports and imports expand a lot within the Commonwealth, but also expand among the non-Commonwealth countries. However, intra-Commonwealth trade expands in all merchandise sectors at the cost of trade between the Commonwealth and beyond. In non-agricultural sectors, trade does not even expand among the non-Commonwealth countries. In the services sector, countries like India, which rely a lot on exports to non-Commonwealth countries actually suffer in terms of exports, since TF is focused on the Commonwealth alone.
Overall, we find quite positive results from TF among the Commonwealth countries. Several studies in the past have shown that the trade costs among these countries are quite low and our article’s findings are in line with such observations. Therefore, the members of the Commonwealth may work together towards the common objective of TF.
Footnotes
Acknowledgements
The authors are grateful to the Commonwealth Secretariat for funding and comments on an earlier draft of this article.