




Abstract
This article examines if there is a wage gap between public and private mining (and quarrying) workers in India, using the NSS data (2004–2005, 2009–2010 and 2011–2012). We employ linear and quantile regressions to estimate the wage gap. The ordinary least squares (OLS) results suggest that workers in the public sector mines (and quarries) earn 59 per cent more than their private sector counterparts. However, the wage gap is not uniform across the conditional wage distribution. The quantile regression estimates show that the magnitude of the wage gap is larger at the bottom quantile than at the top; the gap reduces as we move up the wage distribution. Observations drawn from our sub-sample analysis concur with these findings.
Keywords
Introduction
Mining is a strategic industry in developing and developed countries, and India is no exception; the mining industry has been the backbone of India’s industrial development in the past, supplying crucial raw materials to many other important industries. With liberalisation of the Indian economy in 1991, the mining sector was deregulated to tackle the issue of technological backwardness in mineral extraction and processing. In 1994, the sector was opened up for the private agencies, both domestic and foreign, and the 2008 New Mineral Policy which allowed 100 per cent foreign direct investment (FDI) in mining projects led to a rise in private mining activity.
Increasing privatisation has brought in greater efficiency in the mining industry (Das, 2012). However, in order to assess the overall performance of the industry, we need to look at the cons, that is, issues related to the conditions of labour. These issues are related to health and safety measures, lower and delayed wages, living and working conditions, denial of minimum labour entitlements, exploitative labour sub-contracting arrangements and so on (Adduci, 2017; Nair, 2002). Although labour conditions is a multidimensional concept, we focus on one particular dimension, that is, worker’s wage. Specifically, we investigate if there is a wage gap between public and private mining (and quarrying) 1 workers in India. While examining the public–private wage gap has become an empirical regularity in industrialised nations, the literature for India seems sparse. The notable studies that explore the existence of wage differentials between the public and private sector workers in India are those of: P. Duraiswamy and M. Duraiswamy (1995), Lakshmanasamy and Ramasamy (1999), Madheswaran (1998), Madheswaran and Shroff (2000), Glinskaya and Lokshin (2007) and Azam and Prakash (2015).
In this study, we use unit-level data from the National Sample Survey Organisation (NSSO) covering the period 2004–2011. Using a linear regression, our study estimates the mean wage differential between public and private mine workers. Furthermore, the quantile regression estimates the wage differential at various quantiles on the conditional wage distribution. The study finds significant wage differentials across the entire wage distribution. Overall, the gap declines as we move from lower to higher wage quantiles.
The remainder of the article is structured as follows. Section 2 provides a theoretical background on the public–private wage gap and reviews related literature. Section 3 presents background information on the Indian mining industry. Section 4 outlines the empirical strategy. Section 5 describes the dataset and construction of the variables used in our empirical analysis. Section 6 discusses the empirical results, and Section 7 concludes.
Related Literature
Literature on Public–Private Wage Gap Theories
The prominent theories on the public–private wage gap are the utility model, vote and budget maximisation model, human capital model, bargaining model and compensating differential model. One of the most widely cited explanations of the public–private wage gap is the intrinsic differences in motives guiding the wage determination process in the two sectors. While private sector wage determination is subject to the profit constraint, the public sector wage determination is subject to an ultimate political constraint (Mueller, 1998; Tansel, 2005). The private sector fixes wages of its workers according to their marginal productivities. On the contrary, the connection between wage and productivity is loose in the public sector. It is argued that wages of the public sector workers are fixed at a level higher than their marginal productivities (Rees & Shah, 1995).
The utility maximisation model developed by Ehrenberg (1973) holds that the utility of a government is a function of the public sector goods and services produced. The amount of public goods and services is determined by the volume of public sector employment, which in turn is a function of workers’ wages. Thus, in maximising utility in the public sector, higher wages are evident. Reder (1975) and Borjas (1980) use the vote maximisation model to explain the public sector wage premium. Reder (1975) posits that the utility of the government depends on ideological factors and the expected number of votes, which in turn is a function of the level of employment and wages. Borjas (1980) considers that public sector employees are political interest groups, who form the major chunk of voters, so the government in power works in the interest of its employees by paying higher wages to freeze votes. The budget maximisation model proposed by Niskanen (1975) argues that bureaucrats are budget maximising agents, and the wages of public employees are major sources of budgetary expenditure; so high wages of public employees is an important component in maximising the budget function.
According to the human capital model, one of the objectives of the state and the central governments is to produce and sustain quality governance. To achieve this, qualified, trained and experienced workforce is a prerequisite. In order to attract and retain such workforce, the public sector usually offers higher wages than the private sector. The bargaining model observes that it is the presence of trade unions and collective bargaining that significantly influences the wage- setting procedure in the public sector, whereas the wage-setting mechanism is quite different in the private sector (Gunderson, 1979; Holmlund, 1993). Moore and Raisian (1991) put forward the theory of compensating differentials as one of the explanations for the wage differential between the public and the private sectors.
Empirical Evidence on the Public–Private Wage Gap
The first formal study focusing on the public–private wage gap was undertaken by Smith (1976); the study observed that in 1960 and 1970, US federal government workers were paid more than comparable private sector workers; and the wage premium mainly remained unexplained by measured differences in productivity between the two types of workers. Following Smith, a number of empirical studies observed a premium for public sector employees (Chamberlain, 2015; Depalo, Giordano, & Papapetrou, 2015; Hospido & Moral-Benito, 2016). However, there are also studies providing evidence on the public sector wage penalty, and some studies report a small magnitude of public sector wage premium that vanishes over time. Using the French Labour Force Survey over 1990–2002, Bargain and Melly (2008) estimate a small public–private pay differential in the short run that approximates to zero in the long run. Adamchik and Bedi (2000), in the case of Poland, observe a wage premium for private sector workers with a university-level education. In the case of the US, Keefe (2012) reports that both the state and local government employees are not overpaid; rather they are slightly underpaid compared to their private sector counterparts.
A strand of literature focuses on estimating the wage gap between the public and private sectors at different points on the wage distribution. Using the quantile regression technique, the studies report that the wage premium for public sector workers tends to be large at the bottom wage quantile and smaller at the top (Azam & Prakash, 2015; Bargain & Melly, 2008; Christofides & Michael, 2013; Depalo et al., 2015; Jürges, 2002; Lucifora & Meurs, 2006; Mueller, 1998; Nielsen & Rosholm, 2001; Rahona-López, Murillo-Huertas, & Salinas-Jiménez, 2016; Ramos, Sanromá, & Simón, 2014). However, Mizala, Romaguera and Gallegos (2011) for Latin America and Blackaby, Murphy and O’Leary (1999) for the UK find that public sector workers earn less than their private sector counterparts at the highest wage percentile.
The literature on public–private wage differentials is sparse in India; moreover, the literature specific to the mining industry is non-existent. P. Duraiswamy and M. Duraiswamy (1995), using the data from the survey on Degree Holders and Technical Personnel (DHTP) 1981, find a wage penalty for public sector workers in India. A few studies, that followed P. Duraiswamy and M. Duraiswamy (1995) and used the same data, arrived at similar conclusions (Lakshmanasamy & Ramasamy, 1999; Madheswaran, 1998; Madheswaran & Shroff, 2000). However, some recent studies point to a wage premium for public sector workers in India. For example, using three different econometric specifications (ordinary least squares, selection bias correction and propensity score matching) and employment data from the NSS for 1993–1994 and 1999–2000, Glinskaya and Lokshin (2007) observe that there are large wage gaps among the three sectors (public, private formal and private informal). The study reports that the public sector wage premium ranges from 62 per cent to 102 per cent for the private formal sector and from 164 per cent to 259 per cent for the private informal sector, depending on the choice of econometric specification. Azam and Prakash (2015), using the sample of regular-salaried male workers in India, estimate that the public sector wage premium is 90 log points for rural India and 85 log points for urban India at the mean level; overall, this study finds a public sector wage premium across the entire wage distribution.
Mining in India: Some Key Indicators
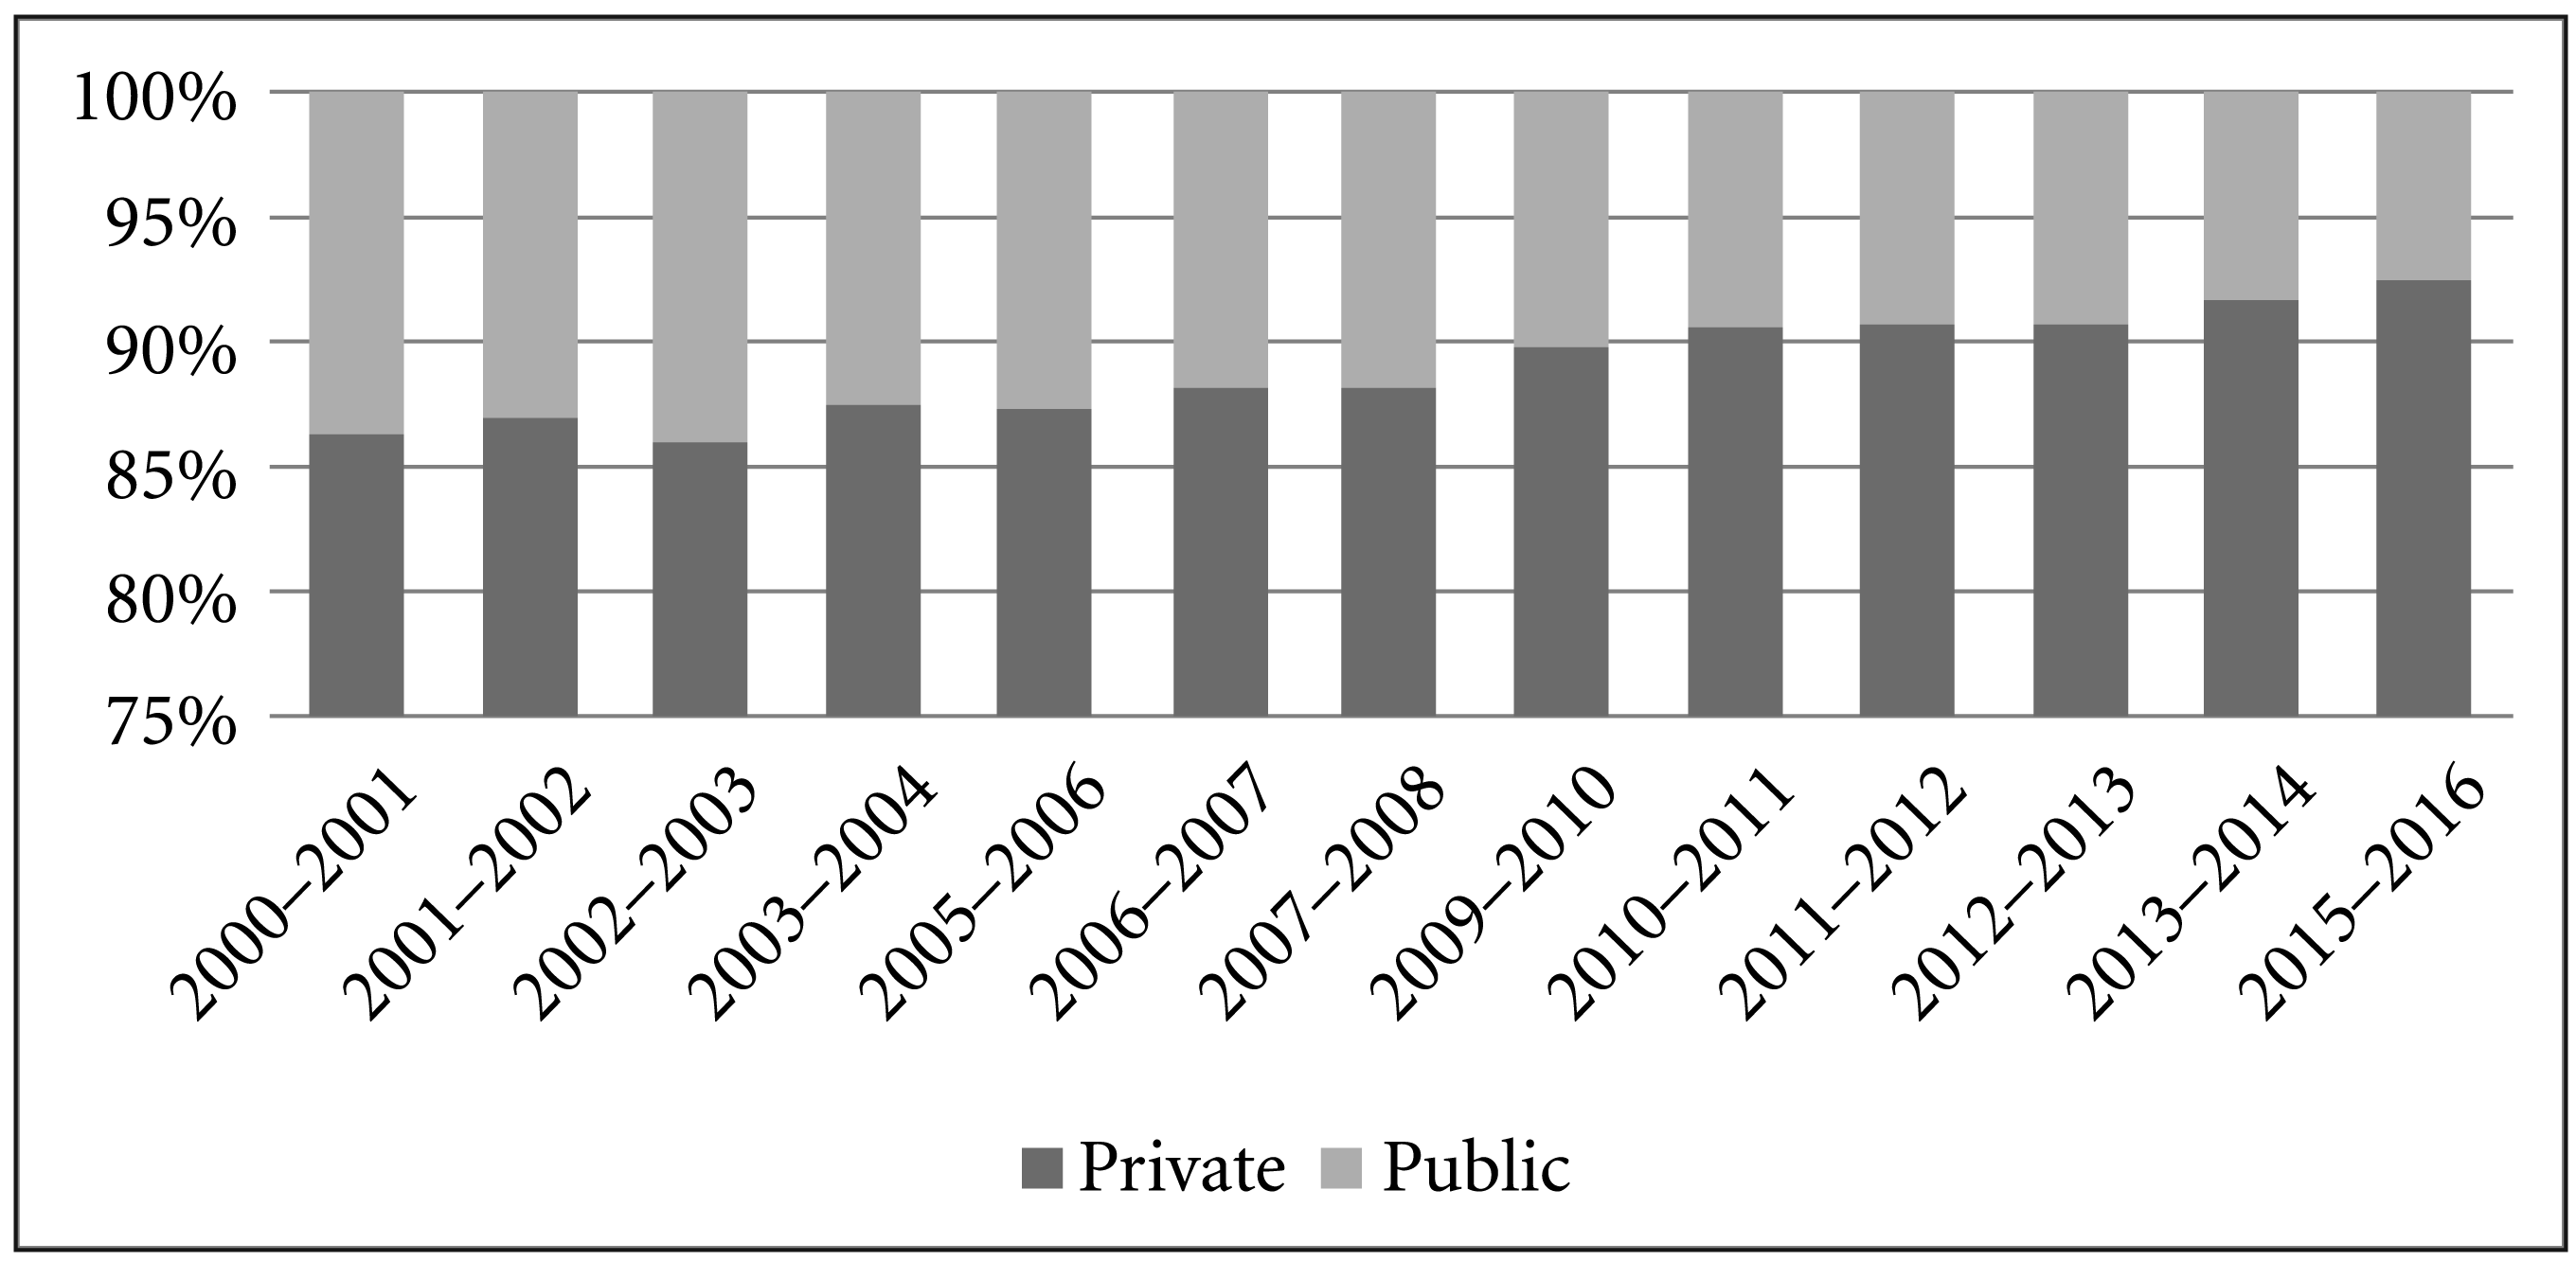
In this section, we analyse some aspects of Indian mining: the allotment of mining leases, grant of area under the allotted leases and employment scenario. The private sector share of mining leases has been steadily rising from 86 per cent in 2001 to 92 per cent in 2015–2016 (Figure 1). In terms of absolute figures, the private sector was allotted 8,448 mining leases in 1998, which increased to 10,567 in 2015, an average annual growth of about 25 per cent.
The area under private operation has also increased during 2000–2015; in 2015, the private sector had 56 per cent of the area allotted to mining (Figure 2). However, the total area under mining leases has been declining for both sectors. In 2015, the area under private mining stood at 325,784 hectares and that of the public sector stood at 256,216 hectares. In 2000, these numbers were 406,989 hectares and 496,056 hectares, respectively.
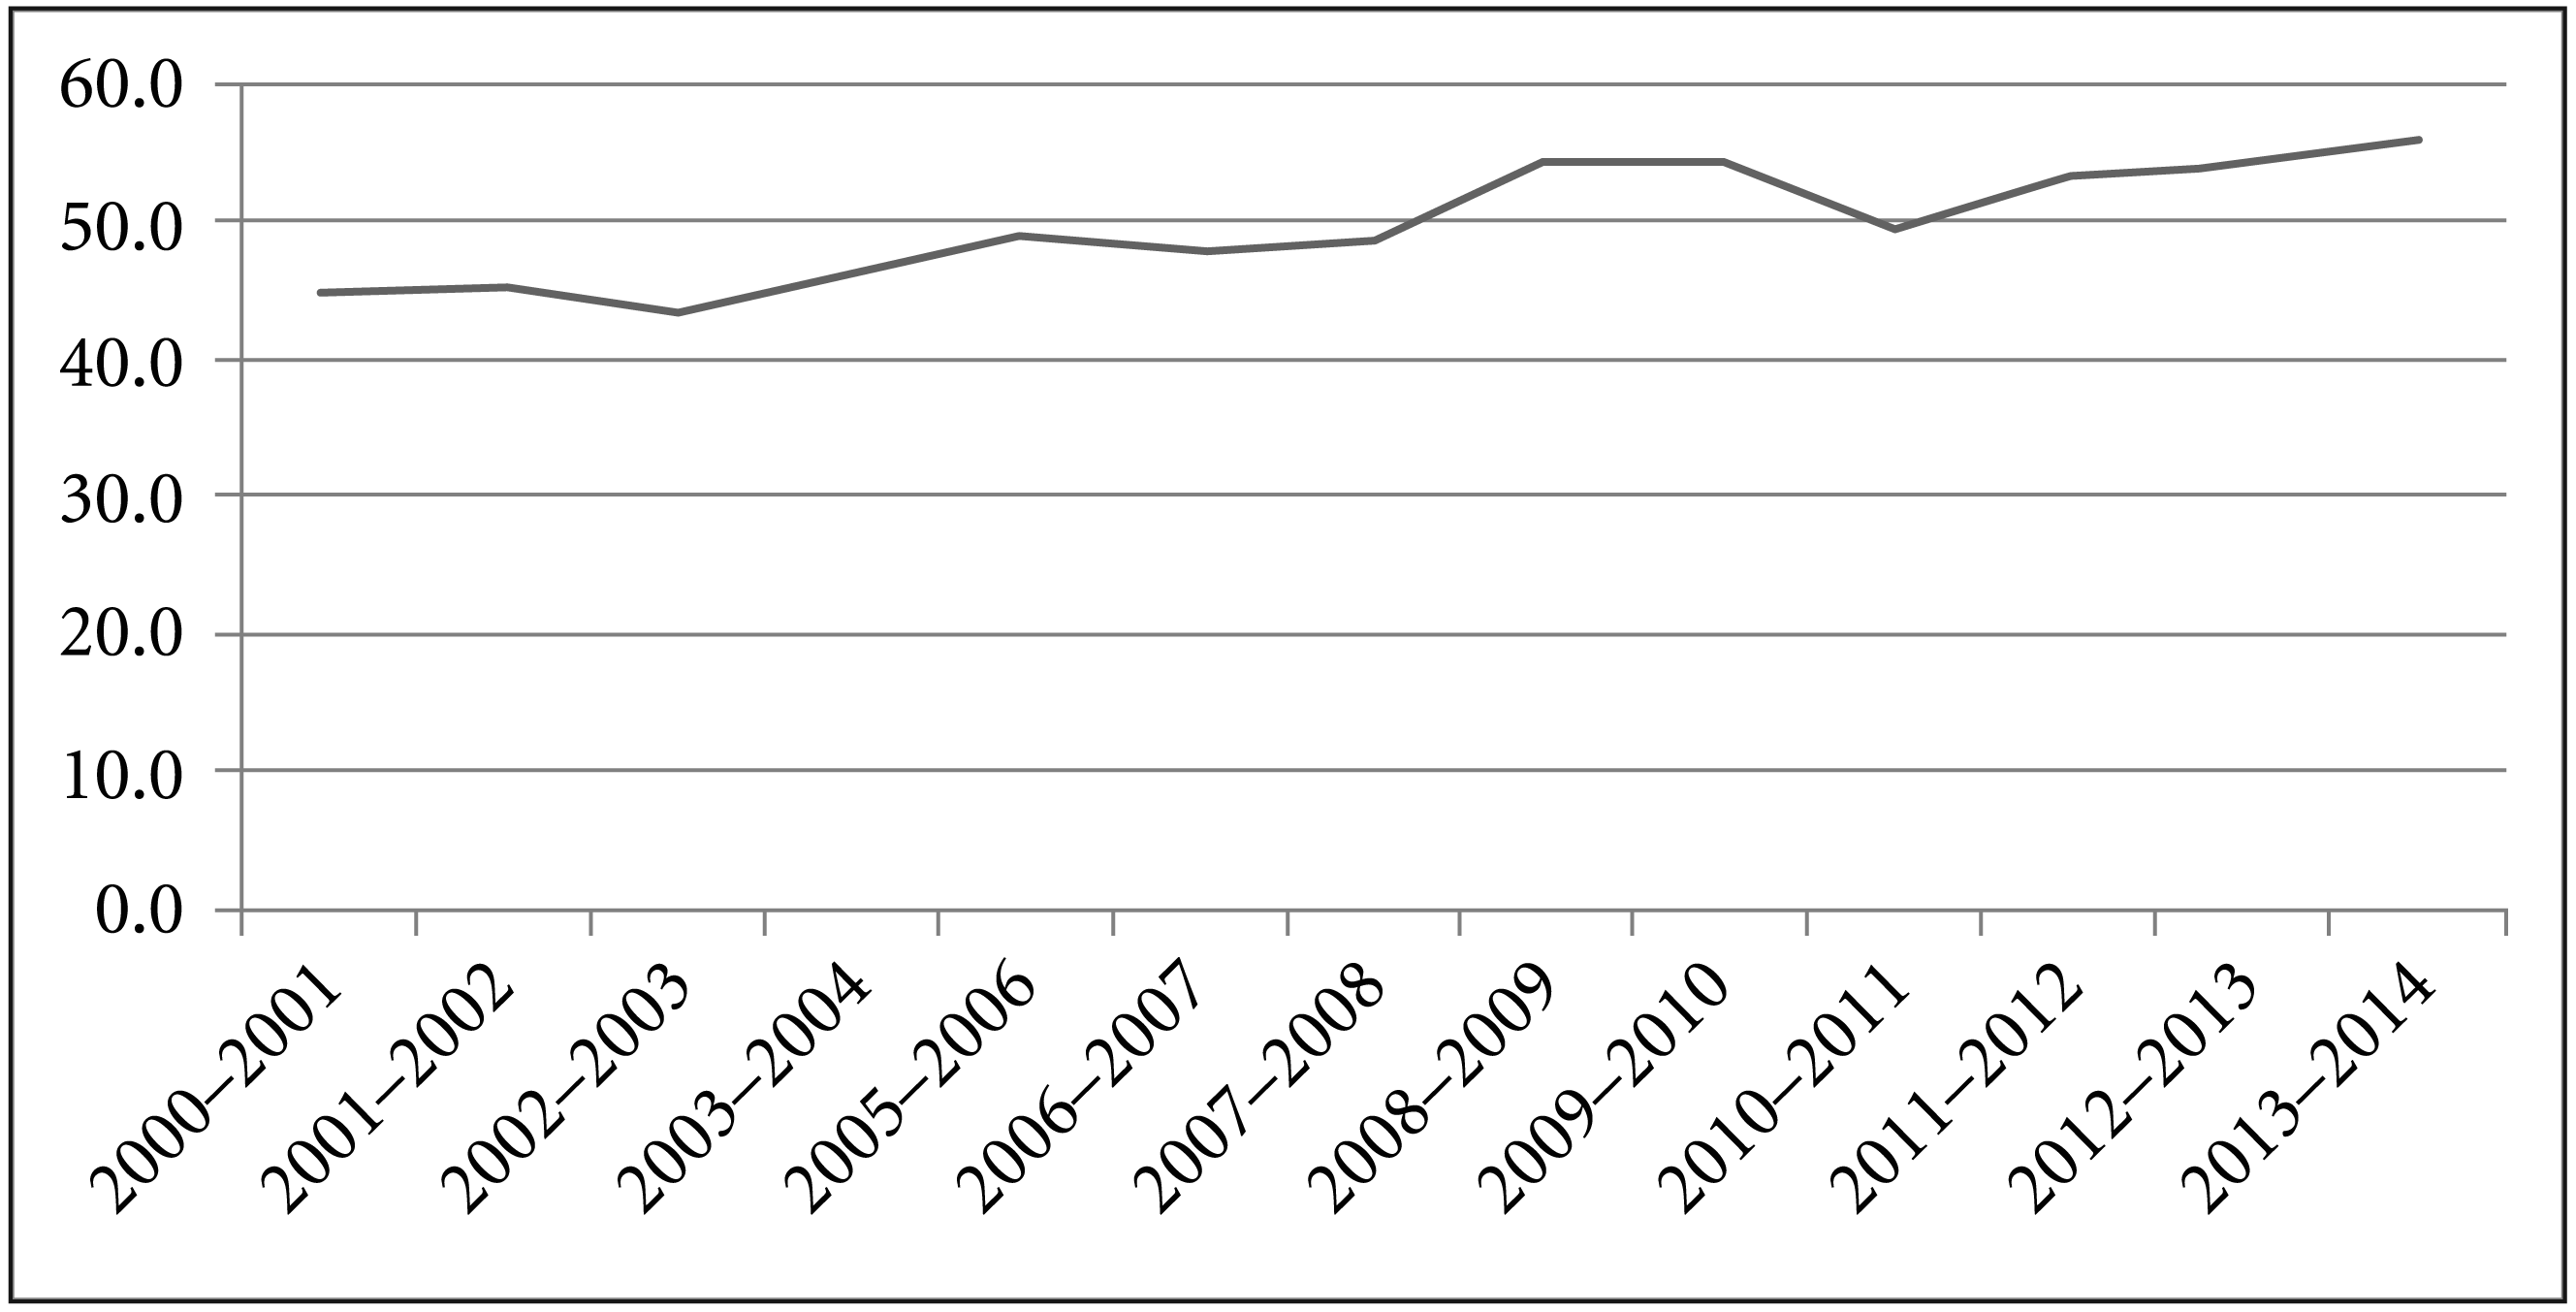
Table 1 presents estimates of employment in public and private mines in India at three time points: 2004–2005, 2009–2010 and 2011–2012. We have adopted the usual principal and subsidiary status (UPSS) approach of the NSS to identify workers in the mining industry. 2 In each of the three time periods, there is a significantly higher proportion of workers engaged in private mines. There has been a decline in the share of workers in the public mines from 23.2 per cent in 2004–2005 to 22.0 per cent in 2011–2012; concomitantly, there is an increase in the share of workers in private mines from 76.8 per cent to 78.0 per cent. Private mines thus play a role in creating employment opportunities, although the rate of employment generation is sluggish.
Public and Private Workers in Mining Industry (15–59 years), 2004–2005 to 2011–2012

Is there a wage differential between public and private mine workers in India? To answer this, we use a linear two-way fixed-effects error components model to estimate the average wage gap. Further, we used a quantile regression technique to sketch the pattern of the estimated gap over the conditional wage distribution.
Estimating a consistent effect of the type of sector (public/private) on workers’ wage is challenging, as the sector dummy is often endogenous. In order to account for endogeneity, a number of conventional strategies are adopted, such as the inclusion of fixed effects, lagged dependent variables and/or a vector of a wide range of controls. These approaches rely on strong conditional independence assumptions. In our study, we estimate the wage gap under strict exogeneity condition. For the OLS estimation, employing a two-way fixed-effects model allows the unobserved effects (αs) to be correlated with the covariates of wage. To deal with heteroscedasticity and serial autocorrelation of the error term, we cluster the standard errors at the state level.
Following the Mincerian wage equation, we specify our linear fixed-effects model as:

where Wit denotes the log real daily wage of worker i in time period t. αs and δt capture the state fixed-effects and the year fixed-effects, respectively. Pit denotes the sector of employment (public mine/private mine) of the worker i in the year t, γ captures the impact of the sector of employment on the workers’ wage. X represents the vector of explanatory variables, β is the vector of coefficients and ϵit is the random error term.
The quantile regression model developed by Koenker and Bassett (1978) used in our analysis is of the following form:

where θ denotes various quantiles (0.1, 0.25, 0.5, 0.75 and 0.9) on the conditional wage distribution (W) given the vector of worker characteristics (X).
The data for this study come from two sources: the NSSO and Indian Bureau of Mines (IBM). The NSSO regularly undertakes employment and unemployment surveys to assess the labour market in India. These surveys contain detailed information on workers’ socio-economic, demographic and household characteristics. We use unit-level data from the employment–unemployment schedules to estimate the level of employment in public and private mines. For the regression analysis, information on workers’ wages and their personal and household characteristics were extracted from these unit-level records. By pooling the workers’ data in the mining industry over three rounds of the NSS (2004–2005, 2009–2010 and 2011–2012), we constructed our final dataset. Since the NSSO does not provide information on wages of self-employed people, the resultant dataset includes only regular and casual workers and excludes those who are self-employed.
Construction of Variables
This sub-section describes the construction of the dependent variable, the main explanatory variable and the controls used in our empirical analysis. We consider the relevant controls in accordance with the extant literature (Azam & Prakash, 2015; Glinskaya & Lokshin, 2007).
Dependent Variable
The NSSO provides information on wages and salaries of workers in terms of cash and kind for the reference week. The weekly wages are converted into daily wages, and the nominal daily wages are then converted into real daily wages by applying the consumer price index numbers for industrial workers. The natural logarithm of the real daily wage of the worker is the dependent variable in our regression models.
Independent Variables
The NSSO classifies workers by type of enterprise: proprietary, partnership, government/public sector, public/private limited company, co-operative societies/ trusts/other non-profit institutions, employer’s household and others. All enterprises except the ‘government/public’ category constitute the private sector. For the type of sector, we construct a dummy variable, ‘public mine’, where workers in private mines form the base category.
We consider the standard human capital (education and experience), socio-demographic (gender and social group) and employment (occupation, status of job contract) variables as controls in our econometric specifications. We construct six categories of educational attainment from the original twelve categories of the NSS data, which are expressed in the form of dummy variables. So we have five dummies, with the ‘not-literate’ workers as the base category. Following the relevant literature (Altonji & Blank, 1999), the experience of a worker is calculated as:
It is assumed that individuals start their schooling at the age of five and enter the labour market after completing schooling. The nonlinear relationship between earnings and experience is captured by squaring the experience variable. For ease of interpretation, the square of experience is scaled down by dividing by 100.
The gender of a worker is captured by the dummy variable ‘Male’, where female workers constitute the base group. The NSS data classifies respondents under four social groups: Scheduled Tribe (ST), Scheduled Caste (SC), Other Backward Class (OBC) and Others. Workers from the STs form the base category, so three dummies have been constructed for social groups. There are two employment-related variables: occupation of the worker and status of the job contract. The occupations in the mining industry are divided into four broad categories: managers, administrators and executives; clerks, personal care and protective services; miners, shot-firers and other production workers; and mining labourers. 3 The occupation categories are represented by dummy variables, where ‘managers, administrators and executives’ form the omitted category. The dummy variable ‘job contract’ takes the value of 1 if the worker has no job contract, and the value 0 otherwise.
Descriptive Statistics
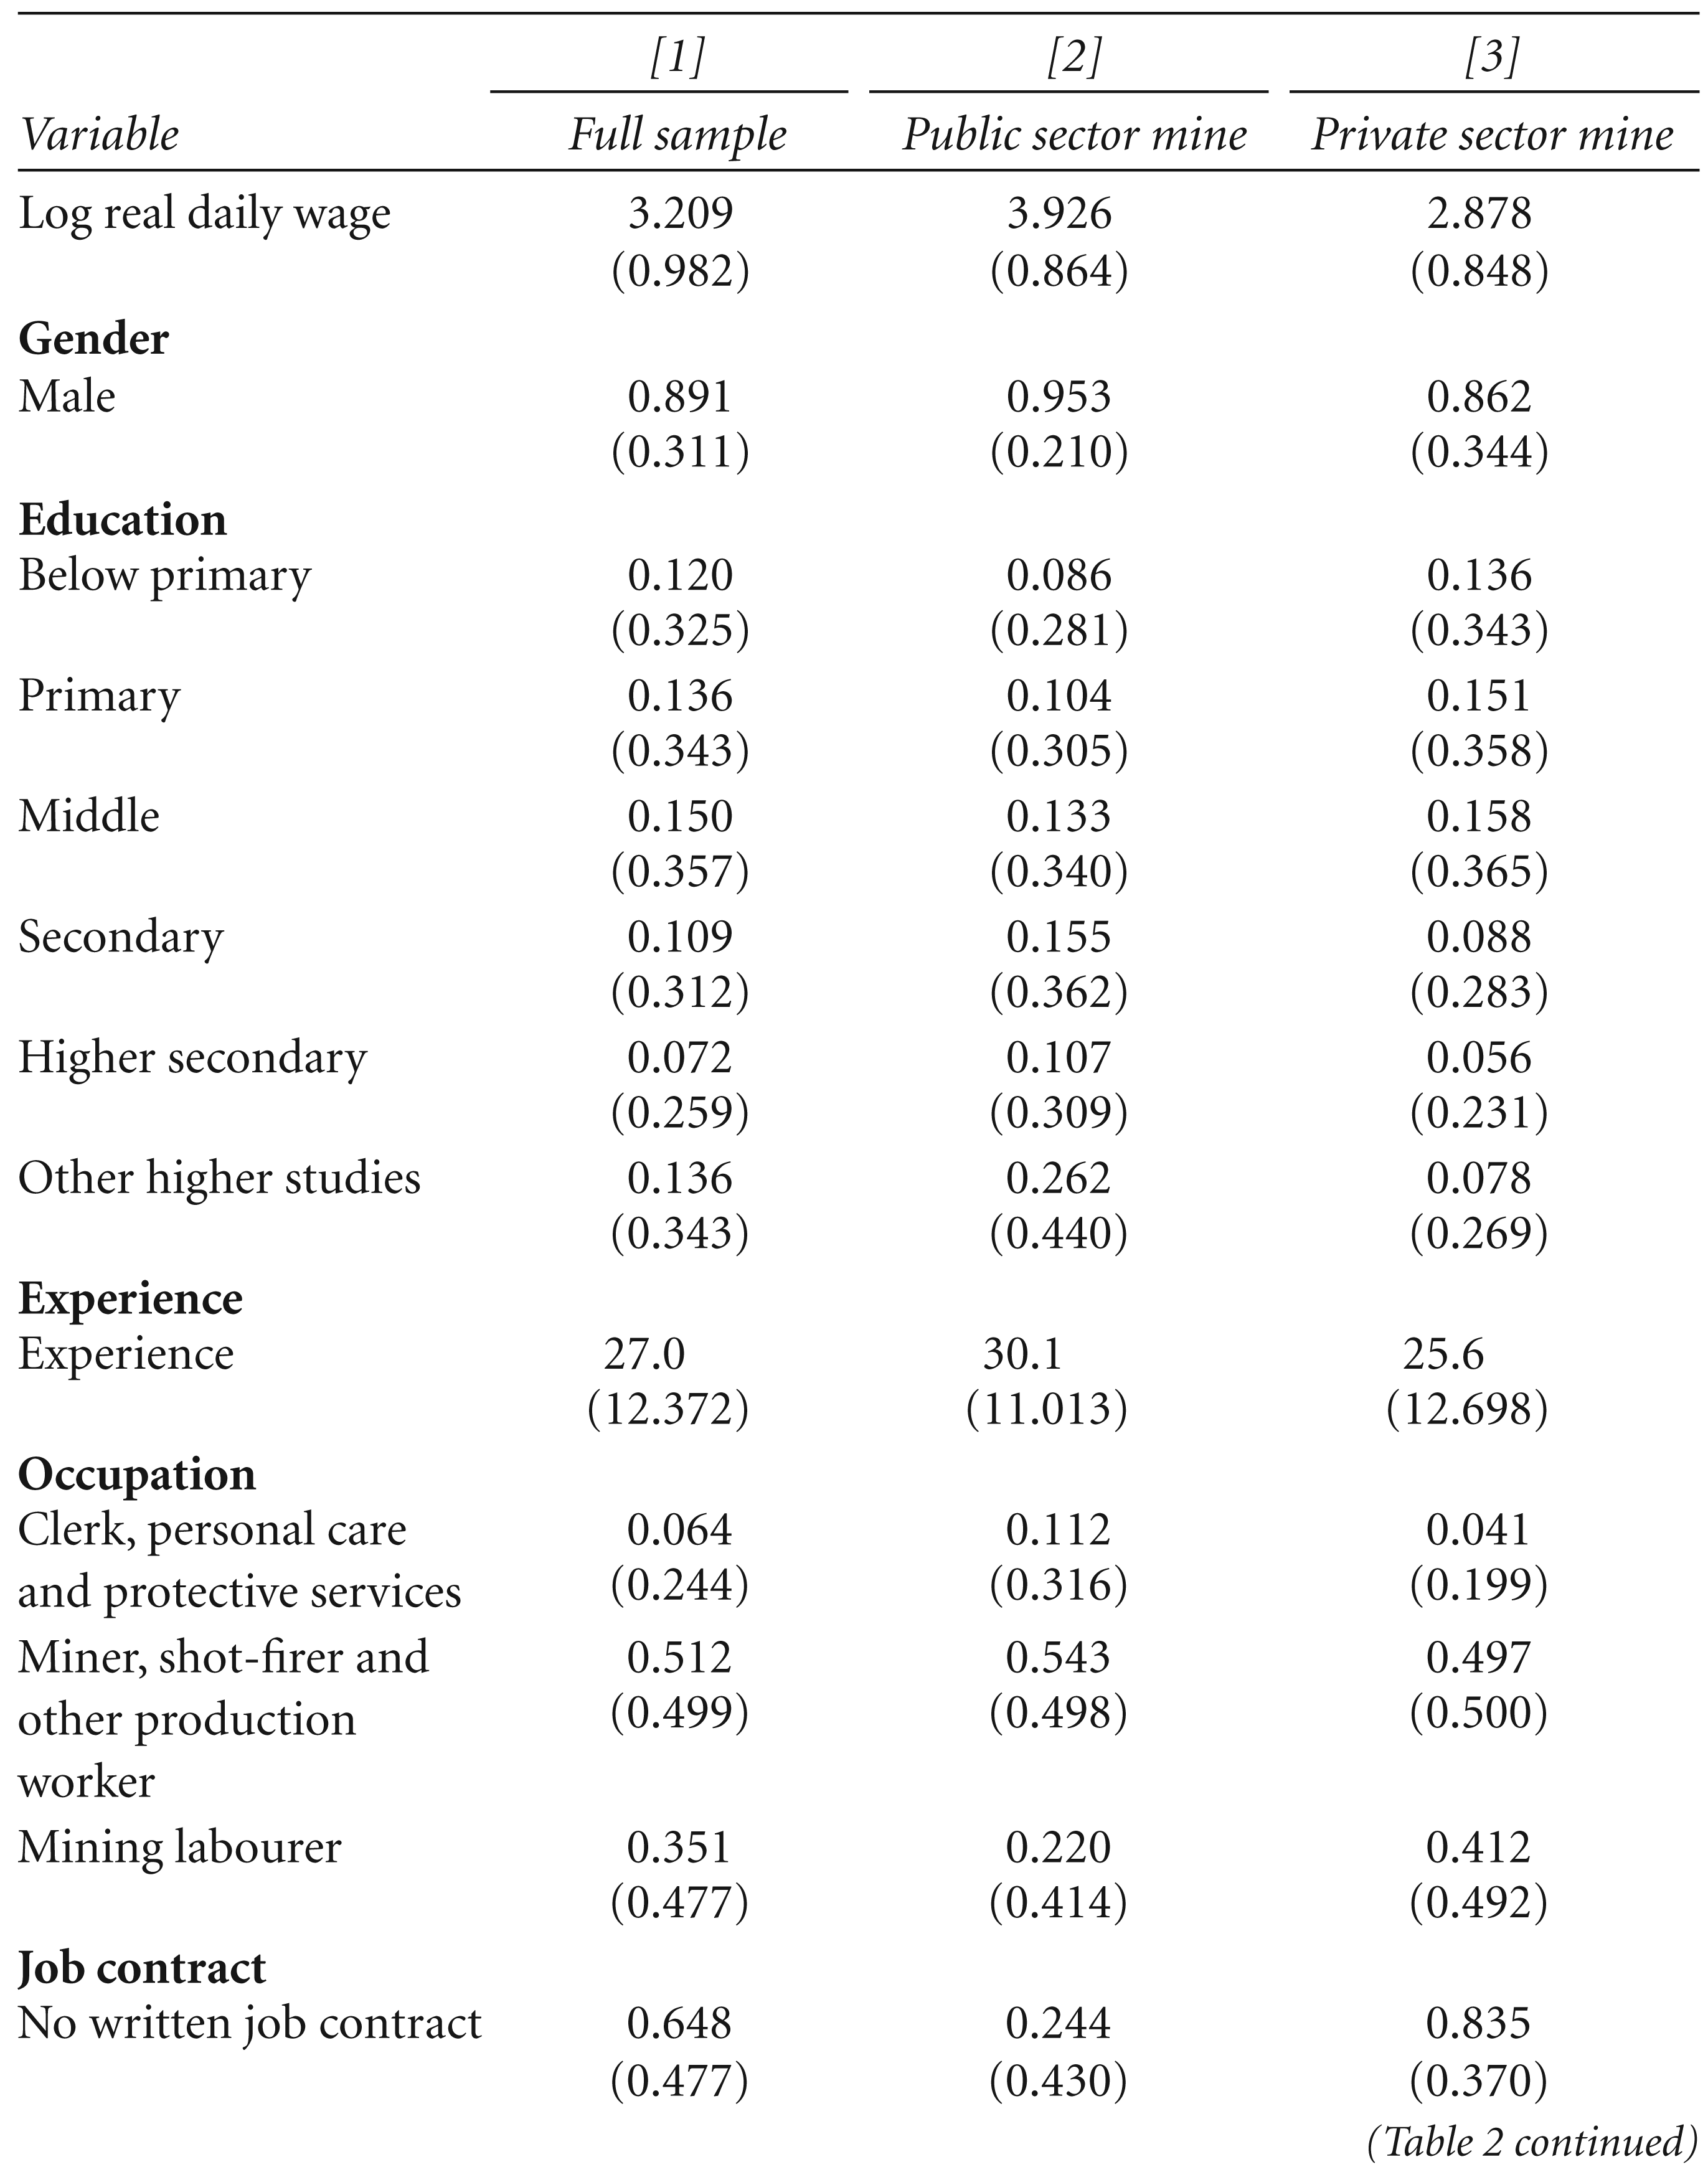
Table 2 presents the descriptive statistics for the sample of public and private mine workers. The total sample size of mining workers is 2,928—924 workers in the public mines and 2,004 in private mines. It is observed that on average workers in public mines earn higher wages than their counterparts in private mines. The gender composition of the workforce reveals that male workers are overly represented both in public and private mines. There are vast differences in the educational profiles of workers between the two types of mines. The proportion of workers with a ‘secondary/higher secondary/other specialised studies’ education is 52 per cent in public mines, while the figure is only 11 per cent in private mines. We find that workers in public mines have higher average years of work experience than their counterparts in private mines. We also observe that workers in private mines are mainly concentrated in the ‘mining labour’ occupation (41 per cent) and only 4 per cent (compared to 11 per cent in public mines) are ‘clerks, personal care and security services’. Looking at the status of their job contract, we find that 84 per cent of workers in private mines do not have any job contract, while the figure is 24 per cent in public mines. The proportion of ‘Non-ST/SC/OBC’ workers is higher in public mines than in private mines.
Descriptive Statistics

Descriptive Statistics
Figure 3 shows the wage distribution of sampled workers in public and private mines. The density functions were estimated using an Epanechnikov kernel estimator. As evident, the mode value of the log real daily wage for private mines is lower than that for public mines, and the earnings density graph of private mines lies to the left of that for public mines. These observations, prima facie, indicate that workers in private mines earn less than their public sector counterparts.

OLS Estimates
Table 3 estimates the impact of the sector of employment on workers’ wages. We run five different OLS models. Model 1 (column [1]) is the baseline regression; model 2 (column [2]) includes controls related to human capital, socio-demographic and employment characteristics; model 3 (column [3]) includes all the control variables and year dummies; model 4 (column [4]) includes all the covariates that appeared in model 2 and the state dummies; and finally, model 5 (column [5]), our preferred model, includes all the covariates that appeared in model 2, and the state and year dummies as additional controls.
Column [1] shows that the raw wage gap between public and private mine workers is 1.047 or 185 per cent (calculated as {[antilog of 1.047] – 1}), without controlling for any other explanatory factors. The estimate of the wage gap falls to 35 log points or 42 per cent once we introduce the controls based on the human capital, socio-demographic and employment characteristics (column [2]). In column [3], time dummies are entered as additional controls to check the effect of time-variant unobservables. However, this exercise does not have a significant effect on the point estimate of the interest variable. A comparatively higher value of the coefficient on the sector dummy in model 4 vis-à-vis model 2 indicates that the state-level unobservables have a significant impact on workers’ wage. In our final and preferred specification, the estimate reported in column [5] shows that, ceteris paribus, workers in public sector mines earn a mark-up of around 46 log points (58.8 per cent) compared to their counterparts in private mines.
With regard to controls, Table 3 shows that most of these are correctly signed. The large and significant coefficient value on the male dummy (34 log points or 41 per cent) in column [5] of Table 3 indicates sizeable gender wage gaps in Indian mining. The magnitudes of the coefficients on various education dummies increase with higher levels of education, projecting a strong convex education-earnings profile of workers in the mining industry. Simply put, additional education has a much stronger proportionate impact on earnings at the higher levels of education than at the lower levels.
Public–Private Wage Differential: Linear Regression


Public–Private Wage Differential: Linear Regression
Workers with more experience earn higher wages: one additional year of experience increases the real daily wage by 3 per cent. Our result also shows that experience has a diminishing effect on the earnings of workers, since the quadratic of experience takes a parabolic shape. We find that occupation has a significant impact on workers’ wage. As expected, the estimates of occupation dummies show that workers at the bottom of the occupational hierarchy are paid lower wages than those at the top. The role of a job contract in the determination of worker’s wage is important. Workers with no job contracts earn 85.7 per cent less than those who have some type of a contract. Column [5] of Table 3 reveals a strong caste-based wage differentiation in Indian mines, where workers belonging to general castes (Non-ST\SC\OBC) earn fairly higher wages (20 log points) than the historically marginalised STs, a finding consistent with Madheswaran and Attewell (2007).
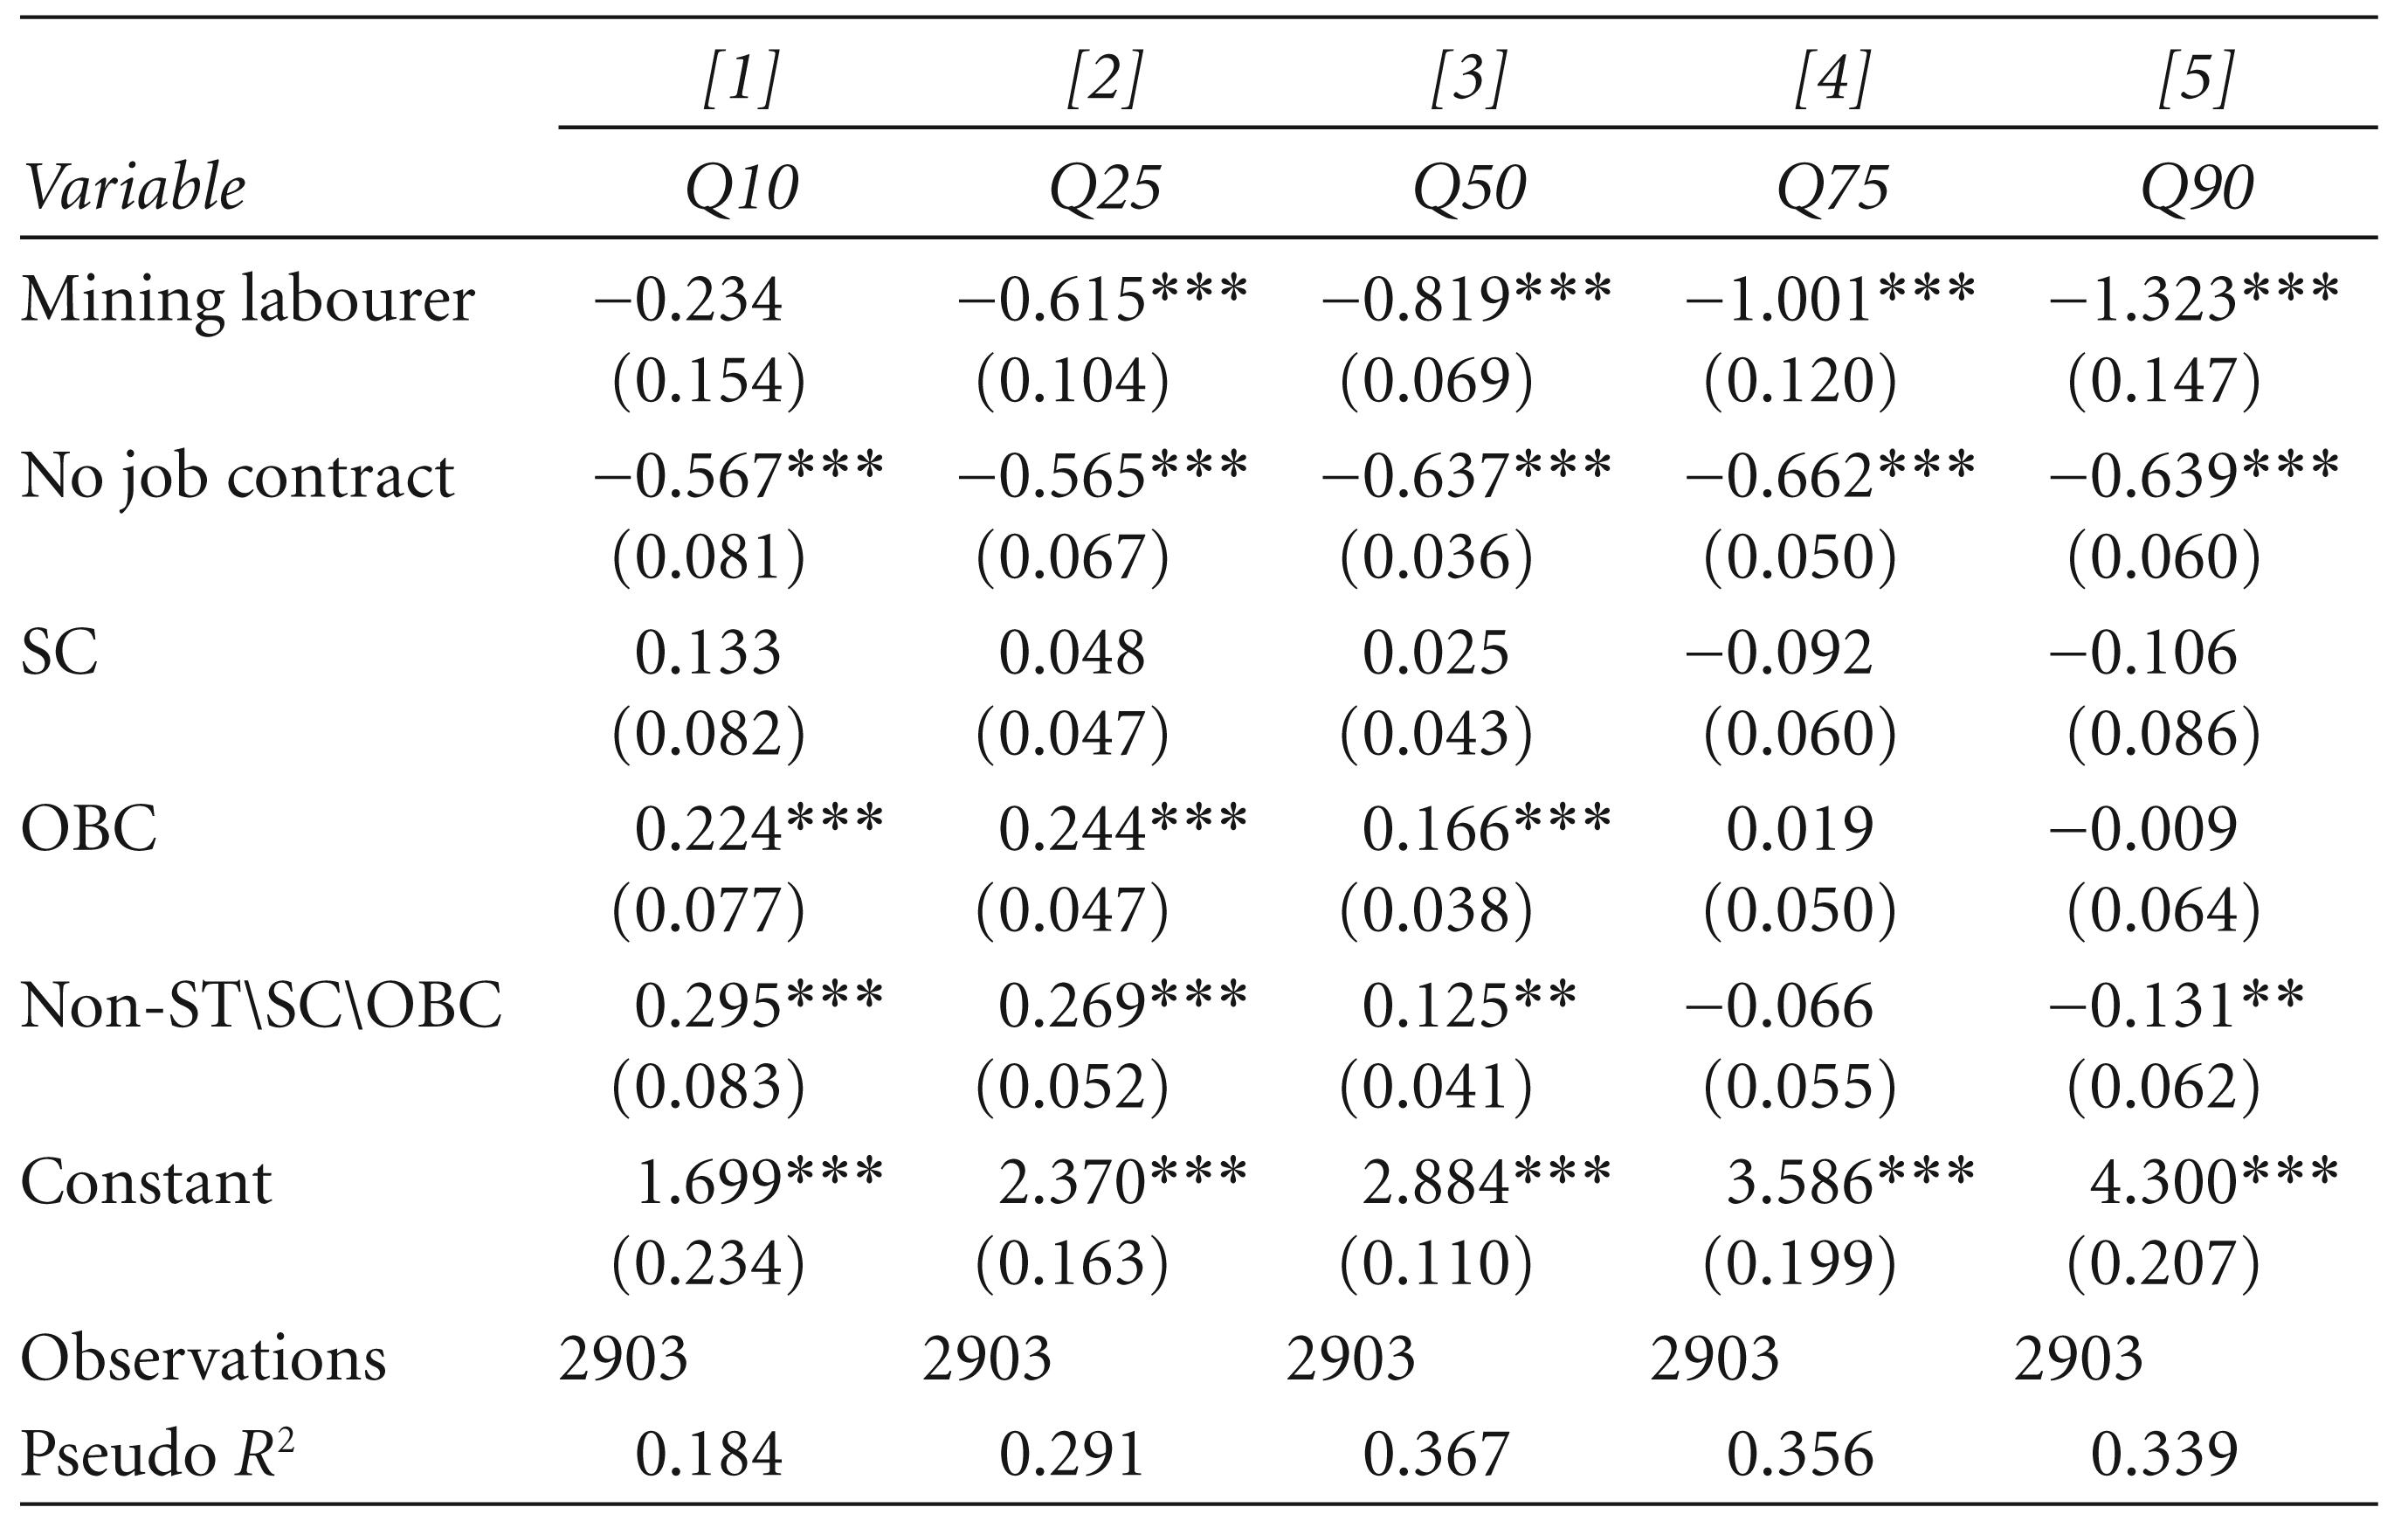
Columns [1]–[5] of Table 4 present the results obtained from the quantile regression, where we consider five different quantiles (θ = 0.1, 0.25, 0.5, 0.75 and 0.9) on the conditional wage distribution. Inspecting the first row of Table 4, we find sizeable differences in the real daily wages between public and private mine workers across the entire wage distribution. The magnitudes of the wage gaps range between 30 log points and 48 log points over different quantiles; the gap happens to be largest at θ = 0.25 (48 log points) and follows a declining trend thereafter. The public–private differential in wage at the 10 per cent quantile is 43 log points, that is, holding all other things equal, the 10 per cent quantile of wage for a public worker is 43 log points higher than the 10 per cent quantile of wage for a private mine worker.
Public–Private Wage Differential: Quantile Regression

Public–Private Wage Differential: Quantile Regression
Unlike the sticky floor and glass ceiling phenomena proposed in the literature, we notice that in mining the gender wage gap is largest at the median (37 log points) and least at the top wage quantile (20 log points). As expected, higher levels of education of workers attract higher wages in the mining industry, and the impact of education on earnings is particularly remarkable at the top quantile. Workers at the upper tail of the distribution receive higher returns on their experience than those at the lower tail. The effect of experience increases with moving up the wage distribution. For different occupation groups, the wage gaps from the base category follow a declining trend as one moves up the conditional wage distribution. We find that workers who do not have any job contract earn less than those who have a job contract throughout the earnings distribution. The results show that caste-based wage differentiation is significant at the bottom quantiles; however, the gap appears less clear at the top.
This sub-section presents the estimates of the public–private wage gap for separate sub-samples of workers based on gender (‘male’ and ‘female’), education (‘not-literate’, ‘up to middle’, ‘secondary’ and ‘post-secondary’), occupation (‘manager, etc.’, ‘clerk, etc.’, ‘miner, etc.’ and ‘mining labour’), job contract status (‘no job contract’ and ‘with job contract’) and social group (‘ST/SC’ and ‘OBC & Others’). This analysis allows us to gather a deeper understanding of the structure of the wage gap in the Indian mining industry.
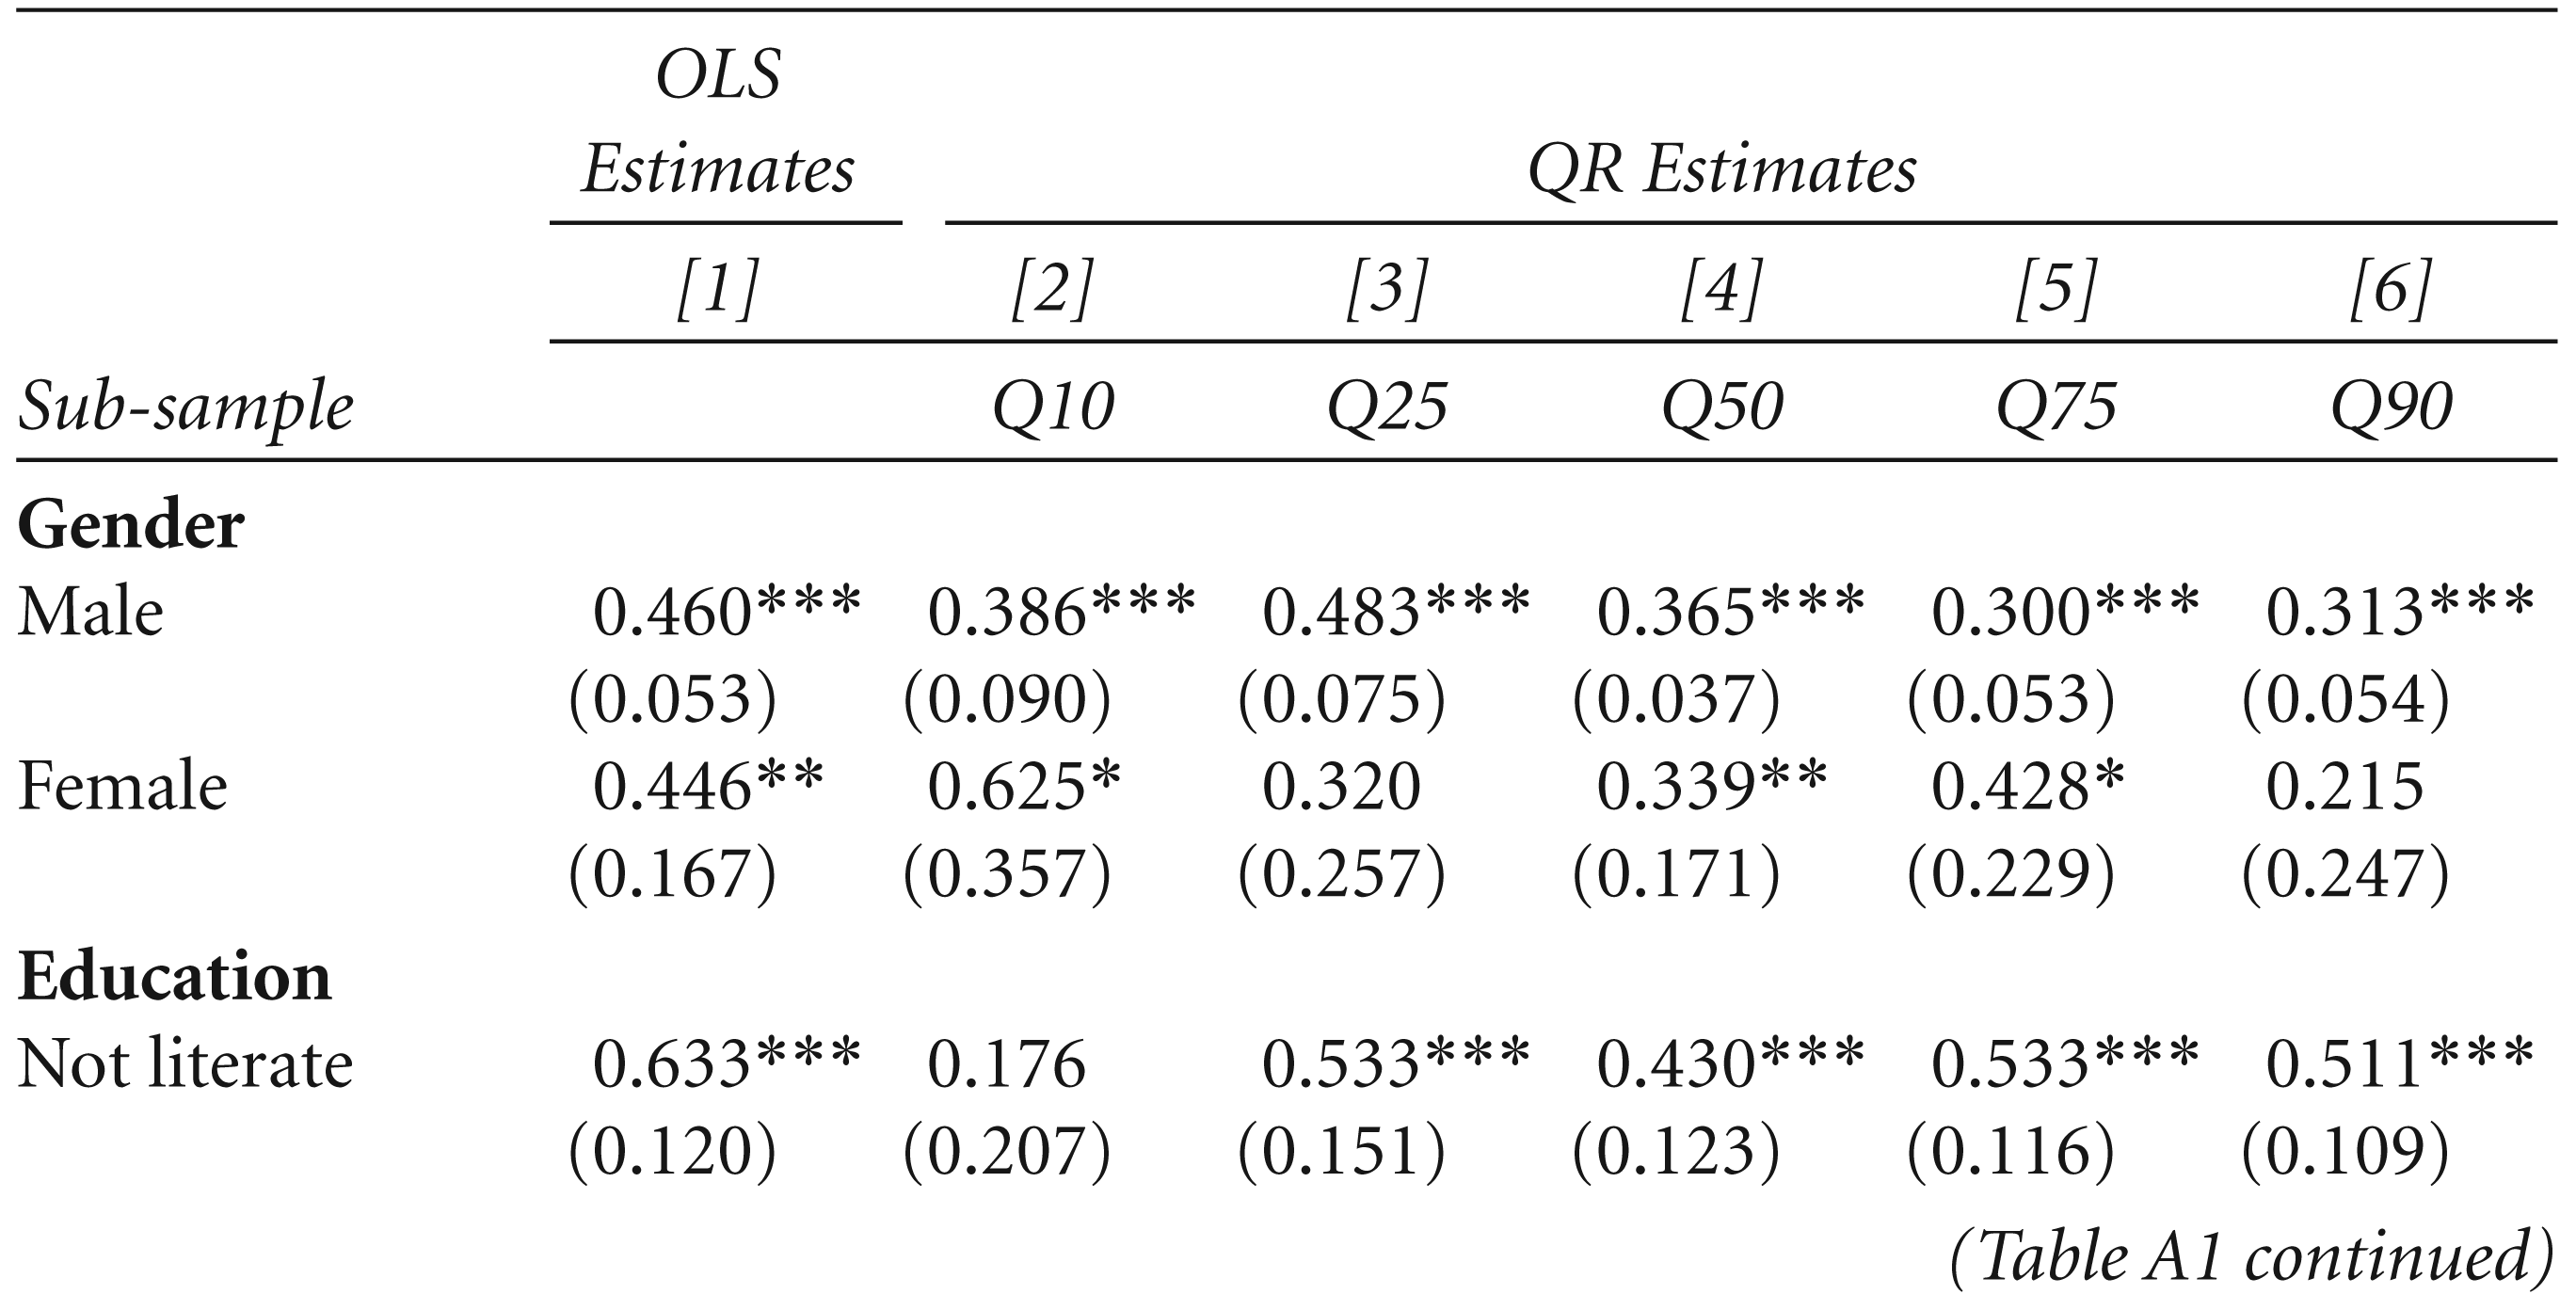
Column [1] of Table A1 contains OLS estimates, and columns [2]–[6] contain quantile regression estimates of the public–private wage gap for various sub-samples. The OLS result shows that male workers in public mines get 46 log points or 58.4 per cent higher wages than male workers in private mines. Likewise, female workers in public mines earn 44 log points or 56.2 per cent higher wages than female workers in private mines. These figures are close in magnitude to the average estimate of the public–private wage gap obtained from the full sample (recall column [5] of Table 3). Many important observations unfold once we examine the wage gap for different education sub-samples. The gap happens to be largest among the ‘not-literate’ mining workers (63 log points or 88.3 per cent), and least among workers with ‘post-secondary’ education (30 log points or 36 per cent). Among the occupation sub-samples, the wage gap is highest in the category of ‘mining labour’ (49 log points or 64.2 per cent). Also, we find that there are significant and substantial wage gaps in various sub-samples of ‘job contract status’ and ‘social group’.
The QR estimates for various sub-samples reveal two findings. First, there is a substantial wage gap between public and private mine workers at different points on the conditional wage distribution for all sub-samples. Second, the wage gap declines from lower to higher quantiles for most of the sub-samples. In sum, the sub-sample-wise results corroborate the findings from the full sample, that there exists a significant public–private wage gap in the Indian mining industry.
Why is the wage gap between public and private mine workers higher at the bottom wage quantile than at the top? Why does it tend to fall as we move up the wage distribution? In the following paragraphs, we discuss some plausible channels which may substantiate these two observations.
First, public mines are considered as fair employers, willing to generate greater welfare in society by paying higher wages to their low-skilled workers, that is, workers who are at the lower wage quantiles. As argued by Melly (2005), governments are under pressure to retain their roles as model employers; therefore, they do not pay low wages to their less skilled workers. In contrast, private mines—mainly guided by the motive of profit maximisation—fix wages according to the marginal productivities of workers. Second, the presence of trade unions is more pronounced in public sector mines than in private mines. The literature suggests that trade unions generally lobby for higher wages for workers who are engaged in low-end jobs (Freeman, 1984; Lee, 1978). Additionally, the spillover effect of trade unions on workers’ wage is significant, particularly for workers with a lower economic status. Put simply, the presence of a trade union raises awareness by reducing the asymmetry of information among workers, which empowers them in exercising their rights. This acts as a tool in minimising employers’ discrimination. Third, the Minimum Wages Act and other labour welfare laws, imposing legal thresholds on worker’s pecuniary and non-pecuniary returns, are likely to be better implemented and monitored in public sector mines compared to private sector mines. Therefore, we expect higher wages among public mine workers compared to their private sector counterparts at the bottom wage quantile.
The wages of public and private mine workers tend to converge at the higher quantiles. The degree of asymmetry of information about the labour market situation could play a part for the lower wage gap at the higher quantiles. Workers at the upper-wage quantiles, whether employed in public mines or private ones, could be well-informed about the prevailing market situation. This makes the wage fixation of workers in higher-end jobs more competitive in the industry, thus reducing the public–private wage gap for this group of workers.
Conclusion
In this article, we have addressed the question of whether there is a wage gap between public and private mine workers. Using the NSS data from 2004–2005, 2009–2010 and 2011–2012, we present estimates of public–private wage gap from both the mean and quantile regressions. Our empirical results suggest that on average workers in public sector mines earn around 59 per cent (46 log points) more than their private sector counterparts. The quantile regression estimates positive wage gaps between the two types of mining workers across the entire conditional wage distribution, and the gaps range between 30 log points and 48 log points over different quantiles. Furthermore, the magnitudes of the wage gaps at the lower quantiles are larger than at the higher quantiles, a finding that is corroborated by the sub-sample-wise estimates of the public–private sector wage gap.
A recent study shows that private undertakings in the Indian mining industry have an edge over the public sector in total factor productivity or efficiency (Das, 2012). Efficiency and innovation, the two possible positive externalities of privatisation of the mining industry, are the key drivers of economic growth and development. Another research study finds that the private sector has played a prominent role in boosting mineral output and export in India (Adduci, 2017). These indicate that the role of privatisation of the mining industry in the context of economic growth and development cannot be discounted.
In the present situation, which is marked by a surge of private agencies in the Indian mining industry, this article raises a key policy issue, that is, unequal wages between public and private mine workers. According to our findings, we posit that there might be some scope for better implementation of the existing national labour laws, such as the Payment of Wages Act, Minimum Wages Act, Equal Remuneration Act, Industrial Disputes Act, Contract Labour (Regulation and Abolition) Act and so on. These laws are directly or indirectly related to the remuneration of the mining workers. Workers in the private mines need to be made aware of their rights, and mine management should ensure that workers can effectively exercise these. The labour sub-contracting arrangements in private mines should be regularly evaluated for compliance with national rules and laws in order to minimise exploitation. In sum, the onus is on the government to create conditions where the efficiency and innovation achieved from private players in the mining industry can be ensured along with wage parity between public and private mine workers.
Declaration of Conflicting Interests
The authors declared no potential conflicts of interest with respect to the research, authorship and/or publication of this article.
Funding
The authors received no financial support for the research, authorship and/or publication of this article.
Footnotes
Acknowledgements
We acknowledge valuable suggestions from Atul Sood and Keshab Das on the initial draft of the article and would like to thank the anonymous referee for the useful comments. Errors, if any, are ours.
Appendix
Public–Private Wage Differential: Sub-sample-wise Estimates

| Sub-sample | OLS Estimates |
QR Estimates |
||||
| [1] |
[2] |
[3] |
[4] |
[5] |
[6] |
|
| Q10 | Q25 | Q50 | Q75 | Q90 | ||
|
|
||||||
| Male | 0.460*** | 0.386*** | 0.483*** | 0.365*** | 0.300*** | 0.313*** |
| (0.053) | (0.090) | (0.075) | (0.037) | (0.053) | (0.054) | |
| Female | 0.446** | 0.625* | 0.320 | 0.339** | 0.428* | 0.215 |
| (0.167) | (0.357) | (0.257) | (0.171) | (0.229) | (0.247) | |
|
|
||||||
| Not literate | 0.633*** | 0.176 | 0.533*** | 0.430*** | 0.533*** | 0.511*** |
| (0.120) | (0.207) | (0.151) | (0.123) | (0.116) | (0.109) | |
| Up to middle | 0.526*** | 0.444*** | 0.478*** | 0.366*** | 0.312*** | 0.223** |
| (0.084) | (0.079) | (0.083) | (0.069) | (0.067) | (0.088) | |
| Secondary | 0.400*** | 0.479*** | 0.574*** | 0.456*** | 0.346** | 0.166 |
| (0.088) | (0.194) | (0.128) | (0.100) | (0.133) | (0.175) | |
| Post-secondary | 0.308*** | 0.267** | 0.415*** | 0.197*** | 0.214** | 0.296*** |
| (0.095) | (0.139) | (0.095) | (0.072) | (0.097) | (0.099) | |
|
|
||||||
| Manager, etc. | 0.261* | 0.455 | 0.431** | 0.169 | 0.293 | 0.428* |
| (0.138) | (1.229) | (0.155) | (0.156) | (0.245) | (0.223) | |
| Clerk, etc. | 0.293** | 0.272 | 0.394*** | 0.316*** | 0.378** | -0.020 |
| (0.114) | (0.276) | (0.168) | (0.141) | (0.170) | (0.180) | |
| Miner, etc. | 0.470*** | 0.540*** | 0.484*** | 0.376*** | 0.306*** | 0.310*** |
| (0.080) | (0.114) | (0.087) | (0.048) | (0.054) | (0.087) | |
| Mining labour | 0.496*** | 0.219** | 0.313*** | 0.325*** | 0.299** | 0.360* |
| (0.053) | (0.078) | (0.132) | (0.085) | (0.143) | (0.195) | |
|
|
||||||
| No job contract | 0.676*** | 0.200* | 0.501*** | 0.478*** | 0.374*** | 0.324** |
| (0.100) | (0.102) | (0.106) | (0.069) | (0.073) | (0.129) | |
| With job contract | 0.220** | 0.438*** | 0.357*** | 0.281*** | 0.138* | 0.210*** |
| (0.086) | (0.101) | (0.065) | (0.059) | (0.067) | (0.070) | |
|
|
||||||
| ST/SC | 0.543*** | 0.399*** | 0.563*** | 0.442*** | 0.327*** | 0.374*** |
| (0.068) | (0.133) | (0.087) | (0.100) | (0.085) | (0.101) | |
| OBC and others | 0.437*** | 0.408*** | 0.388*** | 0.345*** | 0.272*** | 0.235*** |
| (0.068) | (4.314) | (0.069) | (0.053) | (0.060) | (0.068) | |