



Abstract
The article presents a new empirical application of the idea of threshold burden of tax incentives in India. The Indian government provided tax exemption to manufacturing units with sales turnover below a specified level over the years. The turnover threshold limit was US$1 million in 2009. Whether size-based tax rules incentivise firms to reorganise their production structure in order to stay below the threshold to take advantage of fiscal incentives is the key question addressed in this article. A significant factor that is widely believed to encourage small firms to stay small has been the tax incentives in the form of excise tax (turnover tax) exemptions below a specified value of sales each year. A key strategy followed by Indian firms to stay small and below the threshold has been product subcontracting or capacity subcontracting. We provide econometric evidence on this particular mechanism. The study is based on a unique unbalanced panel data of 29,213 manufacturing plants spanning the period 1999–2008 and a panel of 4,613 manufacturing firms covering the period 1990–2010. Average subcontracting intensity was found to be significantly higher in manufacturing establishments and firms with sales turnover below the ceiling level set by the tax rules. Econometric tests supported the hypothesis that establishments take advantage of tax incentives by staying below the threshold value of output. Econometric tests for a subgroup of domestic-market-oriented firms provide additional support to the hypothesis of threshold effects. These findings are relevant for policy design in developing and emerging economies.
Introduction and Policy Motivation
This article contributes to the emerging literature on the real effects of tax structure and size-dependent tax incentives in developing countries. Industrial and trade policy rules in developing countries provide numerous examples of size-dependent policies. How do firms respond to size-based tax incentives and regulations? This question has attracted much policy-oriented discussion both in developed and developing countries. The key reason is that size-dependent policies could be the source of distortions and tax evasion (misreporting) and have real production effects. Several very recent papers have studied the impact of size-dependent policies. Harju et al. (2019) have showed how small firms in Finland have responded to value added tax (VAT) thresholds by bunching below the sales threshold. In other words, firms responded to tax discontinuities by scaling down output. Boonzaaier et al. (2019) study corporate income tax of small businesses in South Africa and find sizeable bunching of firms at the corporate income thresholds. They suggest that a sizeable part of the response is driven by reporting responses (underreporting of sales and legal tax planning) rather than real economic behaviour. De Paula and Scheinkman (2018) in their study of small firms in Brazil have found that the VAT system introduced for small firms (with tax exemptions for firms below the specified sales revenue) resulted in informality chains. This is an outcome of an incentive for informal (formal) firms to deal with other informal (formal) firms because input tax credit under VAT requires the suppliers to produce tax-paid receipts. Similarly, Gadenne et al. (2019) show that size-based exemptions under VAT distort supply chains, whereby exempt firms are more likely to transact with similarly exempt firms.
In contrast to the above set of studies the present study asks whether size-based tax rules incentivise firms to reorganise their production structure by engaging in greater product subcontracting. A significant factor that is widely believed to encourage small firms to stay small has been tax incentives in the form of excise tax (turnover tax) exemptions below a specified value of sales in each year. The system of tax exemption has been continued even under the VAT system introduced in India in 2000.
This study asks the following question. How do small firms stay below the legal threshold output specified in the tax law? Are there any unintended effects of size-dependent incentives? Empirical studies based on developing country data supporting such conjectures are sparse. The present article attempts to fill this gap in the empirical literature by studying the output-subcontracting behaviour of manufacturing firms in response to excise tax changes. It makes a contribution to the literature by showing how manufacturing firms could indirectly manipulate the threshold output levels to take advantage of tax concessions. Its focus is on the unintended effects of size-dependent tax incentives on the production behaviour of firms in terms of horizontal product subcontracting (called capacity subcontracting in India). The article presents, perhaps for the first time, empirical evidence for the idea of the threshold burden of tax incentives in developing countries like India.
Studies of industrial firms in India have long maintained that disincentives for scale expansion of factories have been high given the size-dependent nature of many industrial regulations and fiscal incentives (Little et al., 1987). Small firms are often used as buffers by large firms in many industries particularly in those with fluctuating and uncertain demand. At the same time, tax incentives, it is often persuasively argued, encourage firms to stay relatively small and avoid vertical expansion. The Overview of Small and Medium Enterprises states:
Under the General Excise Exemption Scheme, full excise exemption up to turnover of $375 thousand per annum (INR.15 million) is provided to enterprises having annual turnover of up to $1 million (INR.40 million). However, the limits of excise exemptions have encouraged a tendency among MSEs is to go in for horizontal expansion (i.e., fragmentation) rather than vertical expansion and upward graduation into medium and large enterprises …. (DCMSME, 2009)
1
Empirical studies suggest that firms’ product subcontracting activities have increased substantially in recent years. For example, Moreno-Monroy et al. (2014) estimated that in the Indian formal sector, subcontracting intensity, measured as the ratio of subcontracted output to total manufacturing output, has gone up sharply from an average of around 8 per cent in the first half of the 1990s to 15 per cent in the years after 1995. A significant factor that is widely believed to encourage small firms to stay small has been the tax incentives in the form of excise tax (turnover tax) exemptions below a specified value of sales. 2
The econometric analysis is based on two different unbalanced panel data sets. The first, a panel of manufacturing plants, collected by the Annual Survey of Industries (ASI), is a nationally representative sample of factories in the formal sector that covers the period between 1998–1999 and 2007–2008 (hereafter 1999–2008). 3 We have in our panel a total of 29,213 manufacturing plants. Two limitations of the ASI panel are the following: (a) it does not gather the data on the value of exports or imports of the sample plants and (b) it does not cover factories not registered under the Factories Act (in the so-called informal or uncovered sector). The second panel data set uses the Prowess database, which provides company-level data based on the annual balance sheet and income statements of companies. We have in our panel 4,613 manufacturing firms. The Prowess data covers both publicly listed and unlisted manufacturing firms covering the 20-year period 1989–1990 to 2009–2010 (hereafter 1990–2010); it accounts for more than 70 per cent of industrial output, 75 per cent of corporate taxes and 95 per cent of excise duties collected (Alfaro & Chari, 2014). An important advantage of Prowess data is that it reports the international trade activity of all the firms, but it does not cover small companies that do not publish their financial statements. In short, the analysis is based on two complementary data sets with different limitations.
Evolution of Excise Tax Incentives
In order to encourage the growth of small-scale enterprises the Indian tax system exempted them from paying excise tax on the value of their production subject to certain conditions. This was introduced as far back as 1978 (Bagchi et al., 2006). 4 Central excise duty is levied by the central government on goods manufactured and marketed in India, 5 at the time the goods are removed from the factory. The turnover tax exemption is an implicit tax subsidy to small-scale firms that varies with the level of the excise tax rate. 6 The tax regime later introduced a VAT in phases, culminating in the year 2000 with the introduction of CENVAT (central value added tax), covering a large number of commodities including manufactured goods. The CENVAT continued the policy of subsidising small-scale units, by permitting 100 per cent exemption excise tax up to a specified sales value. 7 A small-scale unit, once it crosses the threshold sales value, can claim credit for taxes they have paid on their inputs under the CENVAT system, as normal duty rates are applied above the ceiling limit. 8 However, the unit has to bear the additional compliance costs in the form of registration with the authorities, maintaining production and input purchase records, quarterly filed CENVAT returns and monthly payment of duties and handle any disputes with the inspectors or audit teams. They are also liable for additional costs if there is a delay in tax refunds on the inputs they have purchased. In brief, the excise tax exemption has been an important incentive to small-scale factories even after the introduction of CENVAT.
Three discrete shifts in the exemption rates merit mention here:
Between 1989–1990 and 1994–1995, the 100 per cent exemption limit was set at ₹5 million and the corresponding turnover ceiling was set at ₹20 million. The 100 per cent exemption limit was raised to ₹10 million in 1999–2000 provided the sales turnover was below ₹30 million.
9
The 100 per cent exemption limit was further raised to ₹15 million and the turnover ceiling remained fixed at ₹40 million in 2006–2007. This was a substantial one-time hike of 50 per cent in the tax-exemption limit, and potentially affected more than 25 per cent of the formal sector factories. This rule continues to prevail. We may note that tax- exempt units with a sales turnover below ₹15 million do not need to register with the tax authorities and that factories claiming tax benefits need to file a declaration with the authorities stating that their sales have not crossed the exemption ceiling of ₹40 million. Firms with sales turnover above the exemption limit pay a basic excise duty at the normal rates applicable in the corresponding years. For example, in 2004–2005 the basic excise duty was 16 per cent.
Following this introduction, this article is organised as follows. Section 2 contains a short review of related literature. Section 3 presents the conceptual background and empirical strategy followed in the article. It includes a description of panel data sources and their features. Section 4 discusses the econometric estimation results and checks for robustness by introducing the domestic orientation of firms. Concluding observations are presented in Section 5.
Review of Related Literature
This article is related to two strands of literature. First, it is directly related to studies on efficiency effects and enforcement mechanisms of the VAT systems in developing countries. The VAT system is found by De Paula and Scheinkman (2010) to result in informality chains, because formalised firms tend to trade with other formalised firms, since only the formalised input suppliers can provide receipts that allow them to deduct the input costs from VAT payments. Other studies have emphasised the importance of a paper trail, double-reporting and third-party information for value-added tax enforcement. Pomeranz (2015) has examined the self-enforcing properties in the VAT through two randomised field experiments with over 445,000 firms in Chile. The study found that transactions with a paper trail had a weaker response to the threat of a probable tax audit, thus confirming the importance of building a paper trail into the VAT system. However, the same study observed that differential enforcement through the paper trail at different production stages could lead to distortions in the market. In a situation of a flat VAT rate, it observed that if small firms can evade more, it may lead firms to stay inefficiently small to reduce their effective tax burden.
The second strand of literature studies the misallocation of resources across firms due to policy-induced distortions with aggregate productivity effects. The misallocation of resources could result from restrictions on the entry and exit of firms as well as from policy rules that discourage scale expansion. Hsieh and Klenow (2009) using plant-level data show that total factor productivity (TFP) increases with size more in India and China than in the United States. Alfaro and Chari (2014) study the impact of entry deregulation on misallocation and firm size distribution in India. The argument of the ‘missing middle’ in firm size distribution as a source of misallocation in India, Indonesia and Mexico is studied in detail by Hsieh and Olken (2014). Often the misallocation of resources is due to the size-dependent nature of governmental policies that drive a wedge between firms of different sizes. For example, in Mexico, firms with sales below two million pesos paid a flat tax of about 2 per cent of their sales and were exempt from payroll taxes, income taxes and value-added taxes. Firms above the 2-million-peso threshold were subject to a 15 per cent VAT, a 38 per cent income tax and a 35 per cent payroll tax. In Indonesia firms with annual revenue below 600 million Indonesian rupiah were exempt from paying the 10 per cent VAT. However, Hsieh and Olken (2014) did not find substantial bunching of firms below these thresholds in these two countries. In contrast, Onji (2009) examined the impact of the introduction of a VAT threshold in Japan in 1989. He found threshold effects in terms of the splitting of corporate firms to take advantage of the simplified VAT scheme and to save taxes. The threshold sales value of 500 million yen induced the creation of new small firms through the process of splitting the businesses of large corporations.
Another study of direct relevance is Chatterjee (2011), which reports the bunching of factories at the threshold of ₹10 million (using ASI data on formal sector factories for the financial year 2004–2005). In that year the excise tax exemption rule permitted 100 per cent exemption for all firms whose output was below ₹10 million. The present study is also related to studies on size-dependent labour regulations. Labour regulations impose compliance costs once firms reach a specified employment size and can act as a disincentive for the natural growth of firms. Firms are often observed to use contract workers (secondary workers and labour outsourcing) to stay below the legal threshold size and avoid being subject to labour regulations (Ramaswamy, 2015).
Conceptual Background and Empirical Strategy
The framework of this article draws on the concept of a threshold burden and idea of a tax kink-induced bunching in the corporate tax literature. Whether size-based tax incentives induce subcontracting and carry the risk of disincentives for scale expansion of manufacturing firms in developing countries like India is the critical question. There have been two forms of entry barriers for large firms in India: first, the exclusive reservation of selected products for small firms that excludes the entry of large firms by definition; second, plant capacities for several industrial products were restricted by capacity licensing. These two policies encourage large-scale firms to subcontract production to small-scale producers in the same lines of activity. In response to industrial capacity licensing and investment incentives (subsidies) small-scale firms even entered into production that is widely known to have economies of scale, such as consumer durables and capital goods. 10 Industrial policies have been held responsible for the lack of incentive for size expansion beyond the official definition of a small-scale factory. 11
More significantly, fiscal incentives like excise tax exemption up to a certain sales turnover, which have existed in one form or another (Bagchi et al., 2006), have also encouraged the fragmentation of production capacities, and create incentives for firms to stay small and outsource extra output and encourage horizontal growth instead of vertical expansion. This outcome is due to the threshold burden clearly articulated by Brian Levy (Levy, 1993). To quote
Threshold burden is the discontinuity in the structure of costs that results when some fiscal burden is imposed only on firms above a minimum size. This discontinuity can lead some to rein in expansion—or to expand inefficiently by creating quasi-independent enterprises, each smaller than the threshold at which the tax and regulatory requirements are imposed. (Levy, 1993, pp. 74–75)
More recent literature has referred to the phenomenon of regulatory effects defined with reference to a few finite levels of firm size (based on employment, output or sales), as ‘threshold effects’ (Gourio & Roys, 2014). The analytical idea is that if the policy rule changes discontinuously at the pre-specified firm size then it should result in a discontinuous change in the behavioural choices of the firm. The observable change will be directly proportional to the costs of potential compliance with the regulation. In our context the focus is the size-dependent tax-exemption rule. How do excise tax exemption rules influence the subcontracting behaviour of firms? The explanation is straightforward.
The tax threshold rule is specified as follows: T(Z) is the tax function, with Z being the value of output produced. Then, for all output below the threshold (say Z0) the firm pays zero tax and all output values above Z0, the firm pays the standard tax rate, which could be as high as 16–17 per cent in India. The threshold is also called the kink point in the corporate tax literature. 12 The after-tax marginal profit will be lower for the firm with output values above the kink. 13 This incentivises the firm to adjust its taxable output values to remain below the kink point. The introduction of the threshold exemption rule makes firms bunch below the threshold point. 14 The firm can also reduce its tax liability either by hiding output or by other means of tax avoidance, but faces legal penalties if detected. 15 The firm facing such a threshold has the option of setting up multiple units each producing below the threshold output or outsourcing the extra output from another small firm. Competition among small firms keeps supplier costs low and further facilitates subcontracting by firms with production values closer to the threshold.
Empirical Strategy and Data
This study will test whether the size-dependent fiscal incentive has threshold effects as a driver of subcontracting practices in Indian manufacturing. In order to capture this idea we have introduced the concept of subcontracting intensity, which is the share of purchased (outsourced) output in total output (see below for precise measures and measurement issues). Two propositions are tested in the article: whether subcontracting intensity is greater in excise-tax exempt size groups of firms relative to other firms. A related proposition is that subcontracting intensity is higher in domestic-market-oriented small-scale firms relative to all other firms. In our context, factory size measured by gross output is relevant as excise tax is levied on annual output.
The distribution of small-scale factories 16 for 2006–2007 is shown in Figure 1. The largest number of factories are in the size class ₹10–20 million; there is a sharp fall in the number of factories in the next size class, that is, ₹30–40 million, and more than 70 per cent of the factories have a gross value of output of less than ₹50 million in 2006–2007. It is more appropriate to use the kernel density function estimation to characterise the size distribution by value of output. This function is estimated using the data on all factories (the entire registered factory sector of India), with reported positive values of gross output (121,606 observations) in 2006–2007, the year the 100 per cent excise tax exemption limit was raised to ₹15 million. The graph of the kernel density function is presented in Figure 2, and it provides additional support for the hypothesis of bunching of factories below the tax threshold value. 17

It is important to observe that the graph of the kernel density function (Figure 2) clearly shows the bunching of factories below the 100 per cent excise tax exemption output value of ₹15 million, and the density peaks at a value just above the exemption eligible value of output. This is consistent with the observation that in terms of real outcomes, the spike may not occur exactly at the kink point due to the uncertainty of the economic environment and other reasons (Boonzaaier et al., 2019). However, the kernel density estimate supports the hypothesis that firms could manipulate the tax threshold to their advantage.
The aim of the econometric regression model is to capture the relative behaviour of small-scale factories, with firm size measured by the value of their output. The size cut-off is measured using nominal values because excise tax exemptions (eligibility criterion) are granted based on the reported nominal output value every financial year. As observed earlier, the excise-tax exemption eligibility rules require the output of the enterprise to be below the thresholds of ₹30 million and ₹40 million in different years, during the time span of 1999–2008. In order to take into account the threshold effects of fiscal policy we have carried out the following exercise.

First, we have created a dummy variable named ‘Thresholdvalue-Q’ for the subgroup of factories with output below the specified turnover/output ceiling (Q) covered in the study. 18 Thresholdvalue-Q takes the value 1 if output of the ith firm falls below the output value required for tax exemption eligibility, and zero otherwise; its value varies over time. Second, the proposition of the threshold effects of a fiscal incentive is tested by regressing subcontracting intensity on the dummy variable Thresholdvalue-Q as an independent variable along with selected control variables. In the context of panel data it is important to control for unmeasured firm-specific factors (individual-specific heterogeneity) that affect the subcontracting decisions of firms using a fixed effect (FE) model. The model also captures any time-invariant misreporting of output. In addition, there are time-variant unobserved factors common to all firms within a state, such as population growth or urbanisation. Similarly, there would be time-variant unobserved factors common to all firms within industries like technological change. We have accounted for these factors by introducing the interaction of the state-specific dummy and the industry dummy with time. A simple fixed effect regression model is estimated for the panel data with the log of subcontracting intensity as the dependent variable.
The econometric model takes the general form:

where ln (SUB)ikst is the log subcontracting intensity of the ith establishment (firm) in the kth industry in the sth state in year t. (Thresholdvalue-Q)ikst is a dummy variable of the ith establishment (firm) in year t that takes the value one if the output of the ith establishment (firm) in the kth industry and in the sth state falls below or is equal to the specified value of excise tax-exempted output in year t, and is zero otherwise. For example, Thresholdvalue-20 indicates that the ith firm’s output falls below ₹20 million. We may note that the variable Thresholdvalue-Q is determined by tax rules (exogenous) and therefore the regression does not suffer from the problem of endogeneity. (Xj)ikst represents the set of j independent control variables; and αiks are establishment (firm)-specific fixed effects that capture time-invariant unobserved heterogeneity that affects the dependent variable. μst and ηit are the state-year and industry-year fixed effects introduced to account for time-variant unobserved factors common to all firms within a state and time-variant unobserved factors common to all firms within an industry, respectively. An industry-specific dummy for the three-digit or two-digit national industrial classification (NIC) codes could not be introduced, as this does not change over time, instead it is interacted with the year dummies. Similarly state-specific dummies are interacted with the year dummies, and they control for changes in location-specific effects on the firm, such as changes in the rates of sales tax (state-specific taxes) imposed by different states in India over time, among others.
The source of plant-level data is the ASI, collected using the Indian Collection of Statistics Act 1953, and therefore it is not reported to the tax administration. 19 The ASI frame is based on the lists of registered establishments/factories maintained by the chief inspector of factories (CIF) in each state or union territory (UT) and includes establishments employing 10 or more workers if using power and 20 or more workers if not using power, on any day of the preceding 12 months. We utilise unit-level panel data on 29,213 plants spanning the period 1999–2008. The advantage is that ASI has recently made available establishment identifiers such that an unbalanced panel of manufacturing plants can be set up as the database. 20 After implementing standard methods of data cleaning, we are left with 251,856 observations in the panel. Our data set contains data on 25 states and five UTs. The analysis of subcontracting intensity is performed using a subset of sample observations that have reported data on the value of goods sold in the same condition as purchased. Only 23.9 per cent (58,665) of the total sample observations have reported this data and their distribution by year and by employment size is shown in Appendices 1 and 2, respectively.
All observations have a five-digit NIC-2004 code to identify the industry of the sample factory. For the sake of convenience, we have collapsed these codes into manageable three-digit industry codes, relying on the classification used in Hasan and Jandoc (2013) 21 to select the set of labour-intensive industries. These industries are the following: beverages, tobacco, wearing apparel, leather, footwear, saw-milling, wood products (including furniture), glass and glass products, non-metallic mineral products and others that include watches and sports goods. The remaining three-digit industry groups are grouped as ‘others’. A disadvantage of ASI data is that it does not cover factories that employ fewer than 10 workers, but this is unlikely to affect the analysis of threshold effects as such small factories operate in the informal sector and are outside the ambit of tax and other regulations.
The firm-level panel of 4,613 firms is drawn from the Prowess database 22 that covers the period 1990–2010. The data on the purchase of finished goods is available for 30,858 observations. We have dropped observations with zero values on the sales, net fixed assets and annual wage and salary bill, and this reduces the number of observations to 30,356. 23
We have defined the term subcontracting as the manufacture of goods by one firm (sub-contractor) for another firm (the principal) based on the latter’s specifications. The principal firm sells directly to the consumer. The value of subcontracting activity in a factory can be measured by the purchase value of goods sold in the same condition as purchased (the purchase of finished goods in terms of Indian company balance sheet accounts terminology). 24 Tax credit for the input tax under the value added tax is applicable to the output produced in house and not to output purchased from another unit. 25 The subcontracting intensity of a factory is thus measured using the following ratio: 26
Subcontracting intensity = Purchase value of goods sold in the same condition as purchased/Value of inputs, where,
Value of inputs = Purchase value of materials + Power + Fuel + Consumables
The estimated mean contracting intensity for different employment size classes is shown in Figure 3. Here, factory size is measured by the total number of regular workers employed. Small-scale factories clearly emerge as production units with a high level of subcontracting activity.

Fixed Effect Model Results: Factory and Company Panel Comparison
A comparison of the mean, and the maximum and mean values of the two focus variables, namely, the log of the output and the log of subcontracting intensity in the two databases are presented in Appendix 4. It is useful to note that these are broadly similar. The results of the FE model are presented in Table 1.
Regression of Subcontracting Intensity on Excise-tax-exempt Groups: Fixed Effects Model for Establishments and Firms

Regression of Subcontracting Intensity on Excise-tax-exempt Groups: Fixed Effects Model for Establishments and Firms
Robust ‘t’ statistics in brackets; csignificant at 1 per cent.
Thresholdvalue-20 = factories/companies with sales less than ₹20 million.
Thresholdvalue-30 = factories/companies with sales less than ₹30 million.
Thresholdvalue-40 = factories/companies with sales less than ₹40 million.
It is important to note that the firm characteristic is captured by employment size included as an independent variable. Employment size is widely used in the literature to capture inter-firm differences in technology, relative factor prices, workforce composition and organisational structure, among others. 27 The control variable employment size is assumed to be a proxy for all other non-measured factors influencing subcontracting intensity. Our objective is to measure the impact of tax-exemption rules independent of the effect of employment size of a firm. Another advantage of including employment size is that it takes care of the possible omitted variable bias in the regression model. One could point out that the estimated model does not capture inter-firm differences in labour costs due to labour regulations such as minimum wages, severance pay and social security benefits (the omitted variable problem). Firms may not have the incentive to expand production if they anticipate labour costs to go up with the scale of output due to labour regulations. As we know, labour regulation-induced costs are a direct function of employment size (labour laws begin to bite at different workforce sizes in India), so the inclusion of employment size will mitigate the omitted variable problem. 28
Another factor responsible for inducing firms to remain small in scale could be the lack of access to investment funds (financial capital). It may be noted that all the firms in our study belong to the registered sector and thus have access to (eligibility) institutional finance/credit unlike enterprises in the unregistered sector. Therefore, differential access to finance is potentially not an issue for our study. (The actual data on firm borrowings cannot be included because of endogeneity.) If there are firm-specific problems in terms of access to capital then this would be captured by the fixed effects in the panel regression.
The key findings based on the estimated fixed effects model are as follows:
The coefficient of the log of employment size has the expected negative sign and is significant. This is consistent with the relationship shown in Figure 3. A robustness check of a possible non-linear relationship was carried out by introducing employment-squared as additional terms and this was not found to be significant. The period-specific effects of higher sales turnover ceiling cut-offs of ₹30 million and ₹40 million are captured by the interaction of the size dummies and the two period-specific dummies, namely, Period-I (1990–2004) and Period-II (2005–2008). These are denoted by the interaction dummies, Threshold-30 × Period-I and Threshold-40 × Period-II, respectively, and both are positive and highly significant. Note that they are significant even in the presence of a common output size dummy for small firms with sales lower than ₹20 million, which should control for any proclivity for small-firm trading activity common across industries over time. The estimates based on the panel of firms in column 2 of Table 1 are comparable and consistent with the factory panel estimates. In the firm panel, employment numbers are not reported, but the value of wages and salaries is available. Notice that the coefficient estimate of the log of wages and salaries is very similar in sign and significance to the coefficient of the log of employment in the factory panel. The estimates of the period-specific interaction dummies are consistent with those of the factory panel estimates. This establishes the significance of threshold effects of tax incentives for subcontracting. That the excise tax exemption eligible size-group of firms has a higher subcontracting intensity is consistent with the conjecture that firms have a weaker incentive for output expansion beyond the eligibility threshold. A limitation of the ASI factory panel data is that it does not report the value of output exported by the factories. The tax exemption rule has no relevance for those small firms that export 100 per cent of their output. We carried out robustness checks of the results reported in Table 1 by estimating a separate set of fixed effect regression models for the firm-level data that reports value of exports as well the total value of gross output—this is discussed in Subsection 4.2.
Inter-firm differences in export orientation have been an important factor that could influence the extent of subcontracting by Indian firms. Given the uncertainty of international markets, many firms subcontract and outsource finished goods from small manufacturers, often in the informal sector in industries such as garments and leather. The excise tax rules state that export sales (excluding exports to Nepal and Bhutan) will not be counted as part of the turnover when calculating the value of sales for excise tax exemption. This could confound the effect of the tax exemption incentives on the intensity of subcontracting.
This possibility can be easily checked by using firm-level panel data. 29 The firm-level panel has a longer time span then the earlier factory-level panel and spans the financial years 1990–2010. Three output size dummies are set up to represent the three size-classes of firms according to sales turnover ceilings of ₹20 million, ₹30 million and ₹40 million in three specified periods. The corresponding three non-overlapping time period dummies are, namely, Period-I (1990–1995), Period-II (1996–2004) and Period-III (2005–2010). The above analysis is sharpened by considering a subset of firms oriented towards the domestic market, that is, firms whose main activity is not production for export but for the domestic market. We have created a dummy that takes the value of one if the exports-to-sales ratio is less than 0.05 and zero otherwise. In short, firms with an export value of less than 5 per cent of total sales are regarded as domestic-oriented. The objective is to test the hypothesis that domestic-oriented firms falling in the excise tax eligibility size groups have higher subcontracting intensity. The interaction of the domestic-firm dummy with the Thresholdvalue dummy variable defined above (Threshold-20, etc., for different time-periods) is included in the regression exercise. The regression results are shown in the second column of Table 2 for easy comparison with the estimates for all firms shown in the first column.
Regression of Subcontracting Intensity on Excise-tax-exempted Groups: Fixed Effects Model for Firms
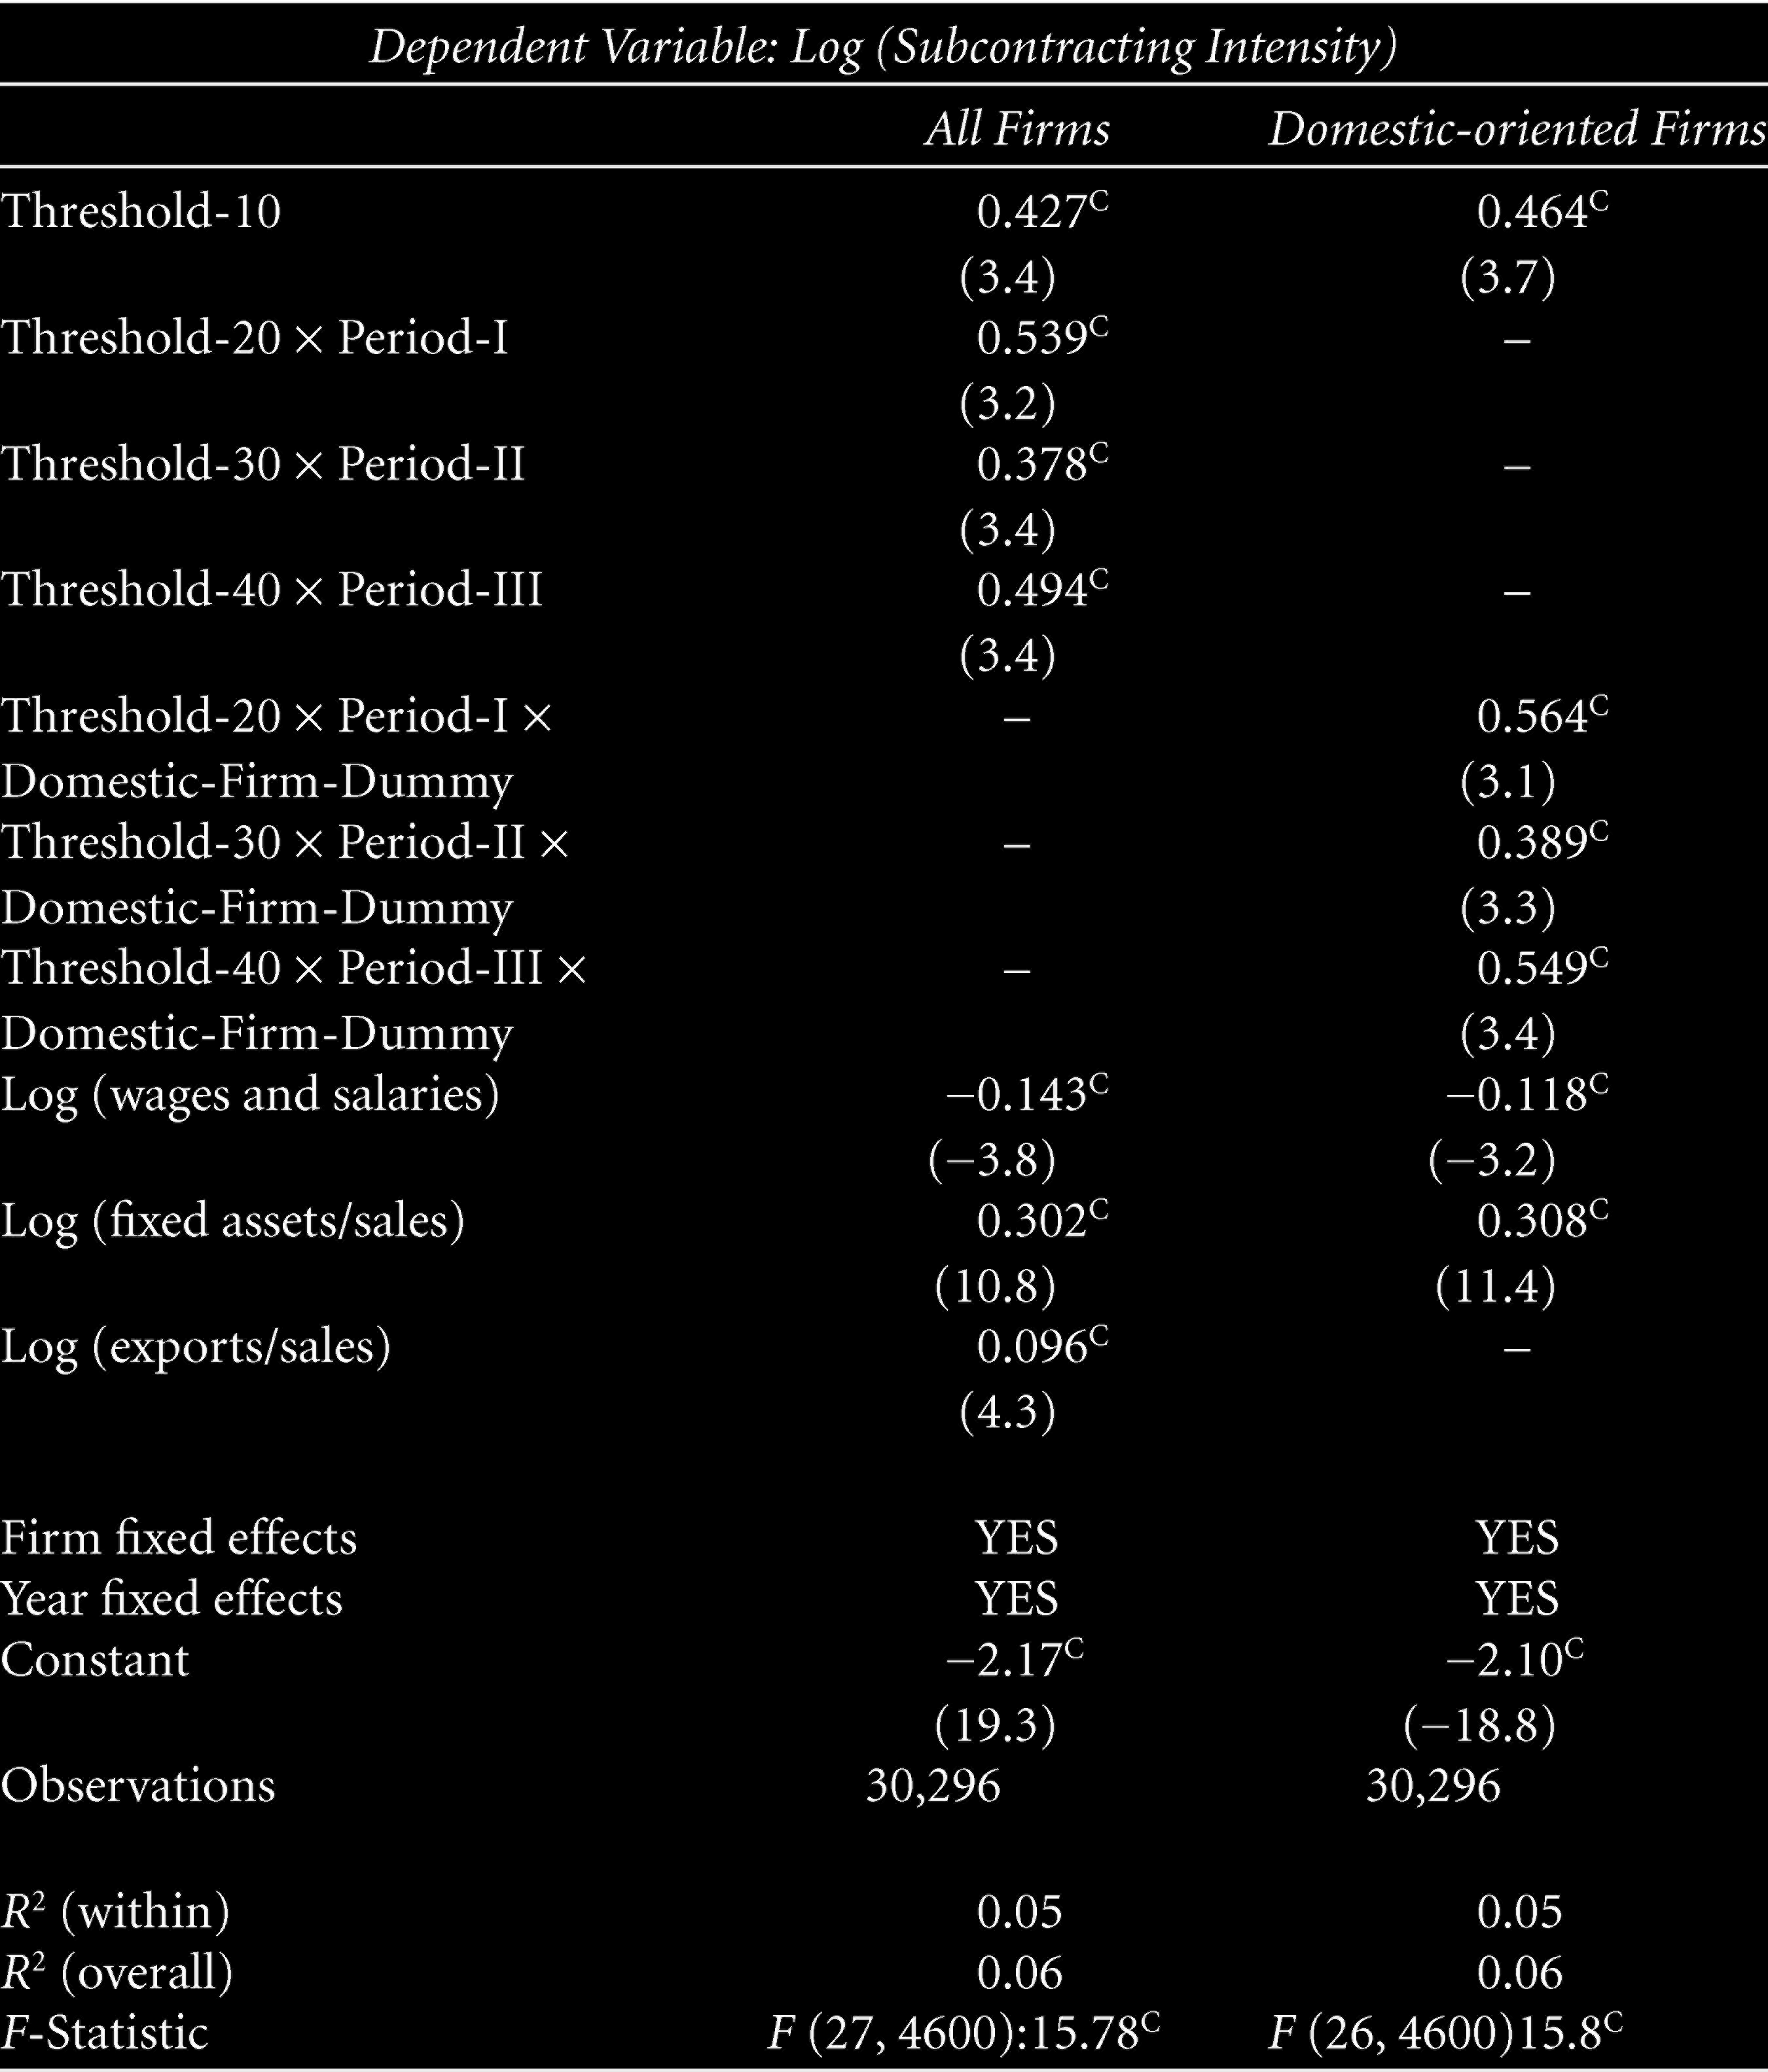
Regression of Subcontracting Intensity on Excise-tax-exempted Groups: Fixed Effects Model for Firms
Period-I = 1990–1995, Period-II = 1996–2004 and Period-III = 2005–2010
Threshold-10 = Firms with sales less than ₹10 million
Threshold- 20 = Firms with sales less than ₹20 million
Threshold-30 = Firms with sales less than ₹30 million
Threshold-40 = Firms with sales less than ₹40 million
Robust ‘t’ statistics in brackets.
The results are along expected lines. The three interaction dummy variables measuring the interaction of the tax-exempt group with period-specific dummies and the domestic-orientation firms (Thresholdvalue-20 × Period-I × Domestic-Firm-Dummy, etc.) turn out to be statistically highly significant with a positive sign. They are significant even in the presence of the tax-exempt group Thresholdvalue-10 that captures all firms with sales less than ₹10 million. The other variables included retain their expected signs and statistical significance and are consistent with estimates based on all firms in column 1. The model estimates presented in the second column of Table 2 clearly support the proposition that domestic-market-oriented firms in the tax-eligible size-groups will have a higher average subcontracting intensity than all other firms. This provides further robustness support to the threshold excise tax effects on subcontracting behaviour. The coefficient of the capital-output ratio is positive and significant suggesting that on average subcontracting firms have lower capital productivity. In other words, the measured productivity is lower in firms with a lot of trading activity because of the lower manufacturing value addition within the firm. More importantly, the coefficient of exports-to-sales ratio is found to be positive and highly statistically significant, which is consistent with the earlier argument that subcontracting activity is widespread among exporting firms in India.
This article perhaps for the first time in the literature on Indian manufacturing has tested the hypothesis of threshold effects of tax incentives using two separate panel data sets, representing manufacturing factories and companies. The fixed effects model was used to control for unobserved firm-specific effects and estimate the differential impact of tax-exemption output size groups on the subcontracting intensity of factories. The tax exemption eligible size group of plants (and firms) containing production units with just below the tax-exemption eligibility output was found to have a higher average subcontracting intensity than all the other plants (and firms). What is revealing is that these threshold size groups were significant in the presence of a common small-firm dummy variable that controls for the propensity for trading activity common among small enterprises in developing countries. We could control for inter-firm differences in export activity that exempted firms (export-oriented ones) from paying excise tax on the value of exported output, which is a dominant driver of product outsourcing in Indian manufacturing. The estimates with respect to the group of domestic-market-oriented companies supported the robustness of the regression results.
The results suggested that tax incentives are an important factor driving the subcontracting practices of small-scale firms in Indian manufacturing. This is consistent with the proposition that fiscal incentives lead to a fragmentation of factory production and prevents size-scale expansion in Indian manufacturing. Recently the Indian government has introduced a value added tax system called the goods and services tax (GST) that attempts to remove exemptions offered to small-scale industrial firms and to create a more level playing field in manufacturing. The impact of the GST on the growth and structure of manufacturing will be an interesting area for future research.
Footnotes
Declaration of Conflicting Interests
The author declared no potential conflicts of interest with respect to the research, authorship and/or publication of this article.
Funding
The author received no financial support for the research, authorship and/or publication of this article.