



Abstract
The primary purpose of this study is to examine the impact of free trade agreements on trade volume and terms of trade between Pakistan and China. It examines the effect of the Pakistan–China Free Trade Agreement (PCFTA) on sector-wise trade welfare for both countries. Using the model of Lloyd and Maclaren, this study has quantified the trade welfare effect for both countries through trade volume, intra-union terms of trade and extra-union terms of trade in the context of PCFTA. The study concludes that the trade welfare increases for China and decreases for Pakistan after the complete execution of PCFTA. Also, there has been a trade creation for China and trade diversion for Pakistan by the PCFTA.
Keywords
1. Introduction
1.1 Background
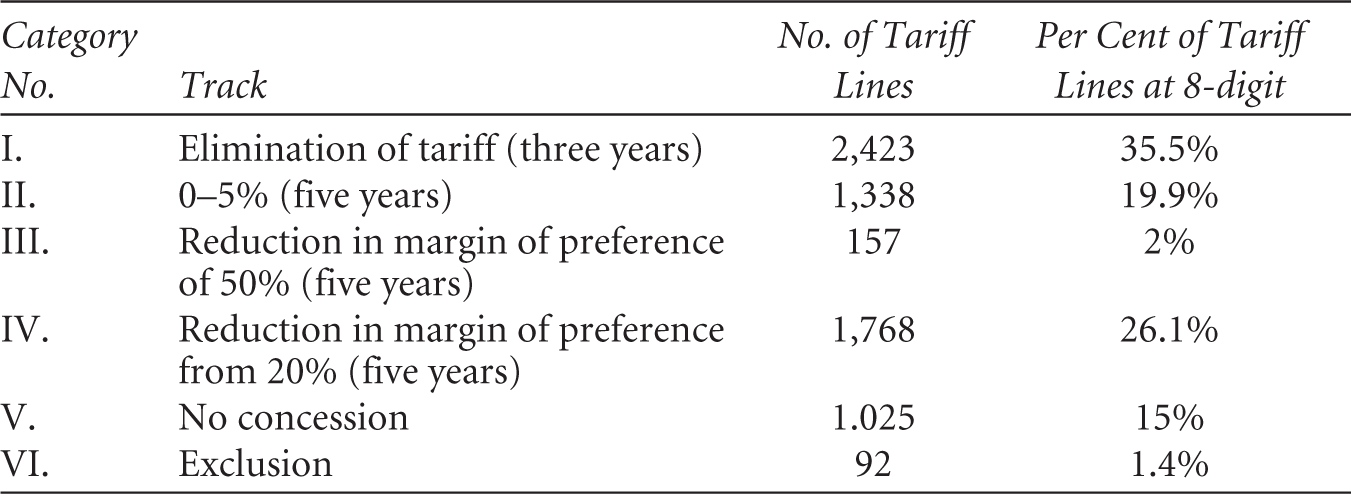
Since the pioneering work of Adam Smith’s ‘The Wealth of Nations’ in 1776, the concept of free trade has been discussed and applauded tremendously among world economists. In view of this encouragement for free trade policies by the economists, 23 nations signed the General Agreement of Trade and Tariff (GATT) in 1948 to implement the free trade policy globally, which was later replaced by the World Trade Organisation (WTO) in 1995, with 124 nations becoming part of this agreement. However, the WTO did not fully achieve the desired goal of trade liberalisation in the world economy. When the world economies could not achieve the ‘first-best’ option of free trade, the world focused on the ‘second-best’ option of regional free trade agreements (FTAs). Currently, more than 280 FTAs are present around the world; almost half of them were signed after the formation of the WTO. These FTAs include the Australia–United States FTA, the Canada–Colombia FTA, the Japan–India FTA, and Malaysia–New Zealand FTA. The Pakistan–China FTA (PCFTA) is also a part of this global phenomenon. China and Pakistan agreed to reduce the tariff gradually between the periods 2007 and 2011 (see Tables 1 and 2). The tariff concessions given by China are on finished goods while Pakistan committed to tariff reduction on raw materials and intermediary goods. If compared to each other, China and Pakistan are asymmetric with respect to both size, economy and structure. For instance, the gross domestic product (GDP) (nominal) of Pakistan was US$ 0.3 trillion (2020) while the GDP (nominal) of China was US$ 14 trillion (2020). Also, in Pakistan, 225 million persons live in a total area of 304,000 square miles. Besides, 1,410 million people live in a total area of 3,705,000 square miles in China (see Figure 1).
Tariff Reduction Modality of China

Tariff Reduction Modality of Pakistan
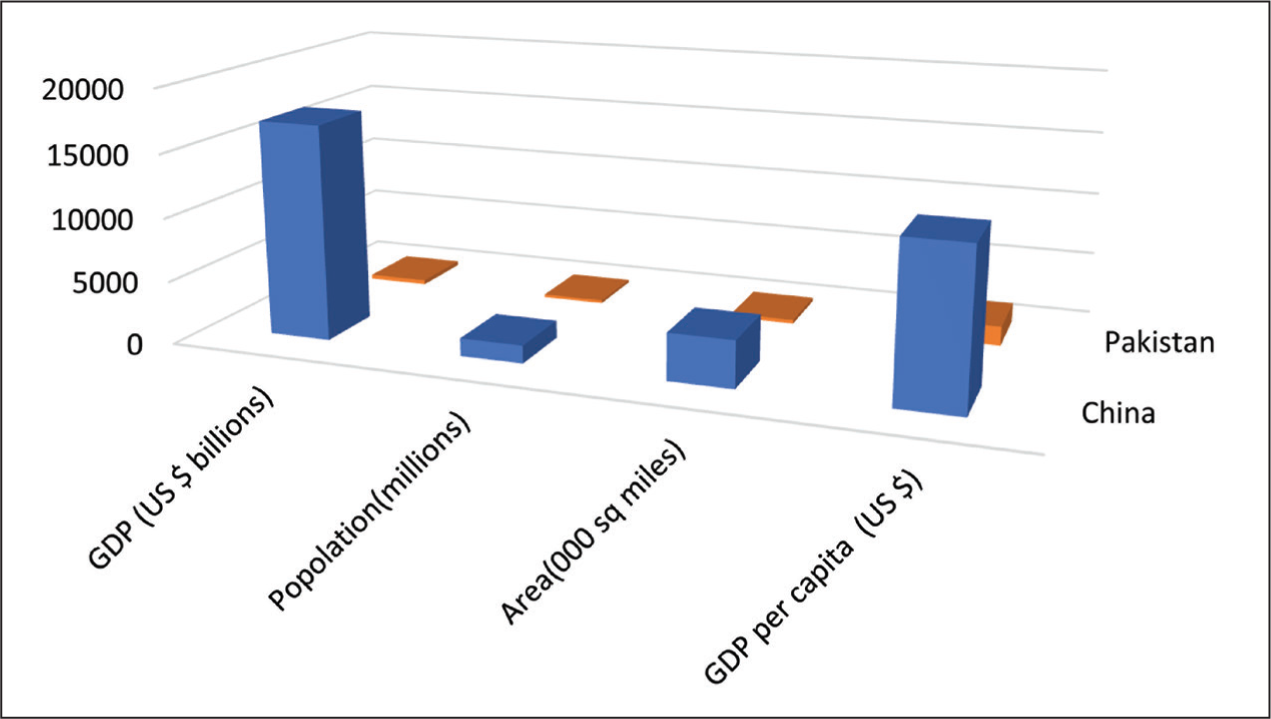
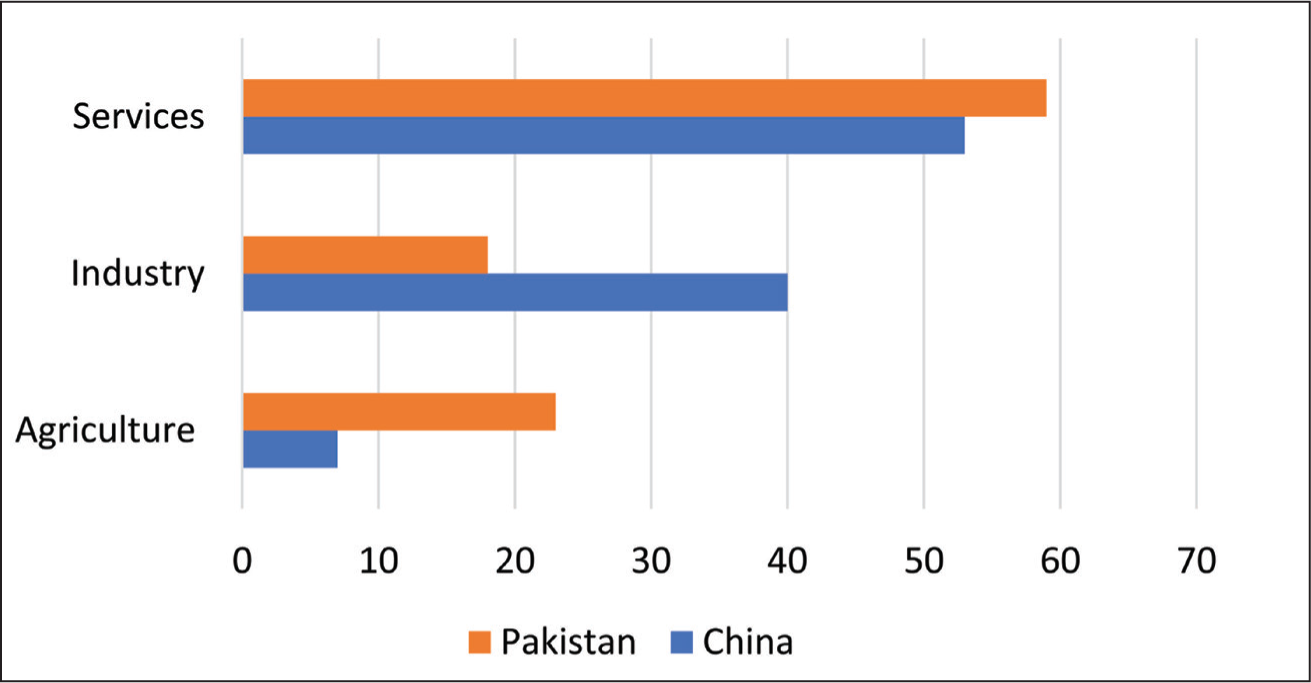
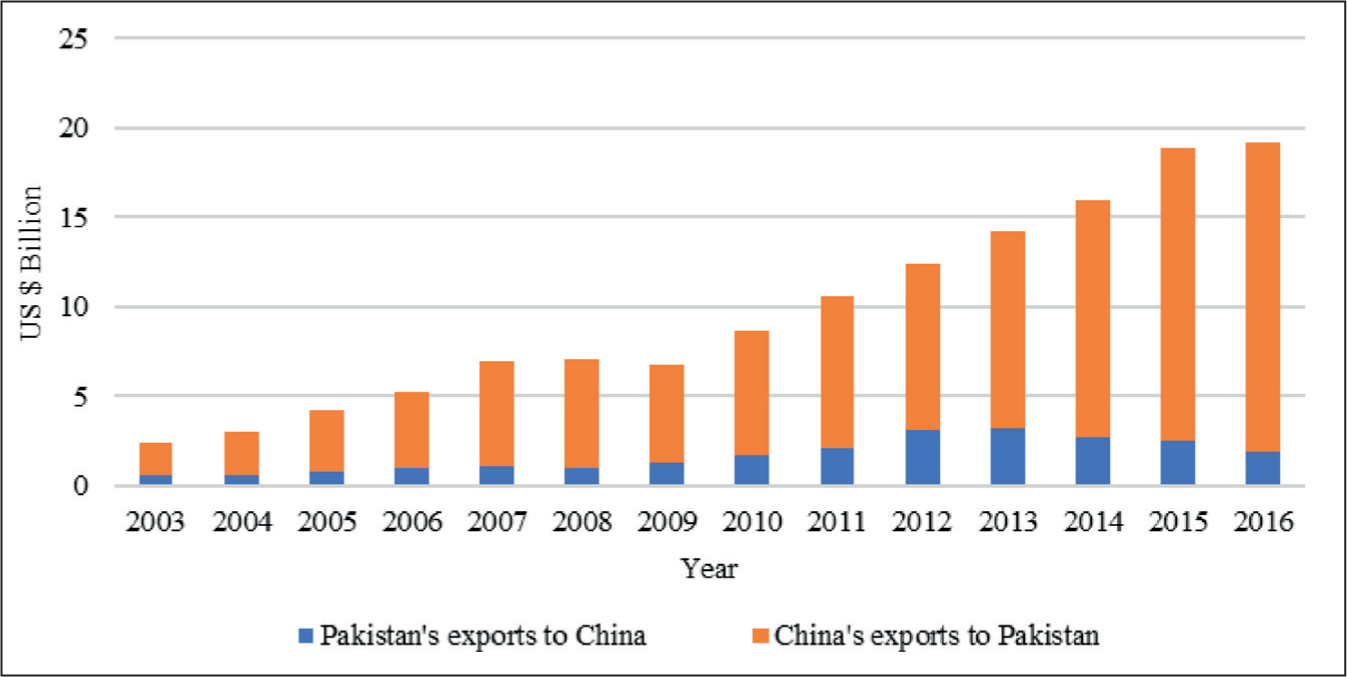
Moreover, the economic structural composition of China at the sectoral level is also different from that of Pakistan. The economy of China has a share of 7 per cent of agriculture, 40 per cent of industry, and 53 per cent of services, whereas the economy of Pakistan has a share of 23 per cent of agriculture, 18 per cent of industry and 59 per cent of services (see Figure 2). In 2003, the bilateral trade value between China and Pakistan was around US$ 2.4 billion. Since 2003, the bilateral trade between China and Pakistan has increased by 690 per cent. As of 2016, the magnitude of bilateral trade between China and Pakistan was US$ 19 billion. China is a much higher contributor than Pakistan in this bilateral trade. China’s export value to Pakistan is US$ 17 billion, while Pakistan’s export value to China is US$ 2 billion (Figure 3).
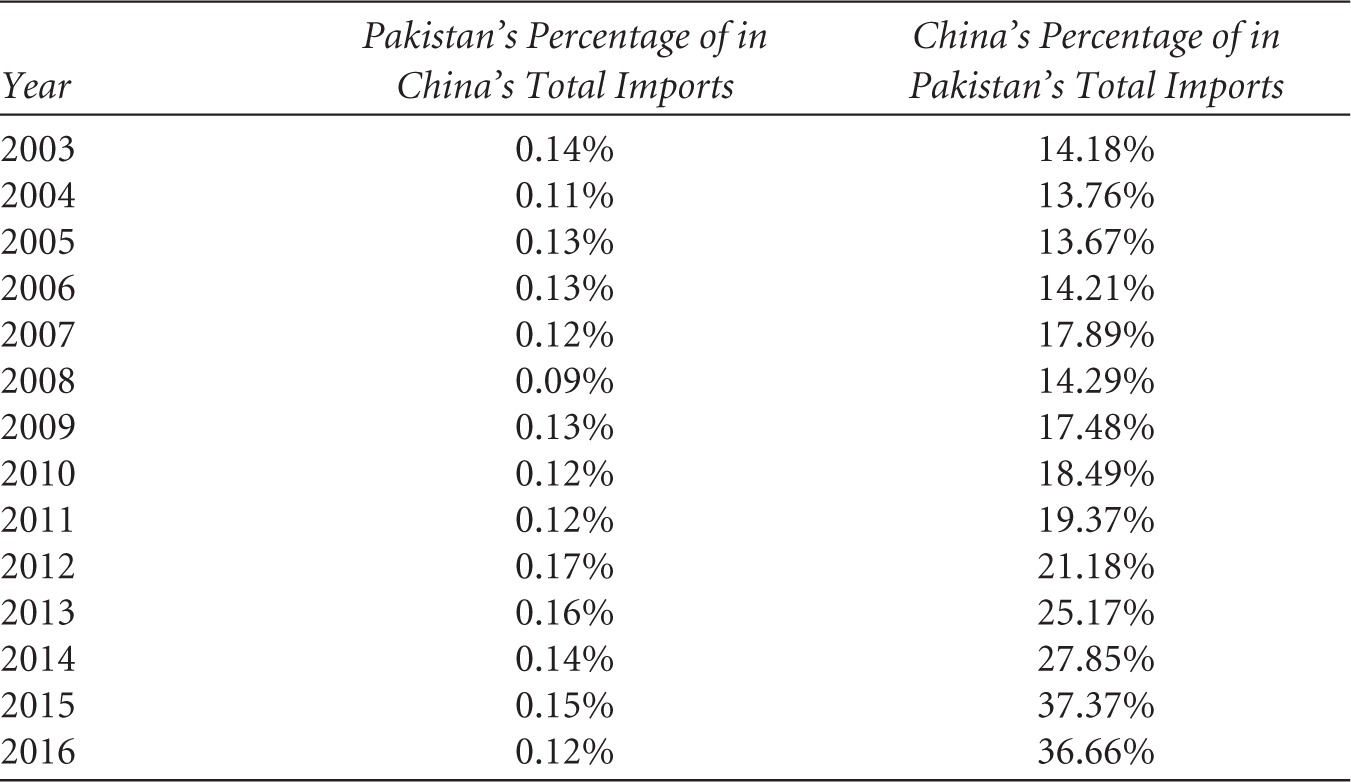
The proportion of China’s commodities in Pakistan’s imports has been significantly increasing in the last 15 years. In 2003, the proportion of Chinese commodities in Pakistan’s imports was 14 per cent. Now Chinese products account for 36 per cent of the total imports by Pakistan. China becomes the top importing market for Pakistan. However, Pakistan’s share in China’s imports from the world remained lower for this period. Pakistan’s proportion in China’s total imports increased from 0.13 per cent (2003) to 0.17 per cent (2012). As of 2016, the proportion of Pakistan’s commodities in China’s imports are dropped to 0.12 per cent (see Table 3). Also, China maintains 17 FTAs with different groups and countries such as the Association of Southeast Nations (ASEAN), Singapore, Pakistan, New Zealand, Chile, Peru, Costa Rica, Iceland, Switzerland, Maldives, Mauritius, Georgia, Korea, Australia, Cambodia, Hong Kong and Macao. Meanwhile, Pakistan has FTAs with only a few countries, including Sri Lanka, China and Malaysia. Pakistan is also a part of the South Asian Association for Regional Cooperation. This also indicates that China is more open to the world with respect to international trade as compared to Pakistan, which highlights the asymmetries in the trading structure too.
Percentage of Bilateral Trade Between Pakistan and China
1.2 Research Objectives
Based on the theoretical model of Lloyd and McLaren (2004), three indicators, viz., trade volume, intra-union terms of trade and extra-union terms of trade, determine the economic welfare of FTA member countries. For instance, when the trade volume or terms of trade of an FTA member country increase, it enhances that particular country’s economic welfare. In contrast, the Viner Model 1 (2014) believes that the impacts of the FTA are mainly divided into two parts, of which one is trade creation, and the other is the diversion effect. The trade created between two countries, such as A and B, could be a diversion from the trade between countries A and C. Therefore, altogether these two effects can only demonstrate whether the welfare of a country decreased or increased after it joined an FTA.
Consequently, while focusing on the theoretical foundations of the Viner and Lloyd model, this study attempts to achieve two major objectives in the case of the PCFTA. The first is to determine whether the PCFTA increased or decreased trade welfare for two asymmetric developing countries, such as Pakistan and China, at the sectoral level. To this end, the study utilises the model of Lloyd and Maclaren to quantify the trade welfare effects for Pakistan and China through the trade volume, intra-union terms of trade and extra-union terms of trade in the context of the PCFTA. In general, ‘Terms of Trade’ is defined as the difference between the prices of exports and imports. However, a detailed explanation of the term with the associated mathematical formula and calculations is presented in Sections 4.2 and 5.1 of this article. Second, this study attempts to find out whether the PCFTA is responsible for trade creation or trade diversion. Henceforward, this study analyses the welfare level of Pakistan and China in the context of both trade creation and trade diversion.
For a country, the welfare effect is considered to have increased after its joining the FTA if the trade creation effect surpasses the trade diversion effect and vice versa. Therefore, if two countries are engaged in the FTA, then it leads to a reduction in tariff barriers, and hence to lower prices for the consumer, and an increase in the consumer surplus and economic welfare. In contrast, trade diversion provides an opportunity for the less efficient producers to sell their products even with low productivity by using the option of tariff relaxation. Consequently, it will offset the advantage of consumer surplus by creating an externality of deadweight loss. Given that, the study tries to find out the extent of much trade creation that is higher (lower) than trade diversion, especially in the case of the PCFTA. The following section discusses the existing literature regarding this research question.
2. Literature Review
An FTA is theoretically considered an agreement among the signatory members for removing cross-border tariffs for member countries, while the non-member countries are allowed to set the sovereign import tariff regimes. This practice is endorsed by the GATT/WTO as well, and the countries that enter into the Regional Trade Agreements (RTAs) are not bound to apply those preferential trade policies to non-member countries even if they are members of WTO, which shows that the GATT allows for the formation of RTAs.
In the previous literature, some studies have argued in favour of FTAs (Allen et al., 1996; Bergstrand, 1985; Clausing, 2001; Crawford & Laird, 2001; Korinek & Melatos, 2009; Magee, 2008; Sapir, 2001; Robert, 2005; Wahyudi & Fithra, 2017). Meanwhile, other studies have reasoned against FTAs (Adams et al., 2003; Bhagwati, 1995; Joung et al., 2006; Khadan & Hosein, 2016; Krugman & Obstfeld, 2003; Kyoji et al., 2002; Panagariya, 1996; Romalis, 2007), with reference to the results of the FTAs in terms of trade creation and trade diversion. Although there could be some marginal differences in their methodologies, a majority of the studies incorporate the concept of trade creation as the trade volume between the members of the FTAs and trade diversion as the bilateral trade reduction from a non-FTA member country.
Among the studies that support FTAs, Magee (2008) used the panel data of 133 countries and established that the FTAs generate both trade creation and trade diversion, but the effect of trade creation was higher than that of trade diversion. This study measured trade creation and trade diversion as increases in the trade volume of intra-bloc trade and defined trade diversion or trade creation to specify whether or not they were accompanied by declines in imports from outside the trading region. Similarly, Allen et al. (1996) concluded that both the European Union (EU) and non-EU producers benefited from the Algeria–EU RTA in the context of trade creation for both. According to Sapir (2001), some FTAs, such as that of the Andean community, Closer Economic Relations, ASEAN Free Trade Area (AFTA) and European Free Trade Area, caused some trade diversion. However, an increase in the internal trade volume through these FTAs is more significant than trade diversion from the rest of the globe. Bergstrand (1985) argued that ‘the development of multilateral trade systems is the outcome of the regional cooperation as the interaction effect enhances both the regional and multilateral levels developments’. Robert (2005) demonstrated that FTAs between ‘Australia and USA’ and ‘Australia and China’ provide welfare gains for FTA member countries as compared to the loss in welfare for non-members due to trade diversion. This study also considers the changes in trade volumes as trade creation and trade diversion and differentiates between trade creation and trade diversion through the numerical general equilibrium model. Also, Clausing (2001) shows little trade diversion due to the Canada–US Free Trade Agreement. However, since the magnitude of trade creation was much higher than that of trade diversion, the total welfare has been positive after the implementation of the FTA. Crawford and Laird (2001) argue that as compared with the FTAs formed in the 1960s, the newly formed FTAs also include trade in services, investment, non-tariff trade barriers and intellectual property rights, which leads to the overall promotion of economic cooperation. Korinek and Melatos (2009) found a shred of strong evidence that AFTA, the Southern Common Market (MERCOSUR) and the Common Market for Eastern and Southern Africa resulted in trade creation among the member countries as the trade volume of members of the FTA increases substantially after FTAs, while there is no robust indication of trade diversion in terms of a reduction in imports from outside the region. While analysing the three major FTAs of the Indonesia ASEAN–China FTA (ACFTA), the ASEAN–India FTA and the ASEAN–Korea FTA, Wahyudi and Fithra (2017) found all these agreements in favour of trade creation among the member countries instead of trade diversion from outside these FTAs. They employed the dummy variables of membership status to classify the intra-regional trade volume and extra-regional trade volume, such that the sign of these dummy indicates trade creation and trade diversion. Similarly, Yang and Martínez-Zarzoso (2013) used the ACFTA dummy variables, namely, trade creation, export diversion and import diversion effects. The results of their study also support the trade agreements, as they found that ASEAN and China yield an overall increase in the trade volume with very little diversion from the outside members of the trade agreement.
Conversely to the FTAs’ supportive studies, many studies strongly raise the question about the overall benefits of FTAs. These studies argue that FTAs might improve intra-regional trade at the expense of trade diversion with outsiders, reducing the overall economic welfare. According to Bhagwati and Panagariya (1996), the trade diversion created by the FTAs is more likely to dominate trade creation in most cases and can replace multilateral trade. When there is trade among the union members and the rest of the countries, trade diversion is inevitable, whereas in the FTAs, trade diversion suppresses trade creation as members of the RTA are fewer compared to the rest of the world. Adams et al. (2003) conducted a study to examine 18 major FTAs worldwide. According to their study covering 18 FTAs, in 12 FTAs, the amount of trade diversion from the non-members was much greater than the trade creation with the member countries. Moreover, the highly liberalised RTAs, such as the EU, NAFTA and MERCOSUR, have reduced economic welfare as they have been unsuccessful at creating significant trade inside the region. Krugman and Obstfeld (2003) also supported the results of Adams by examining the MERCOSUR, which consists of Argentina, Brazil, Paraguay and Uruguay, and finding that MERCOSUR is responsible for higher trade diversion as compared to trade creation. While Joung et al. (2006) evaluated the FTA among China, Japan and South Korea for its economic effects on the world economy and concluded that the trade volume generated by the FTA helped in expansion of the economies of the three countries, these FTAS, on the other hand, also impacted the non-member countries negatively. Also, Romalis (2007) explores trade diversion and trade creation through methods based on elasticities, tariff change and their considerable effect on international trade volume. The study concluded that NAFTA had diverted more trade from the EU countries, resulting in overall loss in welfare. Likewise, Kyoji et al. (2002) found a strong trade-diverting effect for the US imports of textile and apparel products under NAFTA. Khadan and Hosein (2016) also incorporate the changes in tariffs and prices of the commodities to estimate trade diversion and trade creation for an FTA. They consider that a switch of imports from one extra-regional partner to another extra-regional partner (Canada) in the FTA environment represents a trade diversion effect. According to their study, the proposed Caribbean Community (CARICOM)–Canada FTA has adverse revenue and welfare effects for the CARICOM member states. Although Sun and Reed (2010) estimate the agricultural trade creation and diversion effects for multiple FTAs through the Poisson pseudo maximum-likelihood (PPML) estimator, their foundation method for classifying trade creation and trade diversion was based on the trade volume emanating from inter-regional trade and intra-regional trade. The study demonstrates a substantial trade creation in the ASEAN–China FTA and the Southern African Development Community (SADC), but only export diversion for NAFTA and no trade creation is attributed to this agreement. Meanwhile, Coulibaly (2016) explored several FTAs and found net trade creation for the Economic Community of West African States and SAPTA, and net trade diversion for AFTA, MERCOSUR and SADC. His study employed the dummy variable for the intra-bloc export creation and diversion analogous to Khurana and Nauriyal (2017). Also, Esposito (2017) analyses trade diversion and trade creation for the European Monetary Union by employing a similar definition that an increase in trade among the Economic and Monetary Union (EMU) countries leads to trade creation and trade diversion effects, leading to the relocation of trade from the non-EMU to EMU countries. The study concludes that trade imbalances among the intra-EU member countries significate trade diversion effects in the sample considered during the period 1999–2013. Hence, the previous literature indicates that a majority of the studies used the definition of trade creation and trade diversion to represent the trade volume between the trade FTA and non-FTA member countries. However, there is ambiguity with regard to trade creation or trade diversion and correspondingly also in the total welfare effects of the FTA.
In addition, as mentioned earlier, there are very few studies in the case of Pakistan and China. Most of these studies were conducted before and during the implementation period of PCFTA (Javaid & Jahangir, 2005; Musleh et al., 2009; Naved & Sarah, 2012; Shaista, 2010). Furthermore, the recently conducted studies about PCFTA (Ahmad, 2014; Chaudhry et al., 2017; Qi & Muhammad, 2015) do not provide a comprehensive empirical analysis for Pakistan and China simultaneously. Interestingly, none of these studies analysed the aspect of asymmetry between Pakistan and China. In the literature, the studies classify asymmetry by several aspects, such as the size of the consumer and producer market (Bond & Park, 2002; Chang & Xiao, 2015; Czaika, 2009; Falvey et al., 2004; 2006). In addition, some studies characterise the asymmetry between the countries as the ability to manipulate the terms of trade through tariffs, the relative size of trading partners, the ratio of exports to GDP and technological differences (Epifani & Vitaloni, 2006; Kim, 2005; Park, 2000). However, all these classifications could be identified by the quantitative parameters of GDP, the population of the country and the structure of the economy with respect to the agriculture, manufacturing and service sectors. Therefore, this study has attempted to address this ambiguity in the case of the PCFTA in terms of the asymmetry between the two countries. The difference between the economies of Pakistan and China has already been highlighted in Section 1. Section 3 discusses the research gaps and contributions in detail based on the literature review and thereafter constructs the hypotheses for the quantitative analysis.
3. Research Gap, Contribution and Hypotheses
Using the literature review, the study finds some substantial research gaps in the previous literature. First, there is an ambiguity about trade diversion and trade creation in the case of FTAs. More specifically, the case of Pakistan and China has not been explored comprehensively after the complete implementation of PCFTA in this regard. Although there are several studies on Pakistan and China, a majority of them were conducted before and during the implementation period of PCFTA. Also, these studies provide ambiguous results about the benefits of PCFTA for China and Pakistan. As per the author’s knowledge, there is not a single study that considers the case of asymmetric countries and quantifies the welfare for both Pakistan and China after the completion of PCFTA’s probation period and tries to find out how far PCFTA is beneficial for Pakistan and China. This study is an addition to the literature by quantifying trade volume, intra-union terms of trade and extra-union terms of trade effects and, thus, by extension, the total welfare effect, from the perspectives of both Pakistan and China while considering the PCFTA. It will eventually provide a comprehensive policy recommendation to improve the current PCFTA.
Correspondingly, based on the literature review and marginal contributions, the following hypotheses have been set and tested to achieve the objectives. Among these six hypotheses, three each are related to Pakistan and China.
The hypotheses are:
Trade welfare increased for China after the complete implementation of PCFTA. Trade welfare increased for Pakistan after the complete implementation of PCFTA. There has been more trade creation than trade diversion for China after the complete implementation of PCFTA. There has been more trade creation than trade diversion for Pakistan after the complete implementation of PCFTA. The terms of trade improved for China after its joining the PCFTA. The terms of trade improved for Pakistan after its joining the PCFTA.
Before discussing the methodology and results, the study briefly demonstrates the theoretical framework for the analysis in Section 4.
4. Theoretical Framework 2
4.1 Basic Model
Let us consider an open economy in which the domestic prices of commodities differ from the international prices due to the government’s import or export-related border measures. Let p be the domestic prices vector over commodities, p* be the international price vector over commodities and m 3 be a vector for the economy’s trade volumes. In order to determine the required expenditures for an FTA to maintain the national welfare (which is domestic and international prices and the utility of consumers) that they enjoyed before joining the FTA, this model utilises the following three functions: national production’s revenue function, national expenditure function and trade tax revenue function.
Let p be the vector of domestic prices of commodities and v be the vector of factor endowment, then the total revenue attained by the profit-maximising producer in the country is given in Equation (1).

Given that p is the vector of domestic prices over commodities and u is the vector of utility for a country, the national expenditure function is:

where u = (u1, u1, u3, …, uH).
The import-/export-related border measure generates government revenue or government spending. If the government-imposed trade tariff provides revenue to the government, wherein the government gives a trade subsidy, then it counts as government spending. Given that p is the domestic prices vector over commodities, p* is the international price vector over commodities and m is a vector for the economy’s trade volumes, the trade tax revenue function is

Given the above three functions, let W be the compensation function, 4 which could be obtained by simply subtracting the national total income from minimum total expenditures at domestic prices (p) for a specified welfare level(u).

This function (Equation (4)) is based on the neo-classical economic structure, in which there are no constraints with respect to production factors, consumers and final goods. Also, the traded intermediate inputs and specific and unspecific inputs can be used in the production process. It is a general equilibrium analysis because the model follows the condition of mutatis mutandis. 5 However, this model does not consider economies of scale and non-competitive behaviour. If a nation joins the FTA, it creates a disturbance in its trade term. The domestic and international prices pre-FTA and post-FTA are not the same. These changes in prices affect national production revenue, national expenditure and trade tax revenue functions.
4.2 Change in Welfare
Let p1 be the domestic prices vector over commodities, p1* be the international price vector over commodities and m1 a vector for the economy’s trade volumes for the pre-FTA level. While p2 is the domestic prices vector over commodities, p2* is the international price vector over commodities, and m2 is a vector for the economy’s trade volumes at the post-FTA level.
Given that v (vector of factor endowment) is constant and the level of welfare (utilities) of a country between the two situations remains the same (u1 = u2) the compensation functions for pre- and post-FTA cases are as follows:


Here, Equation (5) represents the compensation function for pre-FTA, while Equation (6) shows the compensation function for post-FTA. The post-FTA changes in the total welfare are measured in monetary terms, that is, the amount paid by or taken from the country after joining the FTA while keeping the welfare at pre-FTA levels. This amount could be quantified by taking the difference between pre-FTA compensation and post-FTA compensation functions.
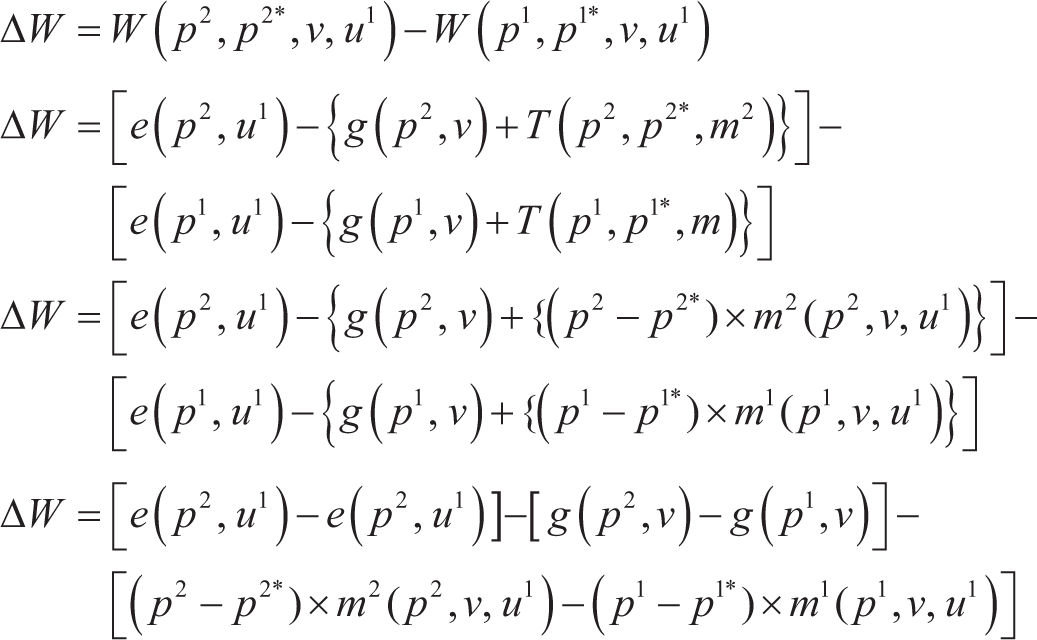
Equation (7) shows the amount that must be paid as compensation to the economy in the post-FTA condition if the level of utility for the country must remain the same as the pre-FTA levels. If the value of DW in Equation (3) is positive, the economy is worse off after the country’s joining the FTA. However, if the value of DW in the equation is negative, then it shows that the economy is better off after the country’s joining the FTA. The value of DW can be considered as the measurement of potential Pareto improvement in the economy.
Equation (7) can be rewritten as:

The first term shows the difference between the post-national expenditure and pre-FTA levels. This difference occurs because the national expenditure function changes through the changes in domestic prices. The second term in Equation (3) represents the change in national income at the post- versus pre-FTA level. It is the change in the value of the revenue function and could be calculated by multiplying the changes in domestic prices and production choices at the initial level. In comparison, the last term expresses the change in trade tax revenue due to the country’s joining the FTA.
Given that the m1 is the initial amount of trade, the difference between the initial consumption and initial production can be shown as m, so Equation (7) will become,

Now, solving for the last term in Equation (8),
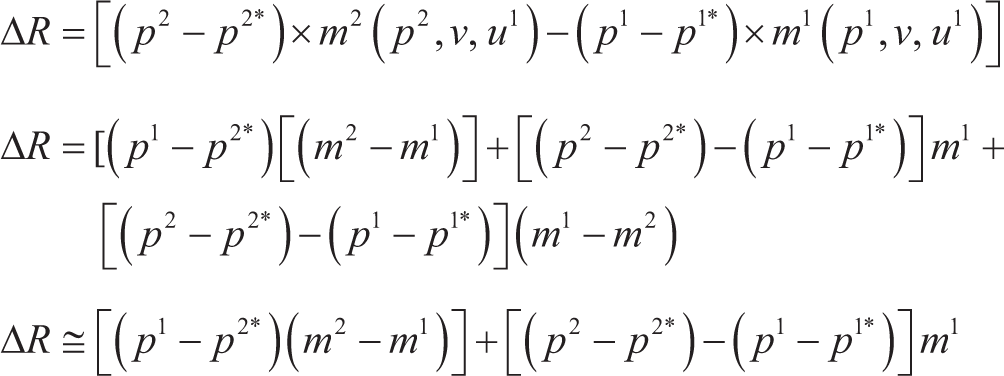
The tariff-weighted change in the trade volume is shown in the first term of Equation (4), which is the multiplicative term between the change in trade volume and the tariffs. The terms of trade effect are also shown in the second term of Equation (4), which is simply a multiplicative term of the initial volume of trade and change in the cost of a trade.
Putting the value from Equation (9), Equation (8) becomes
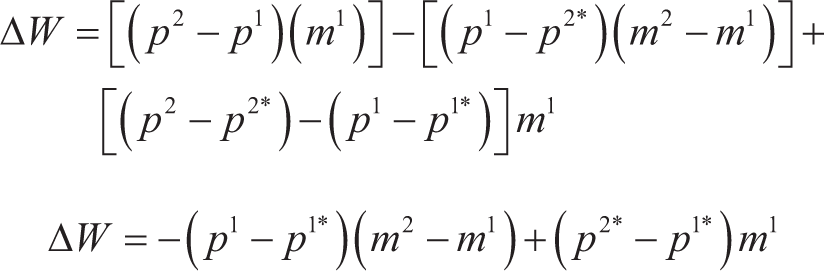
If we simply multiply the whole equation with a negative sign, then it will become

Now, the interpretation for Equation (10) will be that if the value of ∆W in Equation (10) is positive, then the economy is better off after the country’s joining the FTA. However, if the value of ∆W in the equation is negative, then it shows that the economy is worse off after the country’s joining the FTA.
Also, the second term of trade effect in Equation (10) can be divided into two parts, of which one is a change in the intra-union terms of trade
6
(for countries that are included in the FTA), and the other is a change in the extra-union FTA terms of trade
7
(for the countries which are not included in the FTA), shown as follows:

where j indexes the country of origin/destination of import too, or exports from, M, which is the set of countries that are members of the FTA.
Substituting Equation (8) in Equation (7) gives:

Also, the change in trade volume can be divided into intra-union and extra-union, such that:

Hence, Equation (3) will become

Thus, we have a general expression of the form:
Welfare (∆W) = [Change in Intra-union Volume of Trade + Change in Extra-union Volume of Trade] − [Change in Intra-union Terms of Trade + Change in Extra-union Terms of Trade]
Here, if the sign of the change, ∆W, is positive, the country gains and, if the sign is negative, it loses.
In the last equation, the sum of the change in intra-union volume of trade and the change in extra-union volume of trade represents the trade creation and trade diversion effect such that, if the total sum is positive, then it means that trade has been created with both the FTA member country and the non-FTA member country, and hence there is overall trade creation. However, if there is an increase in the intra-union volume of trade and a decrease in the extra-union volume of the trade, then it indicates that trade has been diverted from a non-FTA member country towards an FTA member country, creating a negative impact on the sum of the change in the intra-union volume of trade and change in the extra-union volume of trade. Also, if there is a trade creation, then there will be positive addition in the welfare equation, while the opposite will be true in the case of trade diversion. Therefore, the sum of the first two terms in the above equation demonstrates the effect on the total welfare of the country.
5. Methodology
5.1 Empirical Equations
Considering the theoretical framework, the study utilised the following equation to estimate the change in intra-union trade volume, extra-union trade volume, intra-union term of trade, extra-union term of trade and change in total trade welfare. In Equation (11) (Section 4), the changes in trade volume are represented by the first two terms.


To estimate these two effects, the study used the ad valorem tariff (tmp or tnmp) as the difference between international and domestic prices. Meanwhile, for the change in the quantity of trade, the study uses the variable of import volume,
8
such that Equations (12) and (13) are estimated for the change in the trade volume (∆Vp or ∆Vnp):


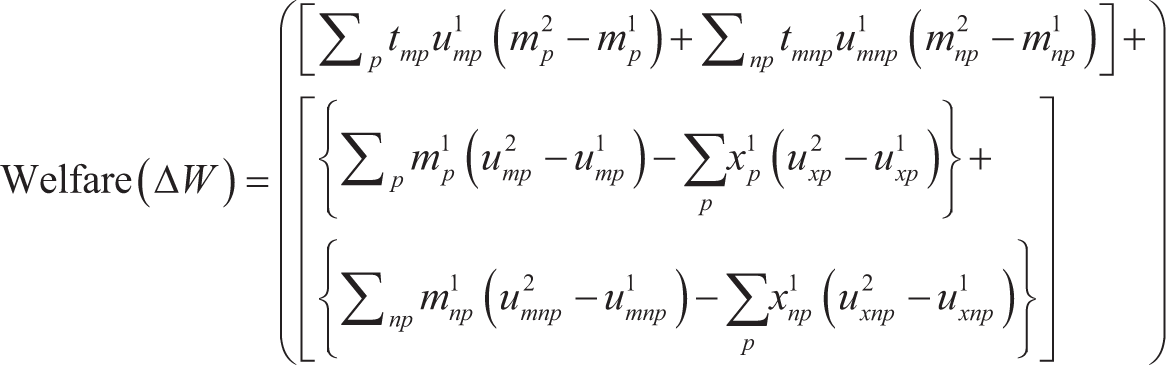
where p indicates a partner country, np indicates a non-FTA partner country, tmp is the import-weighted ad valorem tariff on imports from FTA partner country (p) in the base period, tmnp is the import-weighted ad valorem tariff on imports from non-FTA partner countries (np) in the base period, u1 mp is the unit value of imports from partner country (p) in the base period, u1 mnp is the unit value of imports from a non-FTA partner country (np) in the base period, m2 p is the quantity of imports from partner country p in the new period, m1 p is the quantity of imports from partner country p in the base period, m2 np is the quantity of imports from non-FTA partner countries (np) in the new period and m1 np is the quantity of imports from non-FTA partner country (np) in the base period.
Similarly, in Equation (11) (Section 4), the changes in terms of trade are demonstrated by the last two terms.


To estimate these two effects, the study incorporates the quantity of exports and imports with their unit prices separately, such that Equations (14) and (15) are estimated for the change in terms of trade (∆ToT
p
+ ∆ToT
np
):


where x1 p is the quantity of exports to FTA partner country (p ) in the base period, u2 xp is the unit value of exports to FTA partner country (p) in the new period, u1 xp is the unit value of exports to FTA partner country (p) in the base period, m1 p is the quantity of imports to FTA partner country (p ) in the base period, u1 mp is the unit value of imports from FTA partner country (p) in the base period, u2 mp is the unit value of imports from FTA partner country (p ) in the new period, x1 np is the quantity of exports to non-FTA partner country (np) in the base perio u2 xnp is the unit value of exports to non-FTA partner country (np) in the new period, u1 xnp is the unit value of exports to a non-FTA partner country (np) in the base period, m1 np is the quan imports to non-FTA partner country (np)in the base period, u1 mnp is the unit value of imports from a non-FTA partner country (np) in the base period and u2 mnp is the unit value of imports from non-FTA partner countries (np) in the new period.
Furthermore, the welfare of the country is shown in Equation (11) in the theoretical model.

The study estimated welfare by taking the difference between two summations, the summation of Equations (12) and (13), and the summation of Equations (14) and (15). Therefore, Equation (16) is the final equation used in the methodology to estimate the welfare, as follows:
5.2 Data Selection
5.2.1 Variables and Data Sources
The study used five major variables for the calculation of results, total exports quantity (x), total exports value (X), import quantity (m), total import value (M), the unit price of exports (ux), the unit price of imports (up) and tariff on imports (tm). Also, these variables are separately assessed for Pakistan, China and the countries that are not a member of the PCFTA. Furthermore, each of these variables is estimated for each commodity, base period (2007) and the new periods (2013, 2015 and 2016) as required in Equations (11)–(14).
Case of Pakistan:
tm, China = the import-weighted ad valorem tariff on imports from China in 2007 (base period). tmnp = the import-weighted ad valorem tariff on imports from non-FTA partner countries (np ) in 2007 (base period). m2007China = the quantity of imports from China in 2007 (base period). m2China = the quantity of imports from China in the new period. m2
np
= the quantity of imports from non-FTA partner countries (np) in the new period. m2007
np
= the quantity of imports from non-FTA partner countries (np) in the base period. x2007China = the quantity of exports to China in 2007 (base period). x2007np = the quantity of exports to non-FTA partner country (np) in 2007 (base period). u2007m, China = the unit value of imports from China in the base period (2007) = u2007mnp = the unit value of imports from non-FTA partner country (np) in 2007 (base period) = u2007x, China = the unit value of exports to China in the new period = u2007x, China = the unit value of exports to China in 2007 (base period) = u2m, China = the unit value of imports from China in the new period = u2
xnp
= the unit value of exports to non-FTA partner country (np) in the new period = u2007
xnp
= the unit value of exports to non-FTA partner country (np) in 2007 (base period) = u2
mnp
= the unit value of imports from non-FTA partner countries (np) in the new period =
Case of China:
tm, China = the import-weighted ad valorem tariff on imports from Pakistan in 2007 (base period). tmnp = the import-weighted ad valorem tariff on imports from non-FTA partner countries (np) in 2007 (base period). m2007China = the quantity of imports from Pakistan in 2007 (base period). m2China = the quantity of imports from Pakistan in the new period. m2
np
= the quantity of imports from non-FTA partner countries (np) in the new period. m2007
np
= the quantity of imports from non-FTA partner countries (np) in the base period. x2007China = the quantity of exports to Pakistan in 2007 (base period). x2007
np
= the quantity of exports to non-FTA partner country (np) in 2007 (base period). u2007m, China = the unit value of imports from Pakistan in the base period (2007) = u2007mnp = the unit value of imports from non-FTA partner country (np) in 2007 (base period) = u2x, China = the unit value of exports to Pakistan in the new period = u2007x, China = the unit value of exports to Pakistan in 2007 (base period) = u2007m, China = the unit value of imports from Pakistan in the new period. u2
xxnp
= the unit value of exports to non-FTA partner country (np) in the new period = u2007
xnp
= the unit value of exports to non-FTA partner country (np) in 2007 (base period) = u2
mnp
= the unit value of imports from non-FTA partner countries (np) in the new period =
5.2.2 Selected Commodities and Non-FTA Member Countries
To find out the trade welfare effect of FTA for China and Pakistan, the study utilises a six-digit code system for goods classification called the harmonised system (HS). This study estimates the trade welfare effect for five sectors for China and 12 HS commodity chapters (sectors) for Pakistan. Each selected data covers more than 90 per cent of bilateral trade between Pakistan and China. Following is the list of selected commodities.
Commodities: 10 (cereals), 26 (ores, slag and ash), 41 (raw hides and skins (other than fur skins) and leather) and 52 (cotton). Non-FTA Partners: Australia, the United States of America, Vietnam, Brazil, Peru, India, Chile and Japan.
Commodities: 29 (organic chemicals), 39 (plastics and articles thereof), 40 (rubber and articles thereof), 54 (man-made filaments), 55 (man-made staple fibres), 72 (iron and steel), 73 (articles of iron or steel), 84 nuclear reactors, boilers, machinery and mechanical appliances, parts thereof), 85 (electrical machinery and equipment and parts thereof; sound recorders and reproducers, television image and sound recorders and reproducers and parts and accessories of such articles) and 87 (vehicles other than railway or tramway rolling stock, and parts and accessories thereof). Non-FTA Partners: China, India, Kuwait, Saudi Arabia, Malaysia, United Arab Emirates, Thailand, South Korea, Indonesia, Austria, Vietnam, the United Kingdom, the United States of America, Japan, Italy and Germany. In Section 6, this study quantifies the trade creation and trade diversion effects, and by extension, the economic welfare effect for Pakistan and China after the implication of the PCFTA. The study uses three kinds of tariffs, T1, T2 and T3,
9
to estimate. T1 is used as a baseline estimation, while T2 and T3 are used in the robustness test. Moreover, for the base period, this study uses 2007, while for the new period, three years, 2013, 2015 and 2016, are used separately.
6. Results
This section comprises the results based on the above methodology. The results for China are given first, followed by the results for Pakistan.
6.1 Case of China
6.1.1 Change in Total Trade’s Welfare
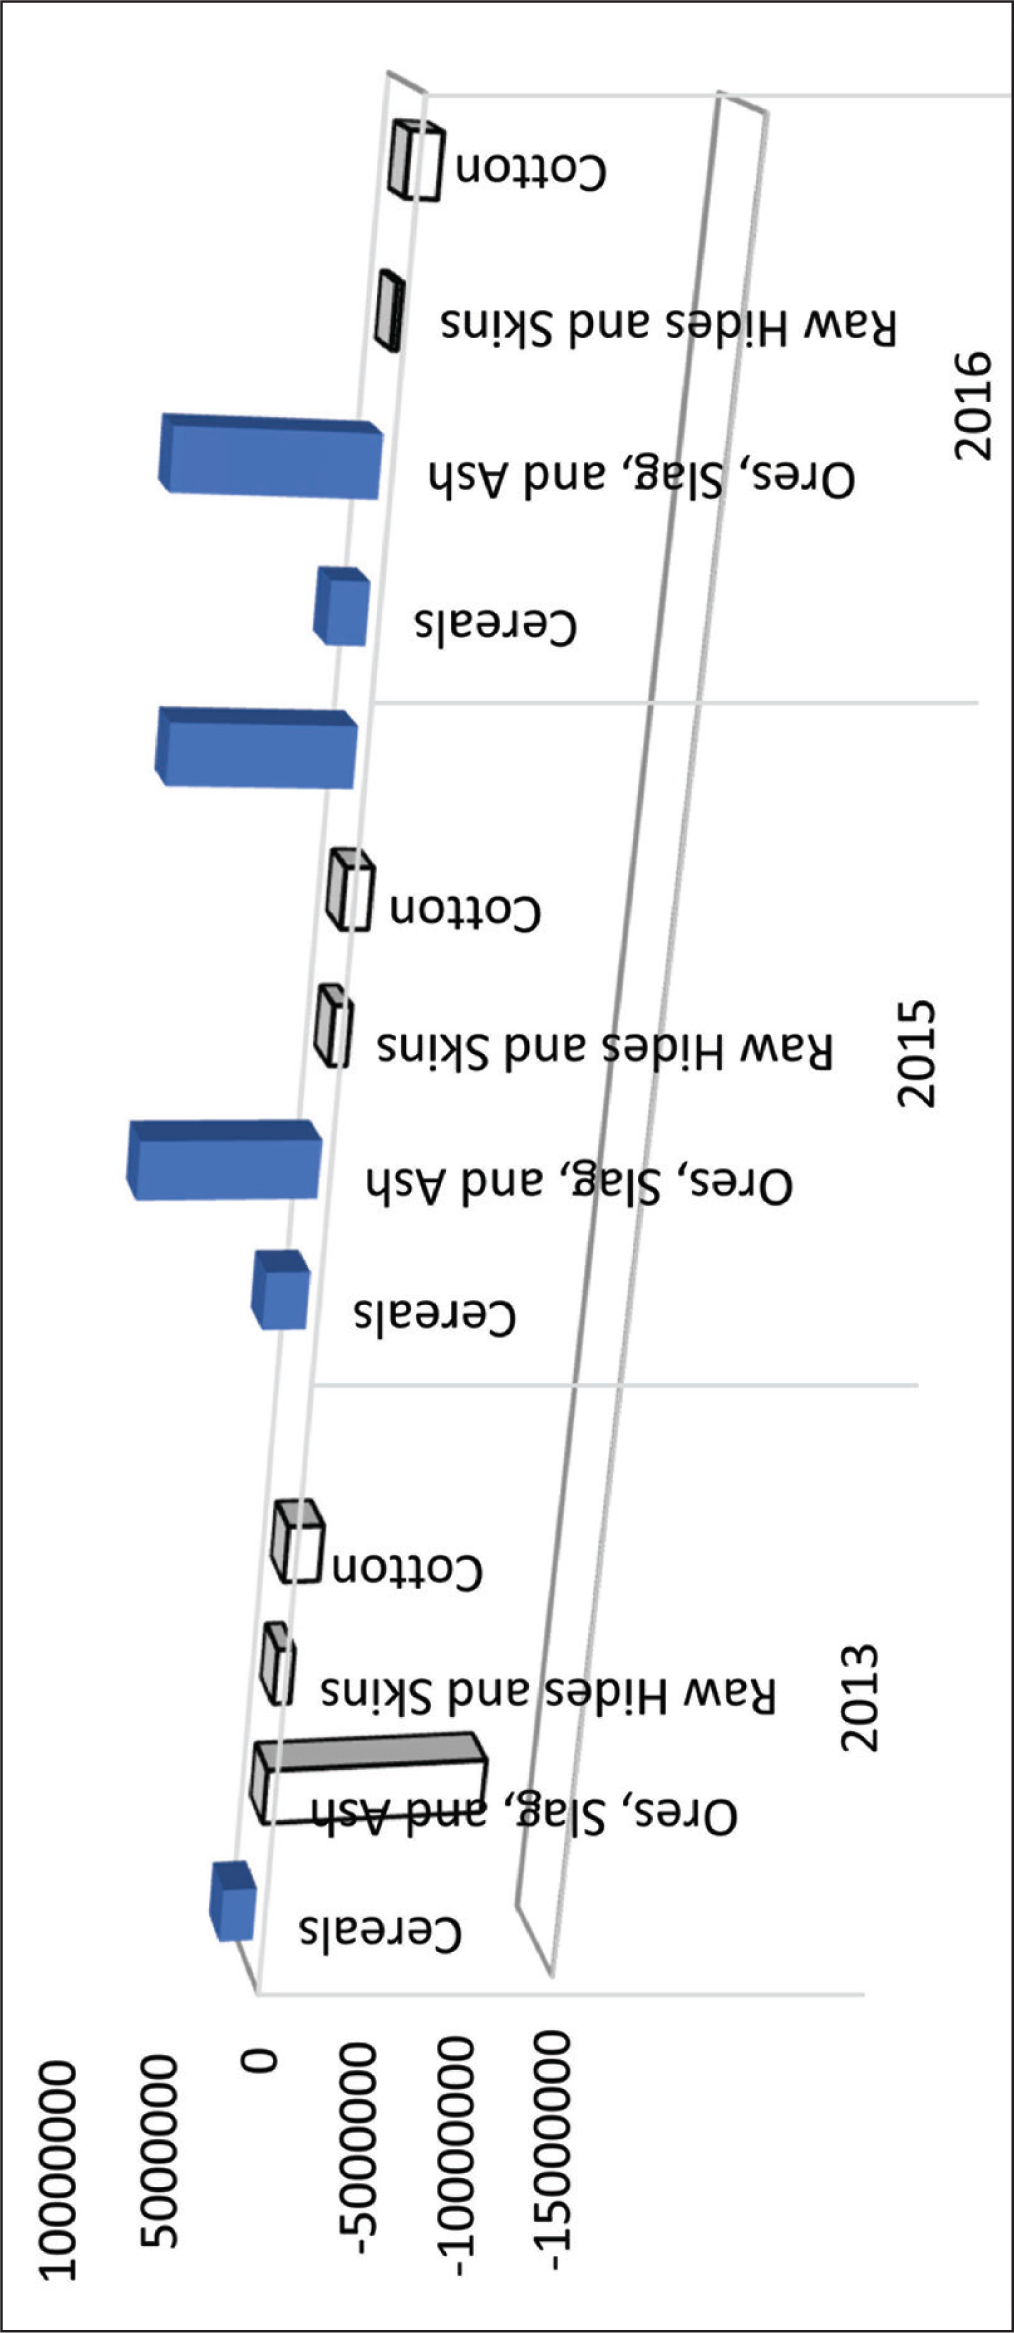
Figure 4 shows that China’s welfare gains from PCFTA are positive in the commodities of ‘ores, slag and ashes’ (except 2013) and ‘cereals’. However, after the complete implementation of the PCFTA, China experienced a welfare loss in the commodities of ‘raw hides and skins’ and ‘cotton’. Additionally, the welfare gains from ores, slag and ashes have been increasing more significantly as compared to the other major commodities. Also, the welfare gains by China from the PCFTA are much higher as compared to the welfare losses. Therefore, the PCFTA provides significant welfare gains to China overall. It is noted that the outcomes of the RTAs depend on the product which is traded and the region in which the RTA is formed. For instance, in the NAFTA and EU, for the bovine and swine meat trade, trade creation has been observed among the members while trade diversion has been seen among the non-member countries. On the other hand, in the case of the Southeast Asian nations, the RTA leads to trade diversion with no regional trade creation evidence (Karemera et al., 2015).
6.1.2 Change in Terms of Trade, Intra-union Terms of Trade and Extra-union Terms of Trade
Figure 5 shows the switch in terms of trade (intra-union and extra-union) due to the PCFTA for five major commodities. It shows that China has a positive effect in terms of trade in the commodities of ‘ores, slag and ashes’ (except 2013) and ‘cereals’. In contrast, this effect is found to be negative for the commodities of ‘raw hides and skins’ and ‘cotton’. Among the intra-union and extra-union terms of trade, the contribution in total terms is impressively higher by the extra-union terms of trade. The minimum positive value of change in terms of trade is found to be US$ 117 million (2013) for cereals, while the maximum value of change in terms of trade is recorded as US$ 8.9 billion (2016) for ‘ores, slag and ashes’. Moreover, the positive change in the terms of trade for China from the PCFTA is much higher than the negative change in 2015 and 2016. Therefore, the PCFTA significantly improves the terms of trade of China at the overall level in the years 2015 and 2016.

6.1.3 Trade Creation and Trade Diversion
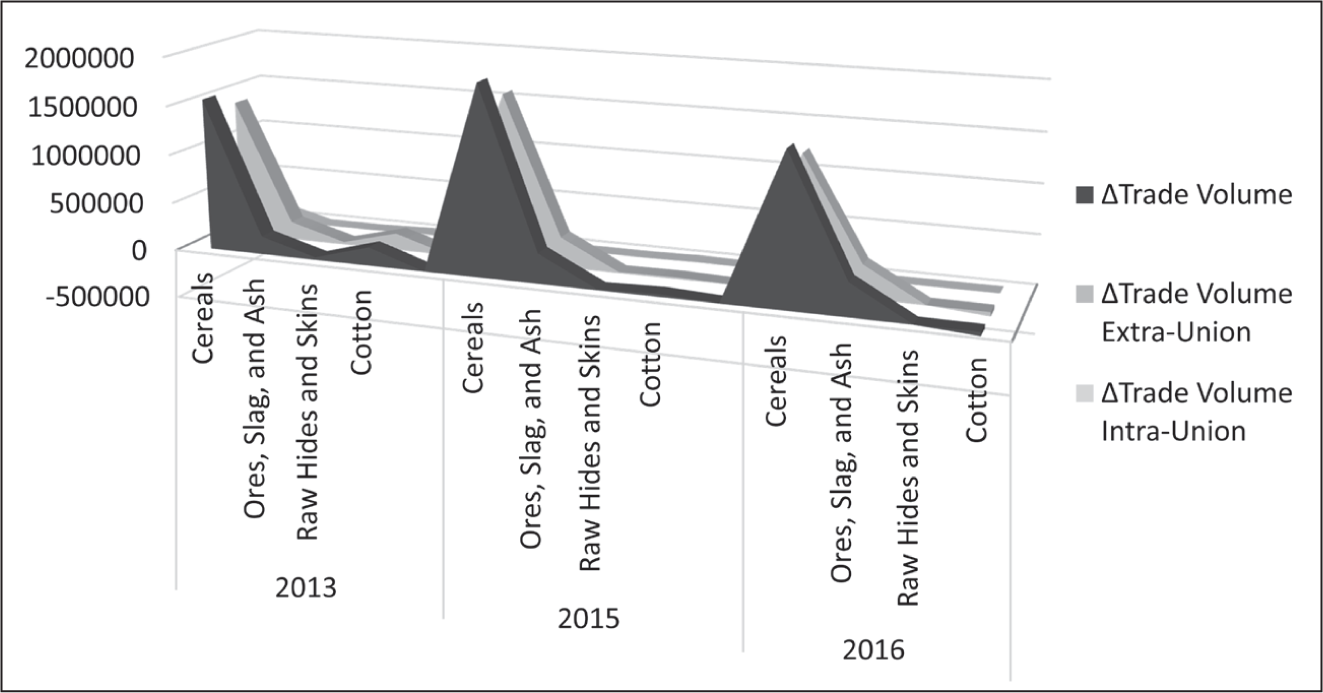
The results (Figure 6) demonstrate that after the advent of the PCFTA, trade has been created both internally and externally for China at the overall level. Therefore, at the general level, the PCFTA is more responsible for trade creation than trade diversion in China’s case. Moreover, the trade is created more externally, which shows that the PCFTA does not divert the trade of China from other countries. Specifically, the trade has more significantly been created in the commodities of ‘ores, slag and ashes’ and ‘cereals’ as compared to the other commodities. The study conducted by Pfaffermayr (2020) also favours trade creation by economic integration agreements. However, in some cases, domestic and international trade diversion was also observed, but it was low as compared to the trade creation.
6.2 Case of Pakistan
6.2.1 Change in Total Trade’s Welfare
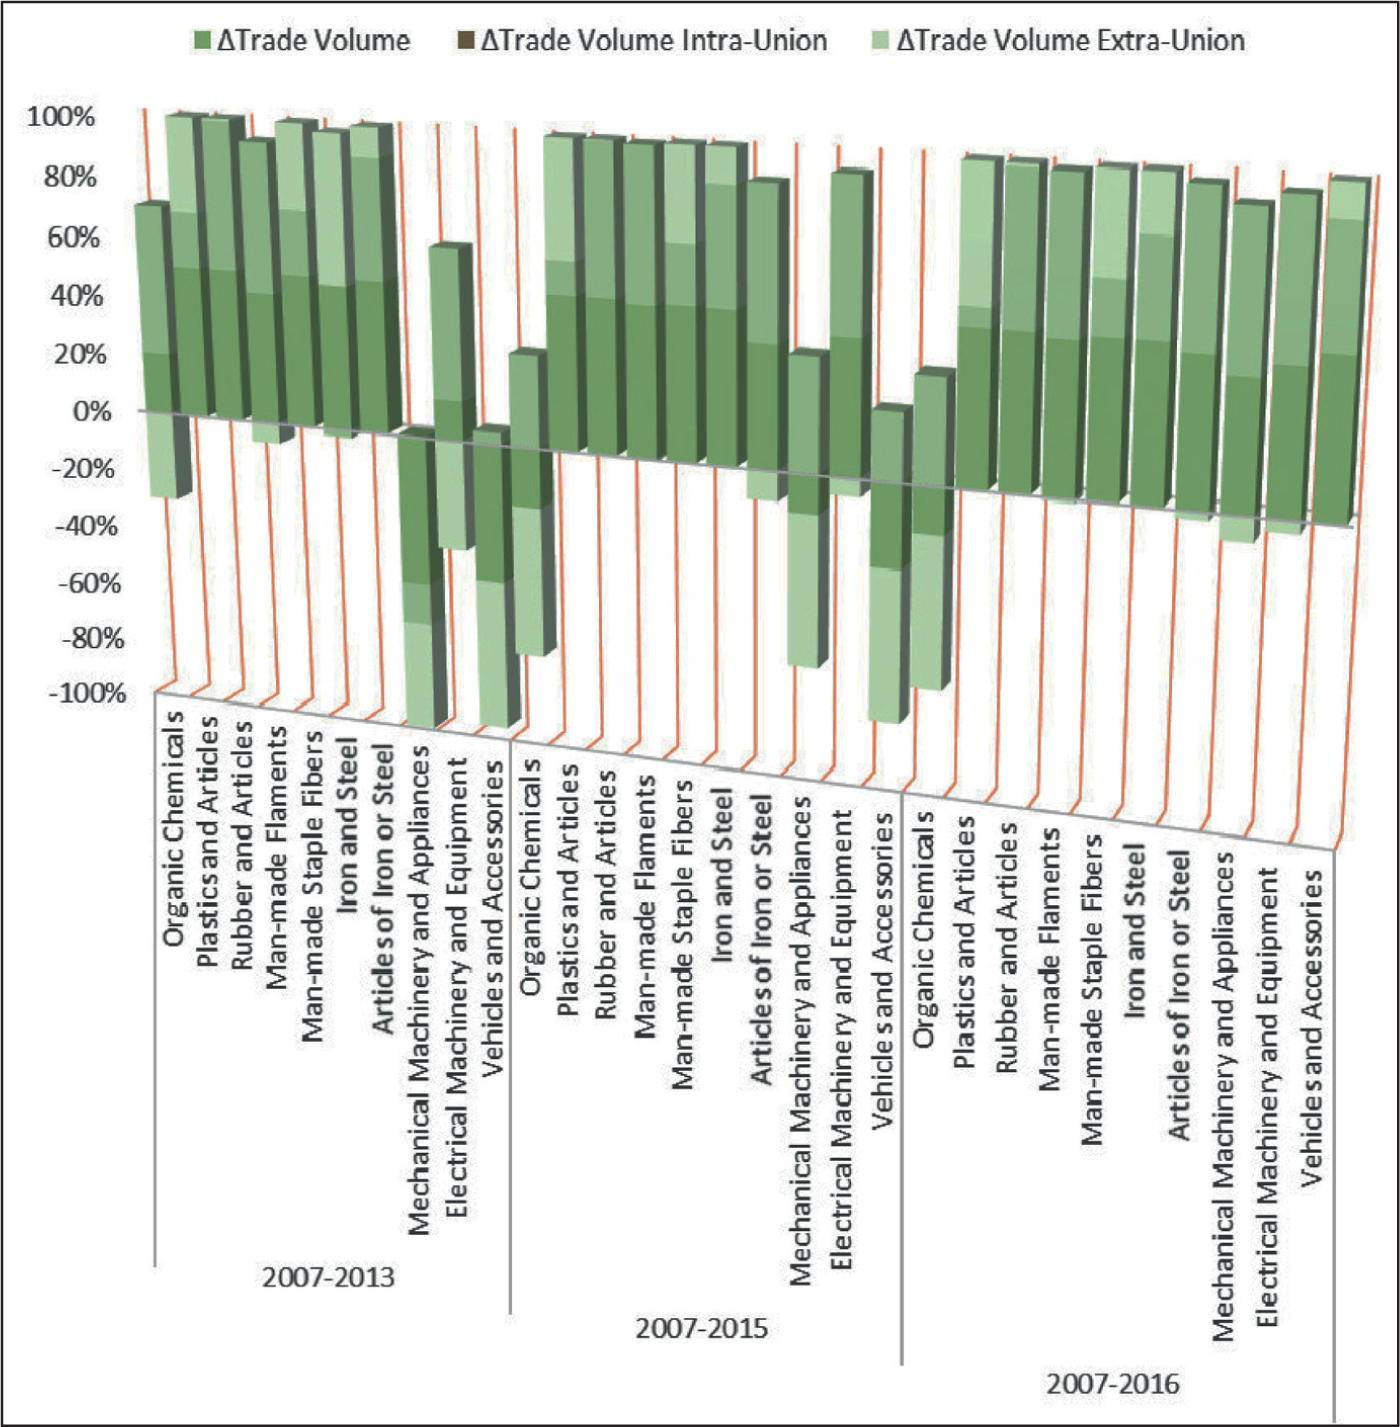
According to these results (Figure 7), Pakistan’s welfare gains from Pakistan–China FTA are positive in the commodities of ‘rubber and articles’, ‘man-made filaments’, ‘man-made staple fibres’, ‘iron and steel’, ‘articles of iron or steel’ and ‘electrical machinery and equipment’. However, after the complete implementation of the PCFTA, China experienced a welfare loss in various commodities, including ‘organic chemicals’, ‘plastics and articles’, ‘mechanical machinery and appliances’ and ‘vehicles and accessories’. Besides, the welfare gains from electrical machinery and equipment have increased more significantly as compared to the other major commodities. Also, the welfare gains by China from the PCFTA are much lower compared to the welfare losses. Therefore, the PCFTA has caused a significant welfare loss to Pakistan. Overall multilateral trade agreements tend to enhance more trade than bilateral trade agreements.

The outcome of the bilateral trade is attributed to the economic conditions of the trading partners. The bilateral trade could be improved with the real GDP of both the importer and exporter countries, while the countries’ populations negatively influence the bilateral trade. However, economic and political evolution enhances the success of economic integration in Asia (Ekanayake et al., 2010).
6.2.2 Change in Terms of Trade, Intra-union Terms of Trade, and Extra-union Terms of Trade
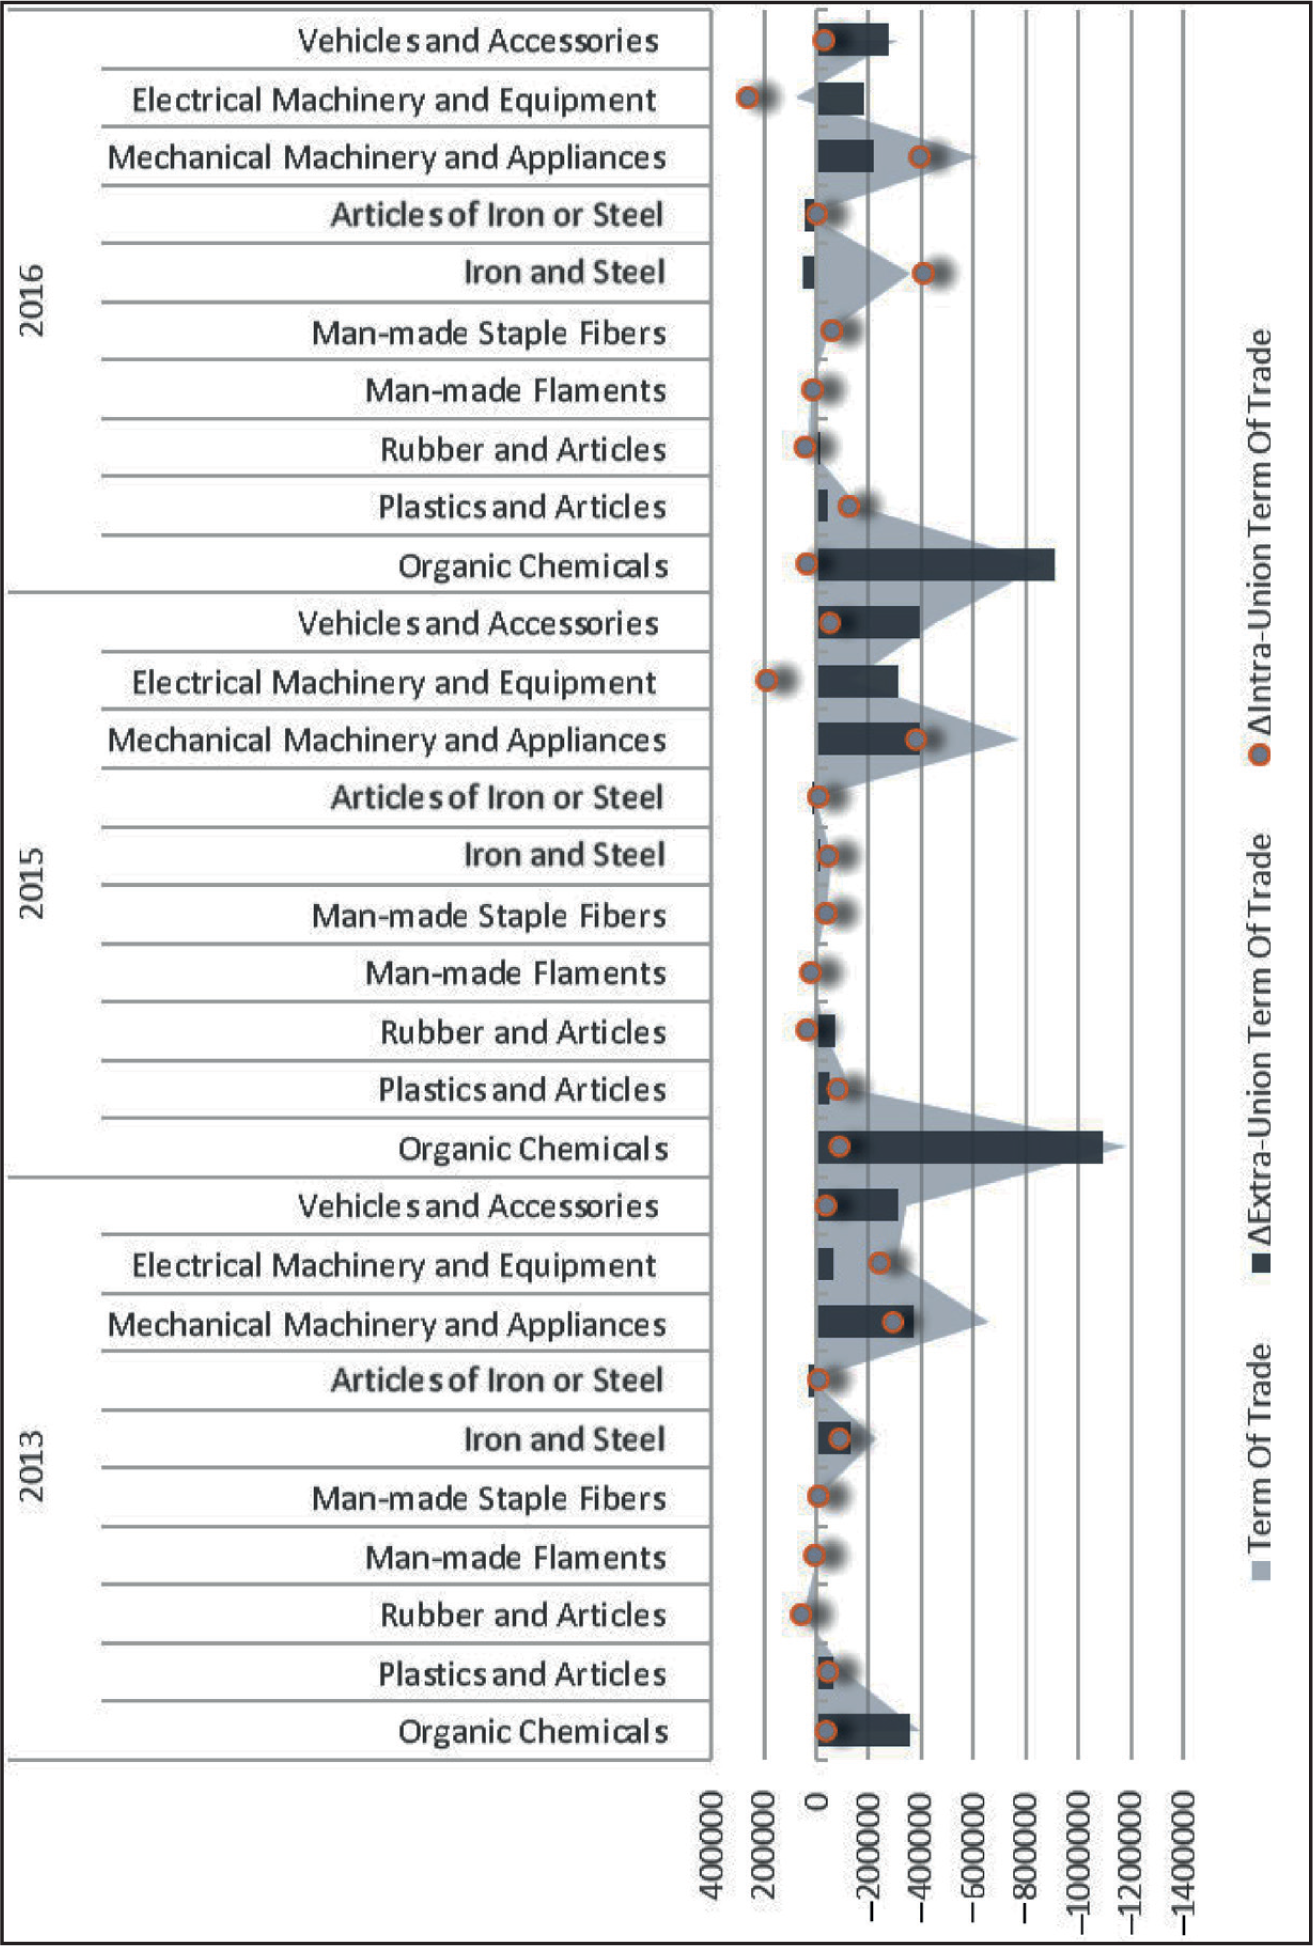
Figure 8 shows the change in terms of trade (intra-union and extra-union) due to the PCFTA for ten major commodities. It shows that Pakistan has a positive effect in terms of trade in the commodities of ‘rubber and articles’, ‘man-made filaments’, ‘iron and steel’, ‘articles of iron or steel’ and ‘electrical machinery and equipment’ on average. In contrast, this effect is found to be negative for the commodities of ‘organic chemicals’, ‘plastics and articles’, ‘man-made staple fibres’, ‘mechanical machinery and appliances’ and ‘vehicles and accessories’, Among intra-union and extra-union, the contribution in absolute terms is impressively higher by the term of trade of extra-union. The minimum positive value of change in terms of trade is found to be US$ 3.8 million (2015) for ‘articles of iron or steel’, while the maximum value of change in terms of trade is recorded as US$ 77 million (2016) for ‘electrical machinery and equipment’. Moreover, the positive change in the terms of trade for Pakistan from the PCFTA is much lower than the negative change. Therefore, the PCFTA significantly deteriorates the terms of trade for Pakistan at the overall level.
6.2.3 Trade Creation and Trade Diversion
The results in Figure 9 demonstrate that after the PCFTA, trade was created internally and externally for China at the overall level. However, more trade has been created internally than externally; therefore, at the general level, the PCFTA is more responsible for trade diversion than trade creation in the case of Pakistan. Besides, there has been a considerable amount of trade reduction in the multilateral trade between Pakistan and countries (other than China), which shows that the PCFTA impacts trade of Pakistan with other countries significantly. Specifically, the trade diversion has more significantly been found in the commodities of ‘organic chemicals’ and ‘electrical machinery and equipment’ as compared to the other commodities. Moreover, the trade creation has been majorly recorded in the commodities, ‘man-made staple fibres’ and ‘plastics and articles’.
7. The Robustness Test
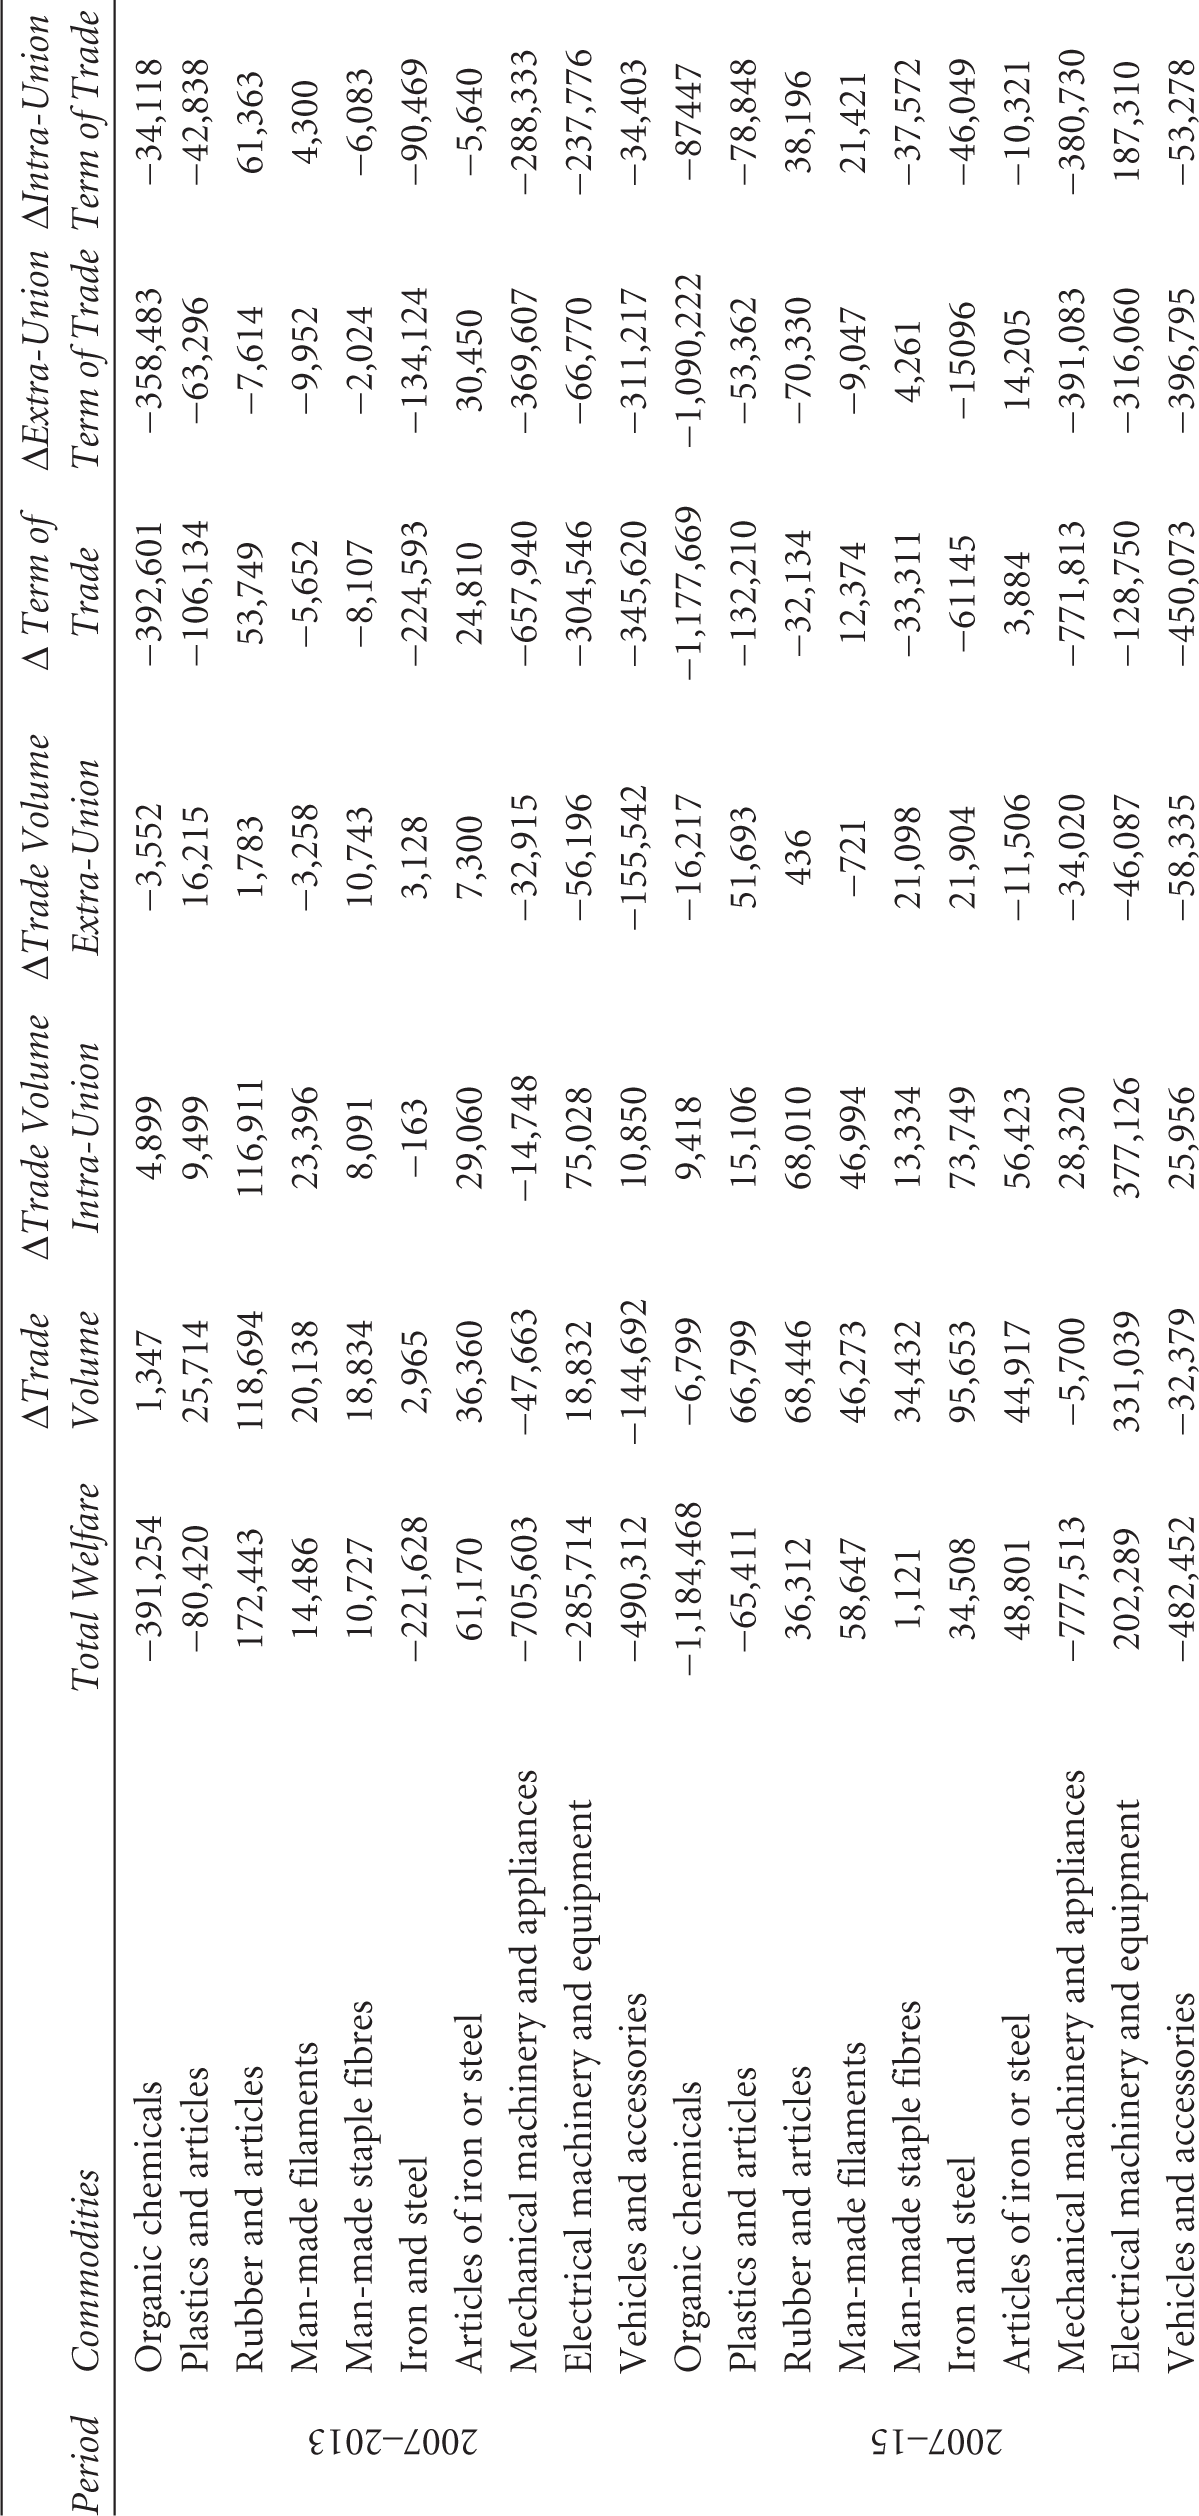
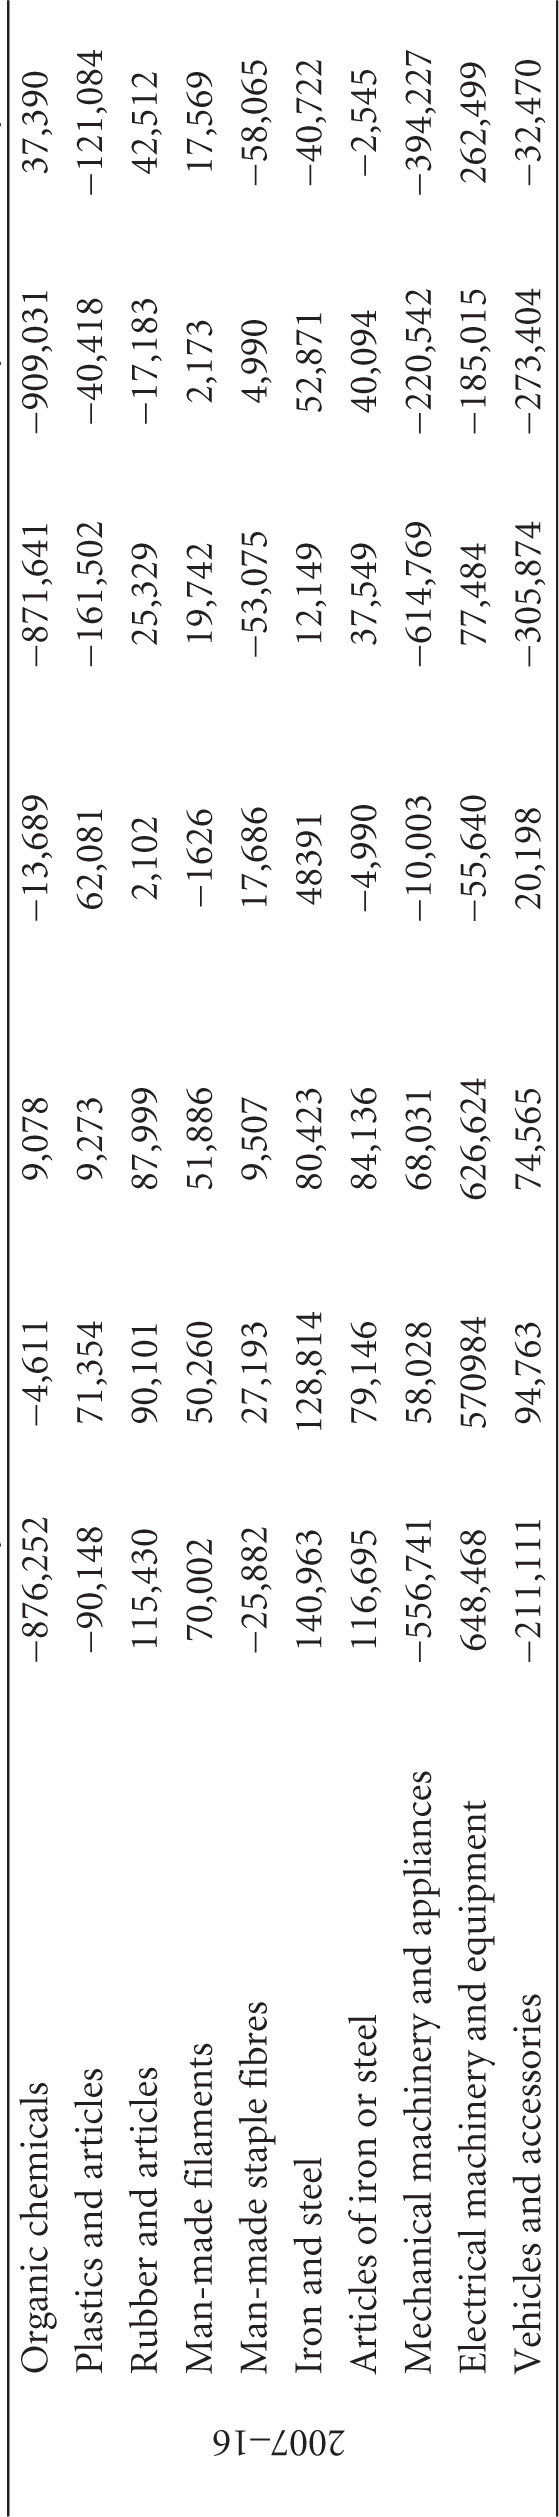
The robustness test results are expressed in Tables 4, 5, 6 and 7. Qualitatively, all the results under the robustness test are similar to the baseline estimation except for two cases. First, in the case of China, the value of change in trade volume for cotton in 2015 is found to be opposite to the baseline estimation. The main reason for this difference is the value of the extra-union terms of trade, which is much higher in the case of T2. Second, in the case of Pakistan, the value of change in trade volume for organic chemicals in 2015 is opposite to the baseline estimated value at the same position. The primary reason for this difference is the higher value of intra-union in the case of T2. However, in both cases, the results are not much different at the aggregate level of welfare; therefore, these differences can be considered insignificant.
Results of First Robustness Test under Weighted Average Tariffs in US$ Thousands (China)

Results of First Robustness Test under Weighted Average Tariffs in US$ Thousands (Pakistan)

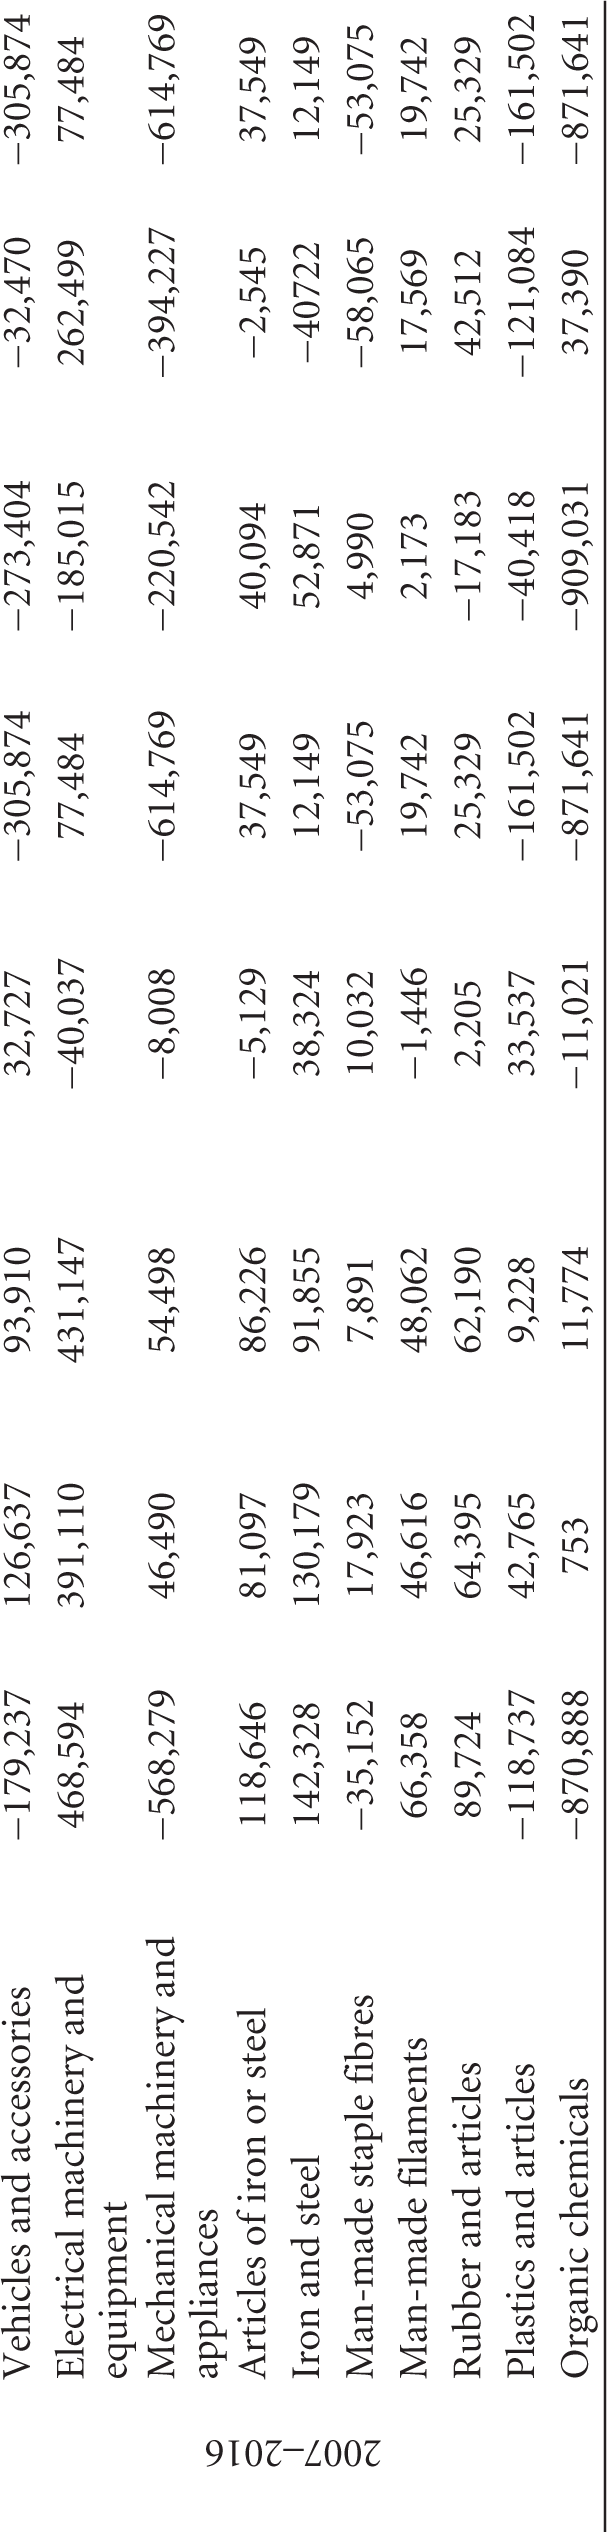
Results of Second Robustness Test under Weighted Average Tariffs in US$ Thousands (China)

Results of Second Robustness Test under Weighted Average Tariffs in US$ Thousands (Pakistan)
8. Conclusions and Policy Recommendations
The study concludes that the trade welfare increases for China and decreases for Pakistan after the complete execution of the PCFTA. Therefore, the study favours the successful rejection of the second hypothesis but could not reject the first hypothesis. Also, there has been trade creation in the case of China post the PCFTA. In contrast, in the case of Pakistan’s trade with other countries, the PCFTA is responsible for trade diversion. Consequently, the study rejects the fourth hypothesis and does not reject the third hypothesis. Moreover, there was a deterioration in the terms of trade for Pakistan after its joining the FTA at the overall level. However, the terms of trade for China improved after its joining the FTA. Thus, the study rejects the fifth hypothesis but does not reject the sixth hypothesis.
Moreover, the reduction in tariff provides a better opportunity for Pakistani products, which were not exploring the Chinese market before the advent of the PCFTA; however, Pakistan is not fully capitalising on this opportunity. For instance, the PCFTA completely reduces the tariff on ‘woven fabric (twill) or contributes to fabric’ for Pakistani exporters. Yet, the share of these exports is very low compared to the demand in the Chinese market. Pakistan enjoys zero tariffs on these products in the Chinese market; however, it still captures a very small share of the market due to the lack of regulation from Pakistan’s government. Likewise, China’s imports of marble and travertine are worth around 1.7 billion US$ per year. Pakistan enjoys zero tariffs on these products in the Chinese market; however, it still captures only a very small share of the market due to the lack of regulation. Pakistan’s government should especially design a policy that encourages the export of value-added products with lower focus on raw material exports. Therefore, Pakistan’s enterprises should focus on these commodities which are higher in terms of their value, have minimal or zero tariff and hold a higher demand in the large Chinese market.
Furthermore, China’s exports to Pakistan have increased after the complete implementation of the PCFTA. Although Pakistan is not a very huge market for the Chinese exporters, there are more opportunities for the Chinese exporters not confined to just exporting their products to the Pakistani market. The PCFTA creates a strong communication network between the business communities of both countries. China can effectively utilise this communication by establishing their production line in Pakistan. The Chinese economy is moving toward a new phase of innovation, which increases the cost of production in China. Therefore, Pakistan could be a better substitute for its product line at a lower production cost. Meanwhile, some products can be explored for exports to ensure more significant utilisation of the PCFTA.
Footnotes
Declaration of Conflicting Interests
The authors declared no potential conflicts of interest with respect to the research, authorship and/or publication of this article.
Funding
The authors received no financial support for the research, authorship and/or publication of this article.