
Abstract
This article summarizes government publications focusing on excess capacity from the 1990s to 2016 and argues that the market-oriented principle needs to be established to deal with the long-standing excess capacity issues in China.
Based on the specificity of the long-term excess capacity in China, this article puts forward the hypothesis: The excess capacity in China is derived from the enterprise’s overinvestment, and the government intervention is one of the main drivers of the problem. The intervention is actuated by the GDP-based government performance assessment through such means as offering privileges on land use, environmental ignorance, natural resource provision and financial support. This article (a) calculates capacity utilization of 30 manufacturing industries, (b) builds a ‘mediation effect model of overinvestment’, and (c) makes use of the industrial data, economic development data and capacity utilization from 1998 to 2017 to test the hypothesis.
The result shows that government intervention indeed has a significant influence on excess capacity. The support for land use and the tolerance for environmental pollution are two of the most persuasive reasons. Therefore, the Chinese government needs to make greater efforts to deepen the market reforms, standardize and improve the factor market so as to accelerate innovation, and push for industrial upgrading.
Introduction
It is widely recognized in both academia and the government that China’s excess capacity which emerged in the 1990s has become a long-term issue. 1 Since the 1990s, China has transformed from having “shortage of products” to “over production”. Taking advantage of the openness and fast-growing export, China’s foreign trade shifted from deficit to surplus, with incremental savings and investment in the national account. Simultaneously, the excess capacity turned into a huge concern, which is magnified by the recession of the economic cycle, when the long-standing product oversupply, deflation, and massive structure unemployment are facing numerous challenges.
The first round of excess capacity in China emerged in 1996. Following the undersupply of goods and panic buying of 1988 and 1992, China’s economy finally transformed from a seller’s market to a buyer’s market in 1996. However, oversupply and deflation that ensued between 1997 and 2002 led to a large number of workers being laid off, thus giving rise to heated discussions about the redundant construction and excess production capacity.
The second round of severe excess capacity took place in 2008. A sudden external demand shock brought by the global financial crisis in 2008 triggered a ¥4 trillion stimulus from the Chinese government, which to some extent alleviated the economic downturn. However, as the stimulus package was too large, the massive investment it financed created unnecessary capacity in many manufacturing sectors. In 2009, the State Council issued a document requesting to reduce excess capacity in nine sectors—steel, cement, glass, electrical aluminum, shipbuilding, polysilicon, wind turbines, coal chemical, and soybean crushing. 2 In 2013, a government document pointed out that five industries were confronted with severe overcapacity issues, namely, steel, non-ferrous metals, cement, plate glass, and shipbuilding. 3 Meanwhile, in 2013, China’s Ministry of Industry and Information Technology (MIIT) announced 19 industrial sub-sectors identified with backward production capacity, most of which had serious overcapacity problems as well. In 2014, the MIIT released another list, including 15 sectors whose industrial backwardness and excess capacity needed to be fixed.
Major Points on Excess Capacity From the CEWC Since 2007
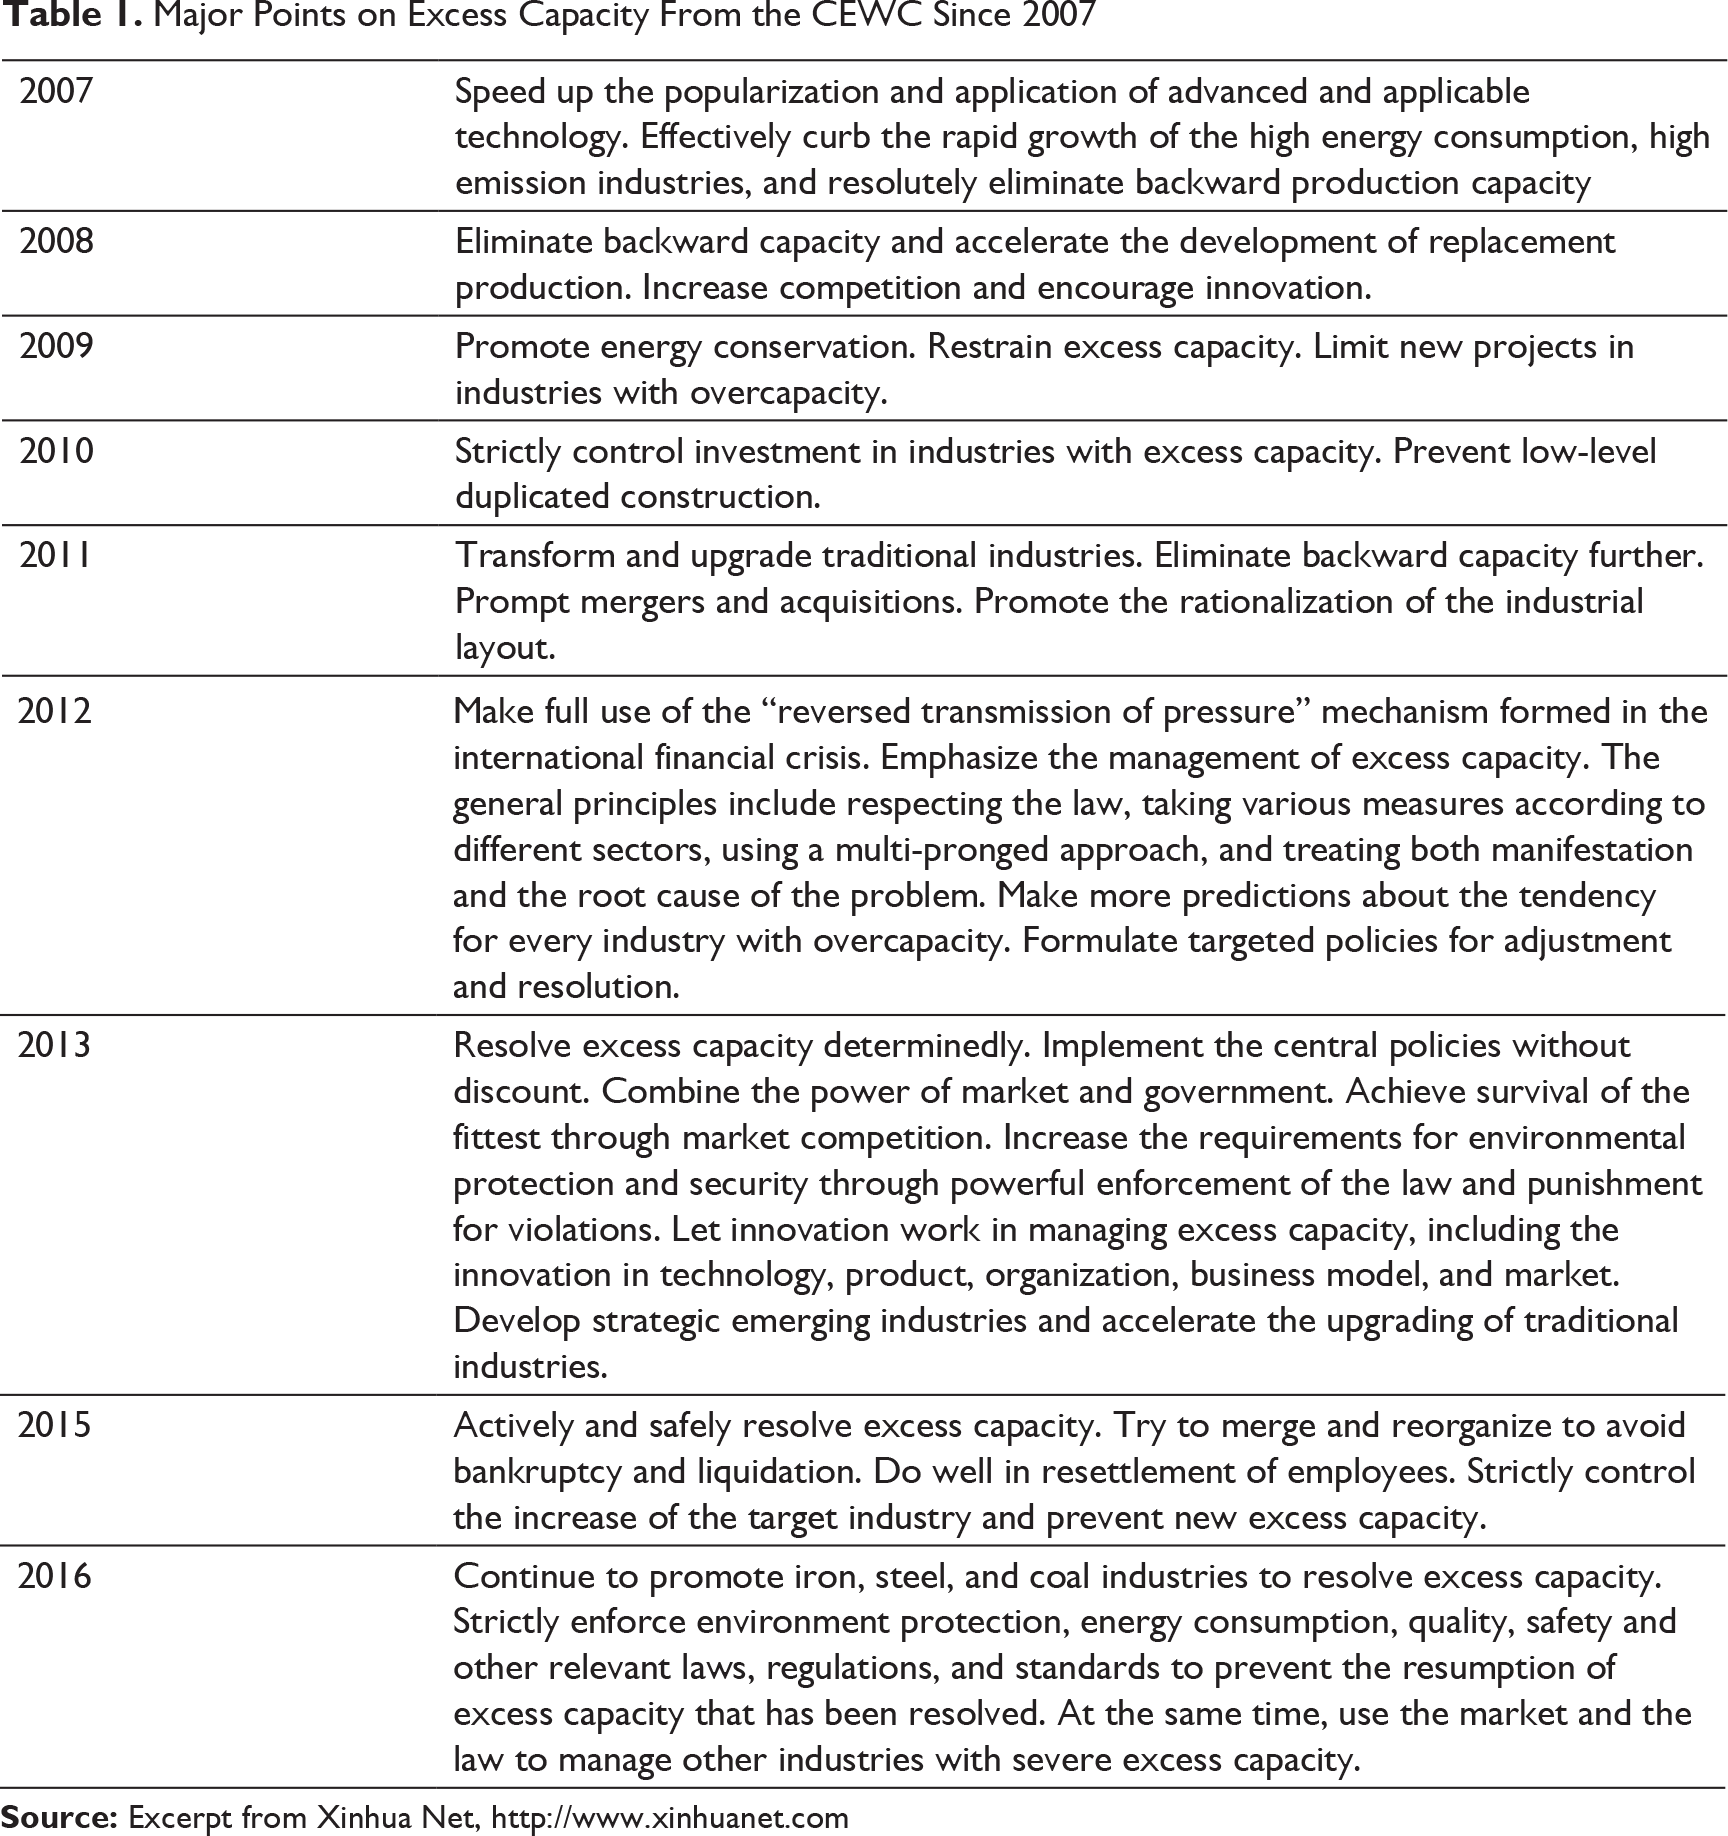
Managing excess capacity has been one of the most dominating tasks in the annual Central Economic Work Conferences (CEWC) of the government since 2007 (Table 1). It was also ranked as the most important government task formulated in the CEWC in December 2013. The conference made recommendations to deal with the problem. At the end of 2015, the supply side structural reform was put forward to reduce the pressure of the economic downturn, wherein effectively resolving the excess capacity which was also the top priority.
After two years of strict control by the government in 2016 and 2017, the excess capacity in some key industries such as steel, cement, and others had been tentatively curbed. The steel and cement industries were forced to eliminate some capacity under strict environmental protection regulations, and high standard entry permits effectively inhibited newly increased capacity. Currently, the overall profitability of these industries has recovered. However, a systematic analysis and summary of the overcapacity problem in China are still of great importance, which can provide significant theoretical knowledge and practical guidance.
On one hand, a clear understanding of the excess capacity issues, which is a unique phenomenon in China’s economic development, could help the other emerging market countries avoid detours in their industrialization. On the other hand, the excess capacity problem in China has not been completely eradicated. There are still obvious excess capacities in industries such as nonferrous metals, chemicals, and shipbuilding. Moreover, the current over-administrative measures helped curbing the excess capacity in the short term but has left unanswered questions whether they are still effective in controlling the reappearance of excess capacity in the medium-to-long term. 4
Basic Concepts and Discussions
Empirical and Theoretical Definition of Excess Capacity
It’s not easy to come up with an accurate definition of excess capacity. Drawing from the previous empirical studies, we define excess capacity as a phenomenon where the surplus capacity in the industrial sector exceeds beyond the market demand irrationally, with a decline in the price and profit, leading to sustained losses.
From the perspective of economic theory, the excess capacity can be studied as a microeconomic phenomenon, targeting the specific products and sectors. In view of the enterprise, the excess capacity means that its output is sharply below the real capacity; in other words, the capacity utilization is relatively low. But the key point lies in how to define and measure the capacity in a certain enterprise. Some economists suggest taking the enterprise’s optimal output as the capacity (Berndt & Morrison, 1981), which is exactly the lowest point of the U-shaped short-term costs curve. If the enterprise can produce at that point, its capacity utilization is 100 percent. The rate of capacity utilization is, therefore, the ratio of real output and the optimal output.
The lowest point in the U-shaped curve is widely accepted, but there is no available statistical indicator that can correspond to it. Another index that is easier to obtain is the maximum output. Thus, a large amount of academic literature defines the maximum output as the capacity; therefore, the rate of capacity utilization is defined as the ratio of actual output and the maximum output. This ratio based on the optimal output (if it’s achievable) is larger than the one based on the maximum output.
A Microeconomic Problem More Precisely
Before further analysis, we need to clarify the relationship between excess capacity and insufficient aggregate demand. Insufficient effective demand hypothesis is the origin of the modern macroeconomics and the theoretical basis of the modern macroeconomic policies. However, the excess capacity seems to stand in the position of insufficient aggregate demand, which brings us into thinking whether the discussion of excess capacity is indeed the discussion of insufficient effective demand. Furthermore, is it the lack of effective demand that results in excess capacity? Meanwhile, does managing the excess capacity mean managing the lack of effective demand?
Apparently, the answer is ‘no’. The greater aggregate supply than demand means insufficient aggregate demand instead of excess capacity. These two terms have an essential difference in the understanding of the modern macroeconomic system as well as Marxist political economics. Summarized from the existing literature (Lu, 2009), on the basis of macroeconomic balance, the excess capacity and inadequate capacity are able to coexist. Therefore, the excess capacity problem is a sectoral and microeconomic issue rather than an overall and macroeconomic one.
From this point of view, excess capacity is not a periodic problem resulting from fluctuations of demand and output. Rather, it is a structural problem that is inherent to some industries or sectors. To some extent, this standpoint also explains the paradox where the long-term slower economic growth and excess capacity could exist side by side. The former is a macroeconomic problem of overall equilibrium while the latter is an industrial problem of partial non-equilibrium. In addition, we can also conclude that the investment–consumption structure change from the demographic dividend, which could influence the equilibrium in the macroeconomic fundamental, has no systematic and sustainable impact on the excess capacity.
In all, excess capacity is a microeconomic problem instead of a macroeconomic one. Therefore, managing the excess capacity requires that the market plays a decisive role in resource allocation, which reckons on the structural reform but not the aggregate demand management like the “4 trillion stimulation”.
The Impact on the Macroeconomy
However, as a sectoral and microeconomic issue, the influence of overcapacity on the macro level is too significant to be ignored.
A macro-level estimate of overcapacity arouses lots of controversies. Unlike the Federal Reserve that regularly releases the average capacity utilization data of the USA, the Chinese authority has reported the relevant data sporadically. The International Monitory Fund (IMF) conducted a special report on Chinese capacity issues in its 2012 Paper IV consultation and published a chart of the Chinese average capacity utilization rate, estimated at approximately 60 percent (IMF, 2012, ##p. 8). Compared to the USA, China was in severe excess capacity, which raised grave concerns about the Chinese economy.
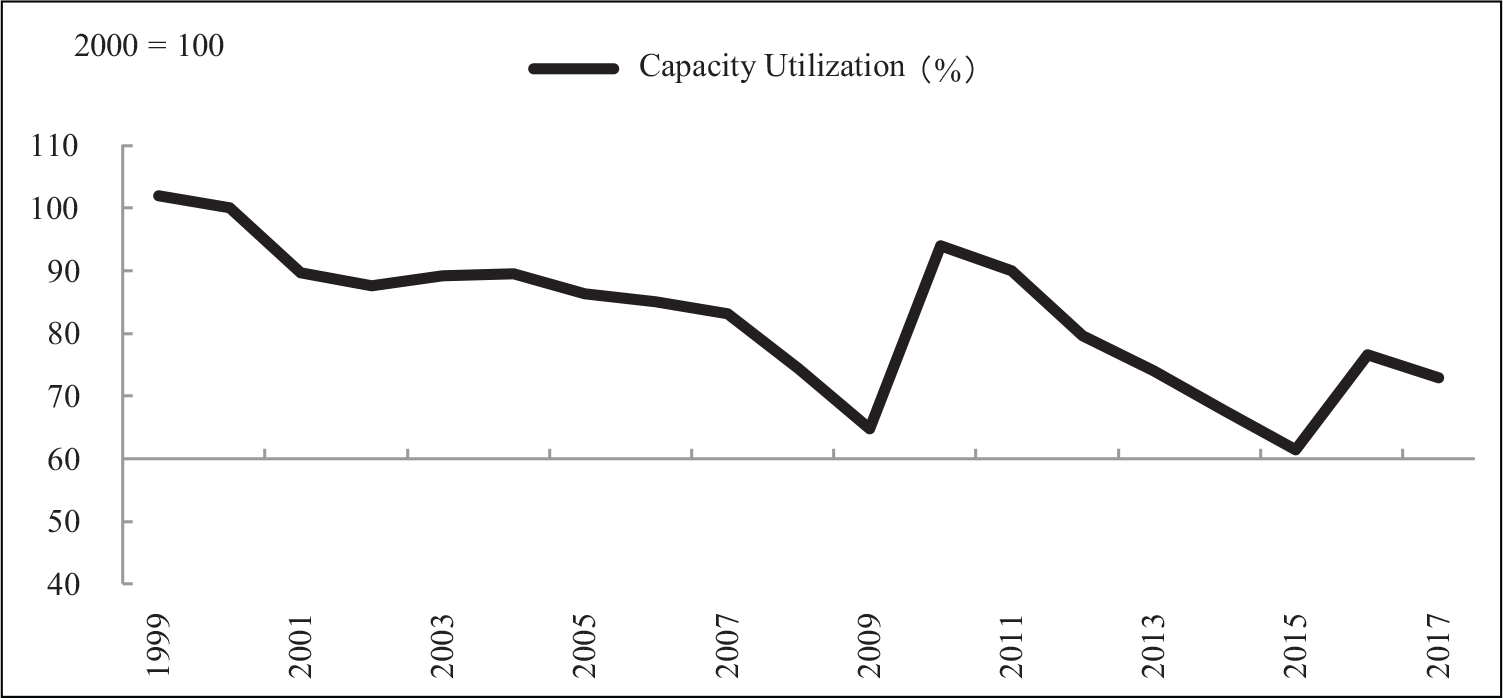
To clarify the industrial capacity utilization of China from overall perspective, we can use the electricity consumption to simulate output and utilize fixed capital formation to substitute capacity utilization so that we can trace the trends in capacity utilization. The study finds that the years 2008 and 2009 were near the lowest growth years of industrial electricity consumption but also near the highest growth years of fixed capital formation. It brings about a significant drop in capacity utilization index for the first time during the last decade (as demonstrated in Figure 1). Apart from the continued expansion of aggregate demand in the following two years, total capacity was largely escalated accompanied by the rapid growth of investment. The result was that real capacity utilization showed a sustained decline. This article estimates that capacity utilization at the end of 2015 was only 61.5 percent, falling to the lowest level in history.
As the capacity utilization declines sharply, the supply and demand sides of the market also undergo a significant change, having a direct impact on macroeconomic indicators. For the entire economy, demand continues to outpace supply in the instance of excess capacity. Besides, the implementation of a nominal price system makes it difficult to quickly reconstruct. Clearly, the growth of Chinese nominal GDP remained low in 2012 and 2015, the reason lies in the continued control of huge capacity in some of the sectors.
Reasons for Excess Capacity
The phenomenon of excess capacity has often confused the market as well as the scholars. If the market works, long-term overcapacity should never appear. Otherwise it indicates that the market has been in failure for a long time, which cannot be explained theoretically.
Conventionally, there are two possible ways to explain the paradox. First, the phenomenon of excess capacity is not widespread throughout the manufacturing industry, but only in a limited number of industries which tend to decline in the economic transition.
Second, the market mechanism may be distorted in some ways, which leads to oversupply in the long run. Experience from other countries suggests that the cycle from the rapid growth of investment that creates capacity to the recovery of capacity utilization is normally 3–4 years, which means that excess capacity caused by cyclical factors can be fixed by the dynamic market mechanisms.
Yet, the real situation in China is dramatically different. On one hand, the phenomenon of excess capacity is widespread in manufacturing industries. The severe excess capacity industries mentioned in government documents consist of nine large industries. MIIT also announced 19 sub-sectors with excess capacity. On the other hand, from the second half of 2011 to the year of 2017, China’s excess capacity has continued for almost 6 years. Therefore, we believe that the excess capacity in China is caused by the failure of the market mechanism.
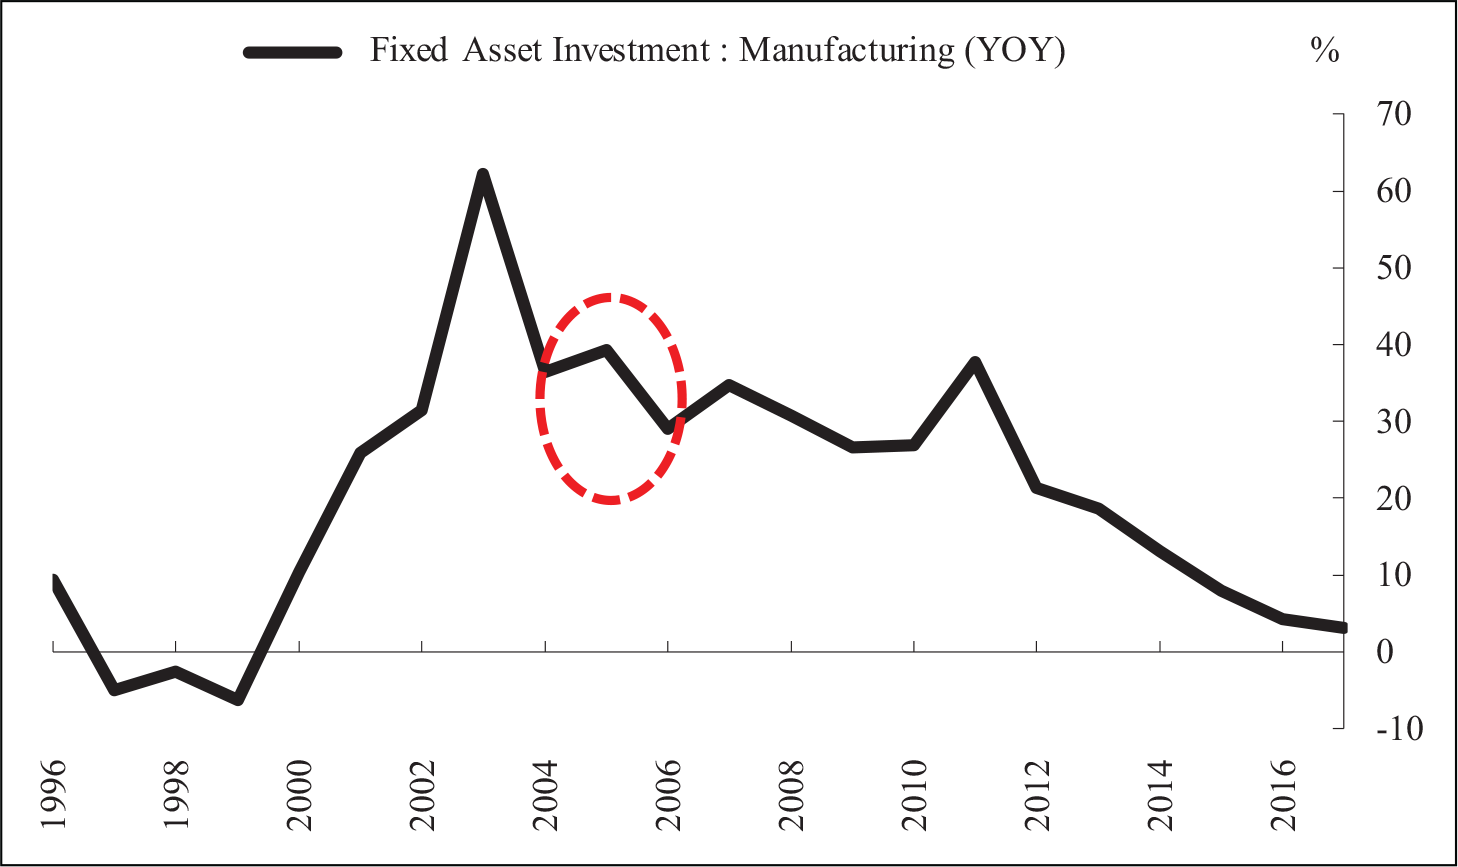
It is essential to distinguish the overcapacity in Chinese manufacturing from the periodic problem and the insufficient effective demand. It also indicates that we shall not disentangle it with the macro-control focusing on the stimulation measure to treat it as the lack of effective demand. In reality, the excess capacity now in China is mainly due to the stimulation plan implemented by the government after the global financial crisis in 2008. The capacity of the problematic industries nowadays mainly was created by the “4 trillion stimulation”, as indicated in Figure 2.
Another explanation for this problem is the transition of economic structure. This view (OECD, 2002, pp. 14–16; Nezu, 2013) argues that with the change of population and economic structure, the demand for capital goods industry would be insufficient and the problem of overcapacity would become conspicuous.
Since the 1990s, a large number of the surplus rural labor force had moved to the cities. The young population and the process of urbanization led to rapid increase in savings rate which subsequently increased investments. Thus, infrastructure construction and real estate development became pillar industries in China. However, in the recent years, the demographic change from rapid aging resulted in an increase in consumption rate but a decrease in savings rate, thus retarding the investment demand and resulting in excess capacity in relative industries. These studies indicate that it is the demographic change in China that leads to an increasingly serious excess capacity problem. As the demographic dividend diminishes, the capacity structure no longer meets the low demand for investment and capital formation. More importantly, with the periodic excess supply in the real estate industry, excess capacity appears to be a greater influencing factor in hurting the economy.
In this article, we argue that the economic structural adjustment driven by the demographic change has exacerbated the problem of excess capacity in some industries. However, this hypothesis of economic transition led by demographic dividend change has an inherent flaw. If this interpretation could explain the current excess capacity issue, how could it be possible to explain the excess capacity before the transition took place? China has benefited from the demographic dividend since the 1990s, which is also the time of the beginning of excess capacity. Therefore, this hypothesis of economic transition cannot give a general and appropriate interpretation of China’s excess capacity issue.
So, we tend to believe that the excess capacity in China is due to the failure of market mechanisms. However, there are three common misinterpretations that still need to be clarified.
First, monopoly leads to excess capacity. Some fully competitive industries are also affected by excess capacity, such as steel, cement, photovoltaic, etc. Economic theory shows that monopoly manufacturers often limit the supply to get excess profits, which is contrary to the actual observation that these industries are often suffering a profit loss. This explanation is found untenable in China.
Second, the irrational investment of state-owned enterprises causes excess capacity. Data indicates that the rapid growth of overcapacity comes mostly from the private sector instead of the state-owned sector. The growth of investment from the private sector is much higher than the state-owned sector. In the industries dominated by the state-owned sector, such as oil and telecommunications, there is actually a certain degree of insufficient capacity, instead of excess capacity.
Third, local protectionism leads to excess capacity. Local protectionism is the policy of imposing duties or quotas on imports in order to protect home industries from external competition. These policies once prevailed in China. However, local protectionism has basically not been a problem since the turn of this century. Chinese main products have achieved the unified market nationwide with the improvement of basic facilities, construction, and market mechanism, leaving no change for the local government to attain the market segmentation.
So, which factors lead to serious excess capacity in some industries in China? And how the role of the market mechanism is eliminated? Lin et al. (2010) offer the theory of investment wave phenomenon to explain the problem of excess capacity. Inspired by their perspective from the microeconomic level, this article argues that the rational investment decision of enterprises is possibly intervened by some irrational factors. Through the analysis, we find that the Chinese local government generally has a strong motivation and capability to intervene in enterprises in terms of investment promotion.
So, we here provide a universal hypothesis: Interventions from the government lead to overinvestment and excess capacity.
Government Interventions Affected by Certain Institutional Factors
There are three factors that lead to the intervention from the government to facilitate enterprise investment.
First of all, the performance of the local officials is determined by the local GDP, which can be increased effectively by local investment. Thus, the local government is strongly inclined towards pursuing extra investment. This preference leads to duplicative investments in China (Zhou, 2004).
Second, local governments have strong motivations for employment growth and social stability. This aspect hinders the exit of unprofitable companies, thus reducing the likelihood of market clearance. In addition, various subsidies encourage the establishment of new enterprises, leading to excess production capacity (Zhou, 2005).
Third, the tax system dominated by indirect tax is another impetus for enlarging the investment scale. The indirect tax charging on production, circulation, and sales, is decided by the economic scale instead of the economic profit. The main indirect tax, sales tax, is nearly fully reserved for the local government. That is the reason why the local government is concerned more about capacity expansion rather than the enterprise profit (Xi et al., 2017).
These institutional factors are unique to China, making excess capacity in the country even more complicated. This article evaluates that institutional factors (especially the intervention from the local government to the enterprise investment) are important causes for excess capacity. Therefore, the hypothesis is set as “The enterprise overinvestment originates from the government intervention,” which will be tested by the empirical data.
Investment of Enterprises Influenced by the Local Governments
Generally speaking, government interventions fall into two categories. One is positive and supportive, such as subsidies and government procurement, while the other is negative and inhibiting, such as strict market access, price limits, and salary standards (Wang & Ju, 2012). The political subsidy twists the market factor price, holding down investment costs and resulting in excess capacity. Therefore, the sectors with more subsidies and support are prone to face excess capacity.
To encourage more investment from enterprises, the government often favors their local businesses in ways such as a low-cost supply of industrial and commercial land, high tolerance of environmental pollution, and special discounts for water and energy use. At the same time, lacking independence, commercial banks have to comply to the instructions of local governments and give companies priorities and support in credit and financing. Certain flaws in institutions, such as deficiencies of environment protection, land usage protection, the independence of financial credit, and the soft fiscal budget constraint, enhance the capability of local government to increase the enterprises’ investment.
Mechanism of Local Government Intervention on Excess Capacity Through Enterprise Overinvestment
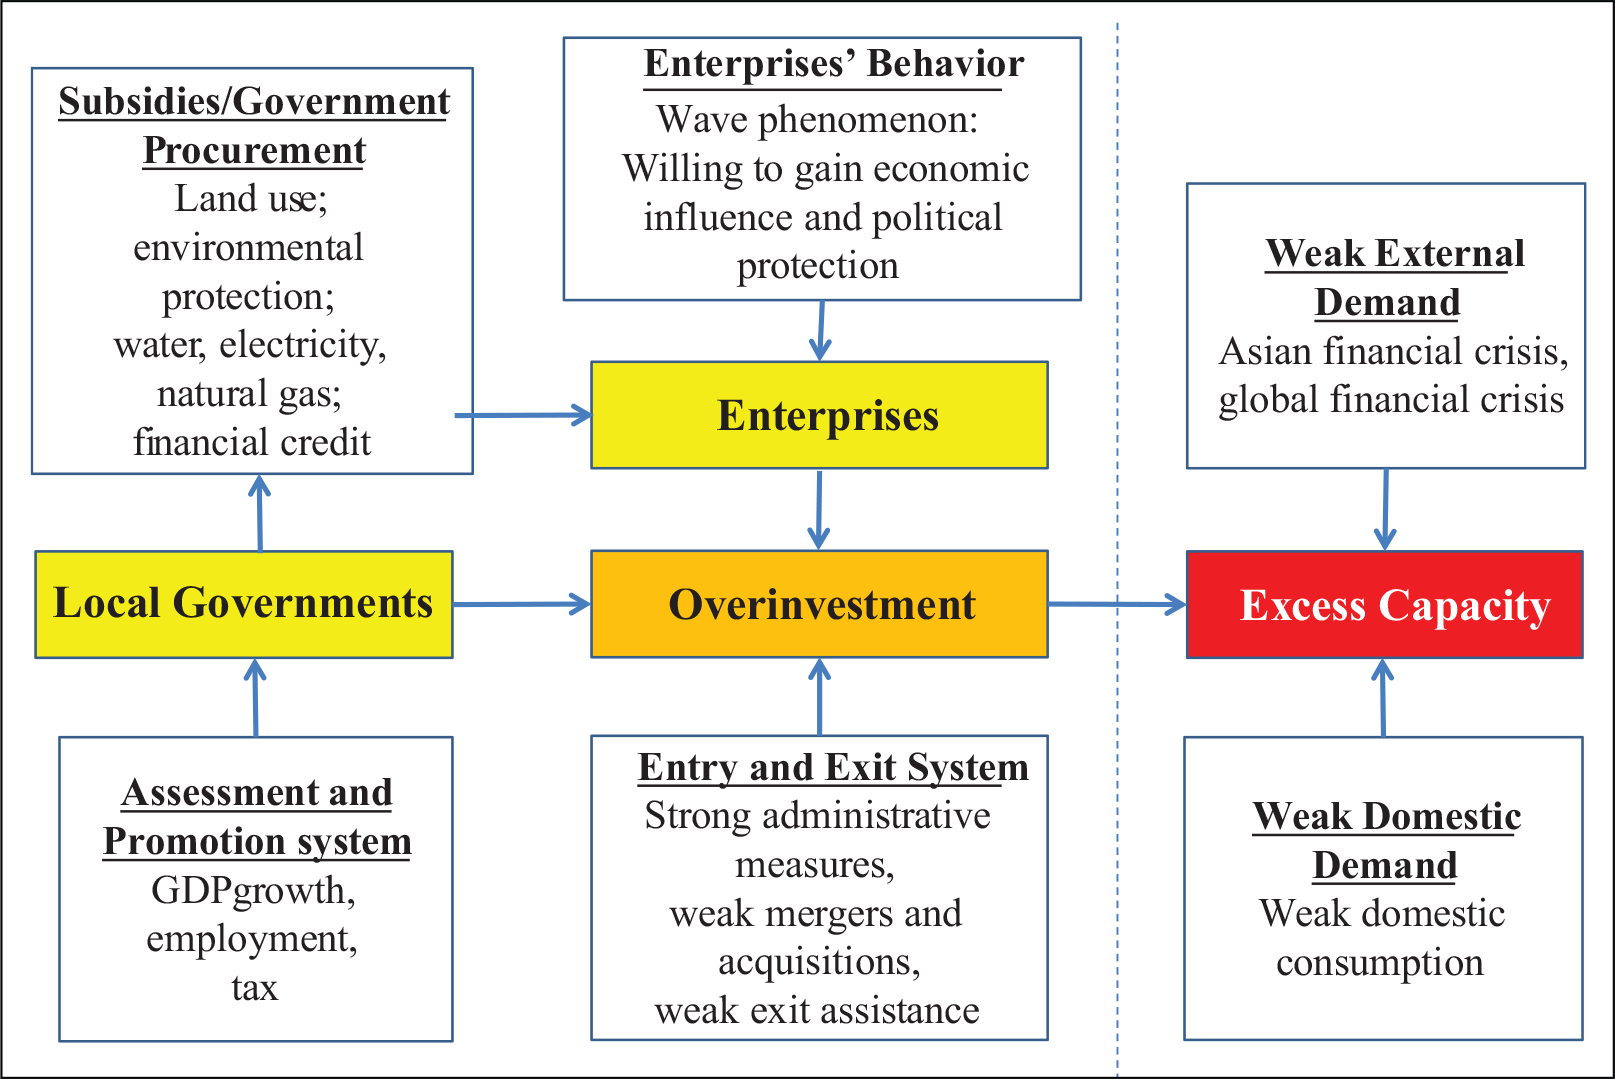
As a result of government intervention, the political subsidy twists the market factor price, holding down investment costs. Meanwhile, enterprises depend much on the local government. For the state-owned companies, the managers burdened with the heavy load of diverse performance matrices are willing to cooperate with the local government for the sake of convenience. As for private companies, they are eager for political protection. Thus, the overinvestment is a consequence of collusion between the local government and the local enterprises (Figure 3).
Metrological Inspection to the Hypothesis
Models and Methodology
This section further verifies that the local government’s intervention in the company’s investment plan eventually leads to excess capacity in the industry. So, this article presents three models, based on which empirical analysis on excess capacity is taken to test the mechanism of overinvestment working through the government intervention.
The model to measure capacity utilization. First, we need to calculate the capacity utilization of the manufacturing industries to prepare for the present study. The enterprises overinvestment model. The excess capacity originates from the enterprise overinvestment. Therefore, we need to verify whether overinvestment exists and measure the degree of overinvestment. Mediation effect model of government intervention and enterprise overinvestment. Among the intervention policies, we need to figure out which government intervention has a direct influence on excess capacity. Taking into consideration that enterprises’ overinvestment is the direct link leading to overcapacity, this article chooses the level of overinvestment as the intermediate variable of overcapacity. Drawing from Xie and Ye (2014), the mediation effect model is taken as shown in Figure 4.
Here, X refers to government intervention, Y to the excess capacity, M is the enterprises’ overinvestment, c represents the total effect of government intervention on excess capacity, α is the effect of government intervention on enterprises’ overinvestment, c’ the effect of government intervention on excess capacity when the mediating factor overinvestment is controlled, δ represents the effect vectors of control variables, and ε is the error terms. The mediating effect is measured by the difference between c and c’ (c – c’).
The Measure of Capacity Utilization in Manufacturing Industry
The capacity utilization data from the MIIT is incomplete because the MIIT’s investigation is partial. The data from industry associations is based on their measurement or subjective survey. For the integrity and comparability of the discussion, we will first measure the capacity utilization of the whole industry based on the micro-definition mentioned before.
Drawing from previous studies (Han et al., 2011; Nelson, 1989; Shen et al., 2012), the methods in measuring excess capacity can be categorized in three ways: peak-to-peak, least variable costs (VCs), data envelopment analysis (DEA). The result of peak-to-peak is based on the peak value we choose to take, which may lead to inaccuracy of the result. The DEA only recognizes industries with high fluctuation of overcapacity performance. So, the result of DEA is incomplete.

Therefore, this article chooses to take the least VCs method to measure the capacity utilization in main industries. In addition, this article also takes the cost function to measure the capacity utilization as it can take into account all factors input during the production process and use the factors input price to figure out the production costs value. The involvement of cost function will show the influence of product factors input and factors price on the capacity output.
In the long run, production factors are adjustable to achieve optimal production scale in a firm; while in the short run, some specific factors are set to be fixed. For instance, the capital stock cannot be easily increased or decreased to adapt to market changes, the actual output will be different from the optimal output scale, which is defined as the capacity output, measuring the level of output where the long-term average cost curve is at its lowest point. To measure the difference, the capacity utilization rate is defined as the ratio of actual output and capacity output (Cassels, 1937; Hickman, 1964). Meanwhile, we can confirm that in the short run, the capacity output is determined by the capital stock, which comes up as the lowest point of total cost in the short run.
Referring to Berndt and Morrison (1981), in the following equation, we define Y as the output, V as the input vector, F as quasi-fixed input vector (which is constant in the short run, variable in the long run), so the production function is defined as

Assuming the producer always pursues the maximized profit, which means that average cost in the short run is minimized. Meanwhile, the optimization is subjective to market constraints, technical constraints, and more importantly, the quasi-fixed input constraints. We assume that the constant returns to scale in the long run, and capital K is the only quasi fixed input, and define K as capital stock, as incremental capital, pj as the price of the variable input j, t as technology progress. The function of the producer’s VC in the short run is as follows:

And we define pk as the price of rent capital. The producer’s short-term total cost (STC) is as follows:

The first-order condition of K is

The capacity output Y* will be reached when the short-term average cost is at the lowest point:

As defined, the capacity utilization rate

The coefficients of K, , pj, pk and t need to be calculated before getting the Y*.
Standardize the VC function with respect to the price of labor 
Where,
And assuming labor (L), energy (E), and raw materials (M) as variable inputs, capital (K) as quasi-fixed input, the VC function standardized by labor price can be written as:

In order to compute CU, a clear VC function is required. Denny et al. (1981) and Garofalo and Malhotra (1997) have discussed the advantages and disadvantages of various cost functions. According to the above mathematical derivation and the practice of Chinese scholars (Han, et al., 2011; Shen et al., 2012;), we choose to use the function form of VC recommended by Denny et al. (1981). Therefore, Equation 7 can be rewritten as
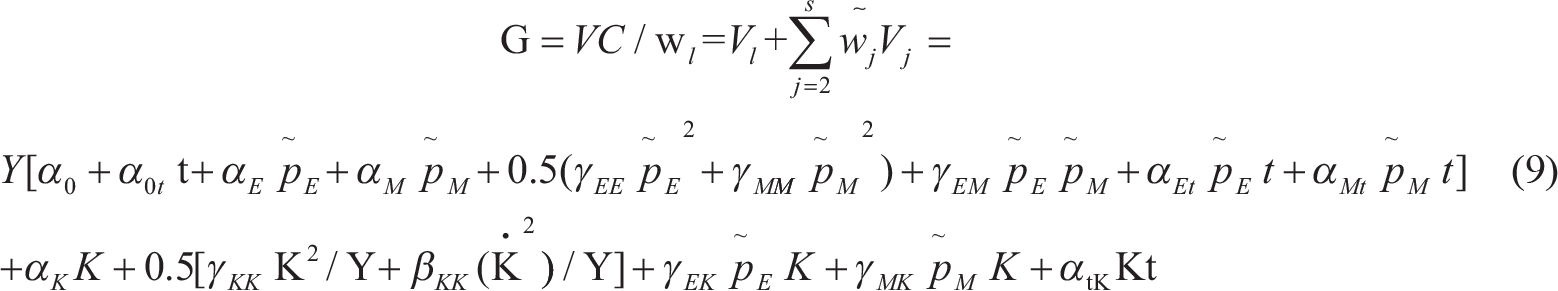
Substitute Equation 9 to Equation 4, we get

By solving Equation 10, capacity output Y* is expressed as follows:

To get capacity utilization, the key point is to get Y* by estimating the coefficients in Equation 11, which are
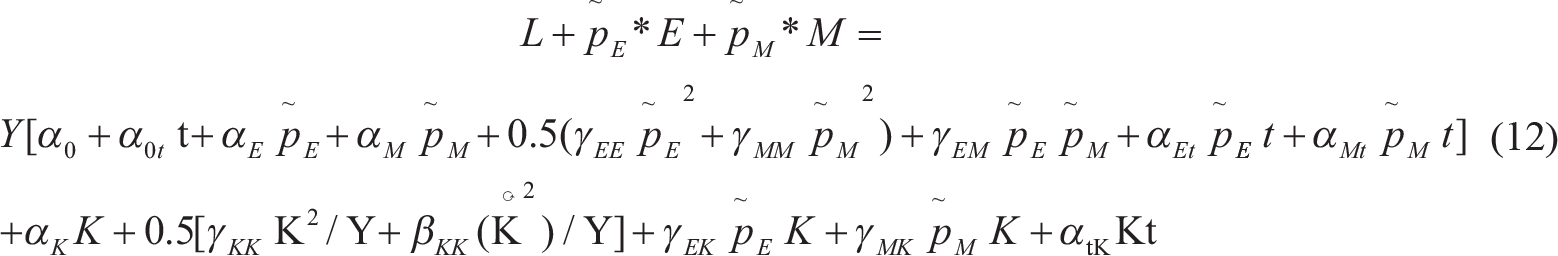
Based on the definition, Equation 9 is the same with Equation 8. Therefore, we can estimate the key coefficients by the Equation 12:
Here we select 30 manufacturing industries in China. The length of the panel data is from 1998 to 2017. The relevant indicators are verified as follows, data is from CEIC and Wind database. And the statistics introduced are as below:
Capital stock (K): industry’s net value of fixed capital Price of capital (pk): original value of fixed assets, excluding real interest rate, capital depreciation, and inflation lost, standardized by price of labor Labor (L): industry’s annual average number of employed personnel of enterprises Price of labor (pL): industry’s average wage of labor, standardized by price of labor Energy input (E): industry’s consumption of energy by million tons of standard coal Price of energy (pE): prices of thermal coal, discounted to standard coal, then standardized by price of labor Raw material input (M): industrial production—value added of industry (AVI) payable VAI tax—energy input Price of raw material (pM): classified the 28 sub-sectors by PPIRM’s (Purchasing Price Index of Raw Material, Fuel and Power) 7 sub-index, then standardized by price of labor Output (Y)t: VAI Technical progress (t): presented by t (time)
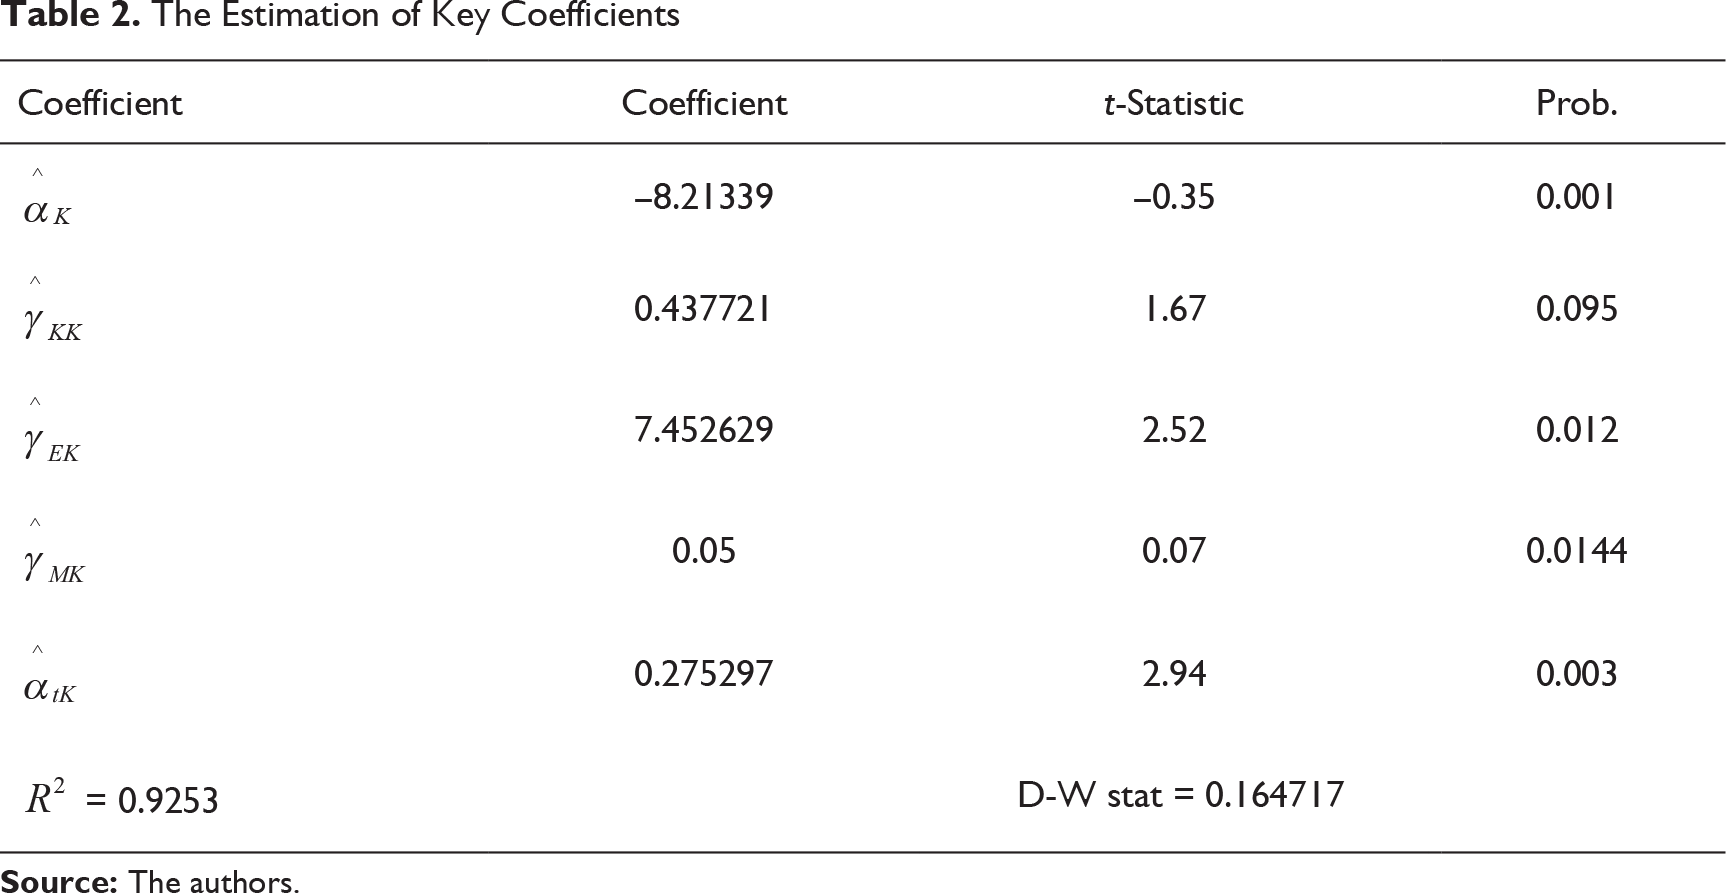
Generalized method of moments (GMM) was used to estimate Equation 2 and Equation 5 and obtained key coefficients which are shown in Table 2.
The Estimation of Key Coefficients
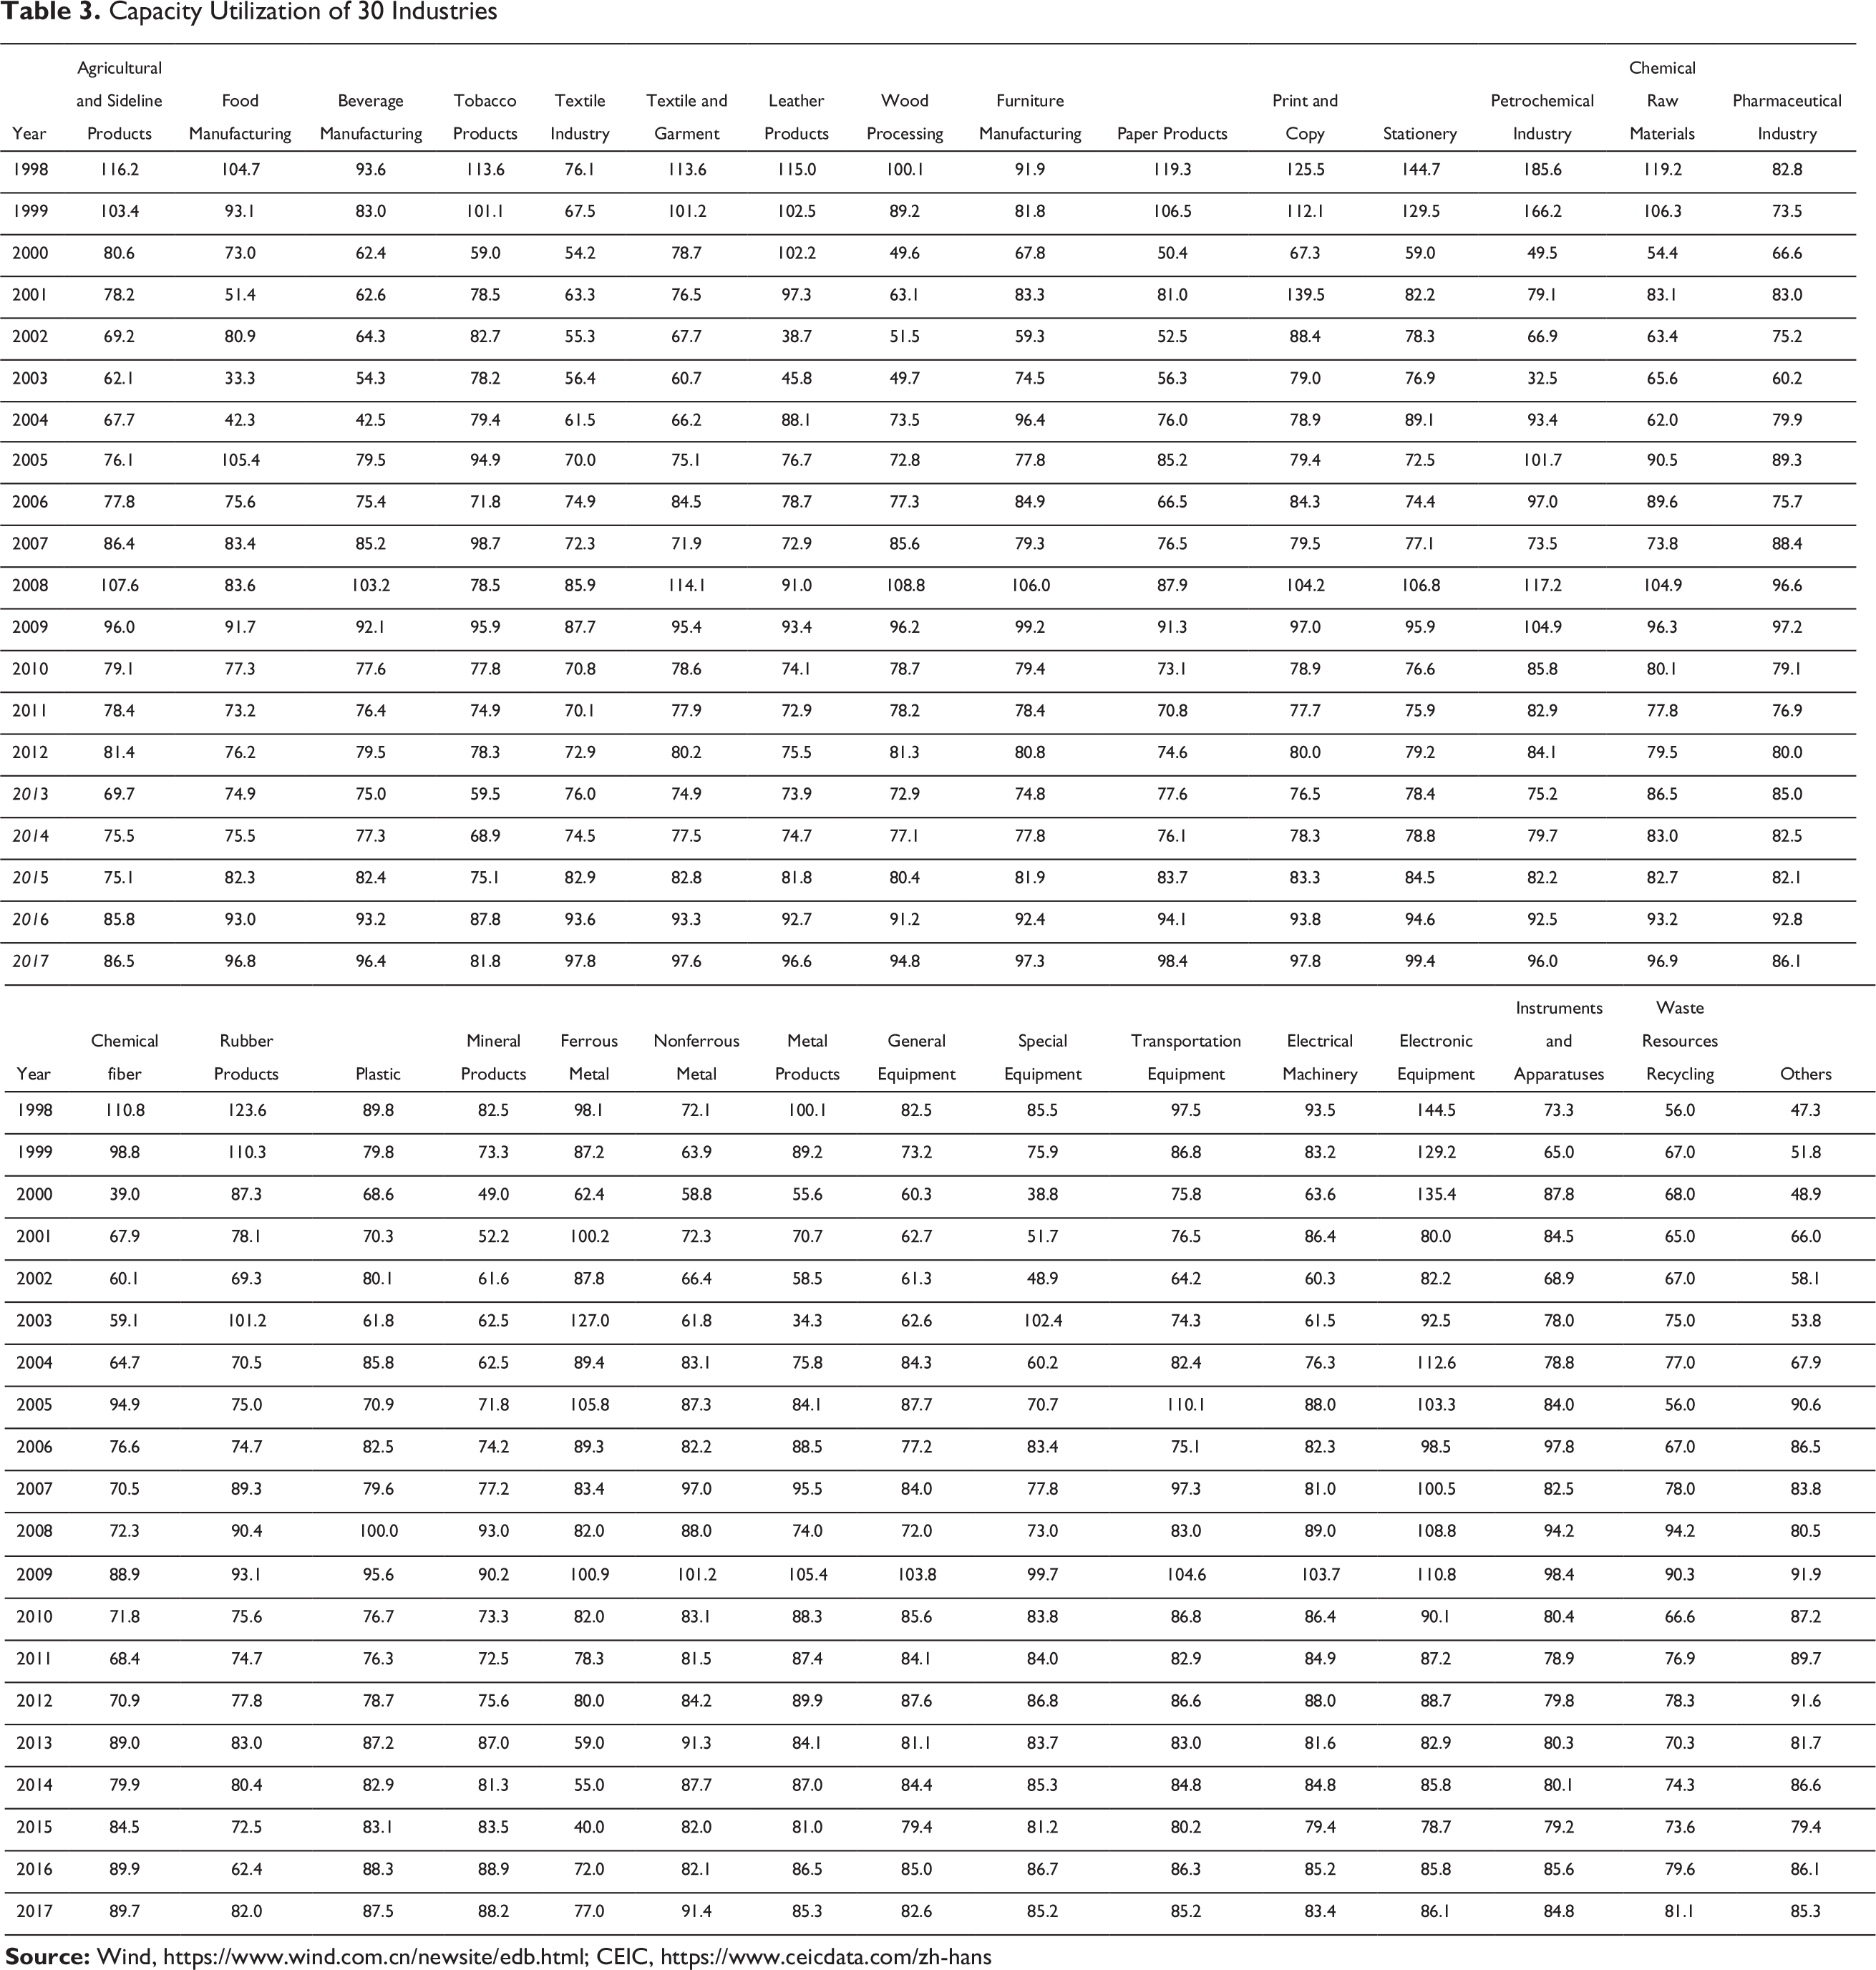
Capacity Utilization of 30 Industries
Enterprises Overinvestment Model and Overinvestment Measurement
Net present value investment judgment from Modigliani and Miller (1958) is regarded as a classic theory in the enterprise investment research area. Based on their theory, in a perfect capital market, the enterprise investment decision is made by the net present value of a project. However, in reality, investment activities are impacted by the information asymmetry and principal–agent relationship. In developed countries, the excess capacity often occurs when the principal–agent problem results in the interest pursuit of enterprise managers, such as asking for the non-pecuniary compensation. In China, besides enterprise managers, the local government has strong motivation and capability to intervene in the overinvestment and benefits from it.
According to Wang and Ju (2012), the commonly used empirical analysis model is from Richardson (2006), which divides enterprise investment into two parts. One is the normal investment, decided by the firm size, growth, financing constraints, and other factors. In contrast, the other part defined as abnormal investment refers to the one made without rationality, that is, overinvestment.
Generally speaking, the enterprises investment level is commonly determined by the following factors: (a) the profits of last year, (b) the leverage ratio, (c) cash holdings, (d) size of last year, (e) return of equity, (f) investment level of last year, and (g) other parameters including industry effect, established time, etc. Hence a firm’s investment function can be written as:
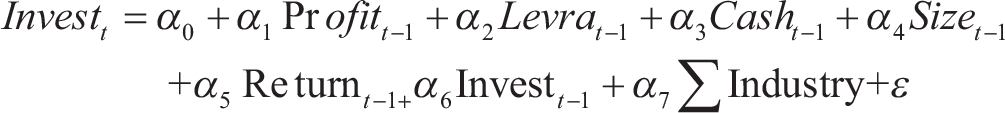
As defined, the residuals
We use the data of Industrial Enterprise Economic Performance from National Bureau of Statistics to measure the degree of overinvestment in the industry for consistency. The time period is from 1998 to 2017, covering 30 sub-industries. Relevant indicators are described as follows: (a) the level of investment: fixed asset investment, (b) profit level, profits, (c) leverage ratio: asset–liability ratio, (d) cash holdings, measured by the scale of liquid assets, (e) size, measured by natural logarithm of total assets, (f) returns, measured by return on total assets, and (g) the industry effect, dummy variable.
The Estimation of Key Coefficients
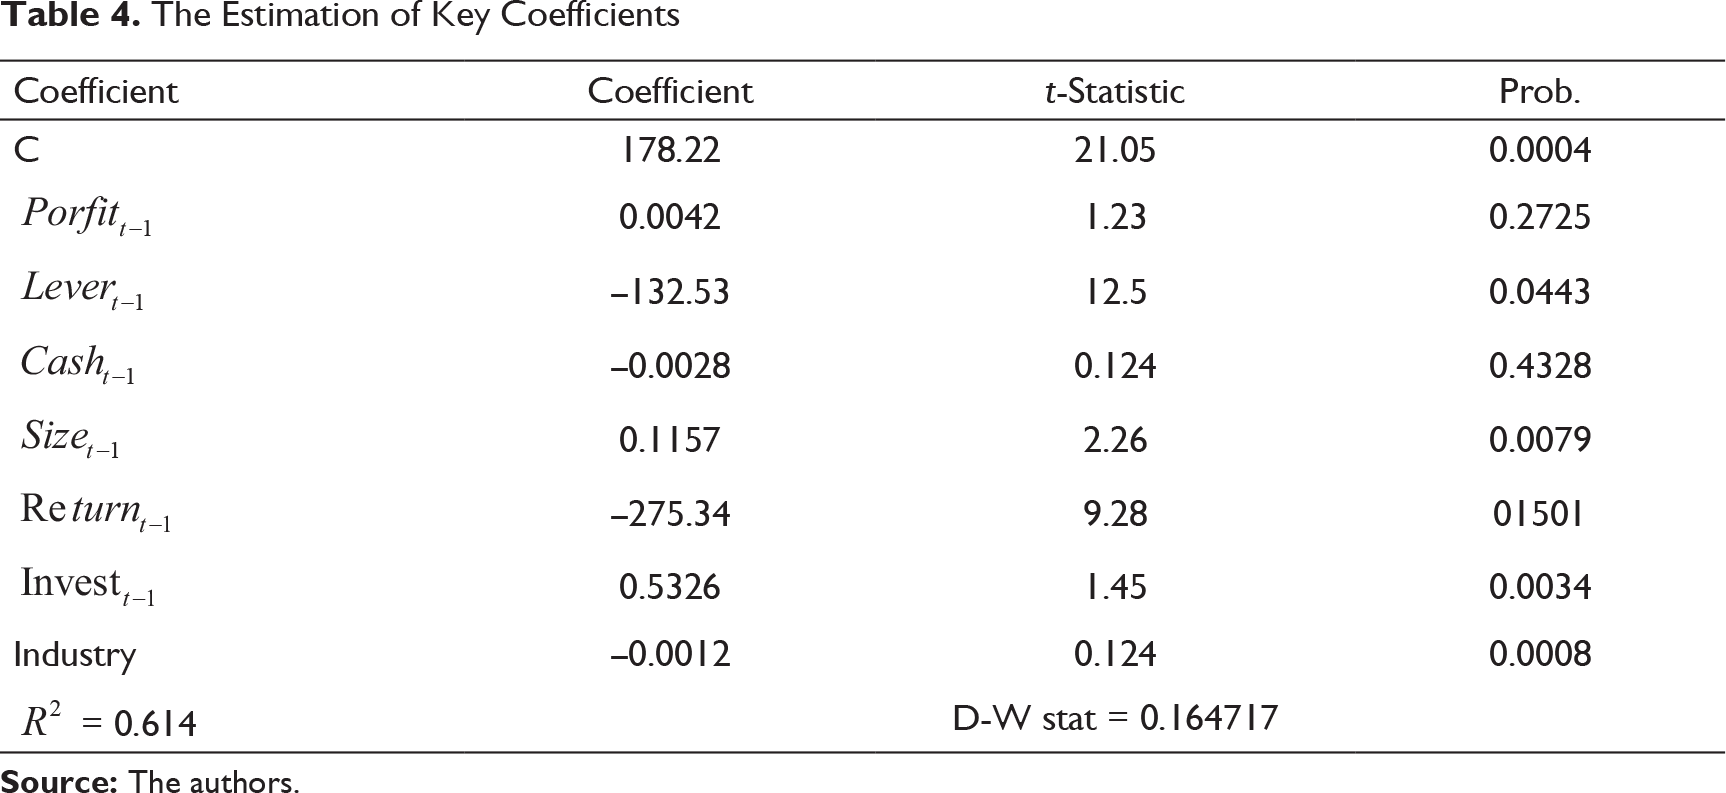
Table 4 indicates that the size of investment in the former year has a significant positive impact on the firm’s investment, while leverage ratio has a significant negative impact. However, profit growth, rate of return, and cash holdings are not significant, which is contrary to the common sense and the classical theory. This means that the investment behavior of Chinese industrial enterprises is not limited by their profitability and capital structure (cash and liabilities), indicating that they may be influenced by external factors.
The result shows, about one-third of the Chinese industries suffer from the overinvestment. The total debt level is quite high with the average debt rate above 60 percent, while the return on total assets is just around 3–5 percent. This indicates that the Chinese manufacturing industries are in a state of overinvestment with the burden of liability increase. This forces us to work out why enterprises in China are craving for overinvestment.
Mediating Effect Model of Government Intervention, Overinvestment and Excess Capacity
Following the measure of the capacity utilization and overinvestment level, the analysis of the driving factors of capacity utilization must be examined. According to the theoretical mechanism discussed before, it is clear that local governments are willing and able to intervene in the investment of enterprises, which leads to overinvestment, further lowering the capacity utilization rate.
The model for the relationship among capacity utilization, government intervention and the mediator variable overinvestment can be written as follows:


Data is obtained through CEIC and Wind, covering 30 sub-industries from 1998–2017. The relevant indicators are described as follows: (a) capacity utilization rate (CU), measured in the former discussion, (b) contribution of GDP, from value-added of the industry, (c) level of employment, measured by the total employment in the industry, (d) land usage support, measure by total construction and installation value in fixed asset investment, (e) environment pollution, measured by the volume of coal fired by the industry, (f) fiscal expenditure, measure by fund from the state budget funds in fixed asset investment, (g) credit support; fund from bank loan in fixed asset investment, and (h) the level of overinvestment, as defined in above model.
Estimation Results of the Mediator Effect in Models 1, 2, and 3
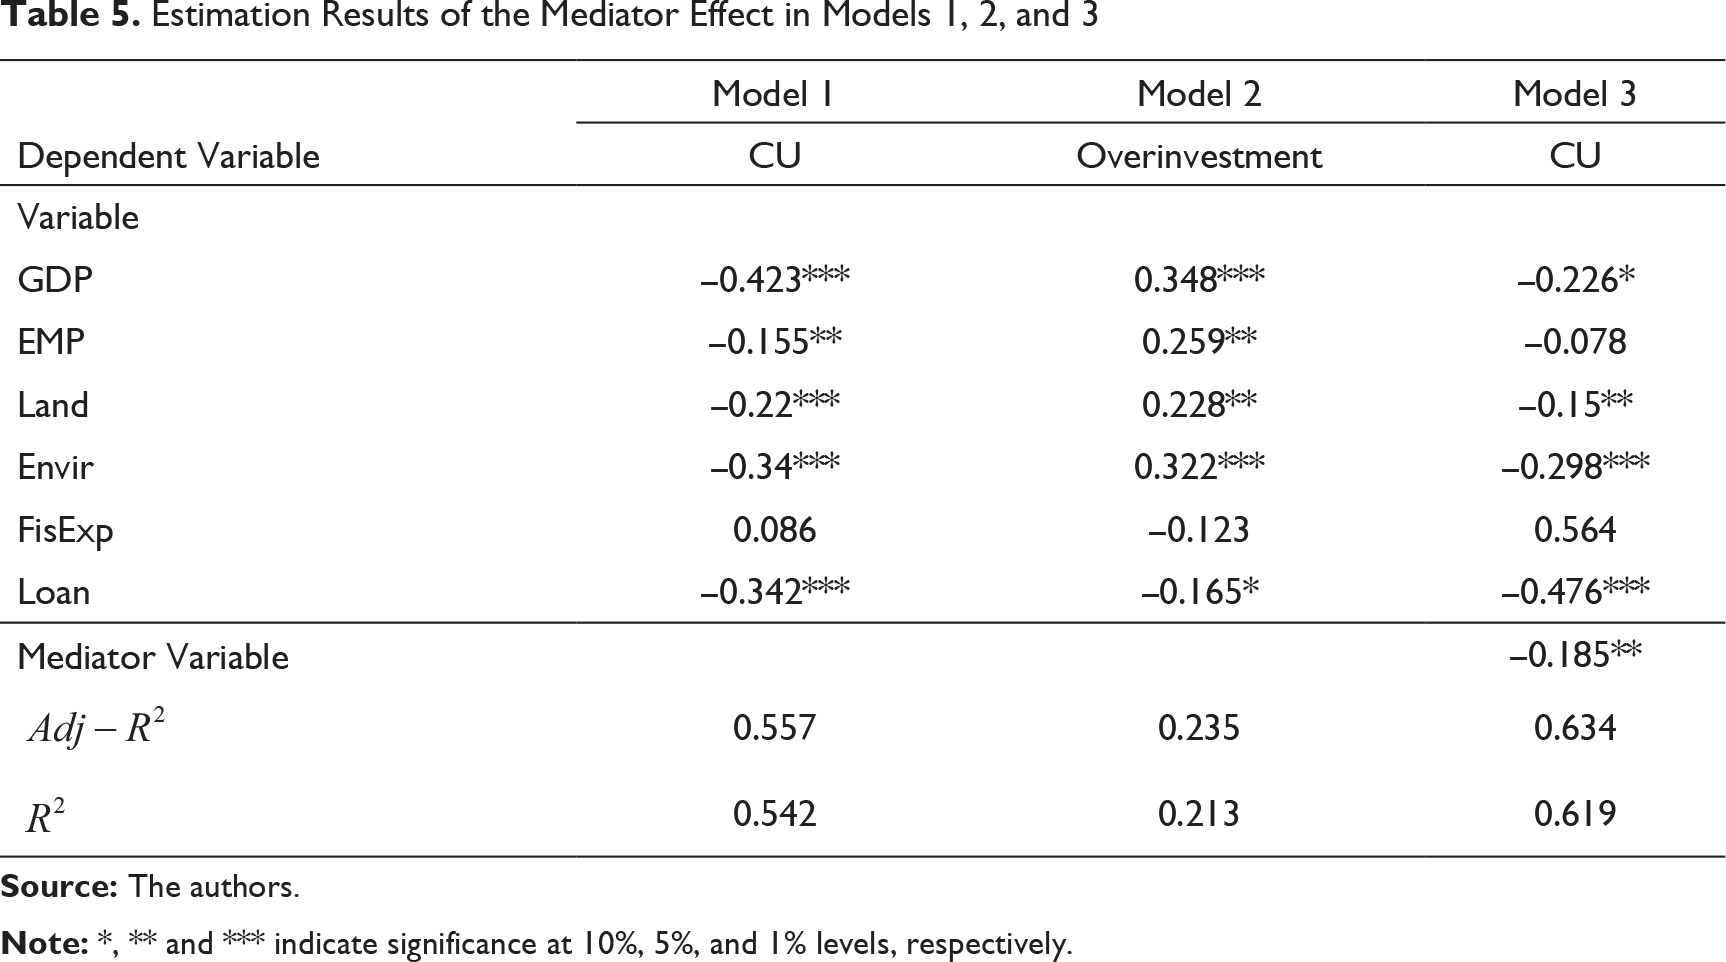
The regression results of Mediator Effect Model (Model 3) show that the overinvestment has a significant negative effect on the capacity utilization rate (CU), which means positive effect on excess capacity. At the same time, the level of employment had no effect on capacity utilization, while GDP pursuit, land usage support, the indulgence of environment pollution, and credit loan support had a significant effect on capacity utilization. This means the employment level does not directly lead to overcapacity. But the government may intervene enterprise’s investment decision-making, given GDP as its main objective, which leads to excess capacity and also promoted employment.
In addition, if the overinvestment variable is ruled out in the estimation, the result of the Government Intervention Model (Model 1) shows GDP pursuit, employment pursuit, land use support, indulgence of environment pollution, and credit support have a significant negative impact on capacity utilization, meaning they have significantly positive effect on the excess capacity. This indicates that more government interventions bring about lower capacity utilization and severe excess capacity.
What’s more, in the Overinvestment Model (Model 2), the result shows GDP pursuit, employment pursuit, land use support, indulgence of environment pollution, and domestic loan all have significant positive impact on capacity utilization, while fiscal expenditure is always not significant, which means that government contract procurement—the relatively transparent arrangement—is not a mainstream channel to influence corporate investment.
Therefore, we conclude that (a) in terms of intervention motivation, the estimation result shows the effect of GDP pursuit of local government to capacity utilization is much more significant than the employment pursuit. This shows the GDP pursuit is the dominant incentive of the local government. (b) In terms of intervention capability, the land use support, indulgence of environment pollution, and domestic loan are the main means to stimulate the enterprises investment and lead to excess capacity. (c) The more intervention the local government takes, the more severe is the overcapacity. (d) Compare the Government Intervention Model (Model 1) and the Mediation Effect Model (Model 3), the overinvestment variable is significant and decreases the elasticity of GDP pursuit, employment pursuit, land use support, and indulgence of environment pollution, thereby verifying the hypothesis proposed that the government over-intervention is a major mediator variable and an important determinant of long-standing excess capacity.
Suggestions to Manage the Excess Capacity
In this article, we present the analysis on the reasons for China’s excess capacity, which is mainly from improper local government intervention. At present, Chinese economy is going through the structural transformation, adjustment in the real estate market, and bearing the brunt of the US–China trade conflict, which exacerbates the excess capacity problem.
Based on our analysis, we propose some strategies to advance the reform for allowing the market to play a more important role in resource allocation, for promoting the economic transformation and accelerating the industry upgrading.
In all, the factors that contribute to China’s excess capacity can be summarized as follows:
The excess capacity in China is an institutional issue, mainly from the non-market factors. The results indicate that motivation, ability, and level of government intervention have a significant effect on excess capacity. The government is following the GDP growth for the performance assessment of the officials’ career promotion, putting overinvestment on industries that can contribute more to local GDP, which results in the industrial excess capacity. In the intervention, the local government makes full use of its authority to induce enterprises to invest in excess so as to achieve its GDP growth goals using various means such as offering privileges on land use, ignoring environment pollution, natural resource provision, financial support, and other activities. The local government yields a lot of authority and its leverage effect to intervene or control is quite significant. The intervention and control from the government have more power than the investment by the government. When the other government intervention comes in, the original financial expenditure is not effective anymore. Its influence is far weaker than the indulgence of environment pollution as well as the support for the land use.
Overall, the institutional excess capacity in China is market failure rather than government failure. The fact that local government uses the supervision right for rent-seeking is the dominant reason for China’s excess capacity.
Looking into the future, we suggest the following policy implications:
The diminishing demographic dividend makes excess capacity in China seems like a structural problem. The future is challenging. However, the growth of the emerging industries and modern service sector helps to deal with the problems arising from structure change. The excess capacity in traditional industries may bring about credit crisis, and therefore it is important to seek flexibility in the monetary policy. In the process of resolving excess capacity, policies and actions should not be taken hastily in case of corporate shock and its negative impact on society. The control will continue, depending on the administrative measures, market, and the law. In the process of controlling overcapacity in 2016–2017, stricter management was fully implemented on external factors such as environmental protection and land use, which effectively suppressed the excess of land use in some industries. The authority should learn from this successful experience. In addition, with the proposal of a high-quality development system and the implementation of a new concept of government performance, it is expected that the behavior model of local governments will change, which will also help alleviate institutional excess capacity.
Footnotes
Declaration of Conflicting Interests
The authors declared no potential conflicts of interest with respect to the research, authorship, and/or publication of this article.
Funding
This article is supported by the Project of the National Social Science Fund of China, “Study on the Investment Security of the Belt and Road” (19ZDA100), and the Project of Asian Development Bank, “Knowledge work on excess capacity work in the Peoples Republic of China” (SC 103697PRC).
Acknowledgements
In the process of writing this article, Jurgen Conrad, the head of economics unit, and Zhuang Jian, the senior economist of the Asian Development Bank, put forward some valuable comments and suggestions. We would like to express our heartfelt thanks to them.