




Abstract
Based on a multidimensional assessment indicators system and a two-layer assessment model, this article measures and evaluates the overall development of China and the 148 countries that signed cooperation agreements with China to jointly build the Belt and Road (we refer to this group of countries as the Belt and Road Countries or simply BRCs henceforth) from 2015 to 2019 using panel normalization method. This research shows that the overall development of BRCs is generally on track, and most countries are showing an upward development trend, mainly Asian and African countries. Second, some features of the overall development of BRCs are clearly evident, such as (a) the economic development is not high enough but relatively stable; (b) the resource endowments are not excellent, but rich fossil fuels are concentrated in a few countries of BRCs; (c) the environment protection of the countries is reasonably well managed; (d) social development indicators of these countries are slightly lagging behind the world average. Third, certain challenges face this group of countries, for example, good governance, economic structural transformation, and industrialization need improvement. Finally, there is enormous potential for strengthening cooperation between BRCs, particularly in energy, manufacturing, green development, social development linking with the people’s livelihood improvement, and so on.
Keywords
Introduction
Since the global financial crisis in 2008, the world economic development pattern has undergone unprecedented changes. On the one hand, the economies of Western countries have witnessed a general recession due to the global financial crisis; on the other hand, a group of emerging market countries and developing countries, represented by China, have seen rapid economic recovery and development, making them a vital engine driving global economic growth and playing an increasingly important role in global governance (Hu, 2018; Hu et al., 2018). At the same time, the growing unbalanced and unfair world development has encouraged the populist, nationalist, and protectionist forces in some regions, posing significant challenges to global development and globalization. Facing the domestic and international economic situation, Chinese President Xi Jinping put forward the Belt and Road Initiative (BRI) in the autumn of 2013. This was an effort to provide new growth momentum to the global economy, calling for a joint effort to build a Silk Road Economic Belt and a twenty-first Century Maritime Silk Road. Establishing closer global connectivity and promoting effective allocation of economic resources at the regional and even international levels was expected to achieve interconnected regional and global economic growth. Furthermore, this would boost the transition and upgrading of globalization and realize mutual benefits and common development (Hu, 2020).
The BRI has received an enormous response from the international community. According to the Belt and Road Portal, by February 8, 2022, China has signed more than 200 cooperation agreements with 148 countries and 32 international organizations to build the Belt and Road jointly, including 51 African, 38 Asian, 27 European, 21 Latin American, and 11 Oceanian countries. 1 The data from the World Bank show that the total population, land area, and GDP of these 148 countries in 2020 totaled 3.56 billion, 74.92 million km2, and US$20.12 trillion (at constant 2010 price), accounting for 45.92%, 57.65%, and 24.5% of the world’s total, respectively. Including China, the total population, land area, and GDP in 2020 reached 4.96 billion, 84.34 million km2, and US$31.90 trillion (at constant 2010 price), and their shares in the world were 64.01, 64.90, and 38.95%, respectively. As the initiator of the BRI, China should be included in the Belt and Road Countries (BRCs), so the total country number has reached 149 so far. These countries account for more than 60% of the world’s population and land area, and their GDP accounts for nearly 40% of the world’s total. Therefore, on the one hand, the BRCs play a pivotal role in the world, but on the other hand, they are relatively behind in economic development.
According to the World Bank’s income classification standard in 2020, 2 of the 149 countries, 35 were high-income countries, accounting for 23.49%; 91 were middle-income countries, accounting for 61.11% (including 42 upper-middle- and 49 lower-middle-income countries); and 23 were low-income countries, accounting for 15.44%. The average per capita GDP of the BRCs was US$ 9,032.47 (at the current price), reaching the upper-middle-income level but still slightly lower than the world average of US$ 10,925.73 (at the current price). In terms of urban-rural structure, more than half of BRCs’ population lived in urban areas, with an average urbanization rate of 56.25%, slightly higher than the world average (56.15%) in 2020.
It has been over 9 years since the BRI was put forward. Several pragmatic and cooperative construction projects have already been implemented, some successfully completed. Significant milestones have been achieved in the BRI cooperation. However, existing research on the BRI tends to focus only on 65 countries along the Belt and Road. Though such research is of high significance, it may not satisfy the current practical needs and even lead to conclusions that do not align with the overall Belt and Road development. This is not conducive to China and related countries for making realistic assessments and decisions to promote high-quality projects in BRI. Hence, from the perspective of the 149 BRCs 3 , a qualitative and quantitative study was conducted on the comprehensive development level of each country in an effort to accurately understand their development status, basic characteristics, and main issues at the macroscopic and fundamental levels. This will lay the foundation for further research on relevant issues related to the Belt and Road development.
Measurement and Assessment Indicators System
National development is a comprehensive concept that cannot be fully reflected by economic growth alone. Since 1990, the United Nations Development Program (UNDP) has been publishing the Human Development Index (HDI) report annually, making efforts to shift the idea of development from the “economic-growth-centered view” to a “human-development-centered view.” Based on three variables; per capita national income, life expectancy, and mean years of schooling, a comprehensive index (HDI) was developed to measure the development level of each country. However, with the changes in times, the HDI could not reflect the rich connotation of today’s development. For example, when the HDI was designed, the central concept was mainly the development of society and the economy, while sustainable development of the environment was not fully considered. Based on our previous research, besides the improvement of economic strength and the development of social undertakings, other aspects, such as the improvement of governance, the efficient utilization of resources, environmental protection, the upgrading of economic structures, and the potential of development, must be included in national development evaluation.
Constructing the Indicators System
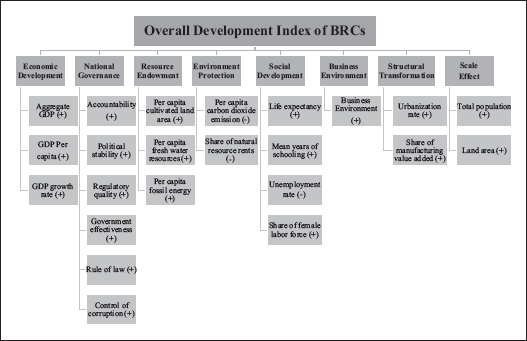
To measure the overall development of the BRCs, this article considers the performance of a country from eight aspects: Economic development, governance, resource endowments, environmental protection, social development, business environment, structural transformation, and size effect. It selects 23 secondary indicators (Figure 1) based on the principles of representativeness, comprehensiveness, comparability, and data availability 4 .
Assessment Indicators System of the Overall Development of the BRCs.
Data Collection and Processing
This research focuses on the overall development level of the 149 BRCs. Because of the varying impacts of the COVID-19 pandemic on different countries since 2020, we selected a period from 2015 to 2019 when measuring and assessing the overall development level of each country to obtain a consistent result. In the long run, the COVID-19 pandemic and its impact on the overall development of all countries need to be taken into account. However, it will take some time after the pandemic to get relatively stable results.
Most data used in this article are from the WDI database of the World Bank (2021). However, we turned to other international organizations’ databases to supplement in case of insufficient or missing data. For example, relevant data on governance indicators were from the WGI database of the World Bank (2020b); the data on per capita fossil energy from the BP Statistical Review of World Energy (2020); the data on mean years of schooling from the Human Development Reports (HDR) of the UNDP (2020); the data on business environment indicators from the Doing Business database of the World Bank (2020a); and the data on the shares of manufacturing value added in GDP from the database of the United Nations Industrial Development Organization (UNIDO) (2021).
To ensure the integrity of samples, four methods were adopted to deal with the missing data of individual countries. First, information from the statistical departments of relevant countries was used. For instance, data on the Cook Islands and Niue are not available in the World Bank database, so we turned to official data released by their national statistical departments (Ministry of Finance and Economic Management [MFEM], 2020; Niue Statistics Office [NSO], 2020). Second, in some instances, research literature from relevant sectors was used. For example, the data on per capita freshwater resources of Pacific Island countries were collected from research reports produced by the United Nations Environment Program (UNEP) (2012). Third, we used the linear interpolation method, including two- or three-year average and moving average methods. Fourth, we used the regional average method as a last resort. When the previous three methods did not work, we used the average data of other countries in the same region of the target country as a supplement. For example, the business environment data of Cuba, the Cook Islands, and Niue are not available in the World Bank, so we used the average of Caribbean countries to represent the data of Cuba and the average of Pacific Island countries to represent the data of the Cook Islands and Niue. This method was also employed to obtain the mean years of schooling and the shares of natural resource rents in GDP for the Cook Islands and Niue. It is worth noting that the above situations are exceptional. The data of most countries are complete and available. Only data from a few countries must be obtained by data processing, most of which are tiny countries, especially island countries. Generally, the data obtained by these methods will not compromise the overall analysis and assessment results.
Measurement and Assessment Model
To calculate the overall development index of the BRCs, we first constructed an assessment model with a two-tier structure. The model design includes first-level indicators which relate to the abovementioned eight aspects of economic development, governance, resource endowment, environment protection, social development, business environment, structural transformation, and size effect. Each first-level indicator is divided into several secondary indicators; these eight aspects have 23 secondary indicators. Second, we used a low-to-high, layer-by-layer weighted arithmetic average quantitative calculation method. More specifically, the overall development index was obtained by the equal weighting of the eight first-level indicators, and the value of each first-level index was determined by all the secondary indicators subordinate to the first-level indicators through equal weighting. The value of the second indicator was derived from its actual statistical data.
According to the different meanings of the indicators, there are two cases of the evaluation of the secondary indicators: One is that the “unemployment rate,” “carbon dioxide emissions per capita,” and “share of natural resource rents in GDP” in the indicator system are three indicators given lower assessment scores when the number is bigger, that is, the country with the biggest number is rated as zero on the indicator, and the country with the smallest number is rated as a full score. The second case is that the bigger the original value of the secondary indicator, the higher the score of the assessment; a country with the biggest number is given a full score on the corresponding indicator, and in turn, a country with the smallest number is rated as zero. This case is more common.
The evaluation model is calculated from the data matrix (DATA), score matrix (SCORE), and rank matrix (RANK). The calculation process is divided into three steps.
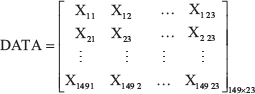
Step 1. Constructing DATA Matrix
The matrix has a total of 149 rows and 23 columns, and its elements are
Step 2. Constructing SCORE Matrix
First, according to the matrix above, construct a secondary index score matrix (
For case one: the bigger the number, the lower the score. Set the original data to take the minimum value
For case two: the bigger the number, the higher the score. Set the original data to take the maximum value
The following matrix of
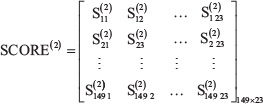
Then, according to the

Finally, according to the
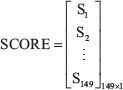
Step 3. Constructing RANK Matrix
First, according to the

Then, according to the
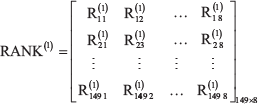
Finally, according to the SCORE matrix, we construct a second indicator rank index matrix (RANK). The RANK matrix has a total of 149 rows and 1 column, and its elements are

Measurement Results and Analysis
Results
Based on the above-mentioned data and model, we obtained the scores and ranks of the eight subcategories of development as well as the overall development scores and ranks. The detailed results are provided in Table 1 (the results are ranked from high to low according to the five-year average scores of the overall development).
Scores and Rankings of the Overall Development Level of the BRCs.

According to Table 1, the top 10 BRCs with the highest level of overall development scores are Singapore, New Zealand, China, South Korea, Austria, the Czech Republic, Lithuania, Luxembourg, Estonia, and Russia. Except for China’s scale dimension and Russia’s resource dimension, the rest of the top ten countries are relatively poor in resource endowments and small in scale but good in governance, environmental protection, social development, business environment, and structural transformation, making them among the best in terms of comprehensive development level. Somalia, Yemen, Syria, Afghanistan, South Sudan, Libya, Eritrea, East Timor, Iraq, and Chad are the last ten countries. Although they score well in the environmental dimension, their performances in other aspects are poor, so they rank at the bottom.
Regionally, the overall development level of European countries is generally high, owing mainly to their outstanding performance in governance, environmental protection, social development, and business environment. Among the top 20 countries, 14 are European, accounting for 70%. Except for Bosnia and Herzegovina, which ranks 80th, other European countries all rank in the top 70s. Apart from the environmental dimension, African countries perform poorly in other aspects, so their overall development levels are generally low. Fifteen of the last 20 countries are African, accounting for 75%. Moreover, no African country ranks in the top 40. Botswana, Morocco, Seychelles, Tunisia, Rwanda, South Africa, and Ghana rank in the top 70s, while the other 39 countries rank below 70. The ranks of Asian countries vary widely in comprehensive development level, leading to a scattered ranking distribution. The top three countries are Singapore, China, and South Korea, and the bottom three are Yemen, Syria, and Afghanistan. Americas are similar to Asian countries. For example, there are 100 places between Chile, which ranks 14th, and Venezuela, which ranks the 114th.
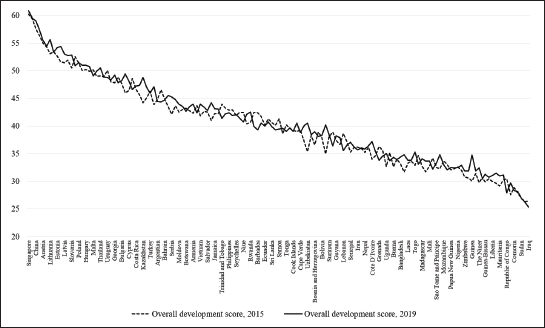
According to the dynamic change trend from 2015 to 2019 (Figure 2), the overall development scores of most countries (96 countries, accounting for 64.43%) were on the rise, and 52 countries, most of which are in Africa and Asia, witnessed increases of more than one point, indicating an upward trend in the overall development of the BRCs. Among them, the overall development scores of Kenya and Uzbekistan increased the most, both by over five points. In addition, Guinea, Kazakhstan, Timor-Leste, Belarus, Ukraine, Côte d’Ivoire, Brunei, Tajikistan, and Serbia all registered increases of over three points in comprehensive development level. At the same time, 53 countries (accounting for 35.57%) experienced declines in their overall development scores, and 27 of them saw declines of over one point. The scores of Barbados and Lebanon dropped by more than three points, while Yemen, Trinidad and Tobago, Congo, South Africa, Grenada, Nicaragua, and Panama decreased by more than two points.
Dynamic Changes of Overall Development Scores of the BRCs.
Main Features
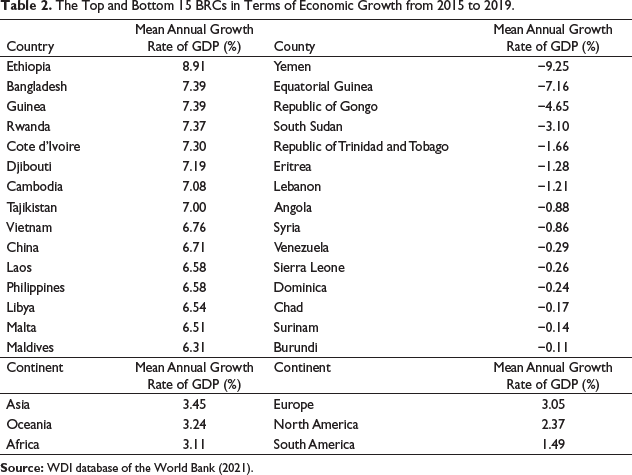
Most countries ranking high in the economic dimension are Asian and European, featuring larger economic scales (like China) or higher GDP per capita (like Luxembourg) and stable economic growth. In contrast, those ranking at the bottom is mainly African, featuring a smaller economic scale, lower GDP per capita, and volatile economic growth. In 2020, among the BRCs, Asian countries registered a total GDP of US$20.77 trillion (at constant 2010 price), accounting for 65.11% of the BRCs’ total, followed by European countries, with a total GDP of US$6.65 trillion (at constant 2010 price), accounting for 20.85%; the GDP of African countries totaled US$2.50 trillion (at constant 2010 price), accounting for 7.82%; and the total GDP of countries in South America, North America, and Oceania was US$1.99 trillion, accounting for only 6.22%. China’s GDP accounted for 36.94% of the total GDP of the BRCs. Except for China, five countries with large economic scales were Italy, Russia, South Korea, Turkey, and Indonesia, whose total GDP accounted for 23.88% of the BRCs. China included, the total share of the six countries exceeded 60%.
The Top and Bottom 15 BRCs in Terms of Economic Growth from 2015 to 2019.
However, the BRCs include some of the most energy-producing countries in the world, which are rich in fossil energy resources. In 2019, the BRCs produced 7.40 billion tons of oil equivalent to fossil energy in total, accounting for 64.64% of the world’s total in the same period. Figure 3 shows that the share of BRCs’ fossil energy output in the world’s total output has been stable at about 65% for years, suggesting they are the most important force in global energy production. The share of natural gas is stable at about 60%, and that of oil is higher, remaining at over 60% despite the decline in recent years. Coal records the highest share, about 70% in 2019, mainly because China is still the largest coal producer in the world. Excluding China, the coal output of the BRCs only accounted for 22.97% of the world’s total in 2019.

In 2019, 13 out of the 149 countries had a fossil energy output of more than 100 million tons of oil equivalent, including China, Russia, Saudi Arabia, Iran, Algeria, United Arab Emirates, Kazakhstan, Qatar, Kuwait, South Africa, Nigeria, Iraq, and Indonesia. 5 Their total output accounted for 84.31% of the BRCs’ total and 54.50% of the world’s total. Most of them are net producers of fossil energy; hence their output is more than their consumption, creating favorable conditions for energy cooperation between China and relevant countries.
Figure 4 suggests that, since the start of the twenty-first century, BRCs’ share of carbon emissions in the world has been gradually rising, and the growth rate began to level off in 2013. In 2019, the BRCs contributed 58.78% to global carbon emissions, or 30.86%, excluding China. Although the share of about 30% is significantly higher than that of North America and Europe with downward trends, this number is not high for a group with more than 45% of the world population. A good environmental foundation may be due to two reasons. In underdeveloped countries, such as Afghanistan, Nepal, and Bangladesh, environmental damage is not serious, because their resource development intensity is constrained by their economic development capacity, while in developed countries, like Portugal and Italy, environment-friendly development models have been adopted after they experienced a high economic growth accompanying high consumption and pollution. The green development of the Belt and Road is one of the core objectives of the high-quality development of the BRI. The good environmental foundation of the BRCs not only provides opportunities for relevant countries to build a green Belt and Road but also makes lasting contributions to the global response to climate change.

Main Challenges
According to the latest World Bank’s Doing Business report, in 2020, the BRCs’ business environment for enterprises ranked relatively low as a whole, with 90 countries ranking behind the 100th among the 213 economies around the world, and 13 countries even behind the 200th, reflecting that the overall institutional guarantee of the BRCs for enterprises to carry out economic activities is insufficient. Regionally, the business environment of European and Asian countries of the BRCs is relatively better than the African countries. Therefore, under a poor institutional environment, mediocre governance levels, and unfavorable business environment, promoting high-quality Belt and Road development is a challenge that cannot be ignored.
There are two reasons for the low shares of the manufacturing industry in these countries. First, their shares of agriculture in the national economy are high. In 2019, the average share of value added of agriculture in the GDP of the 149 countries was around 12%, higher than the middle-income countries’ level of 8.09% and much greater than the world average of 3.55%. In Sierra Leone, the value added of agriculture to GDP was over 50% (54.34%). In Chad, Liberia, Niger, Mali, Kenya, Central Africa, Ethiopia, Comoros, and Guinea-Bissau, the shares all exceeded 30%. These are typical agricultural countries. In addition, more than 20 countries had 20 ~ 30% shares, and more than 25 countries had 10 ~ 20%. The economic transformation pressure faced by such countries is mainly because of transitioning from an agricultural economy to an industrialized economy. Second, many countries rely heavily on natural resources for economic development. In 2019, the average share of natural resource rents in the GDP of the 149 countries was 6.47%, more than three times the world average of 2.02%. 72 out of the 149 countries had shares exceeding the world average level. Among them, about 30 countries had shared about five times the world average, and about 15 countries had shared around 10 times the world average, including Iran, Congo, East Timor, Libya, Kuwait, Iraq, Equatorial Guinea, Oman, Angola, Azerbaijan, Saudi Arabia, Brunei, Chad, Gabon, and Qatar. The pressure of economic transformation faced by such countries mainly comes from their unsustainable economic development model relying too much on energy.
Conclusion and Prospect
The comprehensive measurement and overall assessment of the development of the BRCs will benefit the BRI in three aspects. First, the governments of the BRCs will better understand the critical issues discussed above and formulate targeted policies to improve their overall development effectively. Second, by their comparative advantages, the BRCs can further enhance the level and effect of cooperation through the BRI platform. Third, more efforts will be targeted to form and improve the theoretical system for the high-quality development of the Belt and Road. This article measures and assesses the overall development levels of the 149 BRCs from 2015 to 2019 from eight aspects: economic development, governance, resource endowments, environmental protection, social development, business environment, structural transformation, and scale effect, and draws the following conclusions.
First, in terms of comprehensive development level, the top 10 BRCs are Singapore, New Zealand, China, South Korea, Austria, Czech Republic, Lithuania, Luxembourg, Estonia, and Russia, and the bottom 10 BRCs are Somalia, Yemen, Syria, Afghanistan, South Sudan, Libya, Eritrea, East Timor, Iraq, and Chad. Regionally, European countries generally have high overall development levels due to their outstanding performance in governance, environmental protection, social development, and business environment; however, African countries lag in all dimensions, so their overall development levels are generally low, and Asian countries vary widely in comprehensive development level, leading to a scattered ranking distribution. From the perspective of dynamic trends, the BRCs show a promising development trend.
Second, there are several remarkable features of the BRCs’ development. Their overall economic development performance is not outstanding, and they have not earned a dominant position in global economic development. Still, their economic growth rates are relatively stable, with an average five-year GDP growth rate of about 3%. Their overall resource endowments are not high, but most energy-producing countries worldwide are among the BRCs. Their total output of fossil energy accounts for about 65% of the world’s total for years, and fossil energy production is concentrated in a few countries, which provides opportunities for energy cooperation between China and relevant countries. The BRCs have an excellent foundation for environmental protection, which not only offer opportunities for the green development of the Belt and Road but also significantly contribute to the global response to climate change. Their overall performance in social development is slightly lower than the world average.
Third, there are also some challenges in the comprehensive development of the BRCs. Their overall governance level and capacity are mediocre, lower than the world average. At the same time, the relatively poor business environment suggests insufficient institutional guarantee for enterprises to carry out economic activities in relevant countries, which may pose some challenges to the high-quality Belt and Road development. In general, the scale pattern characterized by the “large overall, but small in individual countries” may form a market segmentation that is not conducive to giving full play to the scale advantage in economic development. The BRCs are facing a weak industrialization foundation and high pressure of economic transformation issues because their shares of agriculture in the national economy remain high, and their national economy heavily depends on the consumption of natural resources.
Based on the analysis of this article, under the framework of the BRI, China and partner countries have broad prospects for cooperation, at least in the following aspects.
Footnotes
Declaration of Conflicting Interests
The authors declared no potential conflicts of interest with respect to the research, authorship, and/or publication of this article.
Funding
The authors disclosed receipt of the following financial support for the research, authorship, and/or publication of this article: The research is funded by the Major Project of the National Social Science Fund (Grant No. 19ZDA100); the Special Research Project of the National Social Science Fund on “the Belt and Road” construction (Grant No. 19VDL012); the Start-up Research Project of Introducing Talents of Beijing Normal University at Zhuhai (Grant No. 111032101).