



Abstract
Studies of microbusinesses in poor countries find high marginal returns to capital but also lack of investments. This article analyses how segmentation in the capital and labour markets can act as an obstacle for high-ability entrepreneurs to invest in microbusinesses and also explain high marginal returns to capital. Using a household survey purposively designed for assessing barriers to microbusiness growth, we find that segmentation leads to inefficient allocation of entrepreneurial talent, labour and capital. This, in turn, leads to lower wages and smaller and less profitable businesses for lower castes, and lower economic growth of the local economy. The study covers a range of barriers to doing business, and finds that in addition to market segmentation, access to capital, lack of skills and knowledge are the main constraints to microbusiness growth.
Micro- and small enterprises are important sources of income for half or more of the labour force in developing countries, and particularly important for the poor (de Mel, McKenzie & Woodruff, 2008; Haggblade, Hazell & Reardon, 2007). Studies of microbusinesses often find very high marginal returns to capital, but also a puzzling lack of investments in these profitable businesses (Banerjee & Duflo, 2005; de Mel, McKenzie & Woodruff, 2008). When returns to capital for microbusinesses range as high as several hundred per cent per year, it is important to assess why entrepreneurs are not taking advantage of such profitable opportunities. Why do we not see more investment and start-ups in the high-return industries? Moreover, since many poor households run microbusinesses with high returns, this suggests that increased investments may have a large potential for poverty reduction.
Most previous studies seeking to explain high returns to capital have mainly focused on capital constraints and credit market imperfections (McKenzie, 2010). However, little has been done to explore the role of caste-based restrictions in explaining high returns and lack of microbusiness growth. The aim of this article is to analyse how market segmentation based on caste can act as an obstacle to investment in microbusiness in Nepal.
We apply a model by Lucas (1978) where the level of entrepreneurial talent and abilities influence whether an individual is working in or running a firm. When segmentation is introduced in the labour and capital markets based on whether workers are high or low caste, we show that the marginal return to capital will be higher for the lower castes. Moreover, less segmentation would lead to higher wages for the lower castes, higher profit for low-caste entrepreneurs and a higher level of production in society. This also implies that less caste-based segmentation would reduce poverty.
Nepal is of interest for at least two reasons. First, it is one of the poorest countries in the world with a relatively strictly enforced caste hierarchy where the lower castes are over represented in the poorest segment (Das & Hatlebakk, 2010). The plains of Nepal are also representative for large parts of India where caste systems are prevalent. Second, little is known about how caste restrictions impact on the allocation of entrepreneurial talent, labour and capital in this economy, and how this in turn impacts on economic growth and income inequality.
We designed a household survey for the purpose of investigating barriers to growth among microbusinesses across caste groups in a rural Village Development Committee (VDC) 1 and a semi-urban VDC in Morang district of Eastern Nepal. In the period from March to May 2009 we interviewed a random sample of 200 households together with a stratified business survey of 90 households currently running a microbusiness. This was supplemented with qualitative interviews with such entrepreneurs.
We identified the informal businesses which are the most important sources of business income for the poor. Using various sources we found that the most prevalent microbusinesses were teahouses, small shops, milk sales and rickshaw pulling. The rickshaw industry is analysed by Hatlebakk (2012) so we purposely selected the three other industries for the microbusiness survey. All respondents were asked detailed questions about their income, capital, businesses and perceptions of the most important obstacles for running microbusinesses.
The assessment is challenging since there is large heterogeneity in microenterprise profitability that does not necessarily reflect obstacles to doing business. Some have very high returns, some have zero, and others have negative returns—even if they operate in the same market (de Mel, McKenzie & Woodruff, 2008). Moreover, there are often high start-up and closure rates in this segment and most microbusinesses never grow, while a few grow a lot (Nichter & Goldmark, 2009). This pattern could reflect a learning-by-doing process where entrepreneurs take risk by entering markets and using technologies with uncertain outcomes (Klinger & Schündeln, 2011). Another explanation for the large diversity in returns is a dichotomy of microbusinesses in poor countries reflecting push and pull factors of start-ups (Gunter & Launov, 2012; Reardon, Berdegue, Barrett & Stamoulis, 2007). Poor people with low endowments and abilities are pushed into this type of business because they have no other alternatives, and they may not have any intention of growing and are likely to receive low returns from their enterprise. On the other hand, entrepreneurs in a more favourable position who are attracted to start-ups because it offers them a more profitable opportunity than their present engagement may be more successful and hence receive higher returns.
One important instrument for assessing barriers to firm expansion, which is widely used in developing countries, is investment climate analysis. However, despite the seemingly large opportunities for economic growth in the microenterprise segment, the focus of investment climate surveys have almost solely been on larger enterprises in urban areas. One exception is Deininger, Songqing and Sur (2007) who find that small enterprises face significantly different constraints than larger companies, and that they are more severely affected by investment climate constraints as compared to larger entities.
It is well established that an important advantage of running a microbusiness is its flexibility. Microenterprises can easily be operated by a single household in combination with other income-generating activities, and household members can easily enter and exit the business. This flexibility does not only permit the household to allocate labour and capital effectively towards the most profitable usage, it also enables them to diversify and become less vulnerable to shocks. Hence, detailed mapping of the economic activities of all household members, as we do in this study, is necessary to get the full picture of their income sources.
Our findings suggest that reducing caste segmentation in microbusiness could have a relatively high impact on poverty reduction and economic growth. Direct measures include affirmative action in education, labour market, credit market, training programmes and governance structures related to the business community. Indirect measures could be to provide platforms for business interaction across caste groups— like creating business councils, networking forum, exhibitions and similar structures while at the same time ensuring participation of the different caste groups.
We also find that lack of knowledge and skills is one of the most important barriers to business growth, especially among the lowest castes. Improving entrepreneurial and technical skills, or making better use of those skills in the economy, could increase economic growth and reduce poverty (see also McKenzie & Woodruff, 2014). Moreover, lack of capital is identified as a main obstacle for doing business. Despite a rather well-functioning microfinance market in the areas under study, it seems that more should be done to address the specific capital requirements for doing microbusiness. Financial products tailored to the needs of individual entrepreneurs with growth ambitions could be quite different than prevailing group lending schemes with very small loan sizes and rigid repayment schemes. Finally, many microbusiness failures are related to factors outside the owner’s control. The risk of being exposed to shocks seems to make small entrepreneurs precautionary towards new investments. This suggests a role for insurance schemes in the microbusiness segment.
The subsequent section of this article presents the model and its predictions. The third section provides the descriptive statistics while the fourth explains the main findings from the survey on constraints for doing business. In the fifth section we analyse the data against the model predictions. The last section presents the main policy recommendations.
Model
Lucas’ (1978) model of the size distribution of companies provides a useful framework to analyse an individual’s decision of becoming an entrepreneur or working for others. We present a slightly simplified version as the theoretical starting point. Then we introduce caste segmentation in the labour market in the model and derive testable hypotheses.
Assume an economy with N individuals and K units of capital that can be combined to produce Y units of output, where each individual can either be an entrepreneur running a firm or be a worker in such a firm. 2 There is a basic production technology of a single firm given by f(n, k), where n and k are respectively the units of labour and capital used by the firm. This underlying function has constant returns to scale. Now we add entrepreneurial talent as a fixed and non-tradable factor of production, which implies that we introduce decreasing returns to scale. That is, we assume that the production of a firm is influenced by the skill and talent of the entrepreneur running it, and that each individual in the economy is endowed with a certain level of entrepreneurial talent, x, drawn from a fixed distribution T ϵ [0,1]. So if an individual with talent x is an entrepreneur and manages a firm with n labourers and capital stock of k, then the production of this firm is assumed to be g(n, k; x) = xf(n, k) where g has the standard characteristics that ensure an internal solution. The production function g(n, k; x) has diminishing returns to scale (since x is fixed) and in equilibrium each firm will consists of a single entrepreneur, n employees and k units of capital. Let r denote the capital to labour ratio, k/n.
We assume that there is a continuum of individuals so that the entire distribution T of talent is fully represented. Since those with low x will be working for a wage in equilibrium, the equilibrium allocation of resources in the economy is given by the cut-off z where the individual with x = z is indifferent to the choices; if x < z the individual chooses to become an employee, if x ≥ z the individual becomes an entrepreneur. Maximising output Y subject to the available resources in the economy, K and N, gives an efficient allocation which is also a competitive equilibrium where w and u are the equilibrium wage and rental price of capital, respectively. In optimum the marginal product of labour will equal the wage rate, and the marginal product of capital will equal the rental cost of capital. And we can solve for the optimal amounts of labour and capital managed by individual x and write them as n(x) and k(x). And in optimum we can write the income of an entrepreneur, that is, individuals with x ≥ z, as the value of the production subtracted the costs of hiring employees and renting capital:

where we treat output as numeraire. In the equilibrium of the economy at large we will have that the income w of a labourer will equal the income of the marginal entrepreneur z,

Lucas has identified a number of predictions from this model. The cut-off z that defines the marginal entrepreneur will depend in equilibrium on the elasticity of substitution between capital and labour—if the elasticity is less than one. 3 It will depend on the aggregate amount of capital K relative to the population N and the particular distribution of talents.
Let us assume now that there are two groups of individuals, the high-caste group and the low-caste group. Then assume that individuals from one group cannot be in an employer–employee relationship with an individual from the other group, nor can they rent capital from the other group. The distribution T of entrepreneurial talent, x, is identical for the groups, and for simplicity, let us assume that the number of individuals is the same in both groups so that the available labour stock is identical. The only difference between the two groups is that the high-caste group has larger endowments of capital than the other. Let superscript h indicate the high capital group and superscript l indicate the low capital group. The implications of more capital per worker for the h group, rh > rl, can be derived directly from the model: With more capital available, wages will be higher, and by that the critical value z that defines the marginal entrepreneur will be higher. So we have the predictions, wh > wl, and zh > zl which means that the high capital group will have a larger share of employees, lower share of entrepreneurs and a larger average firm size. Both wages and average profit to entrepreneurs are higher for the high capital group.
The assumption of two separate economies is too strict for our purposes, so we assess the implications of less than full segmentation. Assume that a fraction θ< 1 of the individuals in the low capital group could be hired by the individuals in the high capital group. Since in equilibrium π = w for the marginal entrepreneur with talent z, and zh > zl, it is given that both the marginal entrepreneur and all employees in the low capital group would want to work as employees in the high capital group. Hence, if θ does not bind, labour would move from the low to the high capital group until wl = wh which implies that zh = zl and there will also be equal capital–labour ratios in the two segments. So workers and entrepreneurs from the low capital group would move to the high capital group and become workers there. However, the more interesting case empirically is where θ binds, and we add θ to the superscript to indicate this situation. Hence, if only a fraction of individuals are allowed to work in the high capital segment, for example if some high-caste entrepreneurs are more liberal than others and start hiring lower-caste workers for jobs that were previously restricted to high-caste workers, then we have that wlθ < whθ and zhθ > zlθ. The general result from the pure segmentation is maintained, albeit with intermediate values of the variables wl < wlθ < whθ < wh and zh > hhθ > zlθ > zl. Since we do not get the full competitive solution and thus, less than optimal labour allocation in the high capital segment, capital per worker would be higher in the high capital segment, klθ/llθ < khθ/ lhθ.
In the areas under study, the caste system is enforced relatively strictly. The high-castes hire lower-caste workers for only some types of work and regularly avoid working directly with them. Moreover, the high-castes also have more capital and better access to credit in the capital market. The model suggests the following hypotheses. Individuals from the higher castes will:
run larger businesses with more capital per worker have a larger share among themselves working as opposed to running a business, and have higher wage levels and lower returns to capital.
We turn to these hypotheses in the next section.
Caste, Endowments and Livelihood Strategies
We categorise the households into four hierarchical groups based on social identity. The Terai low castes, mostly Musahar and Bantar, are treated as one group and labelled ‘Terai Dalits’. The local ethnic groups that in Nepali are called Janajatis are labelled here as the ‘Terai ethnic group’. They are mostly from the indigenous groups of Tharu and Rajbanshi and are considered to have higher social status than the Terai Dalits. Above the Terai ethnic group in the social hierarchy, we have the ‘Terai higher caste’, which consists of castes considered to be of higher social status. Finally, the ‘Hill origin castes’ basically consists of Brahmins and Chettris that are usually considered to have the highest social status. These are high-castes that at some point in time have migrated to these Terai villages.
Table 1 shows that almost half of the households in the random sample were Terai Dalits, while this group represents 32 per cent of households in the non-random business sample. The Terai ethnic group represents around one-third of both samples while the Terai higher castes are represented by 5 and 17 per cent of the random and business sample, respectively. The Hill origins amount to 17 per cent in both samples.
Social Groups by Sample

Land Ownership
Landholding is an important component of the capital of many households. Owning much land may influence their choice of livelihood strategy beyond the opportunity of farming. Larger plots can be profitable due to the low agricultural wages in Eastern Terai and strong bargaining position of landlords (Hatlebakk, 2002, 2004, 2007). Hence, landowners may generate substantial cash income. This can be used to save for investment purposes, including business investments, but also for lending to others. In addition, very low wages make it possible for landowners to spend their time on other income generating activities since workers can take care of most of the farm tasks. Moreover, since land can be used as collateral, it is important for access to credit—particularly larger loans from banks. Since access to credit is usually listed as the main obstacle to business growth among entrepreneurs, landholders are in a favourable position for developing larger companies. Land in semi-urban areas has also become an item of speculation where large profits can be made by purchases and sale of land in a market with rapidly increasing prices. Insiders in this market can make large profits, which in turn can be invested in businesses. Nevertheless, some landowners may still choose to be farmers, especially those with smaller plots and few other opportunities.
Landlessness and socio-economic indicators of poverty are highly correlated in the Eastern Terai (Hatlebakk, 2007). Table 2 indicates that the two villages under scrutiny are very poor. Among all respondents in both samples, 65 per cent were landless while 21 per cent owned relatively small plots of arable land. In contrast, the Nepal Living Standard Survey 2003–04 found that only 33 per cent of households in Eastern Terai were landless, which suggests that we were successful in surveying poorer villages. The distribution of arable land across caste is similar for the two samples. Around 80 per cent of the Dalits were landless in both samples and most of the Dalits owning land had small plots. Landlessness was also prevalent among the other castes with roughly half of the Terai ethnic group and Hill origin castes owning land in both samples. The Terai higher castes were more divided in that landlessness was as prevalent as for the Dalits while landowners had larger plots. It is also interesting to note the difference in land ownership between the random and business sample of the Terai higher castes. Moreover, in the business sample, the Terai higher castes have a much higher degree of landlessness and fewer households own larger plots as compared to the Terai ethnic groups in the random sample. Taken together, this suggests that Terai higher caste households in the business sample can have quite different socio-economic status depending on the size of their business as compared to a representative higher caste household in these villages.
In both samples we find that 35 per cent of households own arable land and that the distribution of plot size is highly skewed. A few own large plots, only five households own plots of 100 kattha (3.3 hectare) or more, while most of those owning land have very small plots. Even though the mean land size among landowners is 33 kattha (1.1 hectare), the median is 14 kattha (0.5 hectare).
Table 3 gives the distribution of plot size for all households, including the landless. The mean land size is four to eight times higher in the random sample for the higher castes compared to that of the Dalits. This is similar to the means in the business sample, although here the Terai ethnic group and the Dalits have the same mean. Focusing solely on those who own land gives basically the same pattern: the mean and median land size for other castes in the random sample is 40 to 350 and 20 to 260 per cent higher than for the low castes.
Arable Land Ownership by Sample and Social Group (30 kattha = 1 hectare)

Land Ownership by Land Size (kattha) and Social Group

Given the high degree of landlessness for the three groups with lowest social status, it is not surprising that the median landholding in the samples is zero. However, even for the Hill origin castes plot sizes are very small with a median of 5 kattha (0.2 hectare) for the random sample and 9 kattha (0.3 hectare) for the business sample. Taken together, this implies that land ownership varies a lot even within social groups.
Education
Education can play an important role for the livelihood strategy of the household and their ability to escape poverty. In particular, having a well-educated member increases the likelihood of the person to get a salaried job, or even to take advantage of business opportunities in the village. Salaried employment generates a relatively high income and can thus enable the household to build capital through saving, which in turn can be used for investments in profitable opportunities. Even though the household head is often the largest contributor to income generation in the household, other members can also contribute substantially; we thus assess the education of all members.
Table 4 shows that very few Dalit household heads have any education. This is in sharp contrast to the other social groups in the random sample: 64 per cent of the Terai higher castes and almost half of the Hill origin and Terai ethnic heads have some education.
Among households with educated heads, we see that all groups in the random sample except the Hill origin are more concentrated in the two lowest education completion categories—Grade 1 and Grade 5. Again the Dalits stand out as almost all educated Dalit heads are in these lower education categories. The Hill origins with educated heads are more concentrated in the higher categories with 29 per cent of random sample Hill origin heads having completed Grade 9 or higher. The Terai ethnic and higher castes in this sample also have substantial shares of heads with Grade 9 and higher education with 10 and 13 per cent respectively, while only 1 per cent of Dalits are in this category. In the random sample, no one in the low caste group has higher education or an SLC (School Leaving Certificate—the final exam after 10 years of schooling). The two intermediary groups have 4 to 6 per cent of the households with SLC or higher education. Again the Hill origin group is in a more favourable position with 15 per cent in the random sample having SLC or more education.
Education of the Household Head by Social Group (by level of education completed)

We see that more of the Dalits and the Terai ethnic heads have attended school in the business sample as compared to the random sample. Moreover, the Terai ethnic heads in the business sample are more concentrated in the higher levels of education (from Grade 9 and above) than they are in the random sample. The Hill origin group has a higher share of ‘intermediate and higher’ education in the business sample as compared to Hill origins in the random sample, while the same is true for the Terai higher castes when it comes to Grade 9 and SLC—although the low number of observations precludes any conclusion. We also note that the Terai higher castes have a larger share of uneducated heads in the business sample as compared to the random sample.
Other household members’ education is also likely to influence household livelihood strategies. Even if only 28 per cent of the household heads in the random sample are educated, we find that 83 per cent of the households actually have educated members. Table 5 shows the distribution of the highest educated member of the households by group and sample.
Again we see in the random sample that the Dalit households are more likely to comprise all uneducated members—22 per cent for the Dalits as compared to 3 to 9 per cent for the other groups. Similarly, in this sample one-third of the Dalits have a household member with Grade 1 education, while the other castes range from 2 to 18 per cent. The Dalits are thus much less represented in the higher education categories in this sample; 44 per cent of them have a member with at least Grade 5, while the Terai ethnic and Hill origin groups have 94 per cent of their households in this category. The Terai higher castes have a slightly lower share (63 per cent) than the ethnic and Hill groups, but far higher than the Dalits. We also see a large difference between social groups in the share of households with SLC or higher education. In the random sample, almost three out of four Hill origin households have one such member, while only one out of 16 of the Dalits have any member with SLC or above. The Terai ethnic group and the Terai higher castes are placed in between as the former has 37 per cent of households with at least SLC or above in this sample while the latter has 18 per cent.
We note that in the business sample, almost all households have at least one educated member, and the difference between social groups in this category is negligible. Moreover, within the social group, on an average the person with the highest education in the household in the business sample is more educated as compared to the corresponding person in the random sample. Among those households in the business sample who have at least one educated member we basically find the same pattern as for the random sample when it comes to the lowest and highest education levels—a much higher share of the low caste households have Grade 1 as the highest education while the Hill origin group again turns out as much better educated than the others as 80 per cent have SLC or higher, compared to around 32 per cent for the ethnic group and higher castes and only 10 per cent of the Dalits. For Grade 5 and 9, however, we find similar shares in the range 53 to 58 per cent for all groups in the business sample except for the Hill origin due to their concentration in the higher education categories.
Highest Education in the Household, by Caste Group

Taken together, this suggests that having a more educated member increases the likelihood of doing business. There are various mechanisms that may explain the pattern as it could be that households running business have some capital and choose to diversify by investing in both education and business, but also that having a more educated member can be beneficial for business operations.
Social Networks
Personal networks can play many important roles in business transactions, especially in poor countries where they may substitute for high transaction costs required to use the market (Rauch & Casella, 2003). Banerjee and Munshi (2000) and Fafchamps (2000) find that personal networks are important to capital mobilization for factory establishment, Conley and Udry (2010) find significant effects of networks on the spread of new technology and Kajisa (2007) finds in a village survey in the Philippines that in order to start in a self-employment occupation (i.e., microbusiness), networks of all kinds of relationships (i.e., family, relatives, friends and acquaintances) are important. Moreover, others find that networks are important for detecting promising investment opportunities (Patnam, 2011), for improving a firm’s access to production technologies (Parente & Prescott, 1994) and for sharing information about customers or suppliers (Greif, 1993; McMillan & Woodruff, 1999). In addition to a likely direct positive effect on business transactions, it seems that personal network may contribute to household income from other occupations, which in turn can enable them to save and invest for business purposes (Kajisa, 2007). In cross-sectional data, however, it is important to note that the causality may go in both directions. Having a large network could lead to more business opportunities, but doing business could also lead to a larger network.
Applying the same network measure as Kajisa (2007), our survey includes information about the social networks of the household members by asking them if they know potentially useful persons in their society—like politicians, government officials, managers and owners of enterprises, NGOs, etc. Respondents were also asked whether they knew these persons three years ago, and we report on this variable since lagged values could reduce the challenge of reverse causation.
Personal networks differ a lot between the Dalits and the others. The average number of such contacts in the random sample is close to six and not statistically different between ethnic, higher and Hill origin groups that average around seven contacts. However, the Dalits have fewer contacts, slightly higher than five on average, which is significantly different from the other castes. Table 6 shows the distribution of the number of such people that the household knew three years ago and we see that the business sample have more contacts than the random sample—although a statistically significant difference only within the Dalit group. In the random sample, there is a substantial difference in the share of households with seven or more contacts between the Dalits (20 per cent) and the other castes (36–57 per cent). We also see that within social groups, a much larger share of people in the business sample have seven or more contacts except for the Hill origin castes.
Livelihood Strategies
To get an overview of how the different social groups are making their living, we categorised their livelihood strategies according to the primary, secondary and tertiary income-generating activities of all household members. Note that by using information on three occupations for a number of household members we shall not expect to find many households that rely on a single activity. Our classifications are according to whether they were doing business only, whether they combined business with salaried work, farming, or daily labour. Households not engaged in business are categorised according to whether they relied solely on salaried jobs, farming, or daily labour, or if they combined farming with labour.
Social Network, Share of Households by Caste and Sample Who Knew Key Persons 3 Years Ago, by Number of Key Persons
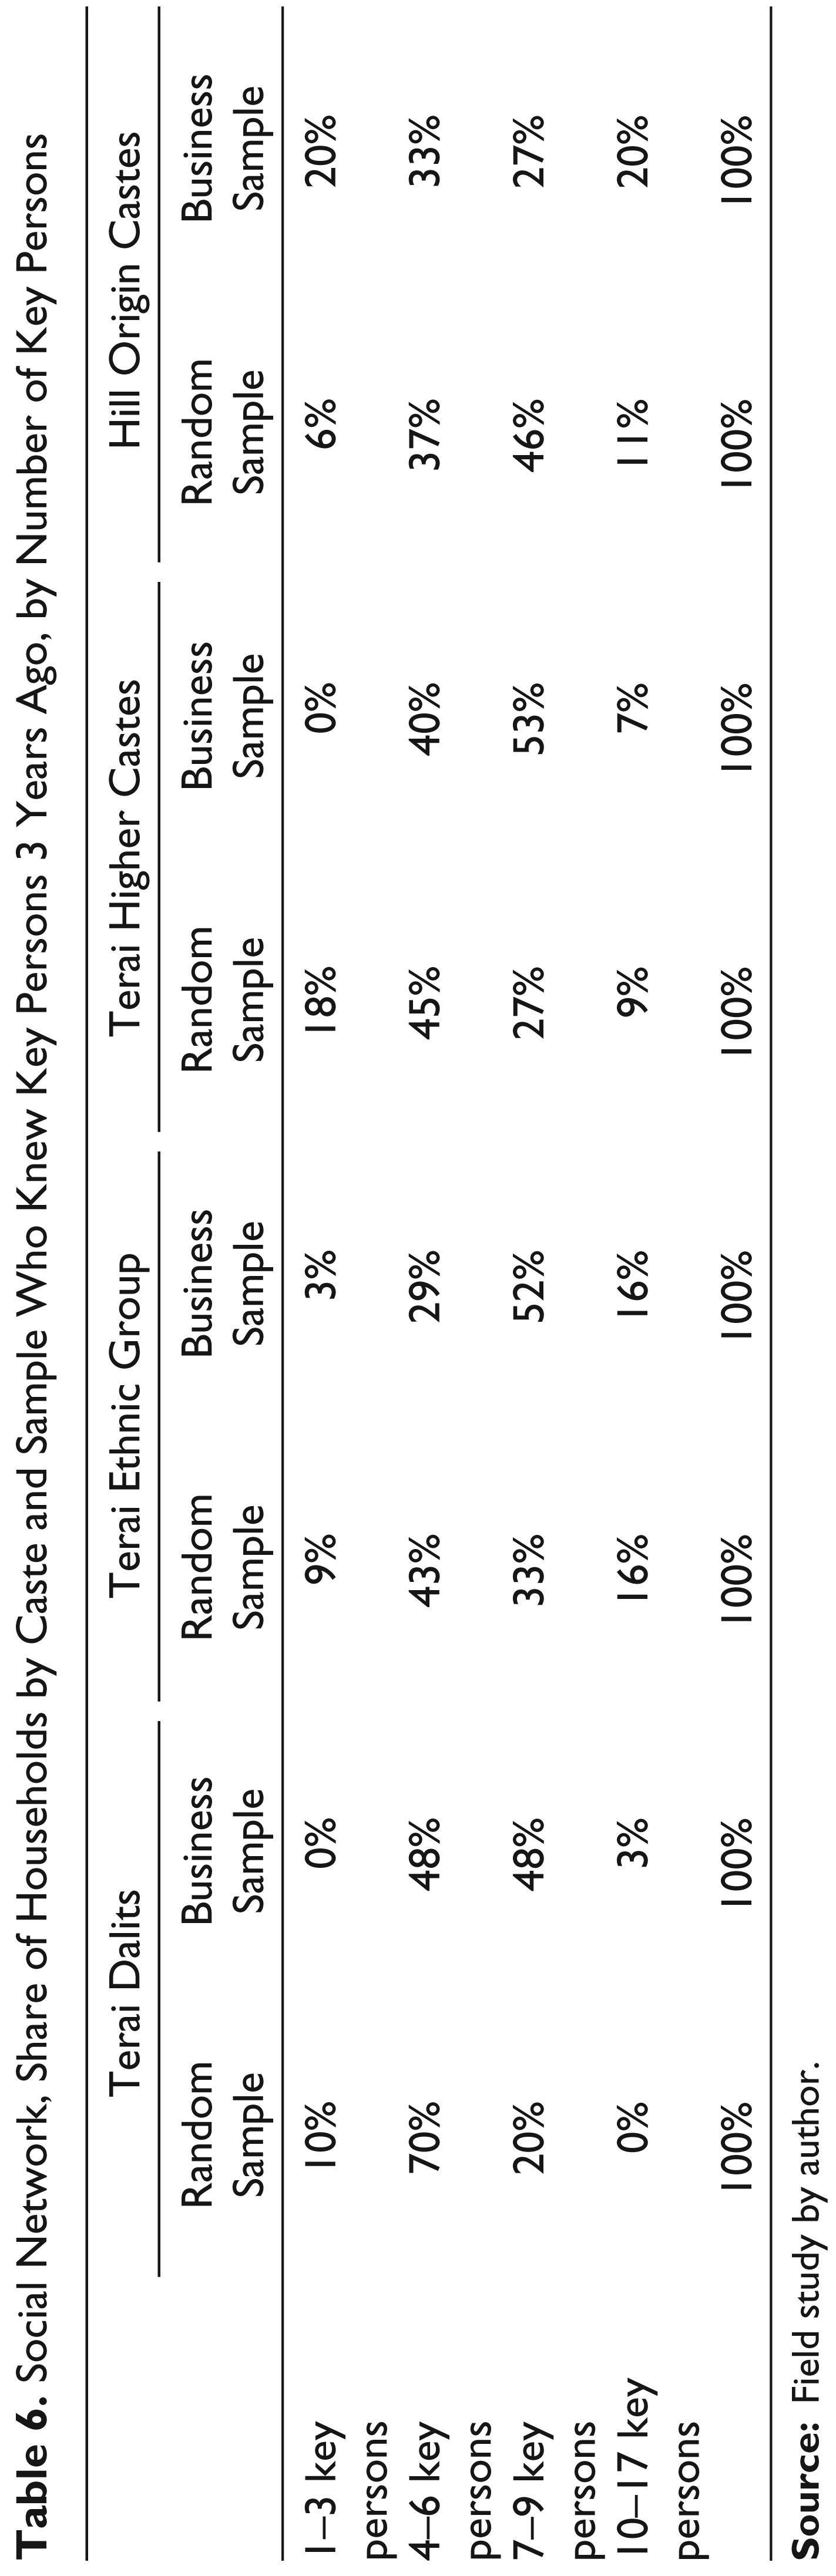
Table 7 reveals that not many rely solely on business—only around 6 per cent of the random sample and 13 per cent of the business sample. Most combine their business with farming, labour or salaried work—as many as 74 per cent of the business sample apply this strategy while the corresponding figure for the random sample is naturally lower since many do not do business. Still, 32 per cent of all in the random sample combine business with these types of income sources suggesting that this is one of the main livelihood strategies in addition to the 46 per cent who rely on labour, farming or a combination of these.
Main Livelihood Strategy of the Household by Sample

For the discussion about selection into business versus becoming an employee, we need to use the random sample to describe the distribution of livelihood strategies. Table 8 reveals that the Terai higher castes rely to a much larger extent on business only as compared to the other castes. More than 64 per cent of the households in this group have business as the sole income source, while almost none of the other groups apply that strategy. The high reliance on pure business is confirmed by comparing their share in the business sample to their share of the total population—they represent 17 per cent of households in the business sample but only 5 per cent of the random sample.
Moreover, the Dalits are over represented in combining business with labour as 27 per cent of households apply this livelihood strategy. The other social groups rely to a much lesser extent on this combination (less than 10 per cent). Dalits are also over-represented in the group that combines business with labour as more than every fourth household apply this strategy compared to less than 10 per cent for the other caste groups. The Terai ethnic group is likely to combine business with farming, where the business for this livelihood strategy is probably small shops with predominantly agricultural products from their own farms. Both Dalits and the ethnic group are also over-represented in the wage labour category.
Main Livelihood Strategy of the Household by Caste, Random Sample (n = 199)
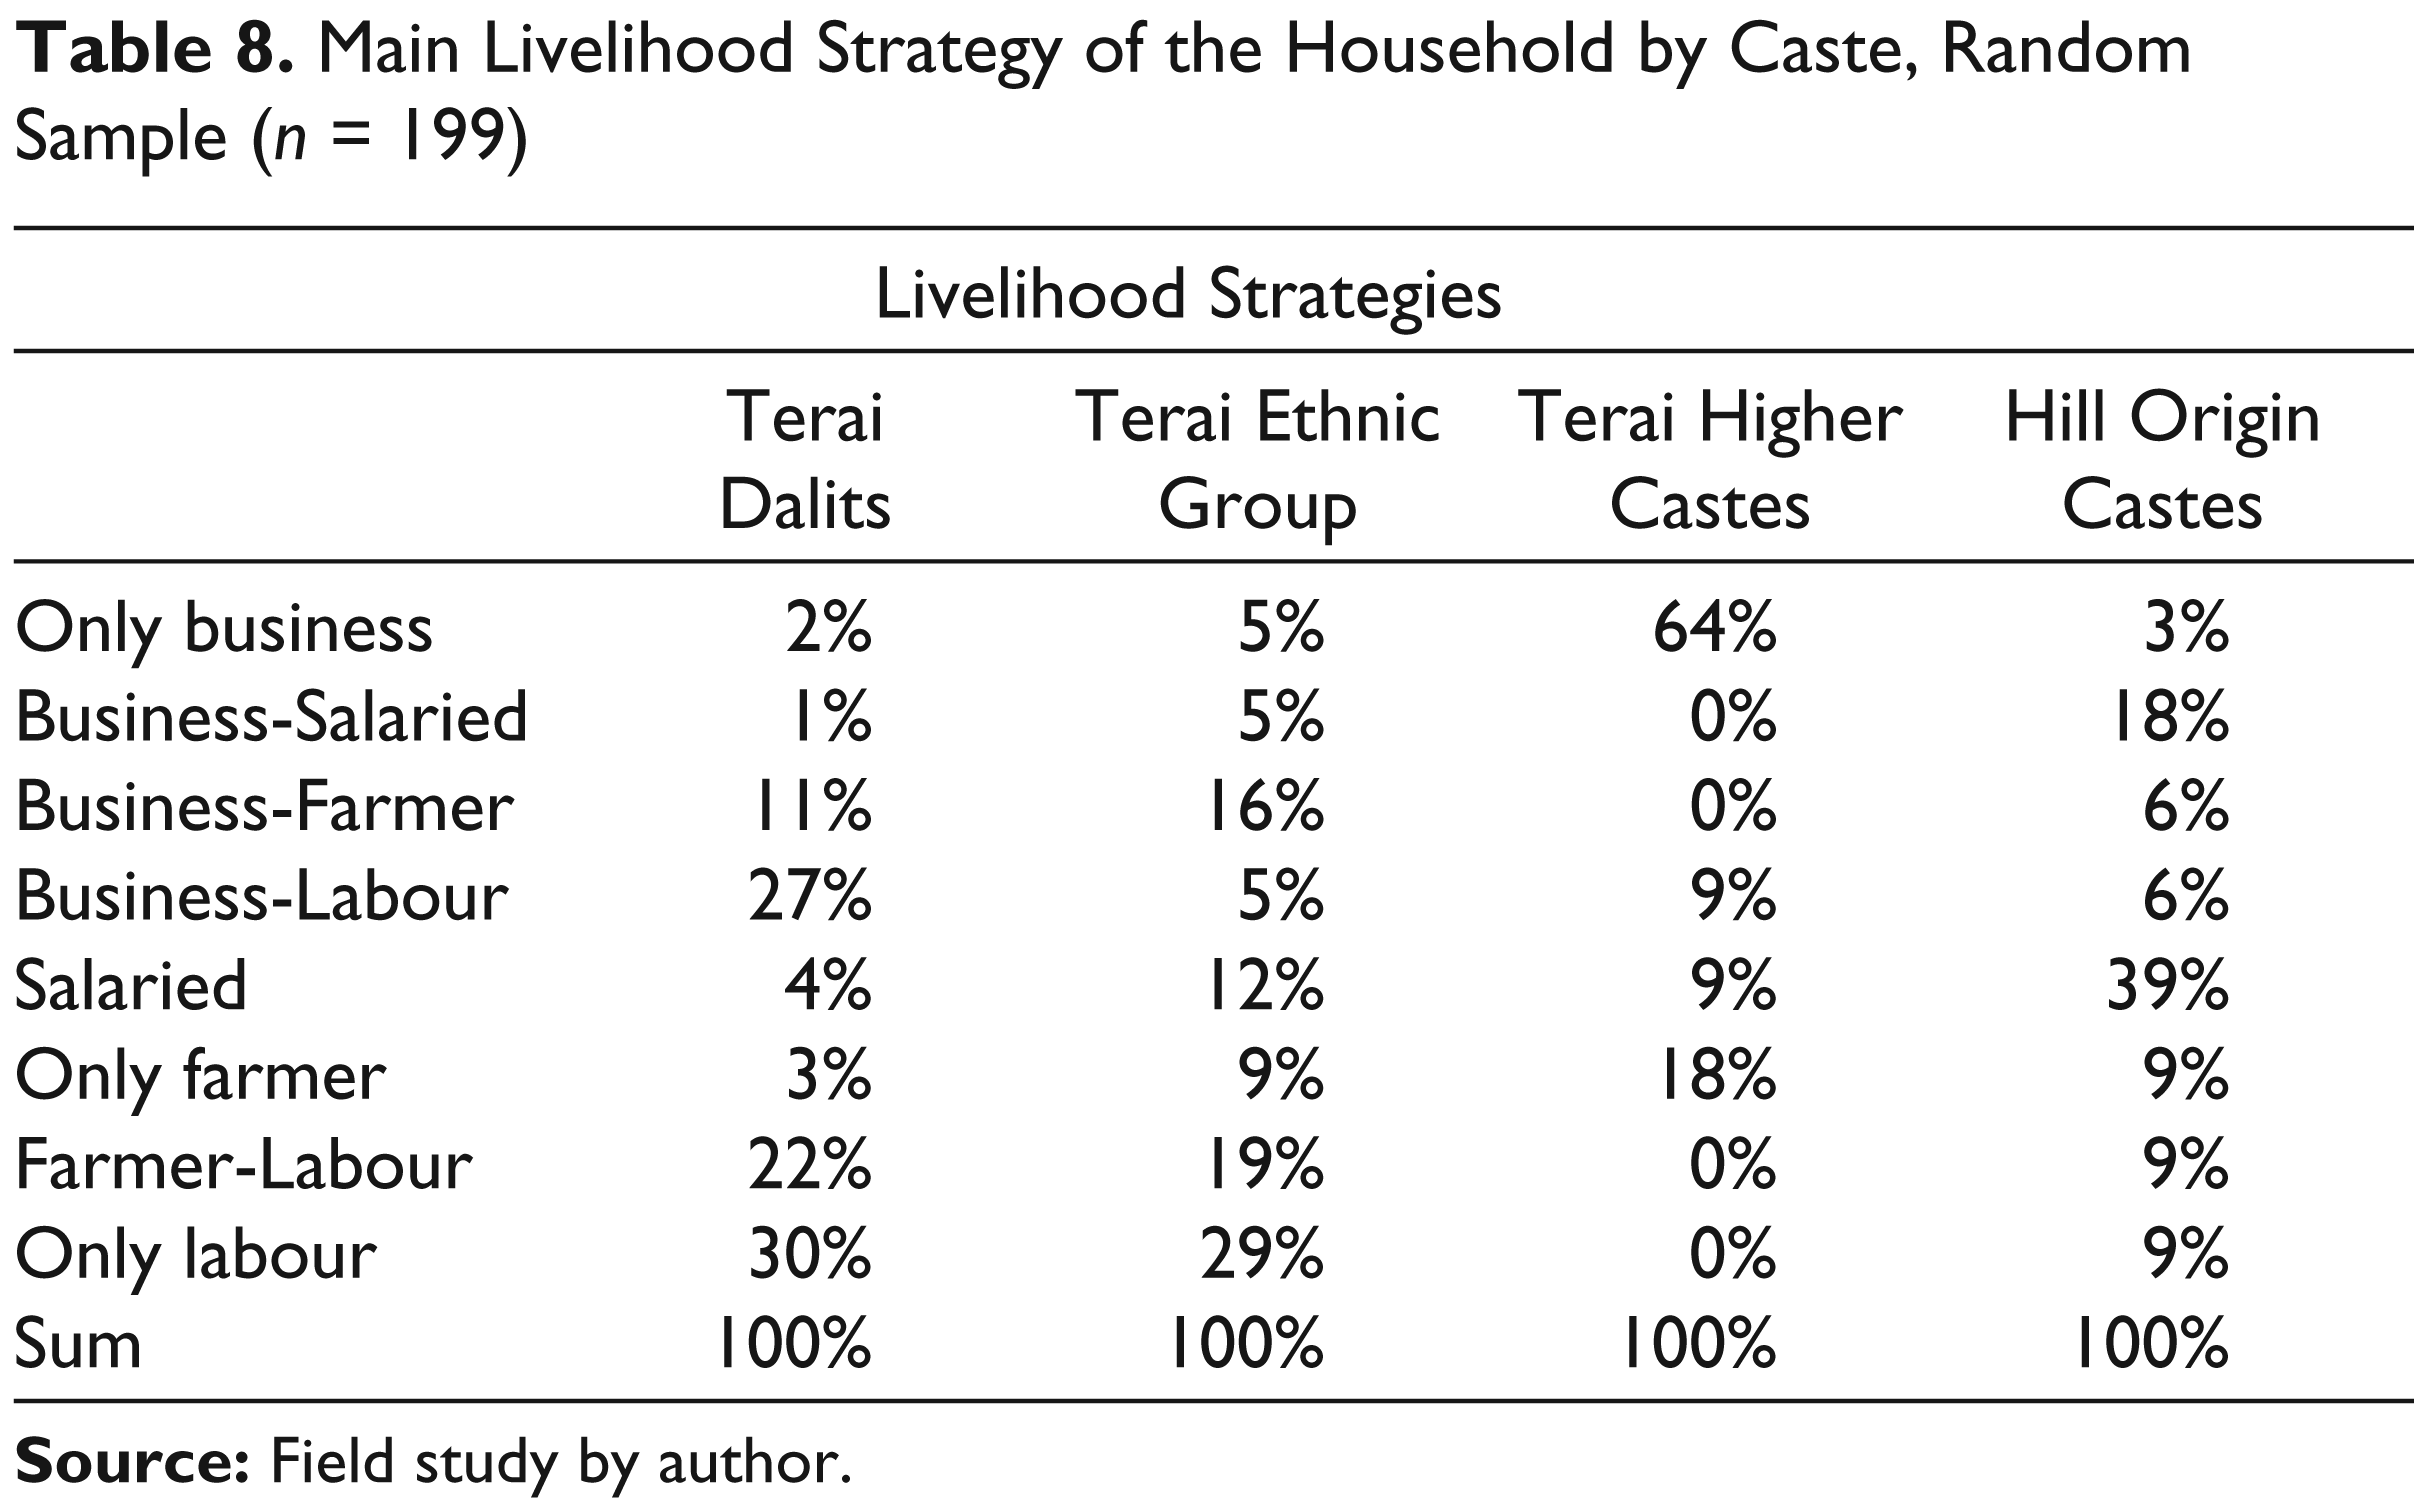
It is evident that many more of the higher castes rely solely on salaried work. The Hill origin group stands out with 39 per cent using this strategy, compared to only 4 per cent of the Dalits. The Terai ethnic group and Terai higher castes fall in-between with 12 and 9 per cent, respectively.
Taken together, the dominant strategy for the Hill origin group is salaried employment as almost 60 per cent of these households have at least one member with such an occupation. The Terai higher castes rely mostly on business as almost three out of four household have a member running an enterprise. The low caste is predominantly in farming and labour, although many of them combine this with business. This pattern is similar to the ethnic group, although this group is more diversified across livelihood strategies.
Constraints for Doing Microbusiness
The role of capital is central in models of economic growth. The entrepreneurs’ decision to invest in a business is influenced by their access to capital and its rental price, but likely also by a range of other factors. Evidence from investment climate surveys focusing on larger formal firms suggests that the cost of enforcing contracts, property rights, the availability of public goods, corruption, social strife and risk of losing assets (expropriation, theft, natural disasters, etc.) all impact investment decisions. The investment climate is often referred to as the degree to which these factors create an environment favourable for private companies’ investments (Deininger, Songqing & Sur, 2007).
The main question of interest in this section is whether the microbusiness investment climate differs between social groups. A priori, one should expect the obstacles to be related to characteristics of the business (e.g., lack of electricity is a problem for milling, poor roads are a problem for transport and high interest rates are a problem for informal businesses) and not to the social group of the owner. Differences in obstacles to doing business between social groups that is not explained by such observables could be a sign of underlying mechanisms of discrimination or segmentation based on the social group. In the credit markets of Nepal, there is evidence of segmentation as lenders diversify according to observable characteristics of the borrowers (Hatlebakk, 2011). In particular, Dalits have to pay much higher interest rates than other groups after controlling for other factors that may affect the interest rates. This is also a prediction of our model as the rental price of capital will be lower in the low capital (i.e., for lower castes) segment.
The household survey and business module contain questions about the respondents’ perception about constraints for doing microbusiness in the area where they live. Asking all respondents in both surveys to think of a business that they have experience with, have knowledge about or a business that they would like to start, we asked them to rank 17 potential problems for doing business. In line with other investment climate surveys, the respondents were asked to state whether the problem is very important, important, of little importance or not important. The problems included finance, market situation, transport, knowledge, infrastructure, regulatory issues and labour issues. Moreover, we also asked them in open-ended questions to explain what the most important problems for doing business were, and allowed multiple answers.
From the open-ended questions and among the 17 potential problems for doing business, notes that government regulation, informal or formal taxes, difficulties with labour, physical threats, unavailability of fuel, distance to the main city (Biratnagar) and unreliable transport of goods and supplies are not considered generally to be important obstacles for doing business by any of the social groups. Table 9 shows that the two obstacles that scored highest in the pre-determined list of problems described above also score highest as the main obstacles identified in the open-ended question. The first column shows that 63 per cent respondents state that lack of capital is the key constraint while almost half of the respondents indicate that knowledge and skills are the most important constraints. Similarly, column two shows that 66 per cent thinks that being unable to get a bank loan is an important or very important obstacle, while 71 per cent thinks the same about lack of knowledge. However, there were large differences in responses for the three other important obstacles: Even if 65 per cent of respondents think that high interest rates is an important or very important challenge, only 9 per cent thinks it is the most important problem. Unreliable electricity and poor road quality are perceived to be important or very important by 48 per cent and 31 per cent, but only 7 and 13 per cent consider them the main problem for doing business.
Self-reported Obstacles for Doing Business, Both Samples (n = 291)

Given the importance attached to lack of skills and knowledge and access to capital we assess them by livelihood strategy and by social group. Table 10 shows that as many as 94 per cent of those who rely solely on farming report that lack of knowledge is the main obstacle for operating business. The share of those who combine farming with business reporting the same is considerably lower (62 per cent) and could thus indicate that many in the farming-only category could combine this with business if the knowledge and skills barrier was reduced. This could also be the case for those who rely on labour only as 80 per cent of them state that knowledge is an important or very important obstacle, compared to 70 per cent of those who combine labour and business.
Knowledge as an Important Obstacle, by Livelihood Strategy, Both Samples (n = 289)

A programme to enhance skills and business knowledge would need, however, to take into account that many with these livelihood strategies never attended school. This is especially the case for those who rely on labour alone or in combination with farming or business as more than 80 per cent of such household heads never attended school. We also note that those who specialise in only doing business, only 20 per cent of them considers lack of knowledge to be the main problem despite the fact that almost half the household heads in this group never attended school. This suggests that the experience gained through specialising in business renders skills and knowledge as lesser problems for this group compared to those with other livelihood strategies.
Table 11 reveals relatively small differences in the importance attached to capital for doing business across livelihood strategies. However, we see that among those who have specialized in business, there is a higher share reporting that lack of capital is the main problem (68 per cent) as compared to the share reporting that inability to get a bank loan is the main problem (56 per cent). Many of those who do business only have a portfolio of informal loans. Hence, they may be aware that the relatively small scale of their business operations are usually not of interest to formal banks due to high transaction costs. So even if most of the households with other livelihood strategies than specialisation in business report that inability to get a bank loan is an important or very important obstacle, it does not imply that the solution is to facilitate bank lending. Nevertheless, high shares of all groups report lack of capital as the main problem for doing business. This is highest for those who do farming only (75 per cent) and lowest for those who combine business and salaried work (50 per cent).
Capital as an Important Obstacle, by Livelihood Strategy, Both Samples (n = 289)

Now we assess whether there are differences in perceived obstacles by caste. Table 12 displays the five most prevalent obstacles. There are small differences between caste groups when it comes to lack of capital, but much larger variations for lack of knowledge. A much higher share of Dalits (56 per cent) compared to Terai higher castes (38 per cent) reports lack of knowledge to be the main obstacle while the two other groups fall in-between (46 per cent). We see that Dalits are over-represented in wage labour, which does not require much skills and knowledge. Moreover, the Terai Higher castes are over-represented in business only, which is likely to require some knowledge. Hence, it seems that skills and knowledge gaps may contribute to the segmentation of the livelihood strategies across castes. A larger share of Terai higher castes indicates that the interest rate is too high, which again could reflect the importance of borrowing for business purposes since 73 per cent of these households are engaged in business. Finally, the two groups with the highest socio-economic status have three times higher share of households indicating that the Banda (strike) is the main obstacle for doing business compared to the two groups with lower status.
Main Obstacle for Doing Business, Both Samples (n = 291)

Turning to the pre-specified list of obstacles, Table 13 shows small differences across social groups in the shares reporting inability to get a bank loan and high interest rates as important or very important obstacles. Somewhat larger differences are found in shares reporting lack of knowledge—again more Dalits indicate that this is important compared to Terai higher castes while the two other groups fall in-between. We also see that there are substantial differences across social groups with respect to the importance of unreliable electricity—the share of Terai higher castes indicating that this is an important or very important obstacle is 50 per cent higher than the share of Dalits indicating the same. For this obstacle we see a division between the groups with higher status compared to those with lower status as Hill origins have similar shares as Terai higher castes while Terai ethnic groups have similar shares to the Dalits. The differences may be explained by the nature of the businesses that respondents were considering during their response. Dalits usually run very small businesses that do not require electricity. The other groups, and especially those who run somewhat larger microbusinesses, could be considering slightly more advanced businesses that would benefit from stable electricity. If segmentation leads Dalits to stick to the lowest scale of microbusiness operations, these patterns should be expected. When it comes to poor road quality Terai higher castes have much higher shares compared to the Terai ethnic group with the Hill origin and the Dalits having shares in-between. Again the scale of operations could matter for their responses.
Importance of Obstacle, by Caste, Both Samples (n = 289)

Discussion
An important implication of the model is that the segmentation based on caste leads to a separation in livelihood strategies across groups. More capital among the high castes together with restrictions on capital rental and hiring labour from other social groups lead to larger businesses in the high caste segment. This also leads to higher paid salaried employment for these castes. The model has the opposite prediction for the low castes: low wages and high shares engaged in smaller businesses.
We find such a structure in our data with respect to the highest and lowest caste using land ownership and education as proxies for capital. The Hill origin castes are to a large degree in salaried employment, and some households also combine this with running a business—which is consistent with the model. The Dalits, on the other hand, rely to a large degree on wage labour, which is typically the lowest paying employment opportunity in these areas, and are also over represented on combining business with labour. These businesses are small entities and mainly self-employment.
The model predicts that the segmentation would lead to larger businesses in terms of capital per worker among the higher castes. We find large differences between castes in our samples—in accordance with the segmentation hypothesis. The capital to labour ratio in our data is measured by the initial capital used for starting the business plus later investments in that business, divided by the average number of people working in the business. We find that the Terai higher castes invested almost four times the amount that the Dalits invested per worker. Using an alternative capital–labour measure (capital used to start the business divided by the number of workers at the time for start-up) yields similar results. Similarly, Hill origin people invested three times more capital per worker than the Dalits, while the Terai ethic group had close to double the capital labour ratio as compared to the Dalits.
The second prediction of the model is that high castes will have a larger share among themselves working as opposed to running a business since the salary is high in this segment compared to the profit of the businesses. Our data support the model in that highest castes, the Hill origins, have a much higher ratio of salaried employment to business as compared to the lower caste groups. Nevertheless, including all types of employment alters the picture: our data also shows that there are small differences in the random sample between the shares of businesses to the number of employed people within each social group. Since many Dalits work as agricultural labourers, this gives a high share of workers in relation to businesses. This diverse pattern prevents us from drawing firm conclusions on this prediction.
The model also predicts that wages and salaries should be lower for low castes and that returns for capital should be higher than for the high castes. On the former, the average remuneration for a household member working for a wage or salary is twice as high for the Hill origin castes as for the Dalits. 4 Even for salaried work only; Hill origins earn 70 per cent more than Dalits in salaried occupations. The Terai ethnic groups earn 30 per cent more than the Dalits in wage and salary employment, while the Terai higher castes have too few household members in such employment for statistical inference. Unfortunately, we do not have figures for returns to capital. The wide coverage of microcredit in the area and the fact that households use the loans for both consumption smoothing and investment purposes implies that the interest paid on loans is a poor proxy for returns to capital. Hence, even though the average interest rate in our samples does not vary much across social group we do not conclude with respect to the prediction of differences in returns to capital. Others have found evidence of strong segmentation in the credit market with Dalits paying higher interest rates than others, which support our model (Hatlebakk, 2009).
Taken together, there is relatively strong support to the model of caste-based segmentation of the labour and capital markets. Segmentation implies that the lower castes will be constrained by their limited asset holdings and lack of credit supply. Hence, any intervention that increases capital or labour mobility across castes would lead to more businesses and higher profit among the low castes in addition to higher equilibrium wages for this group. Since the low castes are also the most disadvantaged, such interventions would reduce poverty. Moreover, since capital in a segmented market does not move to the most profitable businesses, it is evident that total production in the economy will be higher with less segmentation.
However, it is evident that the segmentation works through the labour and capital markets in relatively subtle ways and may not be easily detectable by the workers and entrepreneurs themselves as an obstacle for doing business. Hence, it is perhaps not surprising that no one in our samples identified discrimination based on caste as a main obstacle to doing business.
Our survey included rankings of obstacles according to degree of importance and also asked respondents to identify the most important obstacles. The responses provide inputs to prioritisation of interventions important to the growth of microbusinesses. Knowledge and skill enhancement and access to capital are considered the main obstacles by almost all the different groups. This conclusion is strengthened by the fact that both those who are currently running an enterprise and those that potentially could start such an enterprise indicated that these are the most important challenges for doing business.
However, one difference stands out: A lot fewer of those who specialise in business state that knowledge and skills are the main obstacles. They typically run larger businesses than those in other livelihood groups. Our data shows that the value added for the business-only group is more than 80 per cent higher than the value added of those that combine business with other activities. The low importance attached to knowledge for the business-only group is likely to be a result of the fact that when business is their sole occupation; they are probably doing well since they are able to sustain the household with this activity only. Hence, they might feel that they have the knowledge they need. Programmes to enhance business knowledge and skills should thus be designed to take into account that those who rely solely on business might be interested in different types of support programmes to stimulate further growth.
Despite the fact that microbusiness is important to these households’ livelihood, very few have received any business training. In the random sample, every third household was involved in business in one way or another, but only 1 per cent of the households in the sample had ever received any type of business training. In the business sample, only three per cent had received business training. Moreover, the high degree of illiteracy among those who do microbusiness, and those who potentially could start such business, indicate that such programmes should be designed so that it is feasible to participate even without any prior numeracy and literacy skills. A more comprehensive training course could include numeracy and literacy skills, which would not only be useful for them to develop more advanced businesses but would also be beneficial in most other livelihood strategies. Unfortunately, there are few conclusions from research on the impact of business training on microbusiness profits, sales and employment (McKenzie & Woodruff, 2014) so programme design should involve careful piloting and testing.
Moreover, access to capital is important to all caste groups and all livelihood strategies. However, potential investors often have limited markets in these villages since people produce their own food, and limit their purchases to small amounts of readymade food, some transport and a few services while reserving larger purchases for visits to towns or cities. They consume most of their income, so savings and thus investments are low and the local demand will be stable and markets are not growing much without any investments from the outside or other inflow of resources. Hence, interventions to support savings to increase the capital stock of the village economy seem to be one viable starting point to trigger investments.
Through our qualitative investigation we also noted that entrepreneurial talent and desire to grow the business is likely to matter for the success of their firm performance. It is important to note that the implication is not necessarily that business development programmes should be targeted towards this group. On the contrary, our discussions with the respondents indicate that skill training, microcredit and other types of support can help poor people secure a livelihood in poor areas even for those without much entrepreneurial talent.
Our qualitative interviews indicated that that there could be relatively high starting and closing rate of micro businesses in these villages. The most important reason for this pattern seems to be that many entrepreneurs often test out their business ideas to see if it is viable. If not, they close down the business in order to explore other opportunities. Some of the reasons for closure can be attributed to a functioning market—the entrepreneur was not able to supply what was demanded at the market rate. Other reasons lies outside the control of the entrepreneur—our qualitative interviews revealed shocks like illness, loss of capital and disappearance of customers (which happened when nearby factories closed down). One issue arising from this is that the provision of adequate insurance may contribute to lower closure rates.
Another important issue concerns targeting of business training, that is, who should be eligible for participation. The research literature on business training suggests two distinct approaches. The first is to have a broad coverage among entrepreneurs and potential entrepreneurs to also capture those who are not aware of the benefits of business training. The second approach attempts to target the entrepreneurs with the highest probability of success by introducing business plan competitions. In order to single out those with highest entrepreneurial potential, one could implement several rounds of training where only those with the best test scores will be eligible for further training (see Klinger & Schundeln, 2011).
However, in our setting, the two approaches clearly have complimentary elements. One could for example start with a broad, simple and accessible training programme suited for people with low literacy and numeracy skills, and then let the participants compete in a second round without excluding anyone from further participation. In that way one would be able to stimulate those who opt for microbusiness as a means of survival, and be able to support the entrepreneurs with the larger potential for growth.
Recommendations
Our findings suggests that reducing caste segmentation is likely to have a positive effect on business development, incomes and poverty reduction if labour and capital mobility across social groups is improved. Direct policy measures could be different types of affirmative action in education, the labour market, in the credit market, in training programmes and in governance structures related to the business community. More indirect programmes to stimulate business interaction between socio-economic groups may also be a viable route. Such programmes could be focused on supporting the microbusiness community like establishing business councils, arranging exhibitions, networking events and other types of formal platforms for interaction, and then ensure the participation from all socio-economic group to promote business transactions across castes.
The findings also suggest some priorities for improving the investment climate in the microbusiness segment. All groups apart from those who run larger microbusinesses highlight lack of knowledge and skills and access to capital as the most important obstacles for doing business. Given the high illiteracy rate among the poor in these areas, training programmes need to be designed to accommodate their level of initial human capital. Moreover, our results also indicate that for improving the investment climate for microbusiness, the government need not focus on obstacles relating to government regulation, informal or formal taxes, difficulties with labour, physical threats, unavailability of fuel and transport related issues.