



Abstract
This study examines the bilateral trade relations between New Zealand and India from 1990 to 2014. Using export and import intensity indices and revealed comparative advantage (RCA) indices, it identifies sectors where there is static and dynamic comparative advantage and complementarities. It also examines the extent and movement of intra-industry trade (IIT), using IIT indices, and analyses these indices to consider how trade patterns and relations have changed between 1990 and 2014.
Findings show that trade between New Zealand and India has increased in recent years. The intensity of trade has strengthened, and there has been growth in IIT for a number of industries and product groups. Results also suggest high degree of static and dynamic comparative advantage in a number of product groups. The findings of this study should be relevant to future bilateral trade, economic relations, technology transfer and cultural exchange between New Zealand and India.
Keywords
Introduction
New Zealand has political, security, trade and economic interests in Asia, especially with large economies such as China and India. Bilateral trade between New Zealand and India is currently below potential, despite its strong growth in recent years. Despite the distance between them and their difference in size, their economies are complementary. Hence, there is considerable potential for increasing bilateral trade and economic relations. This is one of the reasons why a free trade agreement (FTA) is currently being negotiated between New Zealand and India.
This study explores the bilateral trade relation between New Zealand and India, using a combination of approaches and methods, such as the trade intensity, the application of static and dynamic revealed comparative advantage (RCA), a trade complementarity index and the Grubel–Lloyd and Aquino intra-industry trade (IIT) indices. These alternative methodologies have not been used previously, with a long-term time series data set, in the context of New Zealand–India trade and economic relations.
The article is organised into six sections. The second section provides an overview of New Zealand and India. The third section presents the context and a brief literature review. The fourth section 4 discusses the methodology and data used. The fifth section presents and analyses the results and the sixth section presents the conclusions.
Background to New Zealand–India Trade
New Zealand is one of the most open developed economies in the world. It is a member of the World Trade Organization (WTO), and as a country is committed to liberalising trade. In recent years, New Zealand has become a party to nine regional, bilateral and multilateral trade agreements: Australia– New Zealand Closer Economic Relationship (1983); New Zealand–Singapore Closer Economic Partnership (2001); New Zealand–Thailand Closer Economic Partnership (2005); Trans-Pacific Strategic Economic Partnership (2005); New Zealand–China Free Trade Agreement (2008); ASEAN–Australia–New Zealand Free Trade Agreement (2010); New Zealand–Malaysia Free Trade Agreement (2010); New Zealand–Hong Kong, China Closer Economic Partnership (2011); New Zealand–Taipei, China Economic Cooperation Agreement (2013); and New Zealand–Korea Free Trade Agreement (2015). Eight agreements are also under negotiation, namely, Anti-Counterfeiting Trade Agreement; New Zealand–Australia Closer Economic Relations Investment Protocol; New Zealand–Gulf Cooperation Council Free Trade Agreement; New Zealand–Russia–Belarus–Kazakhstan Free Trade Agreement; New Zealand–India Free Trade Agreement; Trans-Pacific Strategic Economic Partnership; and New Zealand–Hong Kong Closer Economic Partnership Investment Protocol (Ministry of Foreign Affairs and Trade [MFAT], 2012, 2014, 2015).
With over a billion people, India is the second most populous country in the world; in South Asia, it is the largest economy. During the last two decades, India has experienced rapid growth. During 2000–2010, India maintained an average real GDP growth rate of 12.7 per cent. In 2012, the growth rate decreased to 4 per cent and then increased significantly to 10 per cent in 2014 (UNCTAD, 2015).
The impressive economic performance of India is the result of a reform process that started in the 1990s. Until the 1980s, India followed an inward-oriented economic strategy patterned after the USSR, and with the latter’s disintegration in the late 1980s there was a redirection of economic policies. India started to pursue economic reform which included reducing barriers to exports and limited deregulation of industries. The reform process was expanded in the 1990s, with the liberalisation of the economy and closer integration with the international economy (Ahluwalia, 2002; Thirlwell, 2004).
India has been negotiating regional trade agreements (RTAs) with a number of countries and trading blocs. Most of India’s trading partners are South and Southeast Asia, Europe, Latin America and North America. India has involved in 11 regional, bilateral and multilateral trade agreements with Japan (2011), Malaysia (2011), Singapore (2005), South Korea (2010), Chile (2007), Afghanistan (2003), Nepal (2009), Mercosur (2009), ASEAN (2010), Bhutan (2006) and Sri Lanka (2001). However, being a latecomer, the only RTA actually in operation for some time is the bilateral agreement that India had concluded with Sri Lanka.
Development of Trade Relations between New Zealand and India
New Zealand has a long-standing and friendly relationship with India which has been reinforced by cultural links such as a common language, democratic traditions and sporting relations (Bandyopadhyay, 2013). However, this relationship has not resulted in trade expansion between the countries. India is currently New Zealand’s 15th largest bilateral trading partner. For the year ended June 2013, the overall goods trade between the two countries was over US$ 1.1 billion (MFAT, 2014). In 2014, the merchandise trade between them decreased slightly to US$ 0.9 billion (MFAT, 2015). Although the overall trade between New Zealand and India increased during the last decade, trade relationship between them has remained underdeveloped.
The most recent development in New Zealand’s trade relationship with India has been the progress in discussions regarding an FTA. The process for negotiating an FTA started in 2007. New Zealand’s the then trade minister, Phil Goff, and his Indian counterpart, Kamal Nath, agreed to explore the possibility of such an agreement after an economic analysis of its viability was undertaken.
In 2009, a joint feasibility study was completed, highlighting that the Indian and New Zealand economies were complementary and that considerable potential exists to foster and strengthen bilateral trade and economic relationship. In January 2010, New Zealand’s the then trade minister, Tim Groser, and India’s the then commerce minister, Annand Sharma, announced that approval had been secured for the start of negotiations leading to an FTA. In recent years, the New Zealand India Research Institute (NZIRI) was established by the Council of Victoria University of Wellington in October 2012 to promote and facilitate research on India and New Zealand. New Zealand government announced setting up the New Zealand and India Inc. strategy for fostering trade, investment, technology transfer, tourism, education and cultural exchange (MFAT, 2015).
Context and Literature Review
New Zealand’s annual GDP growth since the early 1990s has been higher than the Organisation for Economic Co-operation and Development (OECD) average. Real GDP growth of 4.0 per cent, which was recorded in 2002, was one of the best performances in the OECD countries. The average growth rate for the previous 4 years from 1999 to 2002, was 3.3 per cent, while for the subsequent 4 years from 2003 to 2006, it was 2.7 per cent rate (OECD, 2012). Growth rates slowed down during the next 2 years, with a negative growth of –1.07 per cent in 2008 and low growth of 0.79 per cent in 2009. During the 10 years from 2001 to 2010, the growth slowed down to 2.6 per cent and further slowed down with a negative growth of –1.07 per cent in 2008 and low growth of 0.79 per cent in 2009, but recovered to 2.64 per cent in 2012, 2.50 per cent in 2013 and 3.10 per cent in 2014 (OECD, 2015).
New Zealand Bilateral Trade with India (value and percentage growth): 1990–2014

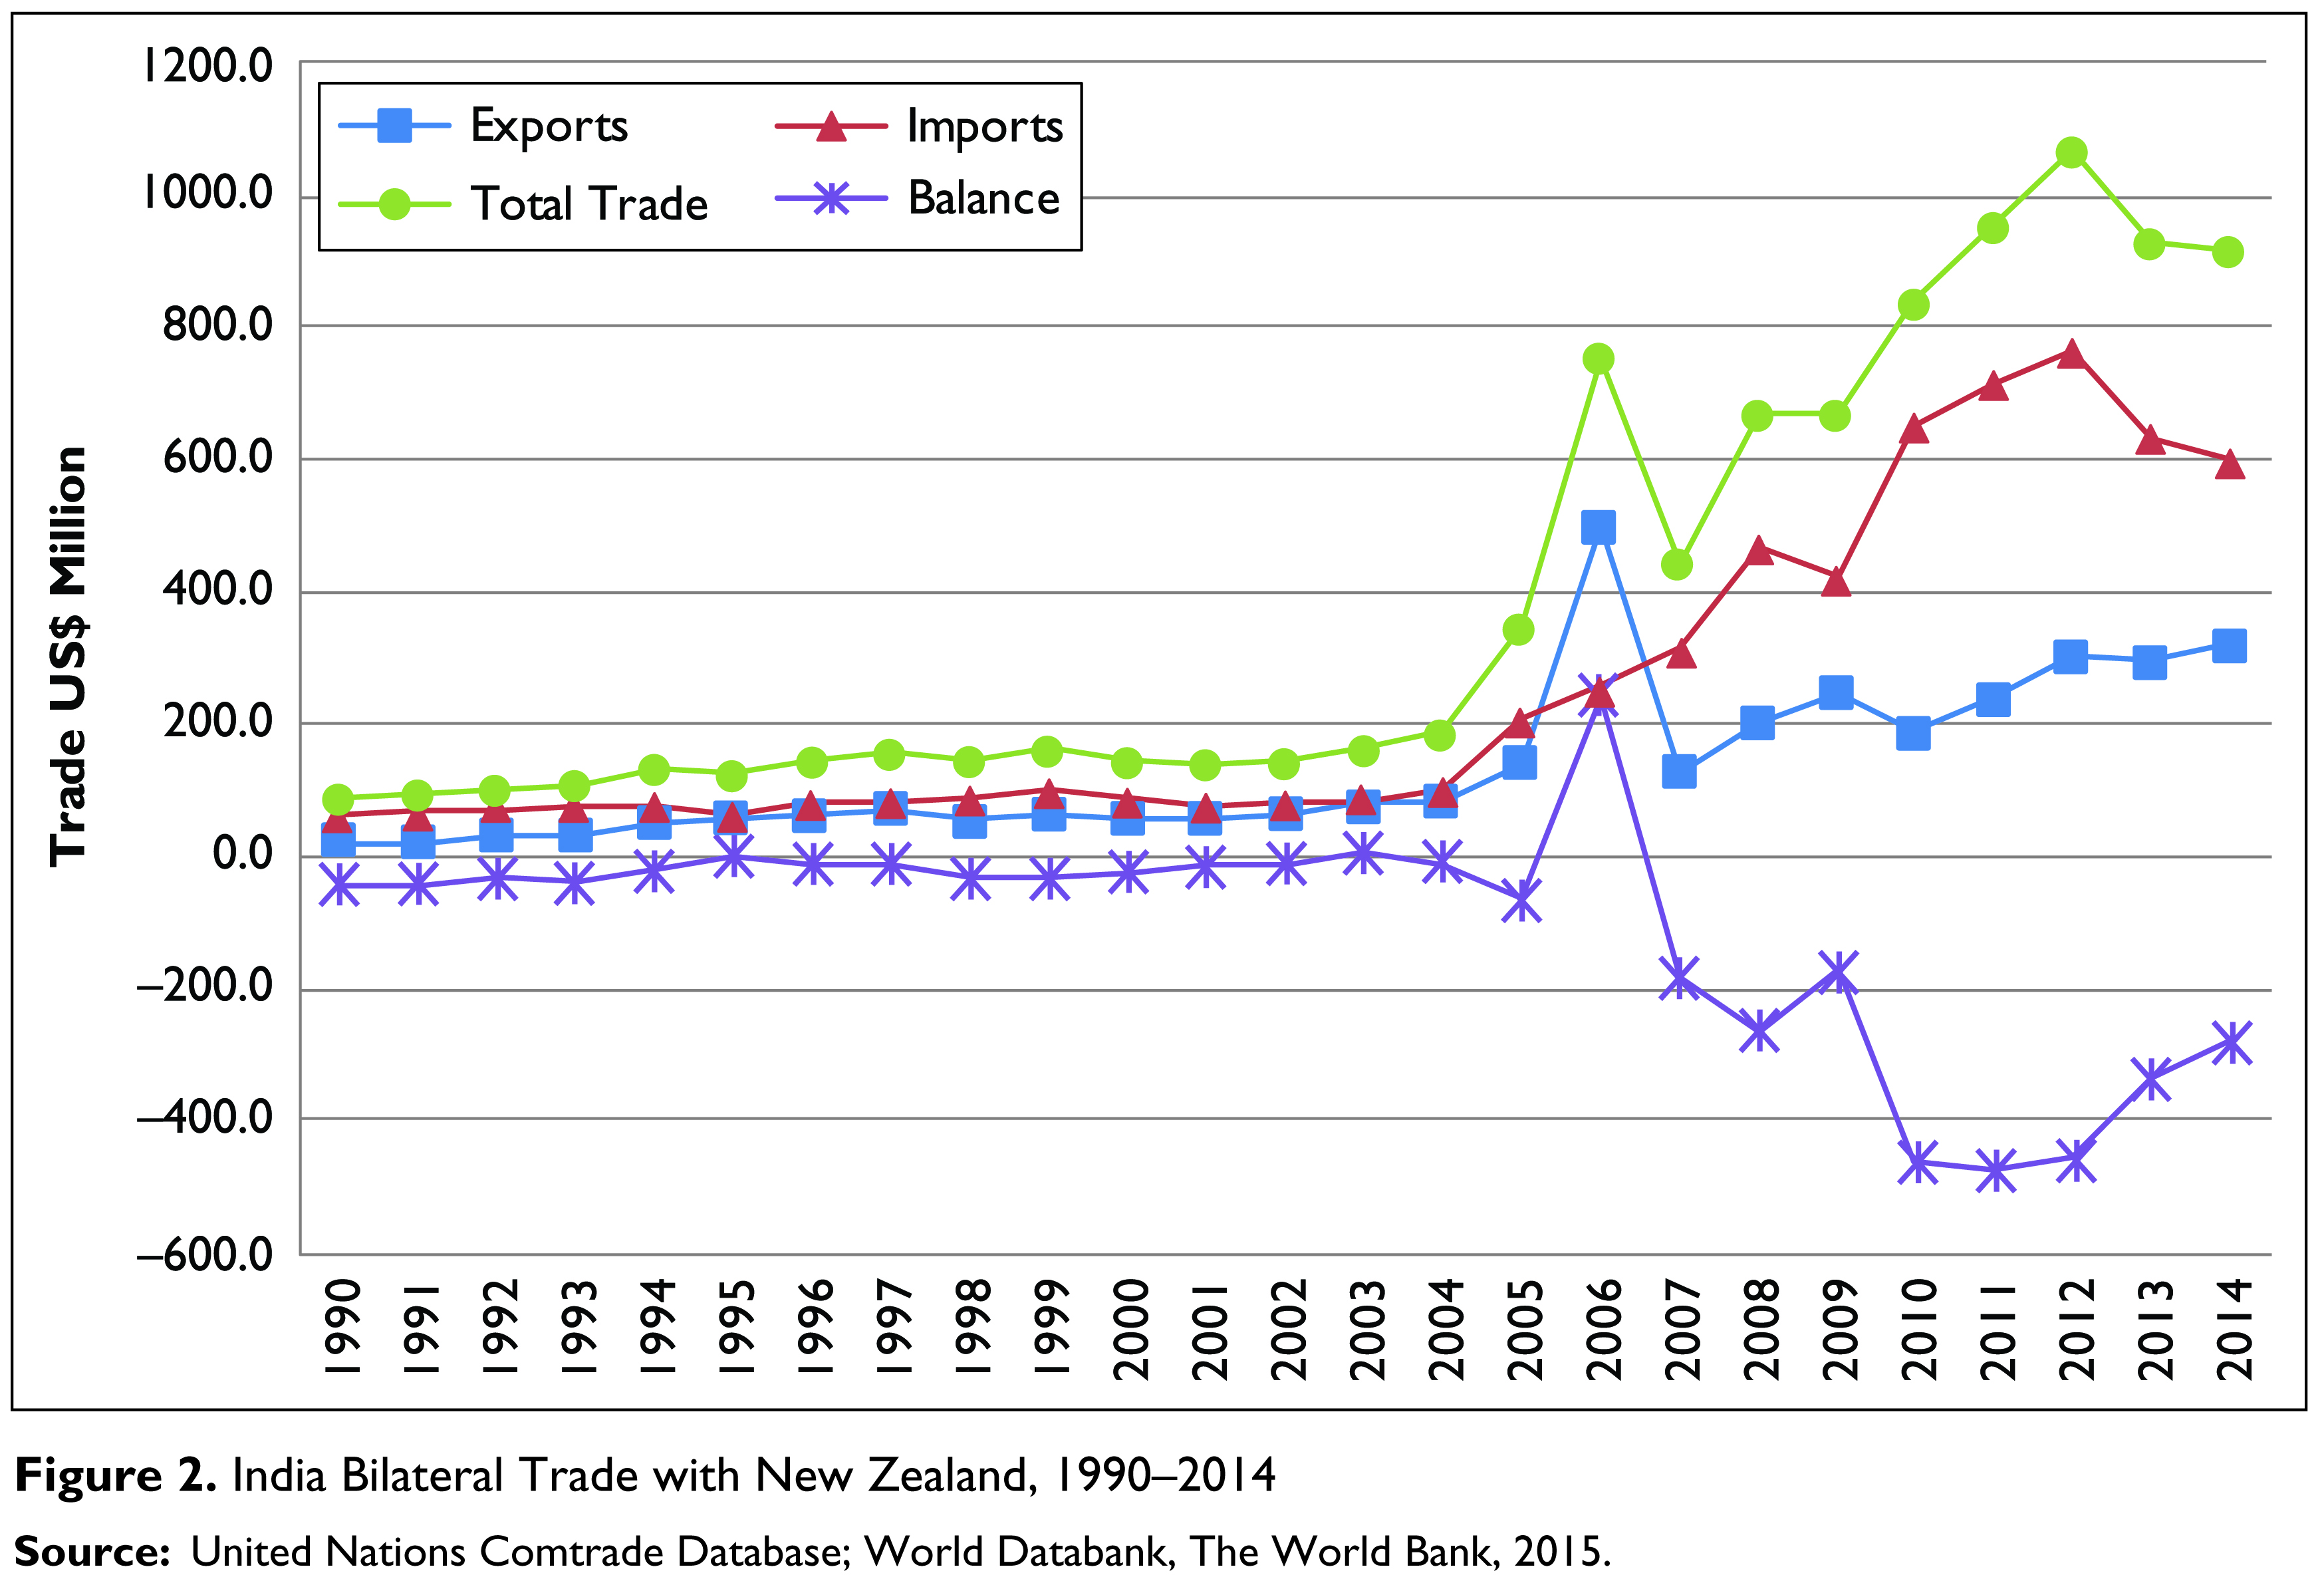
New Zealand’s exports and imports increased gradually between 1990 and 2003 with an average of US$ 80.3 million and US$ 68.6 million, respectively (Table 1 and Figure 1). From 2006 to 2010, exports and imports increased significantly. In 2011, New Zealand’s exports to India reached the highest value of US$ 740 million, while imports reached US$ 304 million, generating a positive bilateral trade balance. This may be attributed to the pre-FTA stimulation of an FTA initiative between these two countries. Surprisingly, New Zealand’s exports to India decreased moderately to US$ 549 million in 2013 and US$ 517 million in 2014. Overall, New Zealand has bilateral trade surplus with India. Although the trade surplus has been slowing down in recent years, it can be expected that New Zealand can keep a favourable trade balance position (Table 2 and Figure 2).

India Bilateral Trade with New Zealand (value and percentage growth): 1990–2014

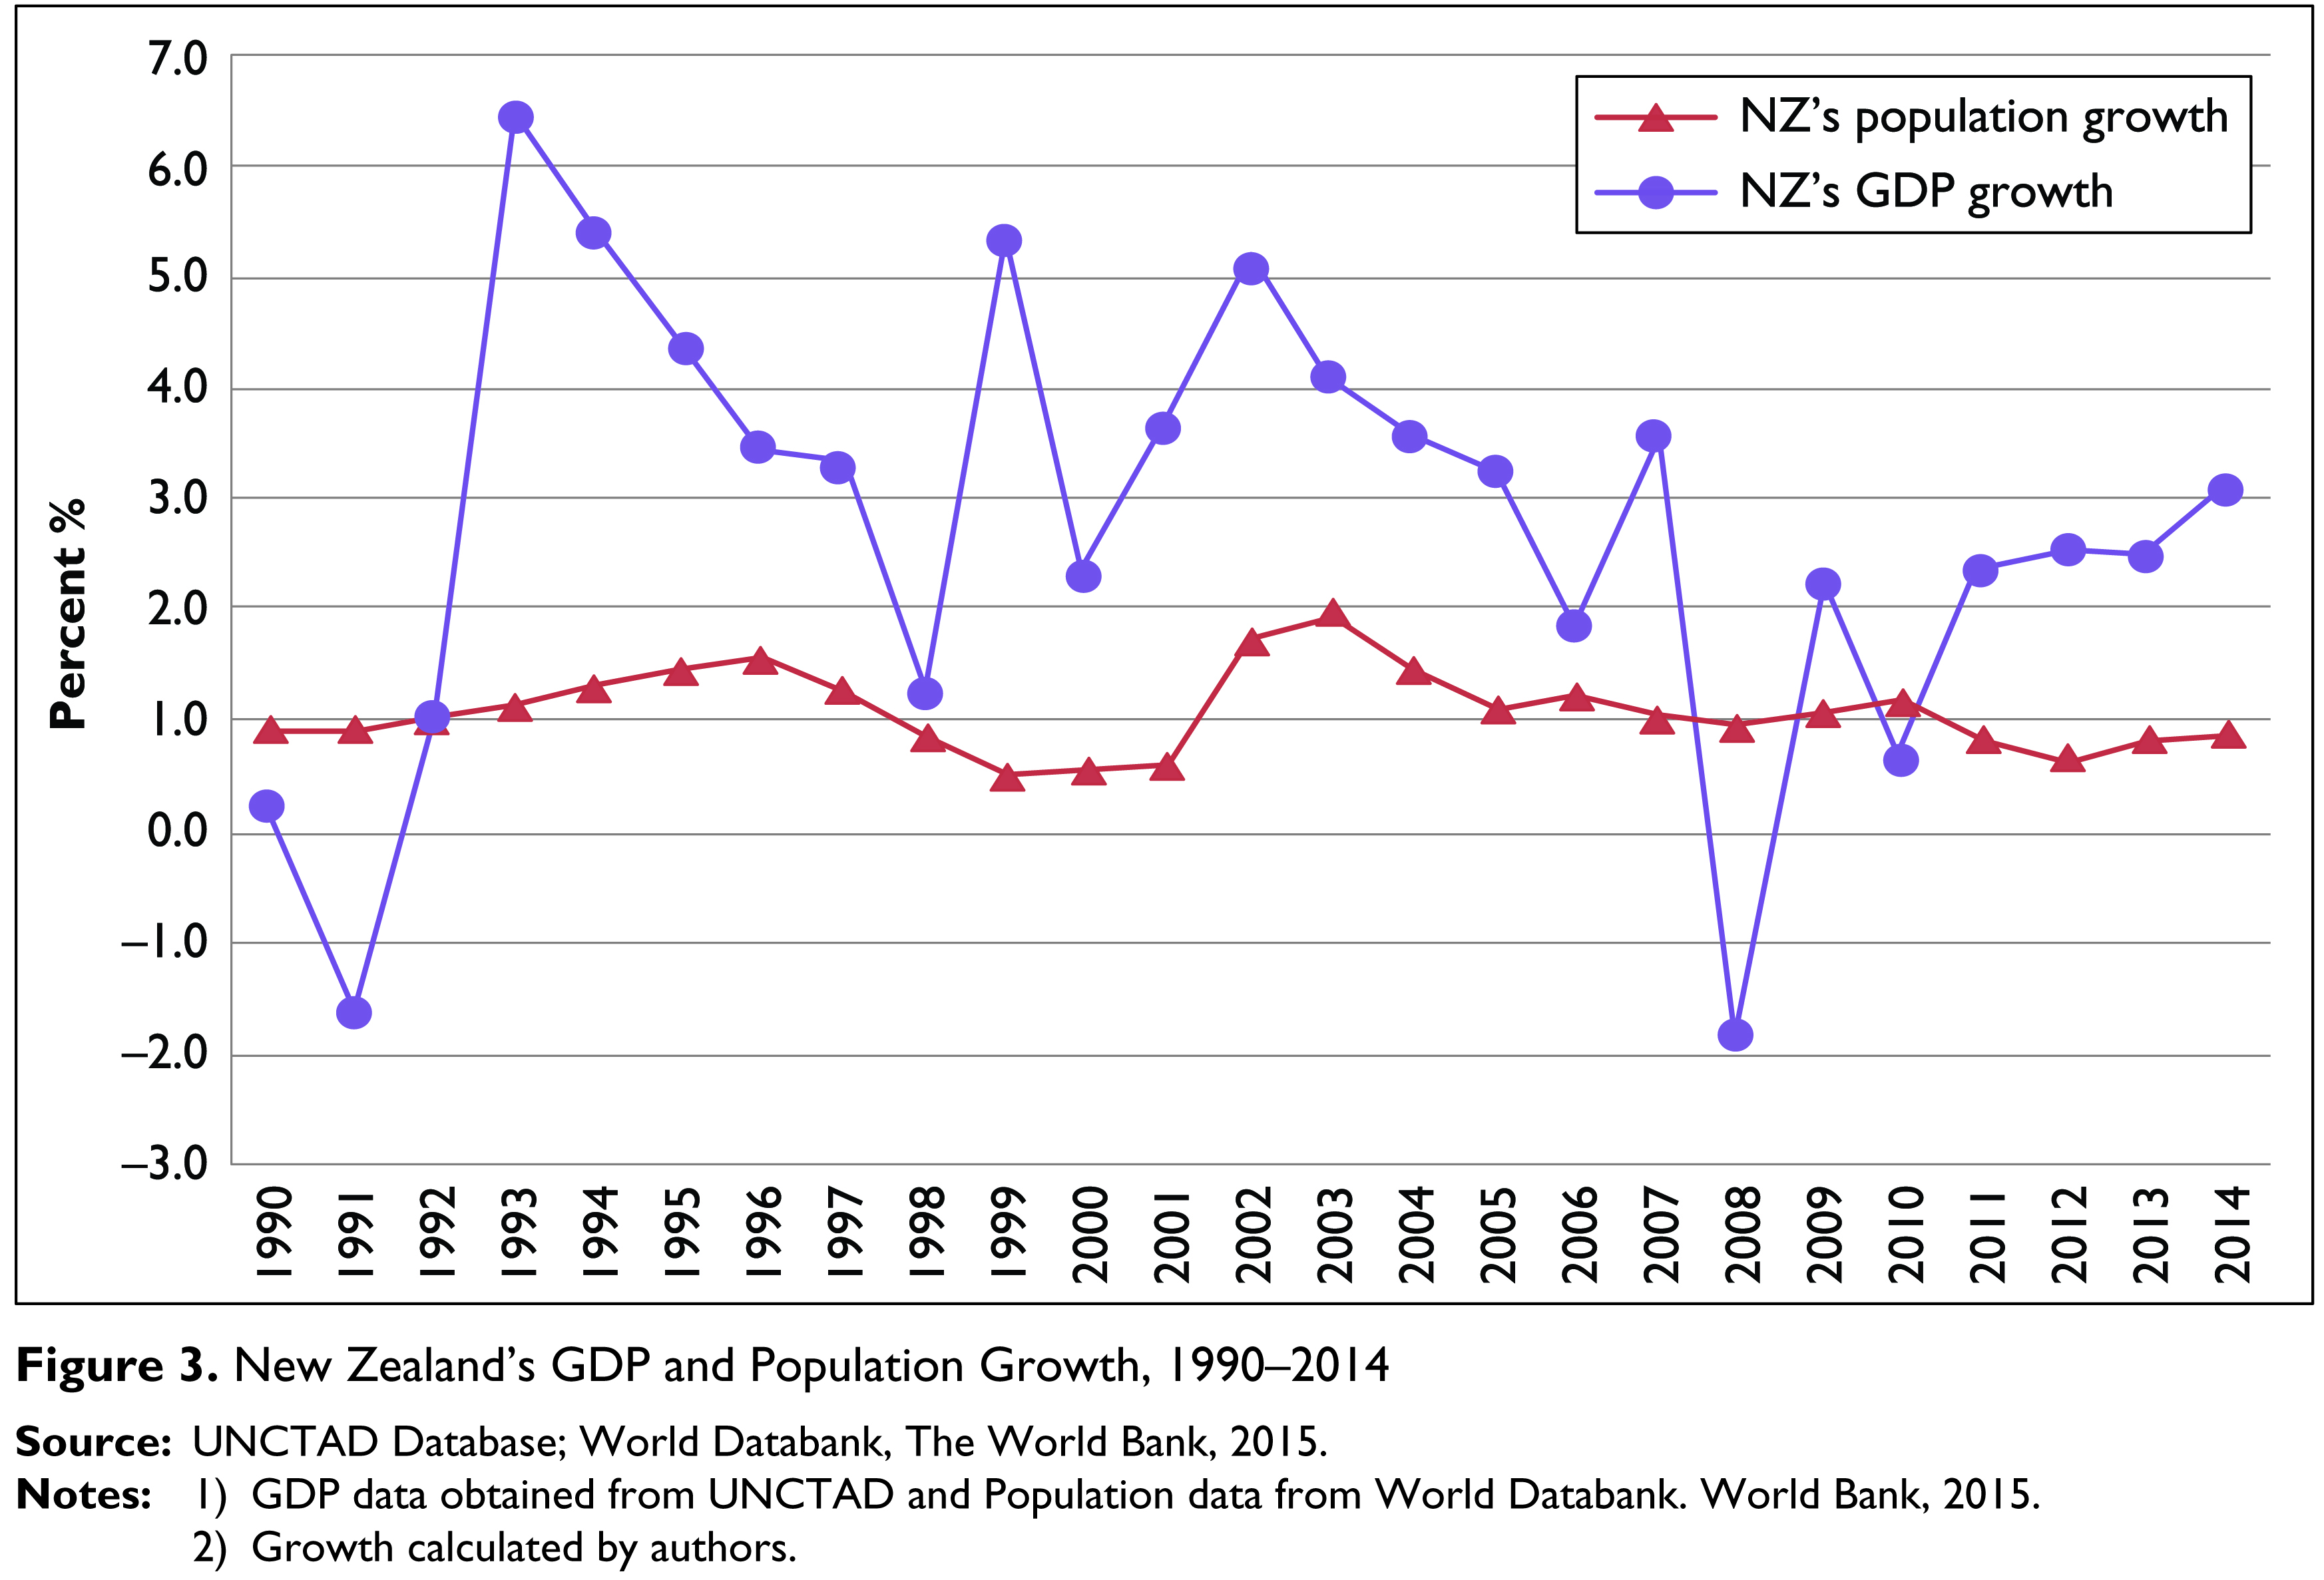
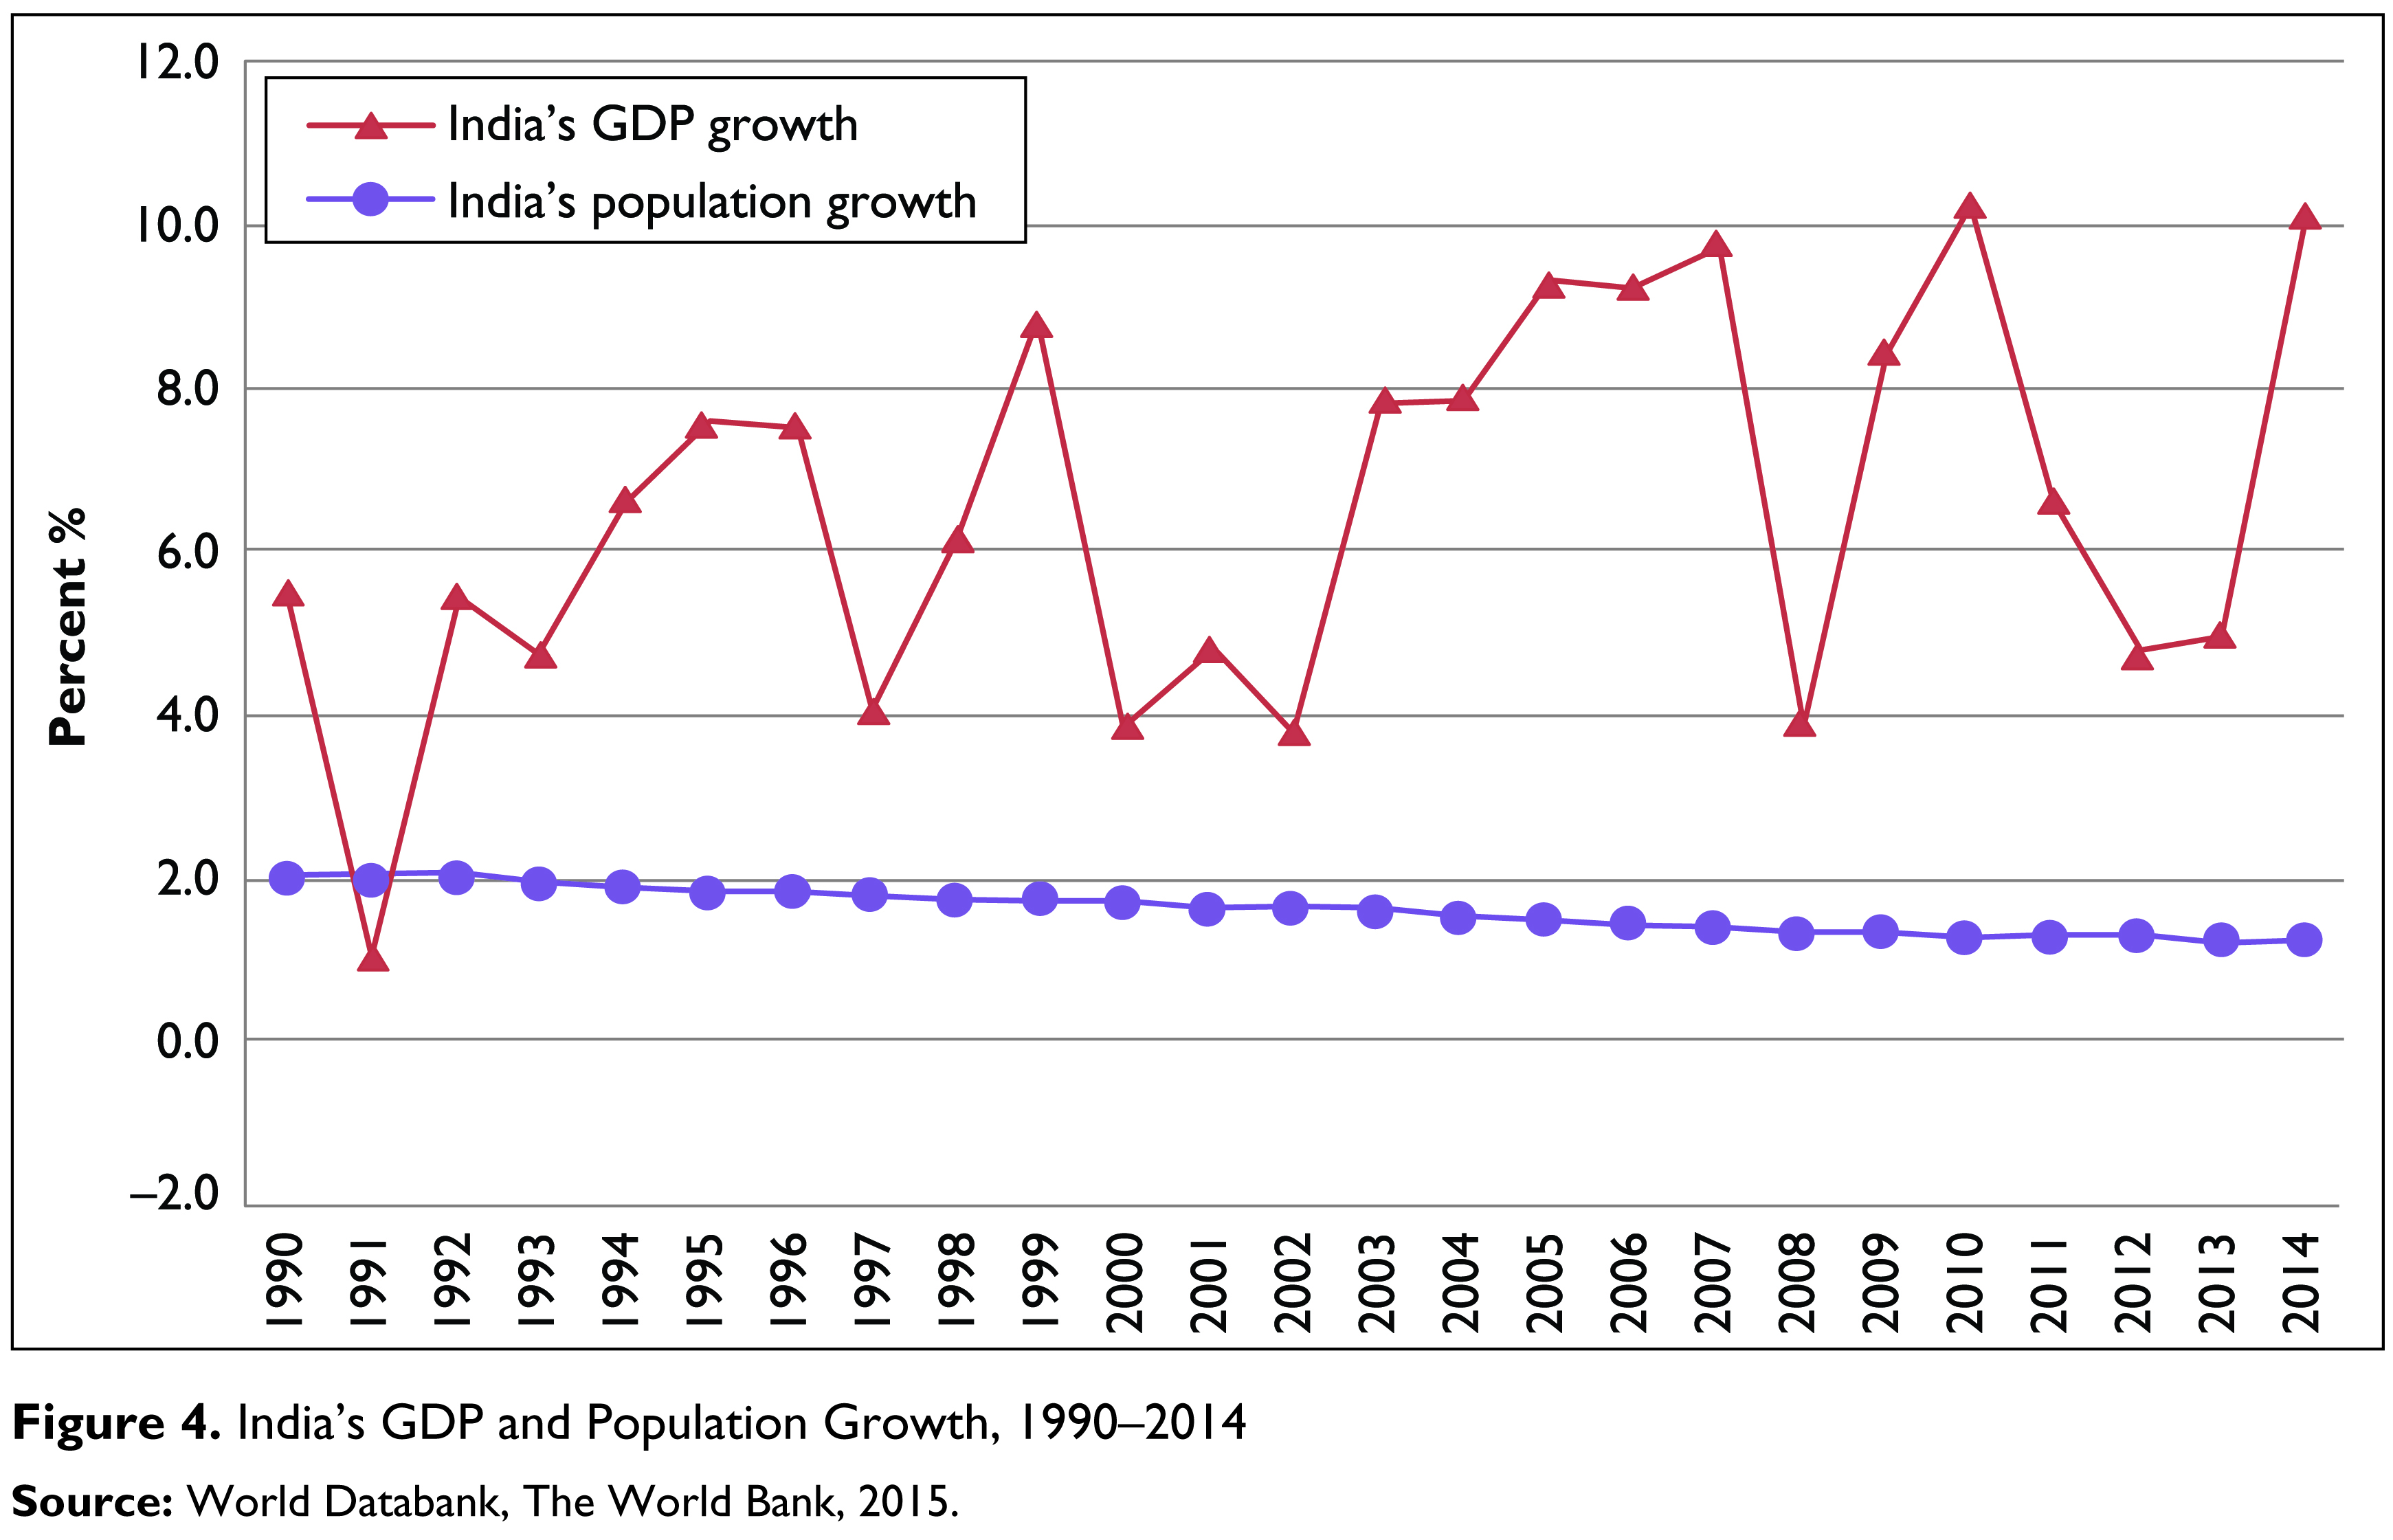
In terms of the trends in New Zealand’s and India’s GDP and population growth for 1990–2014, India has been experiencing a higher average GDP growth of 6.5 per cent than New Zealand’s average growth of 2.7 per cent during the period. Moreover, India’s GDP growth has been increasing with fluctuations, while New Zealand’s GDP growth has been decreasing with fluctuations. In addition, the trends in the two countries’ GDP growth changed in some periods. For instance, the annual growth of India’s GDP increased significantly from 4.8 per cent in 1993 to 7.6 per cent in 1995, whereas New Zealand’s GDP decreased sharply from 6.4 per cent to 4.4 per cent. The same can also be seen from 2002 to 2007, in which New Zealand’s GDP growth decreased and India’s GDP increased significantly. Throughout 2008–2014, both countries’ GDP increased gradually with some fluctuations. Particularly in 2014, New Zealand had a GDP growth of 3.1 per cent and India had a GDP growth of 10.1 per cent. New Zealand’s population growth is relatively lower than that of India. Overall, there is a gap in terms of GDP growth as well as population growth (see Figures 3 and 4).
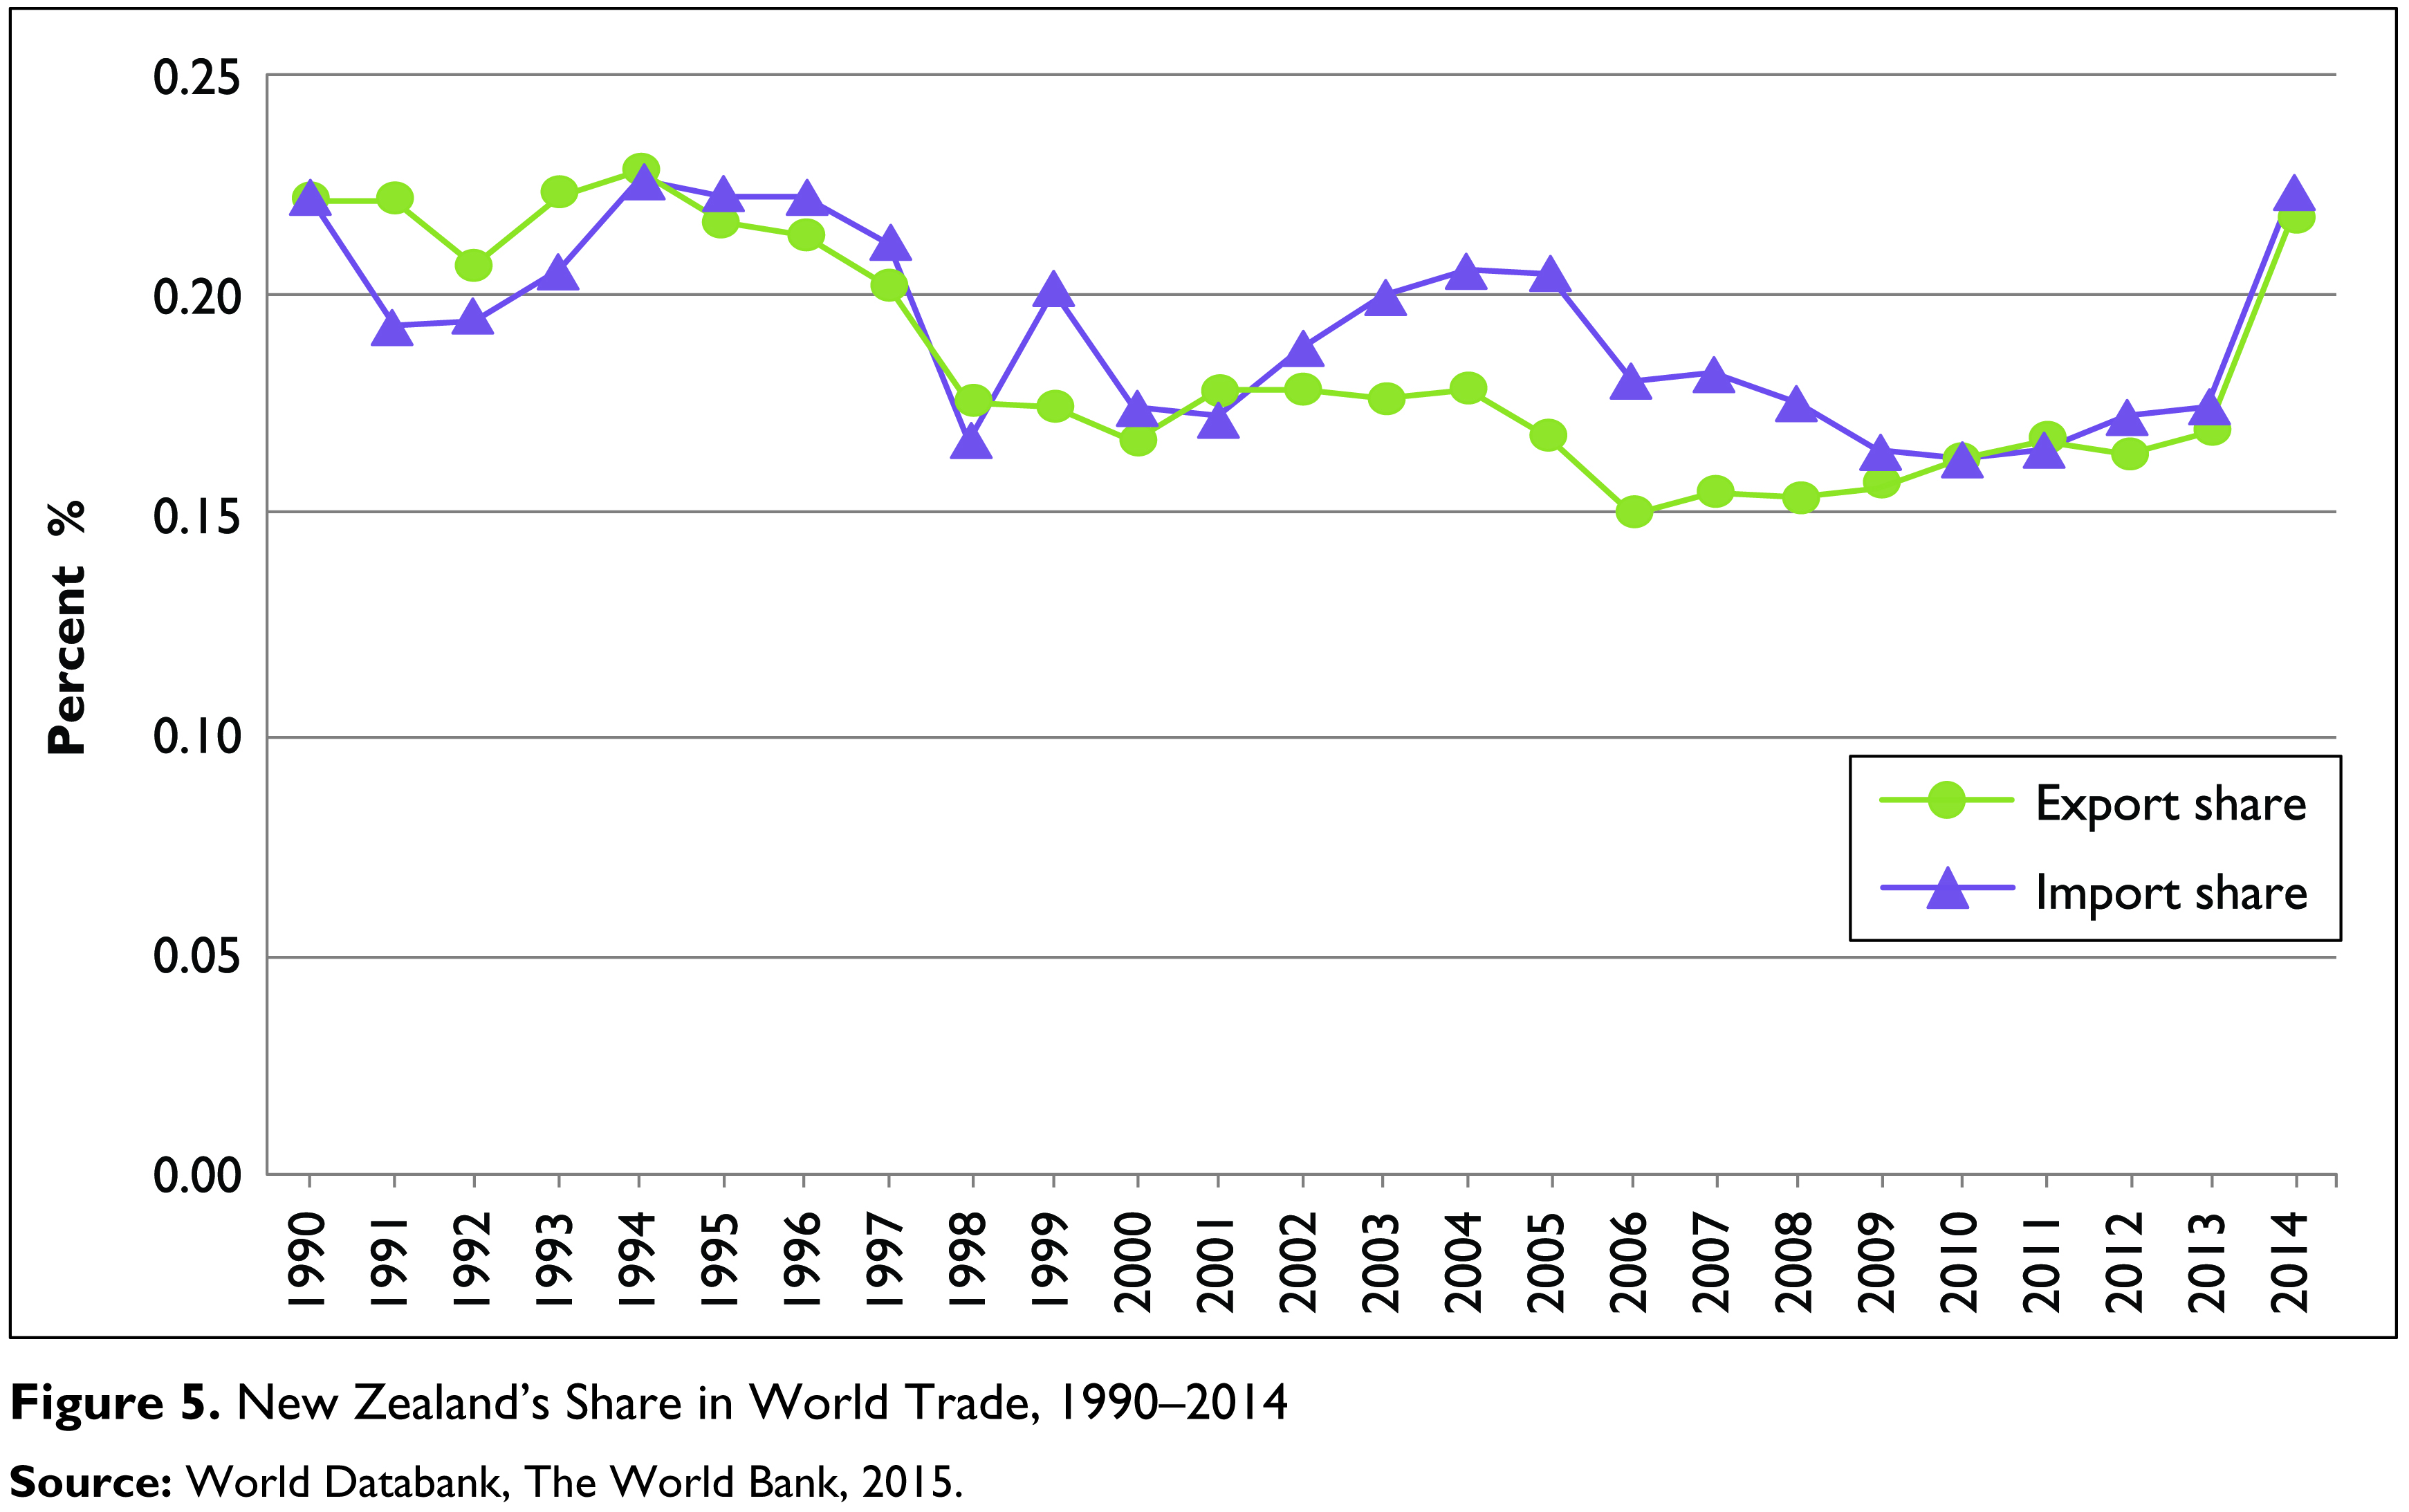
New Zealand and India increased their shares in world trade, with the strongest growth occurring since 2000 (see Figures 5 and 6). Throughout 1990–2014, India’s share of imports has exceeded its share in world exports. In 2014, India’s share in total world exports and imports reached the highest value at 1.7 per cent and 2.4 per cent, respectively. In contrast, New Zealand’s share in total world exports and imports remained relatively constant with an average share of 0.2 per cent. Specifically, New Zealand’s share in world exports, imports and total trade has actually dropped despite considerable growth in exports and imports since the 1990s. This may be attributed to the rapid growth in exports and imports of large countries, such as China, India and other emerging nations. Recently, New Zealand’s share peaked at around 0.23 per cent in 2014. Overall, New Zealand’s share in world imports has remained almost the same as its share in world exports over time.

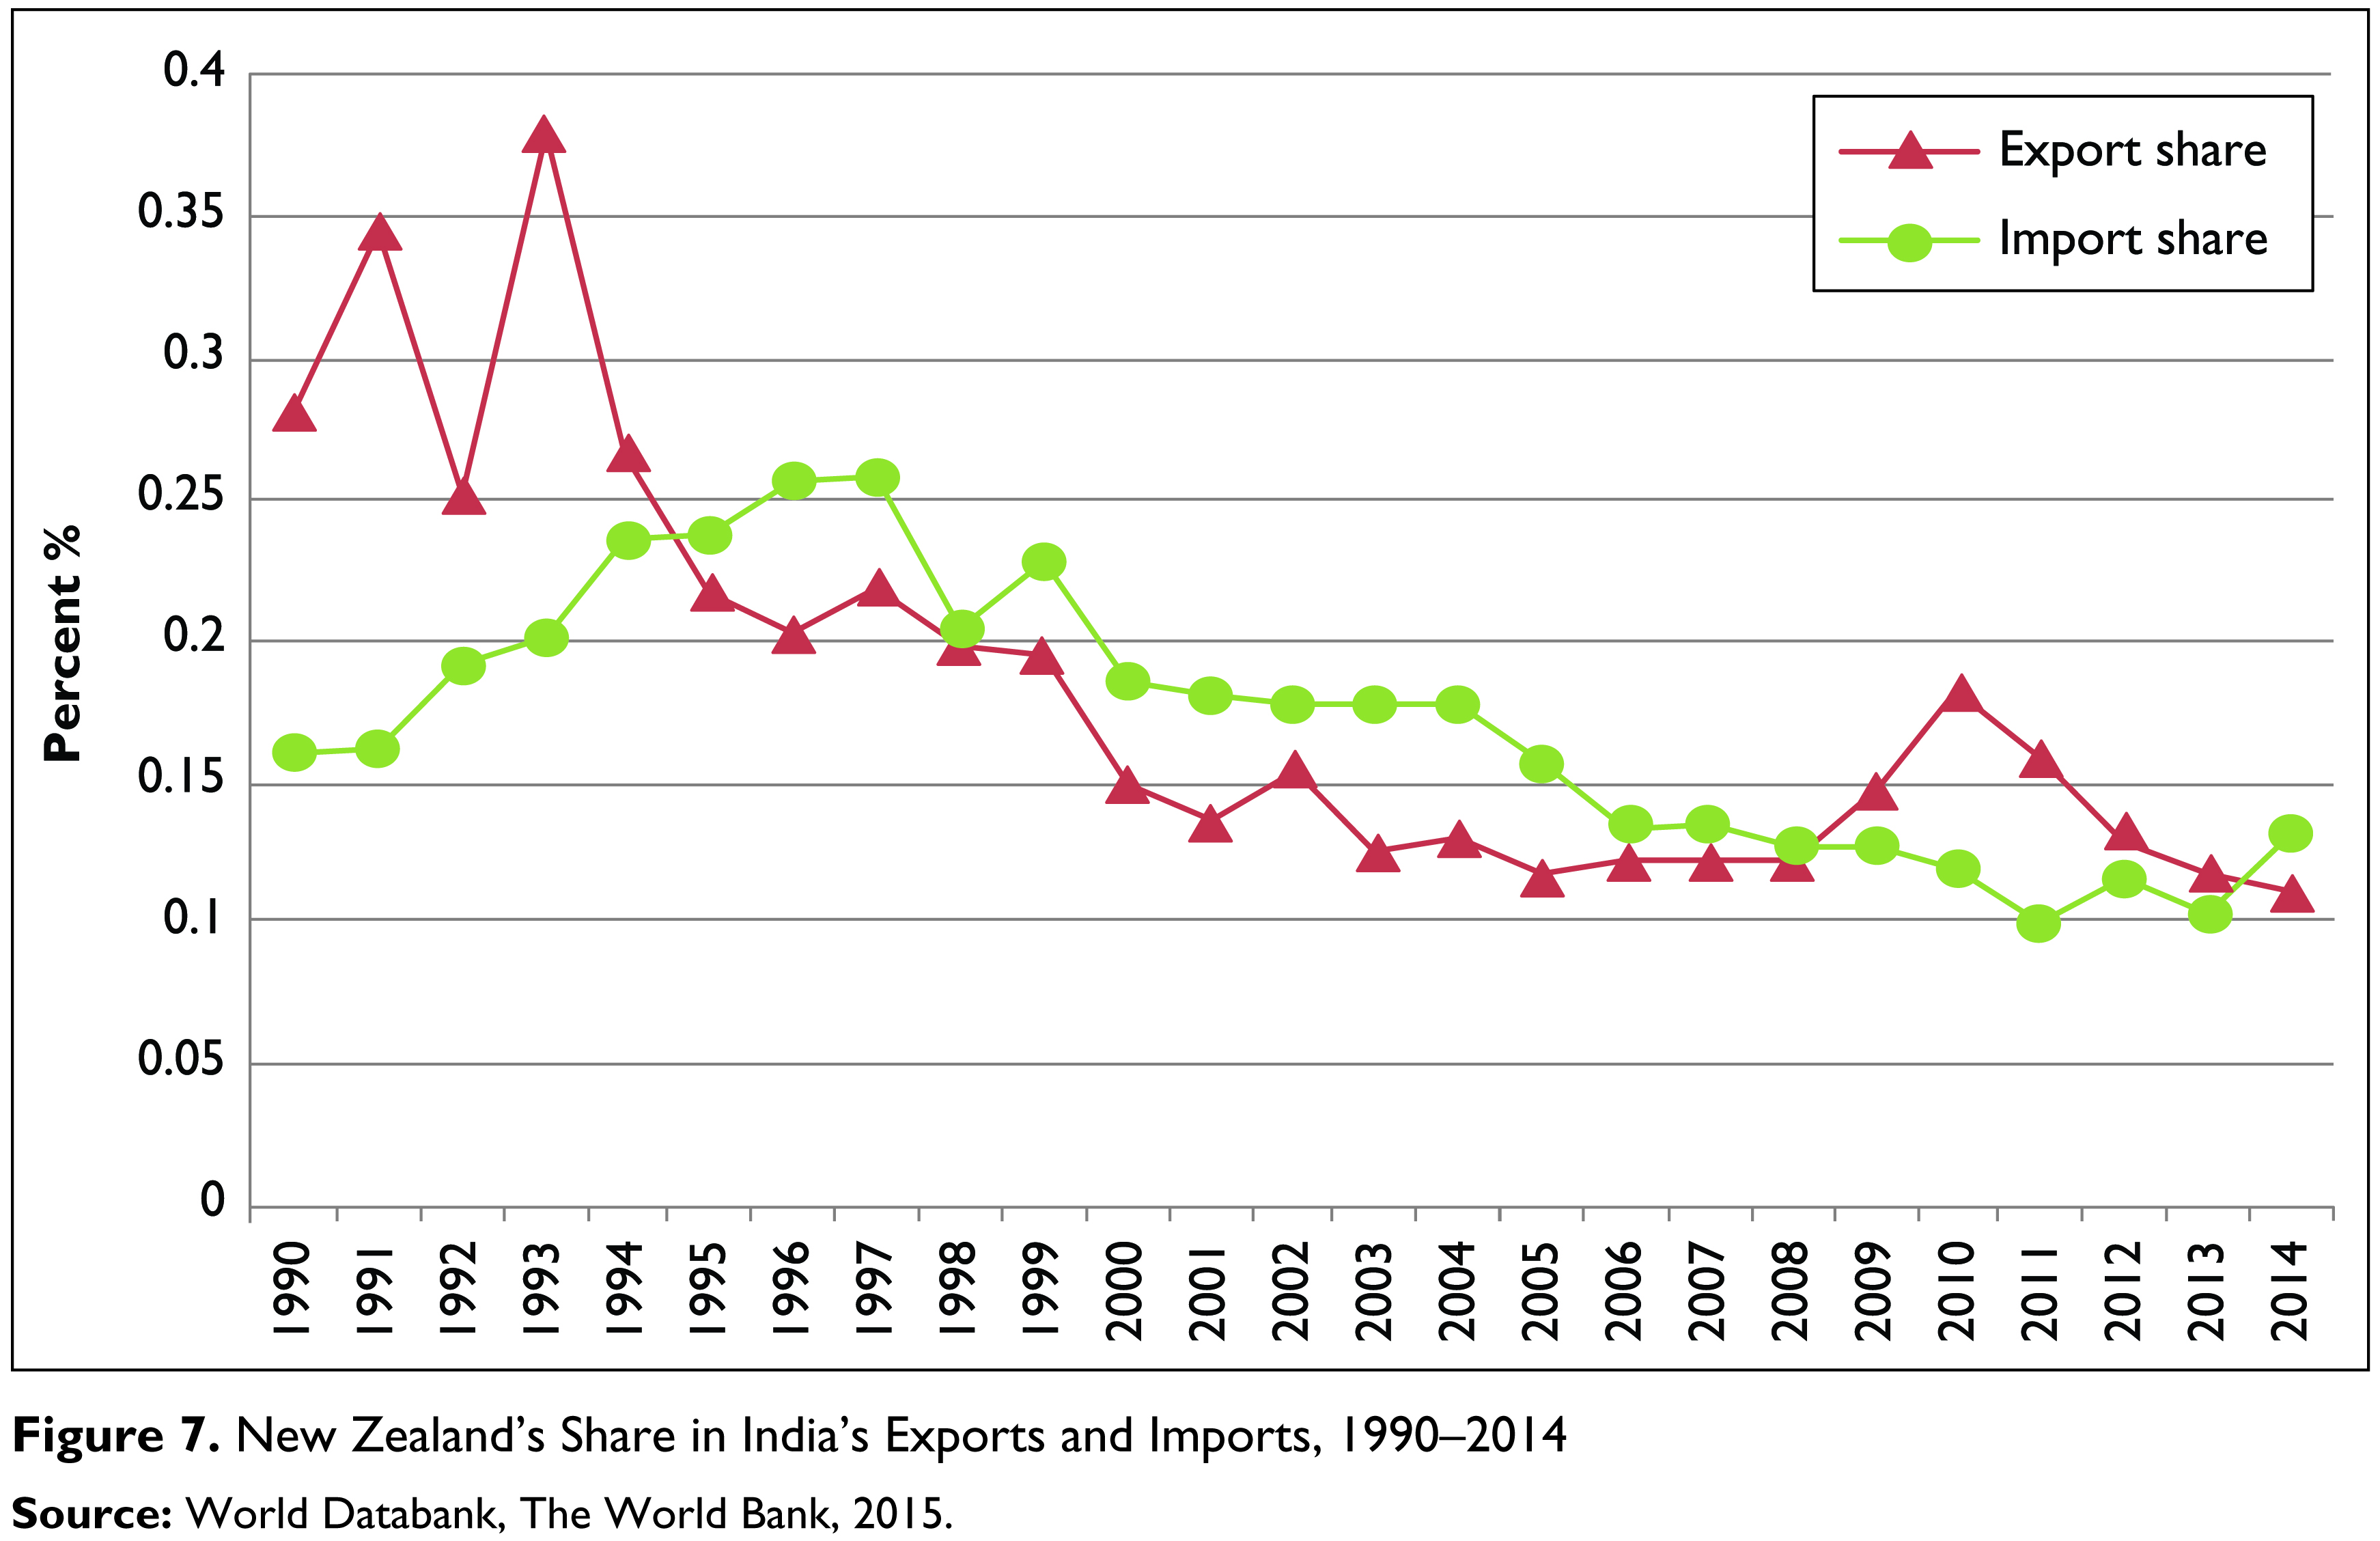
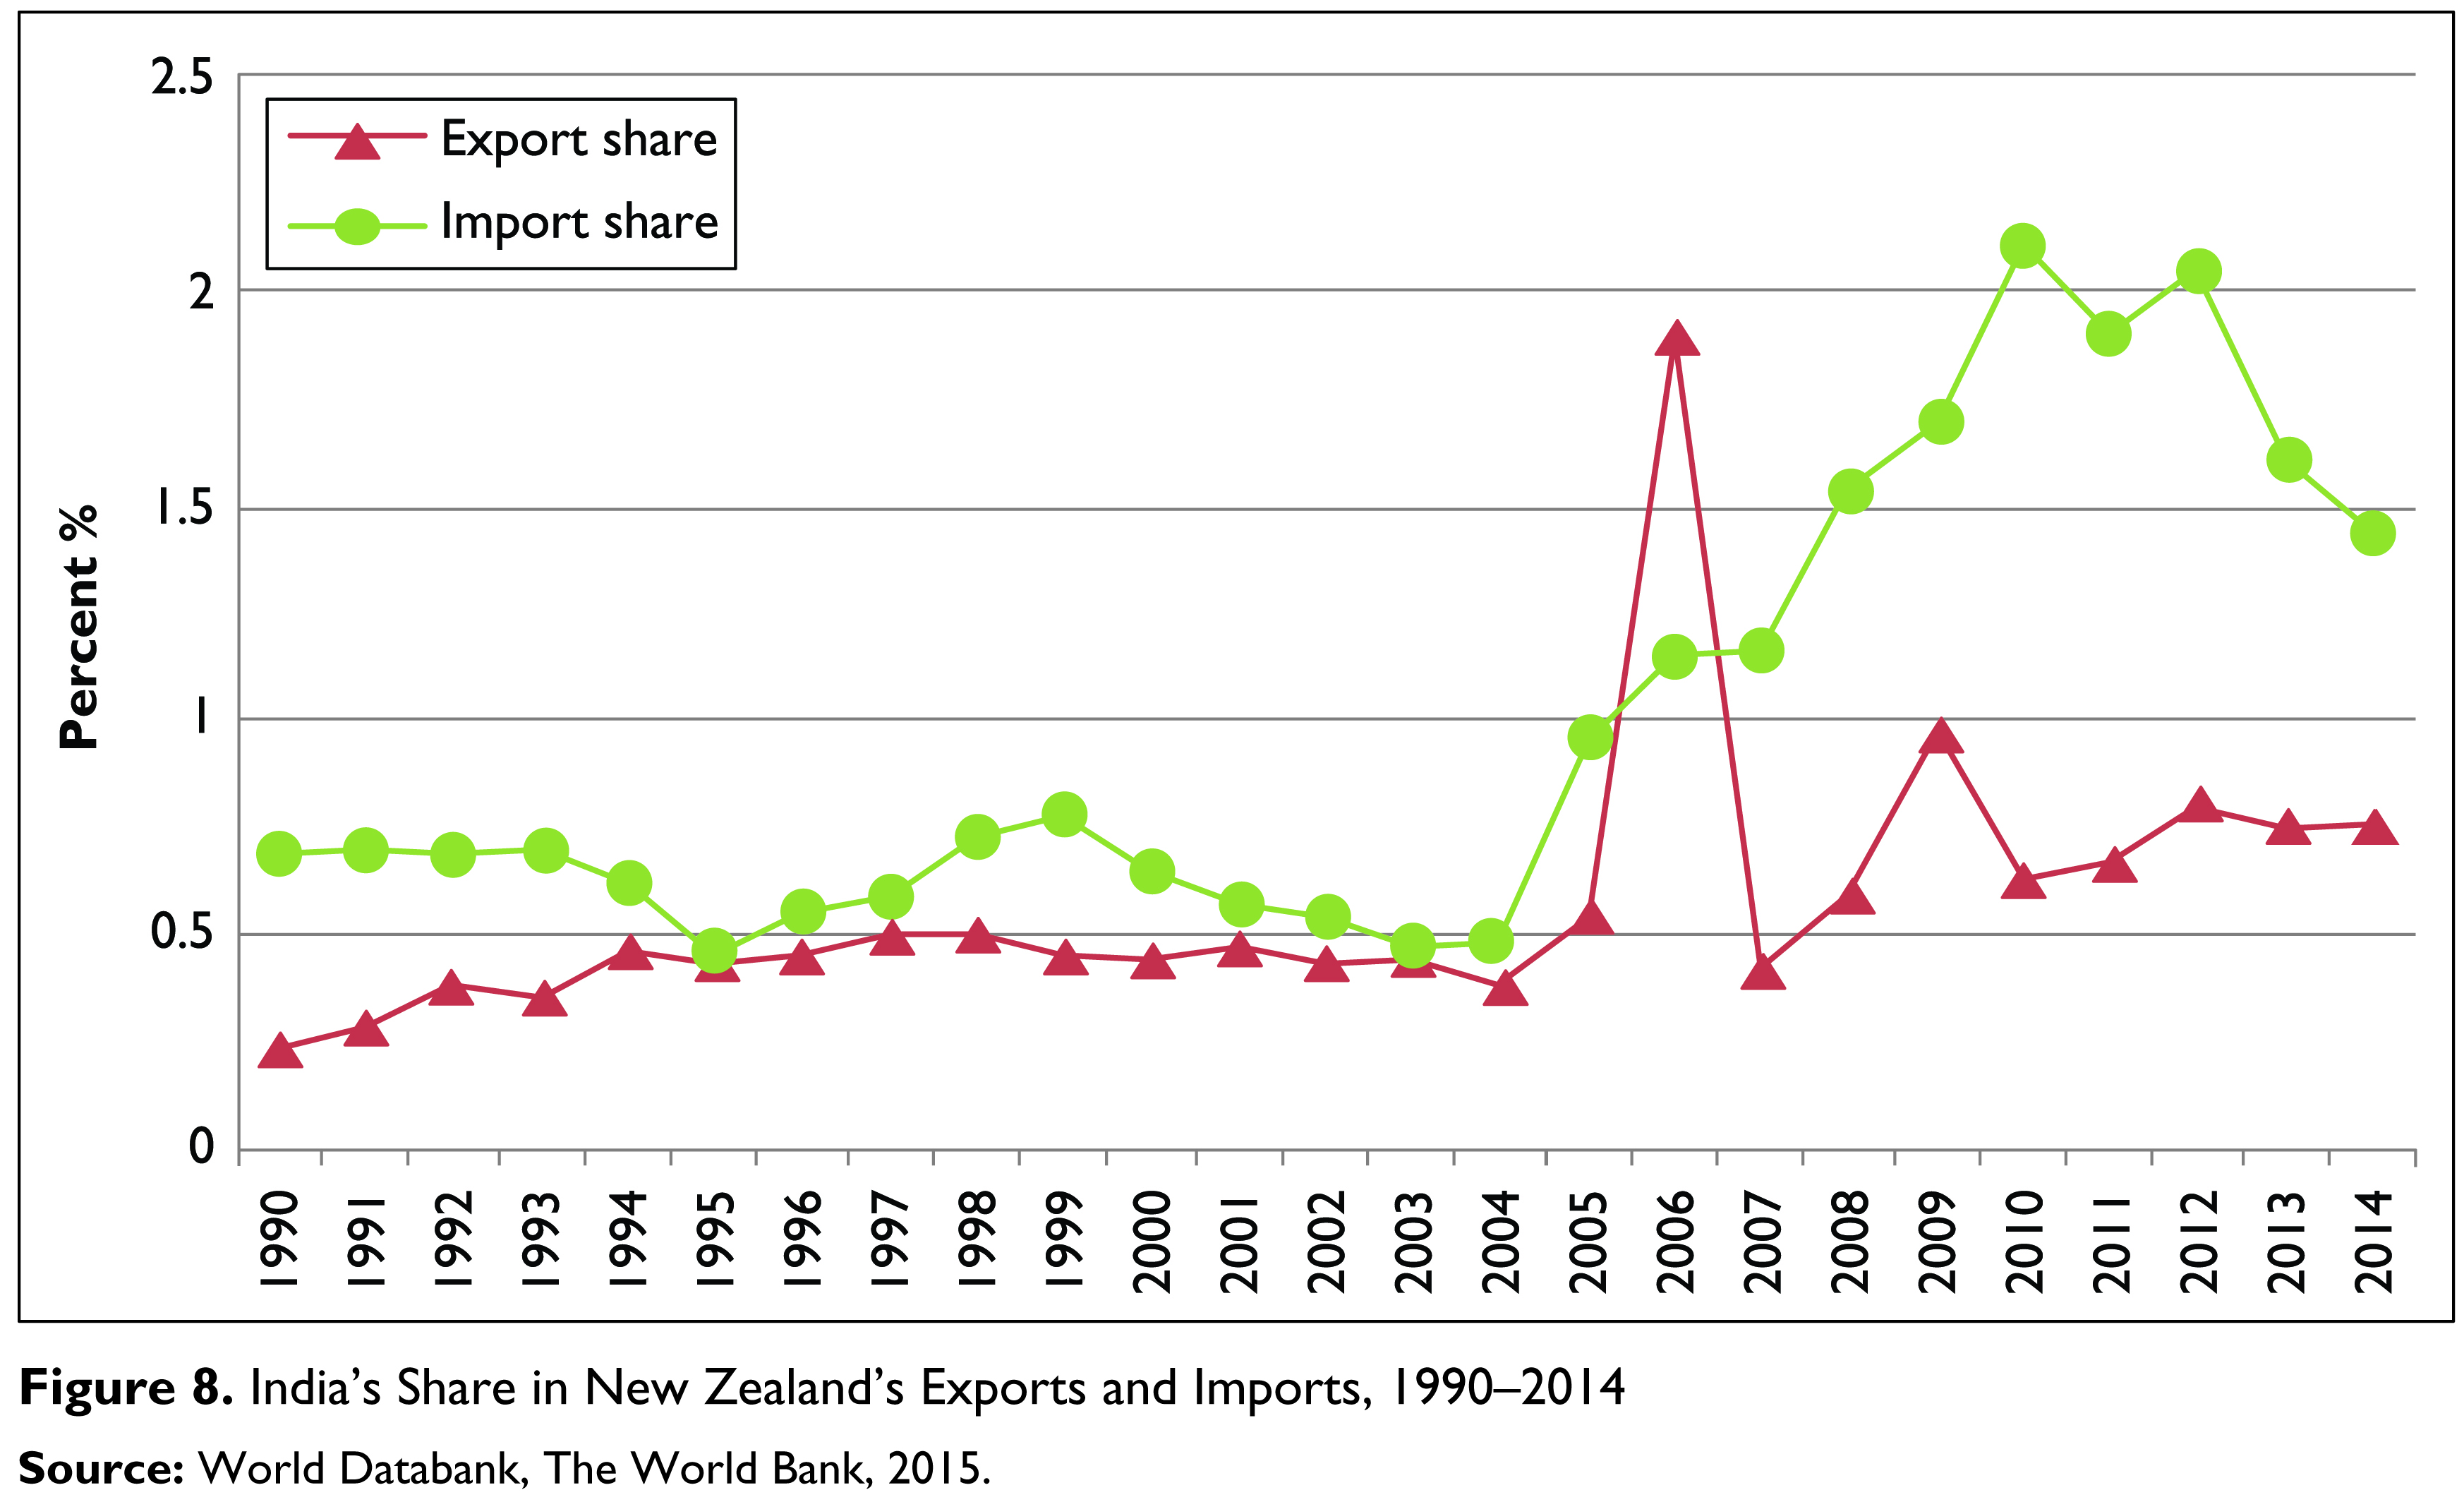
The trends in New Zealand’s shares in India’s trade and the trends in India’s shares in New Zealand’s total trade from 1990 to 2014 show that New Zealand’s exports and imports remained constant at an average of 0.18 and 0.17 per cent in India’s trade percent (see Figure 7). In contrast, India’s imports from New Zealand increased steadily but with fluctuations between 1990 and 2014, and grew at a faster rate than its exports in terms of the share in New Zealand’s exports especially since 2007 (see Figure 8). These values indicated that India’s trade with New Zealand is not significant with respect to India’s total trade, compared with India’s other partners. India’s major export destinations are the 25 member states of the EU (22.5 per cent of total exports), the US (17 per cent), the United Arab Emirates (UAE) (8.3 per cent) and China (6.6 per cent) (The World Bank, 2014). In recent years, however, there has been a shift away from Europe and the US and an increase in the shares of the UAE and Asia. The same trend is evident with regard to the origin of India’s imports. Although the EU and the US remain major exporters to India, with shares of 17.2 per cent and 6.3 per cent, respectively, the shares of Asia (27.4 per cent) and the Middle East (6.7 per cent) have been increasing (The World Bank, 2014). Overall, bilateral trade flows between New Zealand and India are currently below expected levels compared to the global trade profiles of both the countries as revealed by trade flows. They are also confined to a narrow range of products. The primary sector, which consists of the agricultural, horticultural, forestry, mining, energy and fishing industries, plays an important role in New Zealand’s economy, particularly in employment and exports, with the sector contributing over 50 per cent of New Zealand’s total export earnings. New Zealand exports goods, such as dairy, meat, oil and timber, and imports machinery, textiles, electronics and others.
The international trade literature has a long history back to Adam Smith and David Riccardo (who formulated the absolute and comparative advantage theory). The twentieth century brought important theoretical and empirical advances with important contributions from the eminent economists, Heckscher 1 , Ohlin 1 (Carbaugh, 2013), Bhagwati (1964), Krugman (1979), Verdoorn (1960) and others. For this research, it is important to note the recent prior literature of direct relevance which has established foundational knowledge about India and New Zealand trade. The literature shows the importance of international developments involving Europe and the USA trade policy and the impact of the WTO, public policies to advance trade and concerns about the environmental impacts of specific patterns of trade and economic growth. With regard to RCA, studies have considered countries’ export potential as in Cambodia (Vixathep, 2013), trade flows between Australia and Latin America (Esposto & Pereyra, 2013), the performance of groups of nations and the performance and prospects of specific industries (Bano & Scrimgeour, 2012; Oelgemoller, 2013).
Most existing studies on New Zealand and Indian trade have focused on trade with their partners separately. For example, Singh (2015) examined the relationship between international trade and economic growth in New Zealand. He found consistent evidence for the long-run effects of trade on New Zealand’s economic growth. Bhattacharyya and Mandal’s (2014) study analysed the industries (or set of products) that are expected to be affected by the FTA, using the gravity model for each harmonised system (HS) six-digit code for trade between India and the ASEAN countries. They found that some industries, such as organic chemicals, iron and steel, are expected to increase significantly due to the lower tariffs. On the contrary, industries, such as electric machineries and woods, are identified to be negatively affected by the FTA. Ratna and Kallummal (2013) argued that the India–ASEAN FTA will provide ample opportunity to the industry of India and ASEAN to explore each other’s markets on preferential basis. They also emphasised that the success of an FTA depends on how the participants are able to grab the market. Sahu’s (2014) study examined the potential sectors where Malaysia can possibly engage in a strong trade with India. The findings show that Malaysia’s trade growth with India is much higher in comparison to the trade growth with FTA partners. The study does not find any causality between the foreign direct investment (FDI) inflow and other indicators of trade between India and Malaysia. Sharma and Kaur’s (2013) research examined the causal relationships between FDI and trade in India and China using Granger causality test. They found that China shows unidirectional causality running from FDI to imports and FDI to exports. However, there exists a bidirectional causality between imports and exports. Bandyopadhyay (2013) argued that New Zealand’s closer engagement with India is no longer just economically driven. Cultural exchanges and people-to-people relations have also improved significantly over the last years. This study focuses on trade relations between New Zealand and India. The methodologies incorporated for analysis are explained in the next section.
Data and Methodology
Annual statistics from 1990 to 2014 were obtained from the World Bank (2015). Data for estimation purposes were obtained from International Monetary Fund (IMF 2012, 2014) publication, Direction of Trade Statistics Yearbook, World Economic Outlook Database and the UN Commodity Trade Database. We chose 1990 as the starting point because India started its economic reforms policy in 1990. New Zealand adopted reforms starting in 1984. Trade intensity was calculated from 1981 to 2014 in order to identify the long-term strength of trade relations. Intra-industry trade and trade complementarity are estimated from 1990 to 2014; RCA is calculated from 1990 to 2012, due to data availability.
Trade Intensity Index
The trade intensity method measures the share of one country’s trade with another country as a proportion of the latter’s share of world trade. This trade intensity index (TII) was developed by Kojima (1964), followed by Wadhva et al. (1985) and Garnaut and Drysdale (1994):

where Xabrepresents exports of country a to country b, Mabrepresents imports of country a to country b, Xa represents total exports of country a, Ma represents total imports of country a, Mb represents total imports of country b, Xbrepresents total exports of country b, Mwrepresents total world imports, Xw represents total world exports, XIIab represents export intensity index and MIIabrepresents import intensity index.
The average value of this index is 1. Index values greater than 1 indicate a higher degree of trade intensity between country a and country b, while values lower than 1 indicate lower trade intensity. The closer the index is to 0, the lower is the trade intensity.
Revealed Comparative Advantage
The RCA indices are intended to reveal in which industries a country has lower costs of production. The RCA index developed by Balassa (1965) assumes that a country’s comparative advantage is revealed by its exports to the world. The static RCA of exports is represented by a country’s commodity composition of exports vis-à-vis that of the world. The formula is

where Xki represents the value of country i’s exports of commodity k, Xti represents the value of country i’s total exports, Xkw represents the value of world exports of commodity k and Xtw represents the value of total world exports (of all commodities).
Although Balassa introduced the concept of RCA, several others have commented on the theoretical conditions for the use of the RCA index. For example, Bowen (1983) showed that an RCA above unity may not necessarily indicate that a country has a comparative advantage in exporting the product if the country does not export every commodity in the world at the 3-digit Standard International Trade Classification (SITC) level. In the 1990s, developing South Asian countries in general and the Asia-Pacific partnerships in particular came quite close to fulfilling this condition. Hillman (1980) also noted that the RCA index’s deviation from unity reflects comparative advantage if the country’s exports of any product are overly prominent neither in the country’s exports nor in the total world exports of that product.
To capture the dynamics of RCA, Balassa (1967) suggested the use of ‘Dynamic Revealed Comparative Advantage’ (DRCA). The index is based on the presumption that trade shares of past exports will be expected to continue but will take place at a declining pace. The formula for calculating the DRCA index is

where
DRCAik is the DRCA of country I in industry k, Xikt/Xit = (Xikt /Xit)/(Xwkt/Xwt) = RCAt is the RCA value of commodity k in terminal year (t) and Xik0/Xi0 = (Xik0/Xi0)/(Xwk0/Xw0) = RCA0 is the RCA value of commodity k in base year (0).
Unlike the RCA, the numerical value of the DRCA ranges from zero to infinity, with 100 separating comparative advantage from comparative disadvantage. A value above 100 would indicate that the country has a comparative advantage compared in producing commodity k. The DRCA has an advantage over RCA, which reveals comparative advantage at a point in time, because it takes into account change(s) over time, that is, the changes in the relative shares of exports between the terminal year and the base year (Sharma, 2006).
Intra-industry Trade
Intra-industry trade is the simultaneous export and import of goods within the same industry. For example, New Zealand and Australia simultaneously export and import white-ware home appliances and Steinlager and Fosters beer to each other (Bano, 2002). Inter-industry trade, on the other hand, is the exchange of goods which belong to different industries.
The most widely used measure of IIT is the Grubel–Lloyd index. The problems associated with the Grublel–Lloyd index, however, are the biases created by trade imbalances at the multilateral level (Grubel & Lloyd, 1975). Some economists have attempted to correct this bias, but a widely acceptable method of correction is yet to be found. Therefore, the Grubel–Lloyd weighted mean index (IITB) and two trade imbalance adjusted indices, the Grubel–Lloyd trade adjusted index (IITC) and the Aquino adjusted index (IITQ), are calculated for comparison. The formulas are presented as shown below.
Grubel and Lloyd Intra-industry Trade Index
The Grubel–Lloyd index’s (1975) single industry intra-industry equation is written as

where Xi and Mi are exports and imports of industry i of a country.
For aggregated industry or product group, the index will be a weighted average of IITB i , the weight being the share of each industry in the country’s total trade. The summary Grubel–Lloyd index is

where IITB is the weighted average of the value of IITB i across industries i = 1, 2, …, n, with n being the number of industries. IITB is an accurate measure if there is balanced bilateral trade. However, as we discussed above, when the total trade is unbalanced, the index will be biased downward, so the imbalance needs to be adjusted, and the modified formula is

Aquino Adjusted Index
Aquino (1978) suggested modification at each industry level. The ‘theoretical values’ of exports and imports can be estimated by the formulas given below:

By replacing the estimated exports and imports values in the Grubel–Lloyd equation, Aquino adjusted index (IITQ i ) can be written as

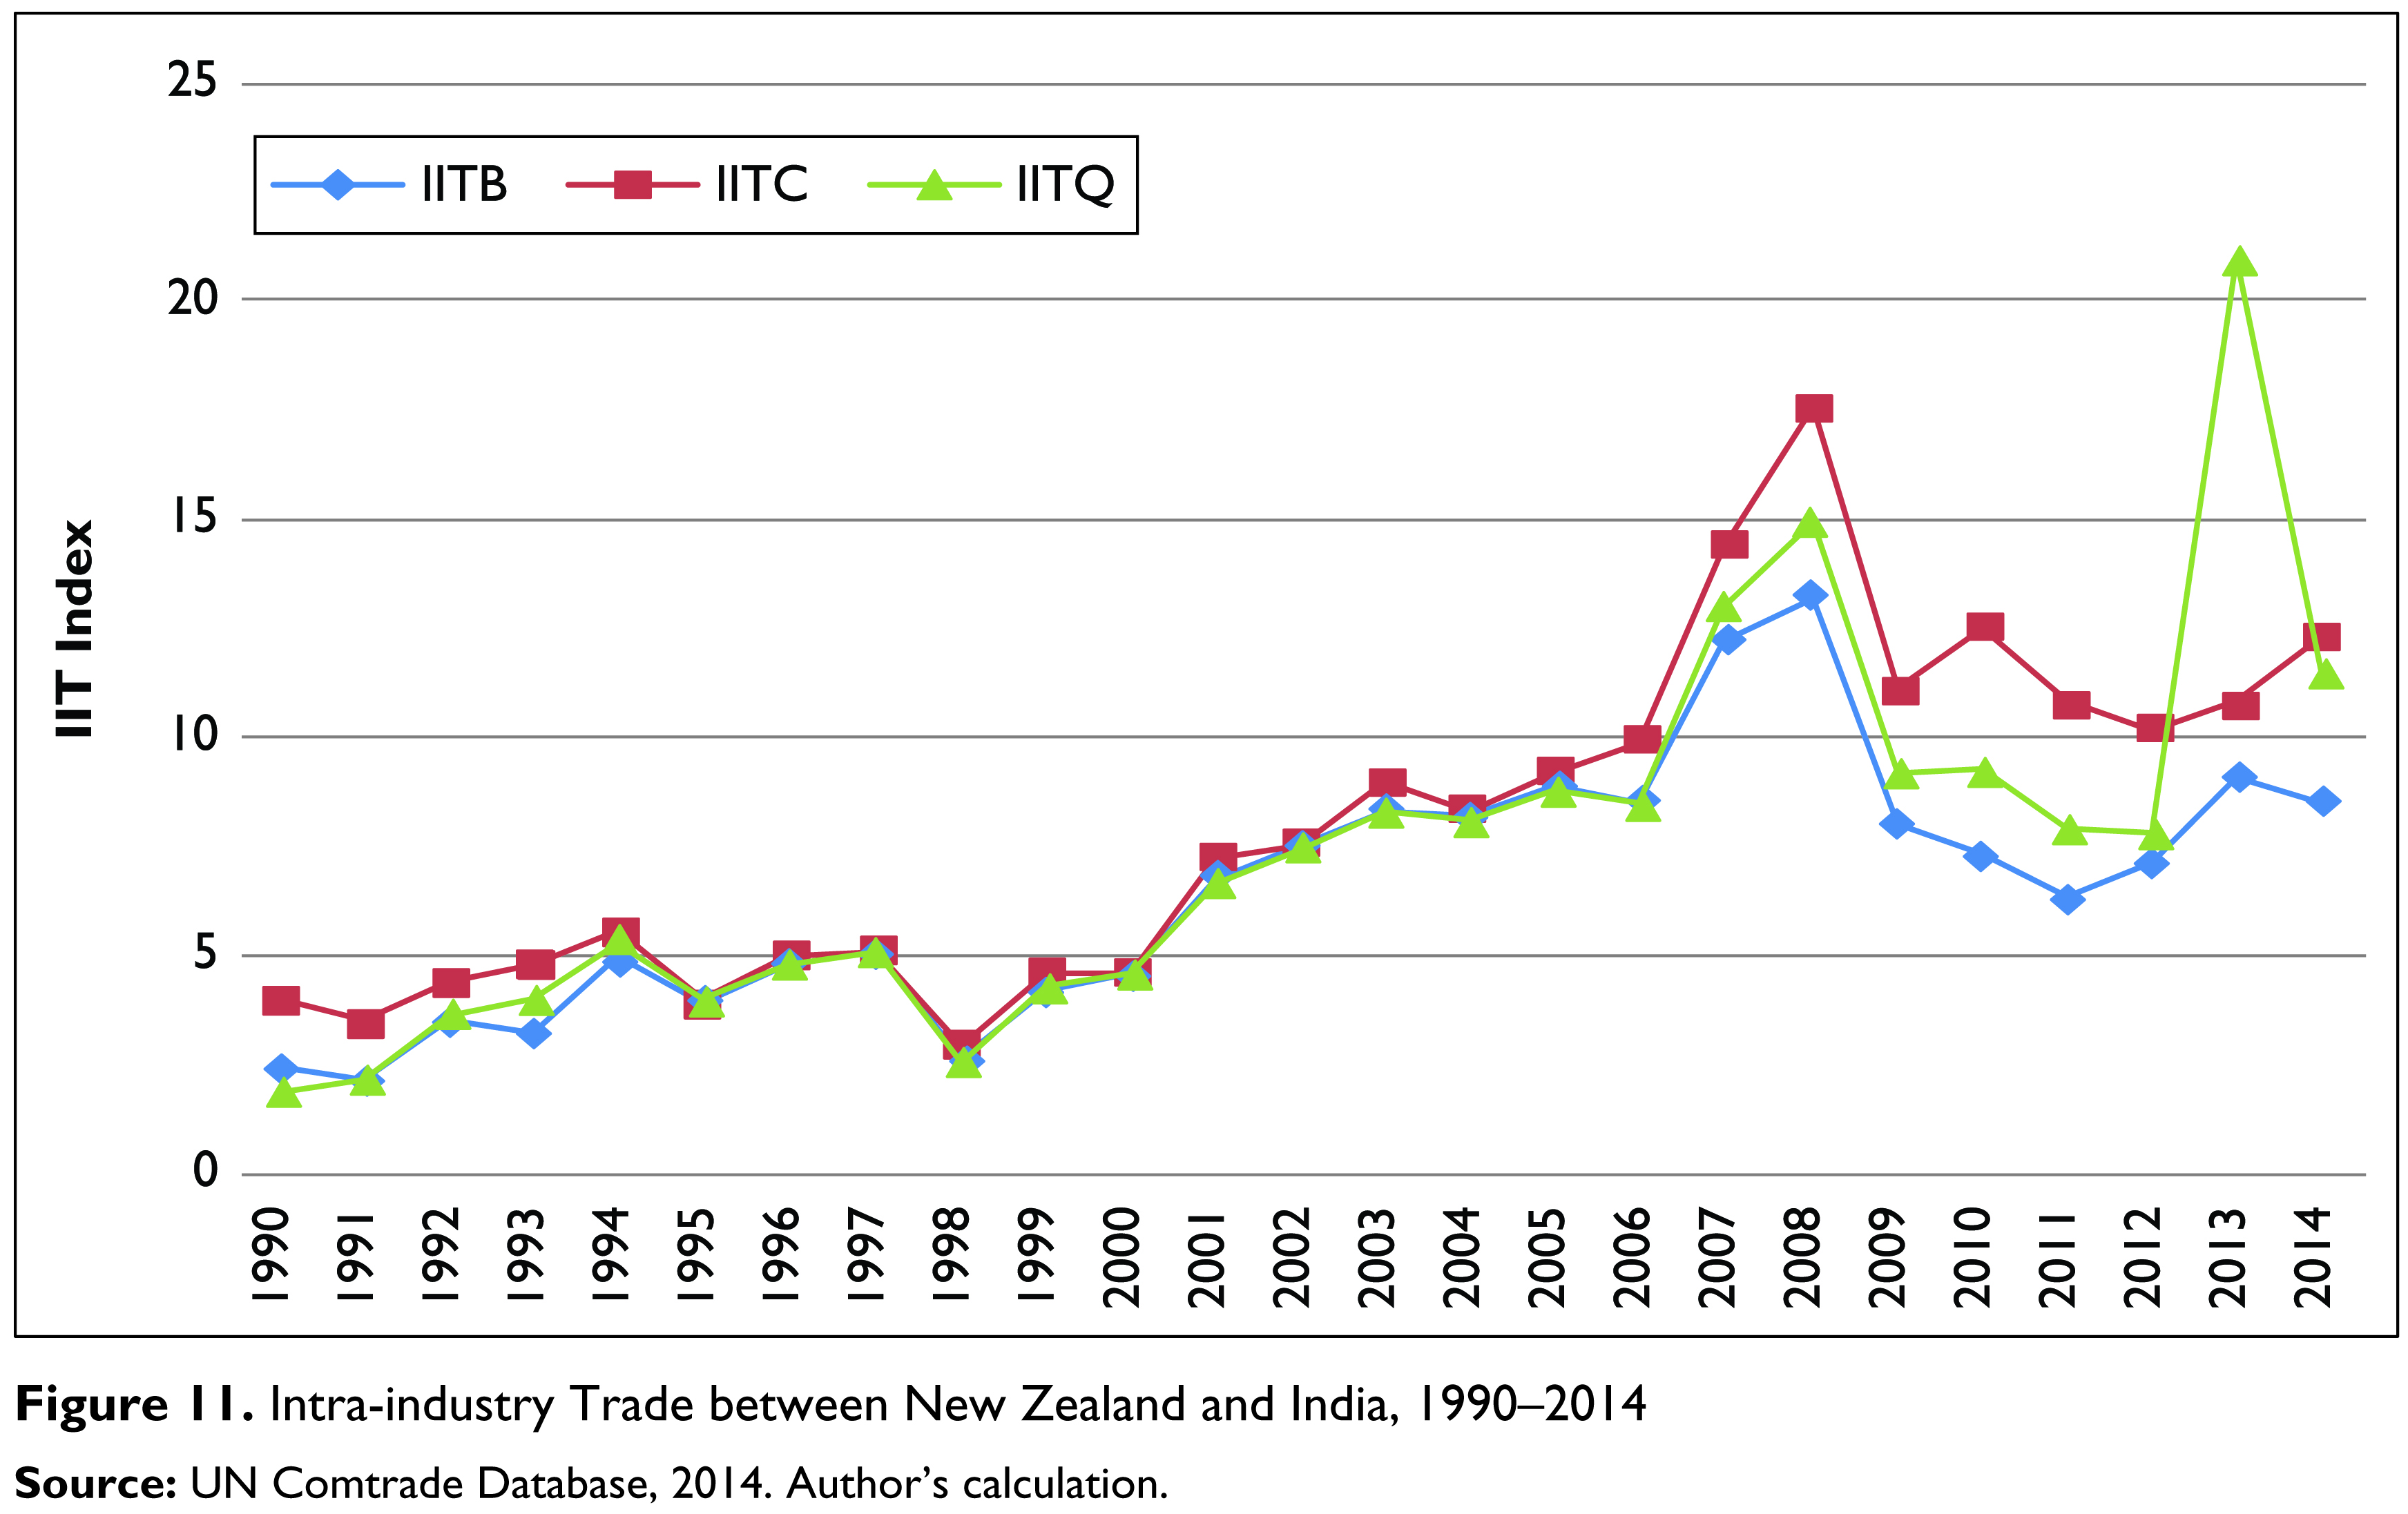
The IIT index varies between 0 and 100. If exports and imports are equal, then the index is 100. These IIT indices have been used to estimate the intensity of IIT. Intra-industry index was calculated at each industry level as well as across industries at a 3-digit SITC level for selected years. The IIT was also calculated for the entire sample period, that is, 1990–2012. Results are presented in Tables 7 and 8 and Figure 11. (Tables containing detailed IIT estimates are available from the corresponding author on request).
Results and Analysis
Trade Intensity Index
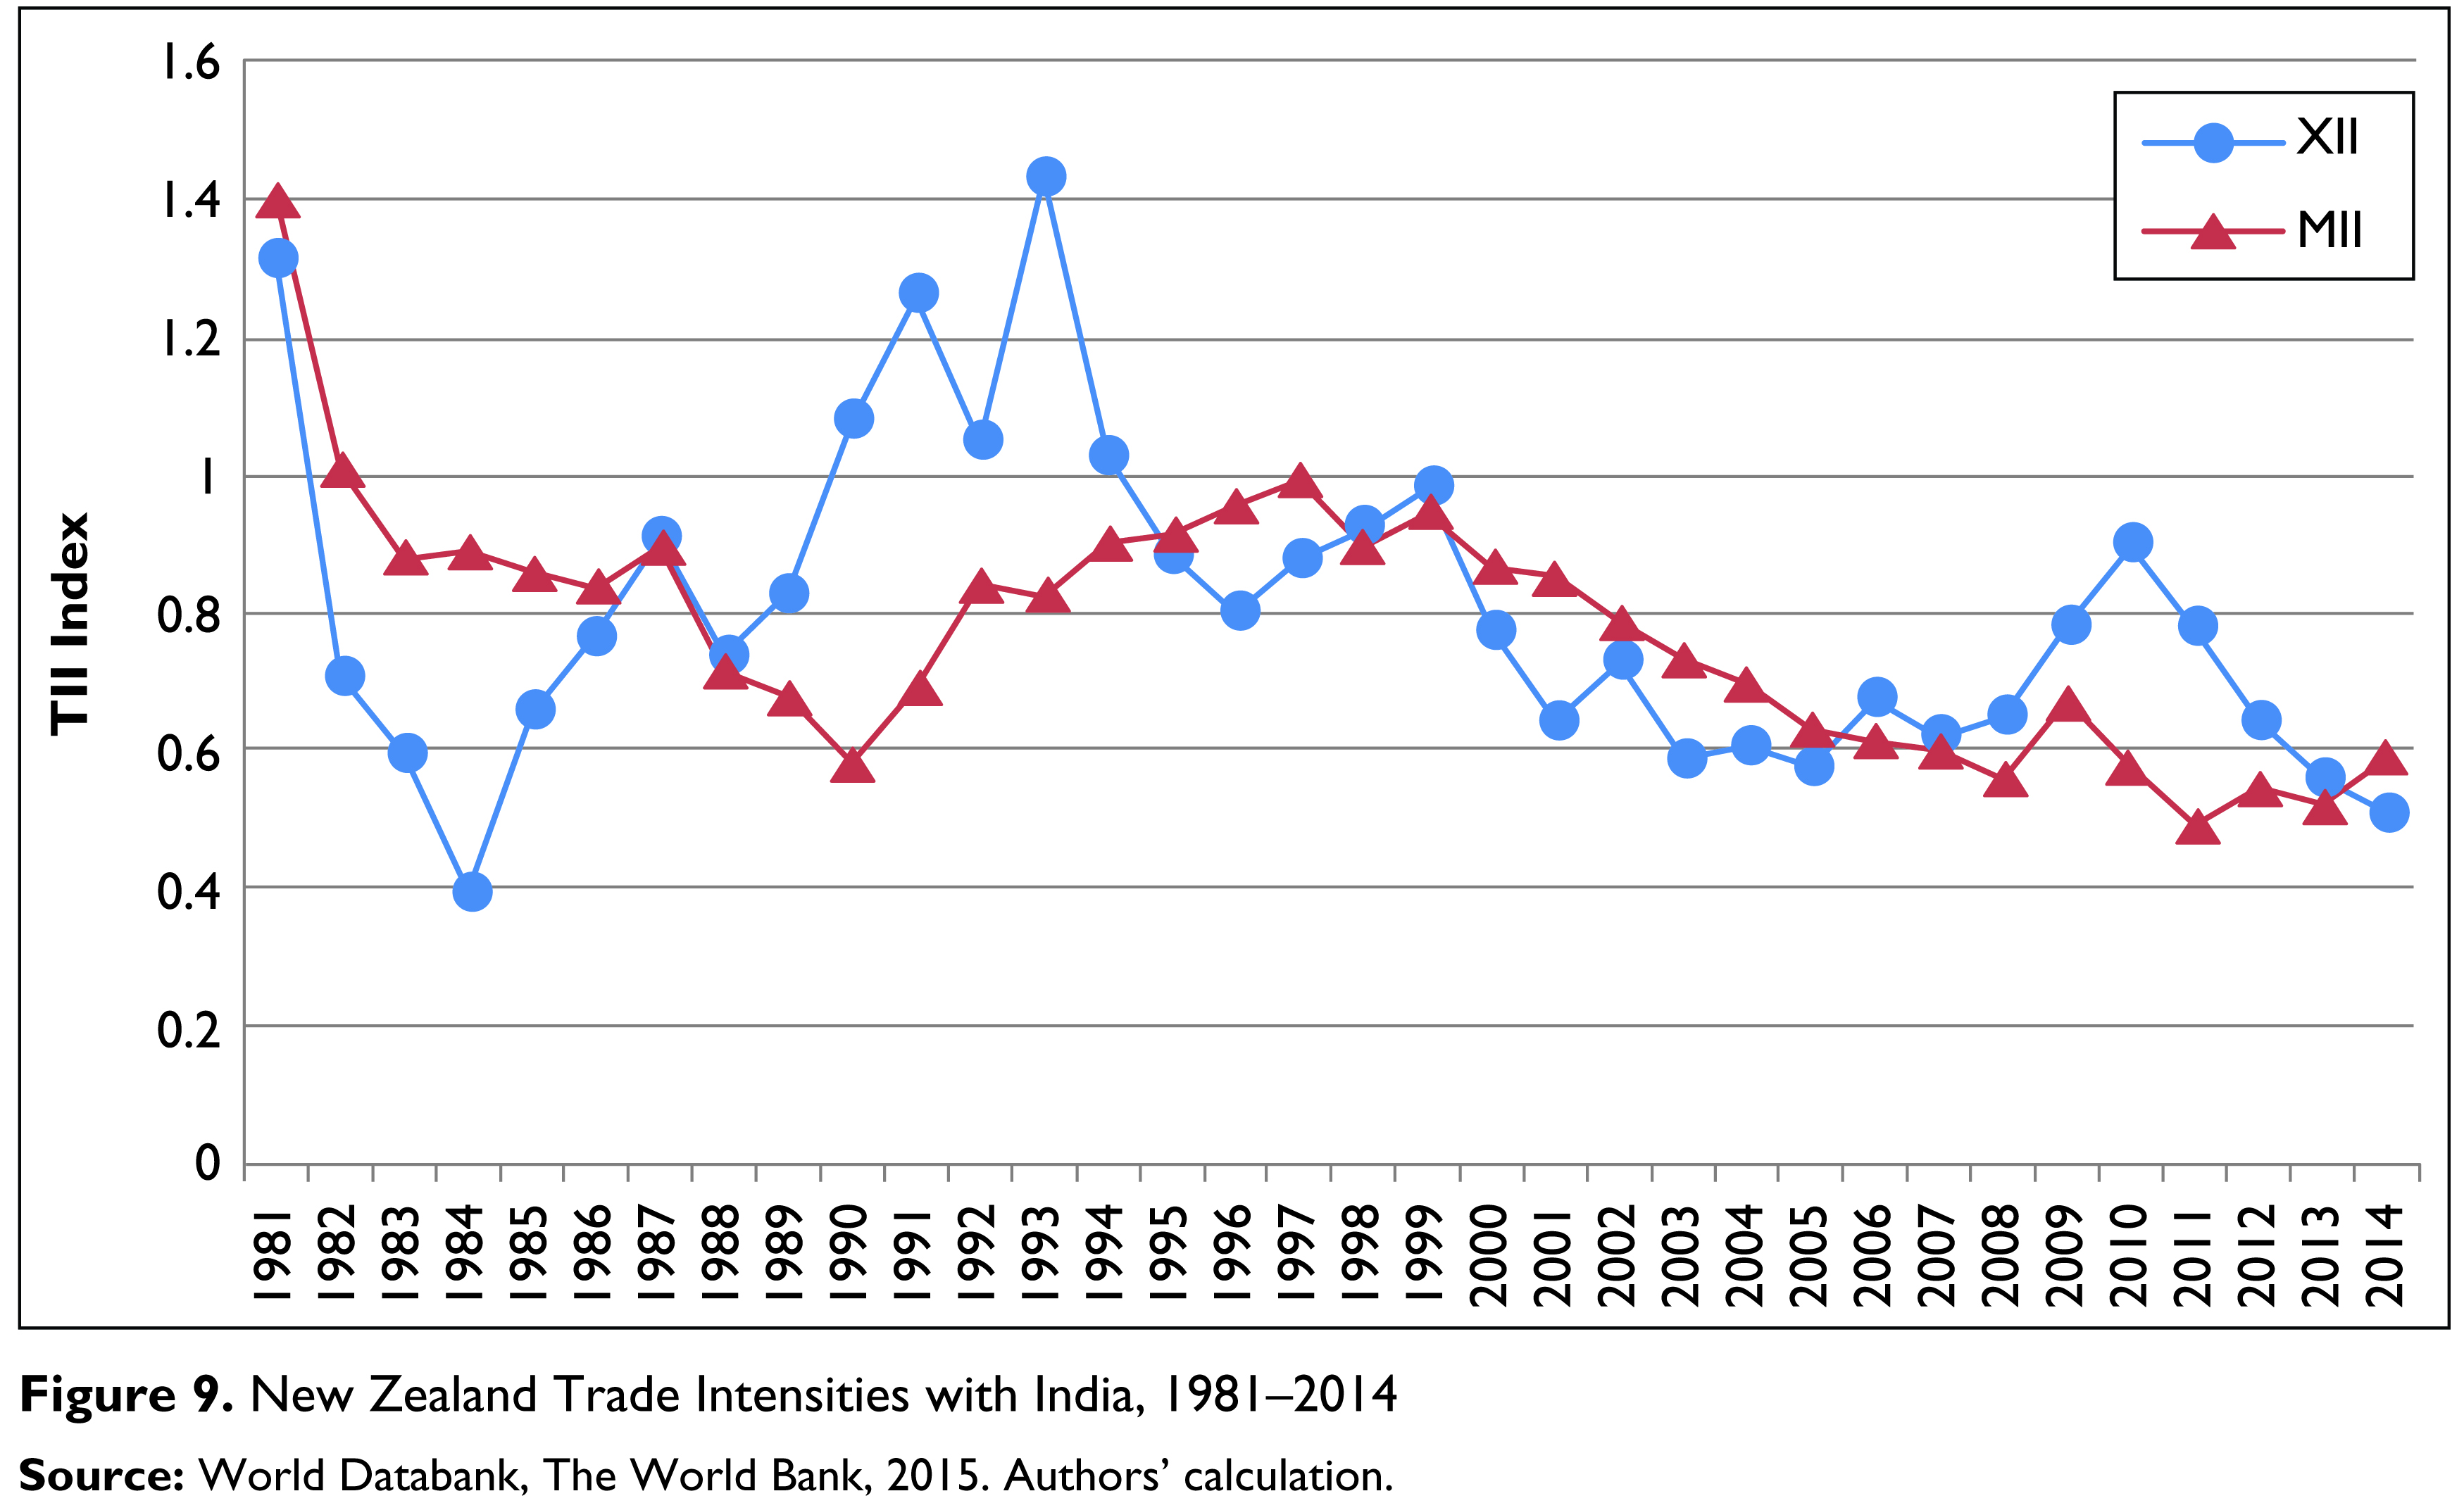
The index of New Zealand’s export intensity with India has maintained a value of less than unity (Figure 9). This implies that exports to India from New Zealand are lower than would be expected given India’s share of world trade. This is even more apparent when examining the import intensity values, which only exceeded 1 in 1981 and 1982. From 1990 to 2014, trade intensity of exports and imports tended to fluctuate. The analysis thus shows that India is underrepresented both as a source of imports and as an export market for New Zealand. But the low trade intensities do not necessarily mean that there are no prospects for increased trade. Overall, trade between them has increased, and trade intensities have varied over the years; in recent years export intensity has tended towards unity, while import intensity has only marginally decreased. The low intensities may reflect the fact that the bilateral trade between the two countries is less than the average level between New Zealand and the rest of the world. Economic integration should have positive effects on trade expansion and in strengthening trade relations.
Revealed Comparative Advantage
For the estimation of static RCA and DRCA, each commodity classification has been aggregated, using SITC revision 3, to the 3-digit level, that is, SITC 0 (food and live animals) and SITC 1 (beverages and tobacco) and other categories. An RCA value of less than 1 indicates that the share of commodity k in i’s exports is less than the corresponding world share of commodity k in total world exports. This indicates that country i does not have an RCA in the production of commodity k (World Bank, 2008). On the other hand, an RCA greater than 1 implies that the country has an RCA in the production of k. For DRCA, the critical value is 100; a DRCA index higher (lower) than 100 means that country i has dynamic comparative advantage (disadvantage) in that industry.
At the SITC 1 to SITC 3-digit level, New Zealand’s static RCA is concentrated primarily within SITC 0 and SITC 1, particularly in food and live animals (see Table 3). The RCA index value for these categories ranges from 6.93 in 2000 to 7.70 in 2012. The values of the 8-year DRCA (2005–2012) and the 13-year DRCA (2000–2012) are 246.12 and 209.15, respectively, which are both higher than 100. High values of DCRA are observed in wool, other animal hair (38,294.10), starch and insulin (3,567.58). This indicates a possible strengthening of New Zealand’s DRCA at this aggregated level. The only other 1-digit product aggregation with an RCA is SITC 2 and SITC4: crude materials, inedible and animal, vegetable oils, fats, wax. These categories have DRCA values ranging from 4.38 in 2000 to 2.46 in 2011, which show that the comparative advantages in these two industries have been significantly reduced over time. All other category aggregations at a 1-digit SITC level show no revealed comparative advantage.
Static and Dynamic Revealed Comparative Advantage Index Values for New Zealand, by Industry
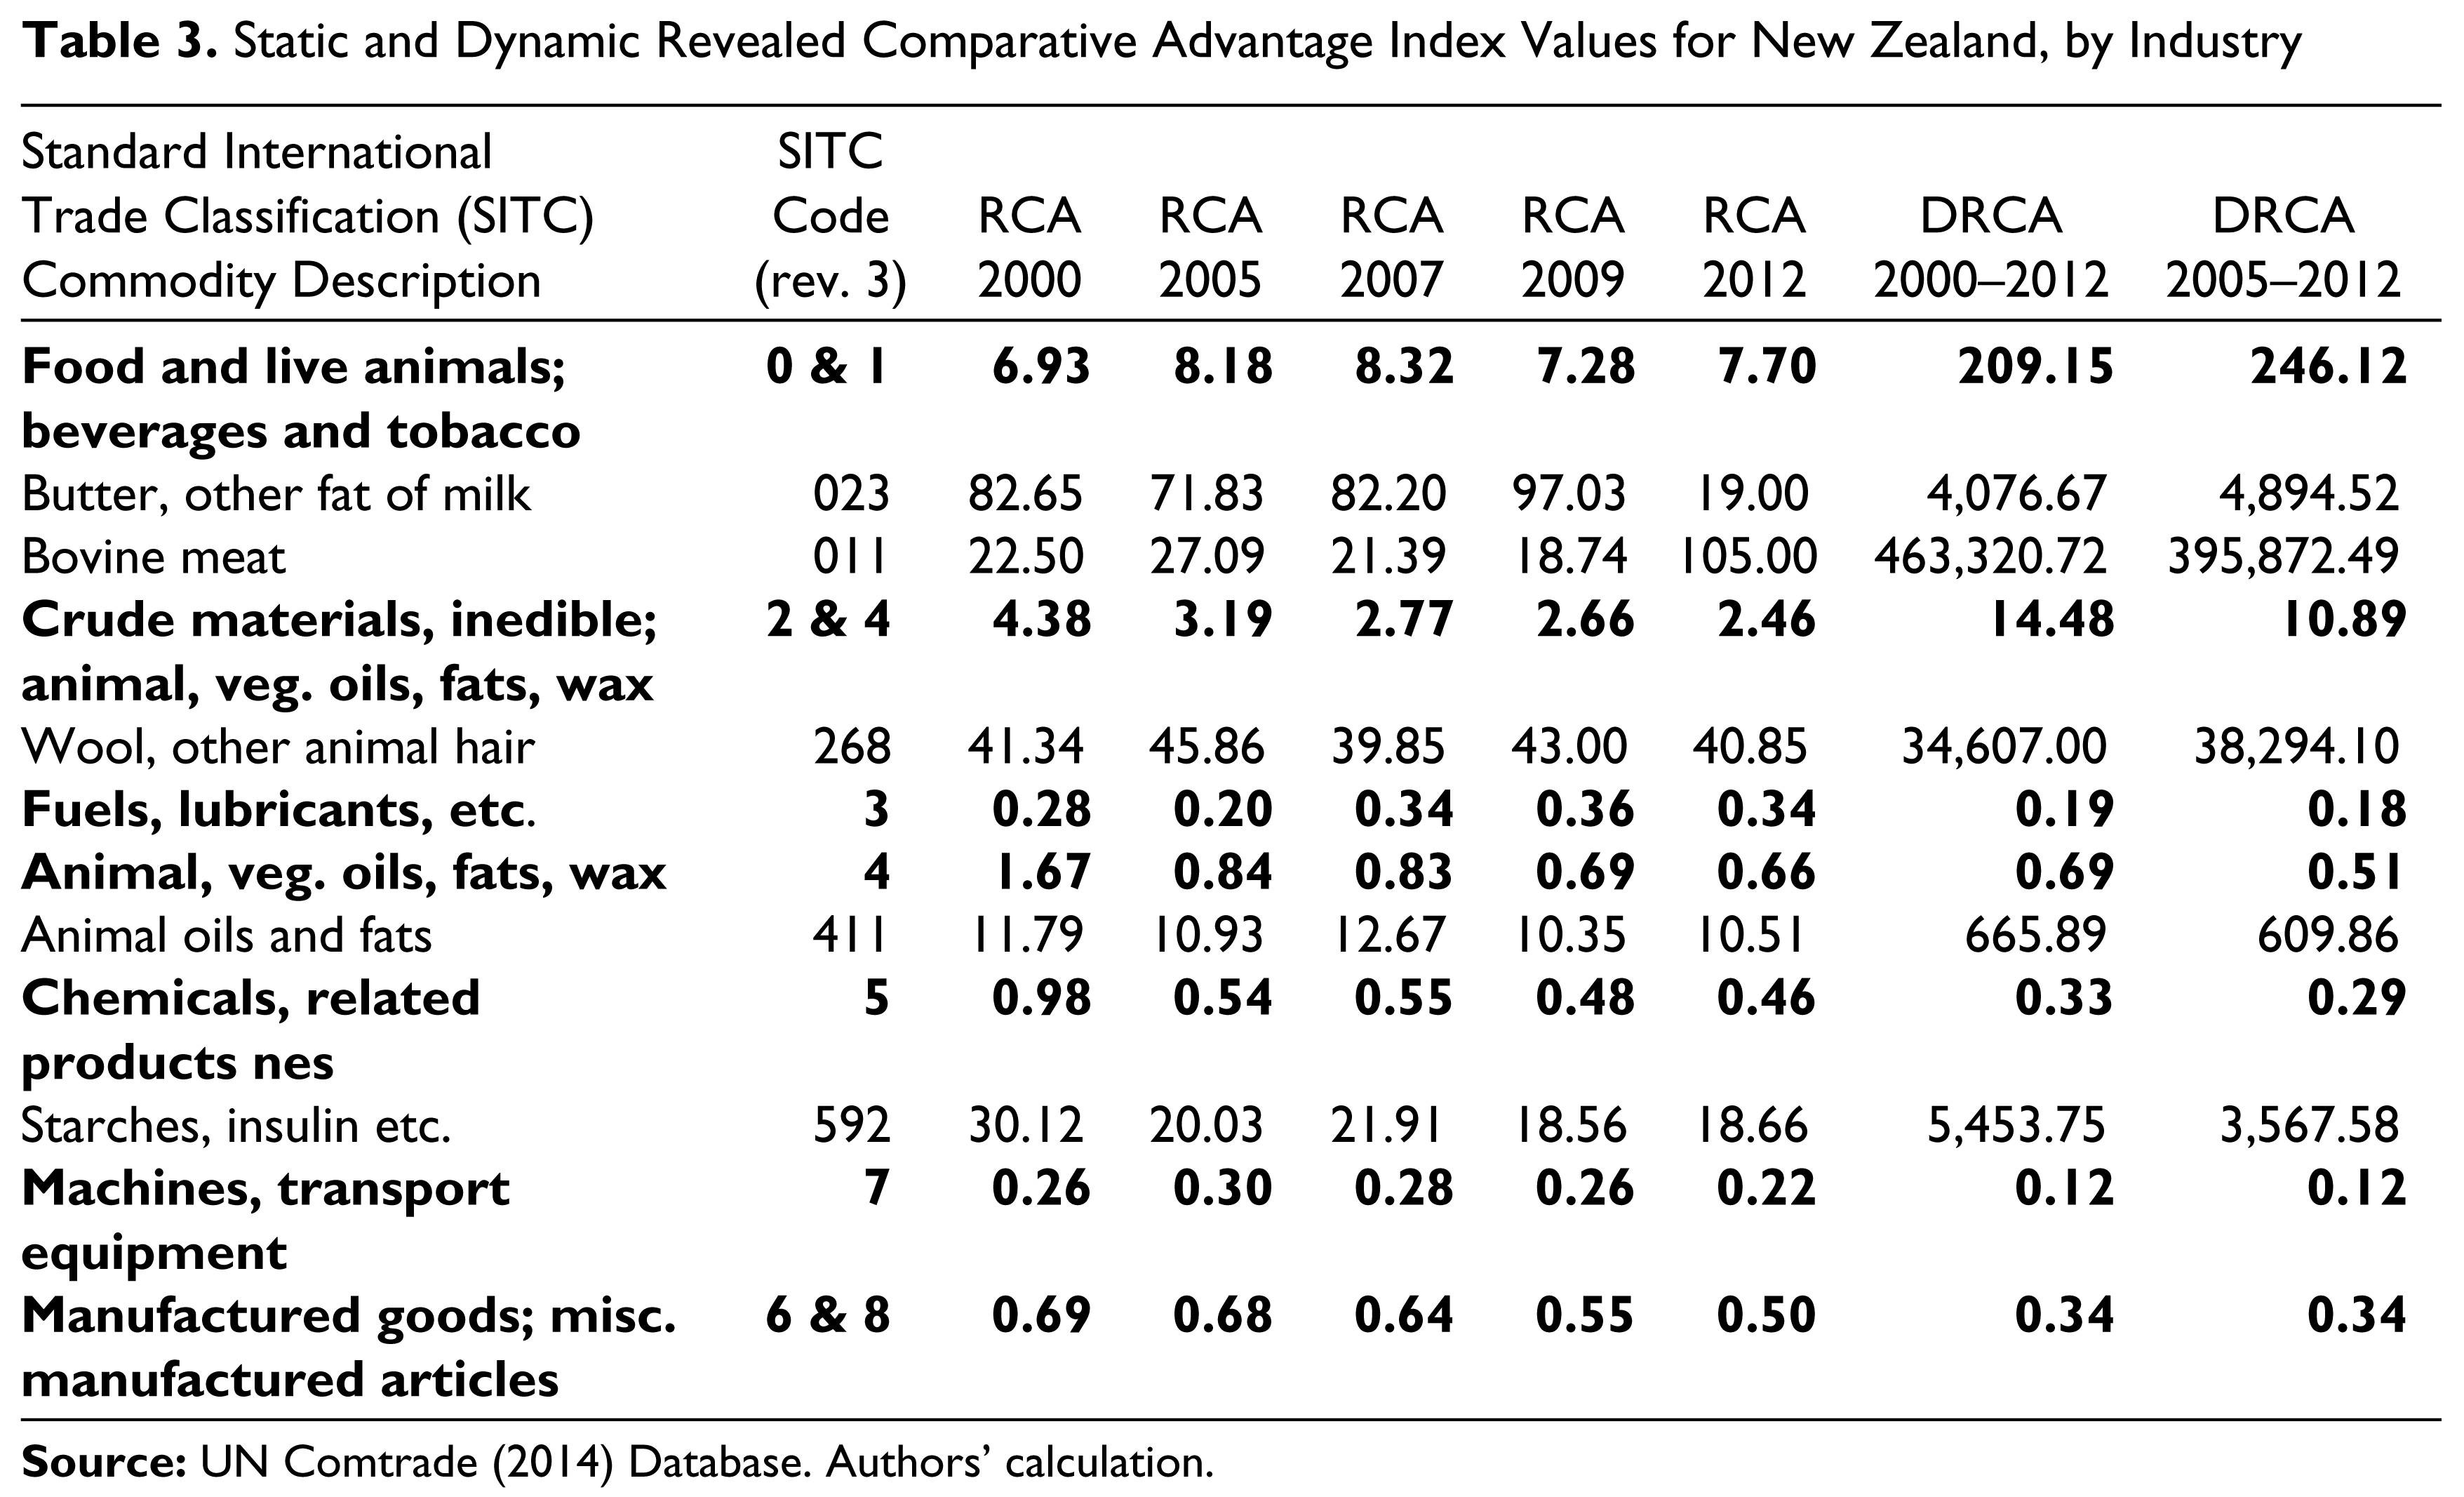
Within SITC 0 and 1, New Zealand possesses strong RCA in the meat and dairy industries ranging from 82.65 in 2000 to 97.03 in 2009 for butter, and from 22.5 in 2000 to 27.1 in 2005 and 105 in 2012 for bovine meat. An RCA value above 1 is also found for milk and cream (SITC 022) and other meat and meat offal (SITC 012). Revealed comparative advantage values greater than 1 are also found in several other industries at the 3-digit level, such as wool (SITC 268), with an RCA value greater than 40 in 2000, 2005, 2009 and 2012; animal oils and fats (SITC 411), with RCAs of 11.79 in 2000, 12.67 in 2007 and 10.51 in 2012 and starches (SITC 592), with RCA ranges from 30.12 in 2000 to 18.66 in 2012. Other industries not included in Table 3 but with high RCA values are hides (SITC 211), wood (SITC 247) and agricultural machinery (SITC 721).
India has a comparative advantage at some point between 2000 and 2011 in all categories, but not in SITC 7 (machines and transport equipment), which has the value of RCAs ranging from 0.18 in 2000 to 0.96 in 2011 (see Table 4). In 2012, it reached 1.02, indicating a significant increase since 2000. However, all DRCA indices are far below 100 at the aggregated level.
Static and Dynamic Revealed Comparative Advantage Index Values for India, by Industry
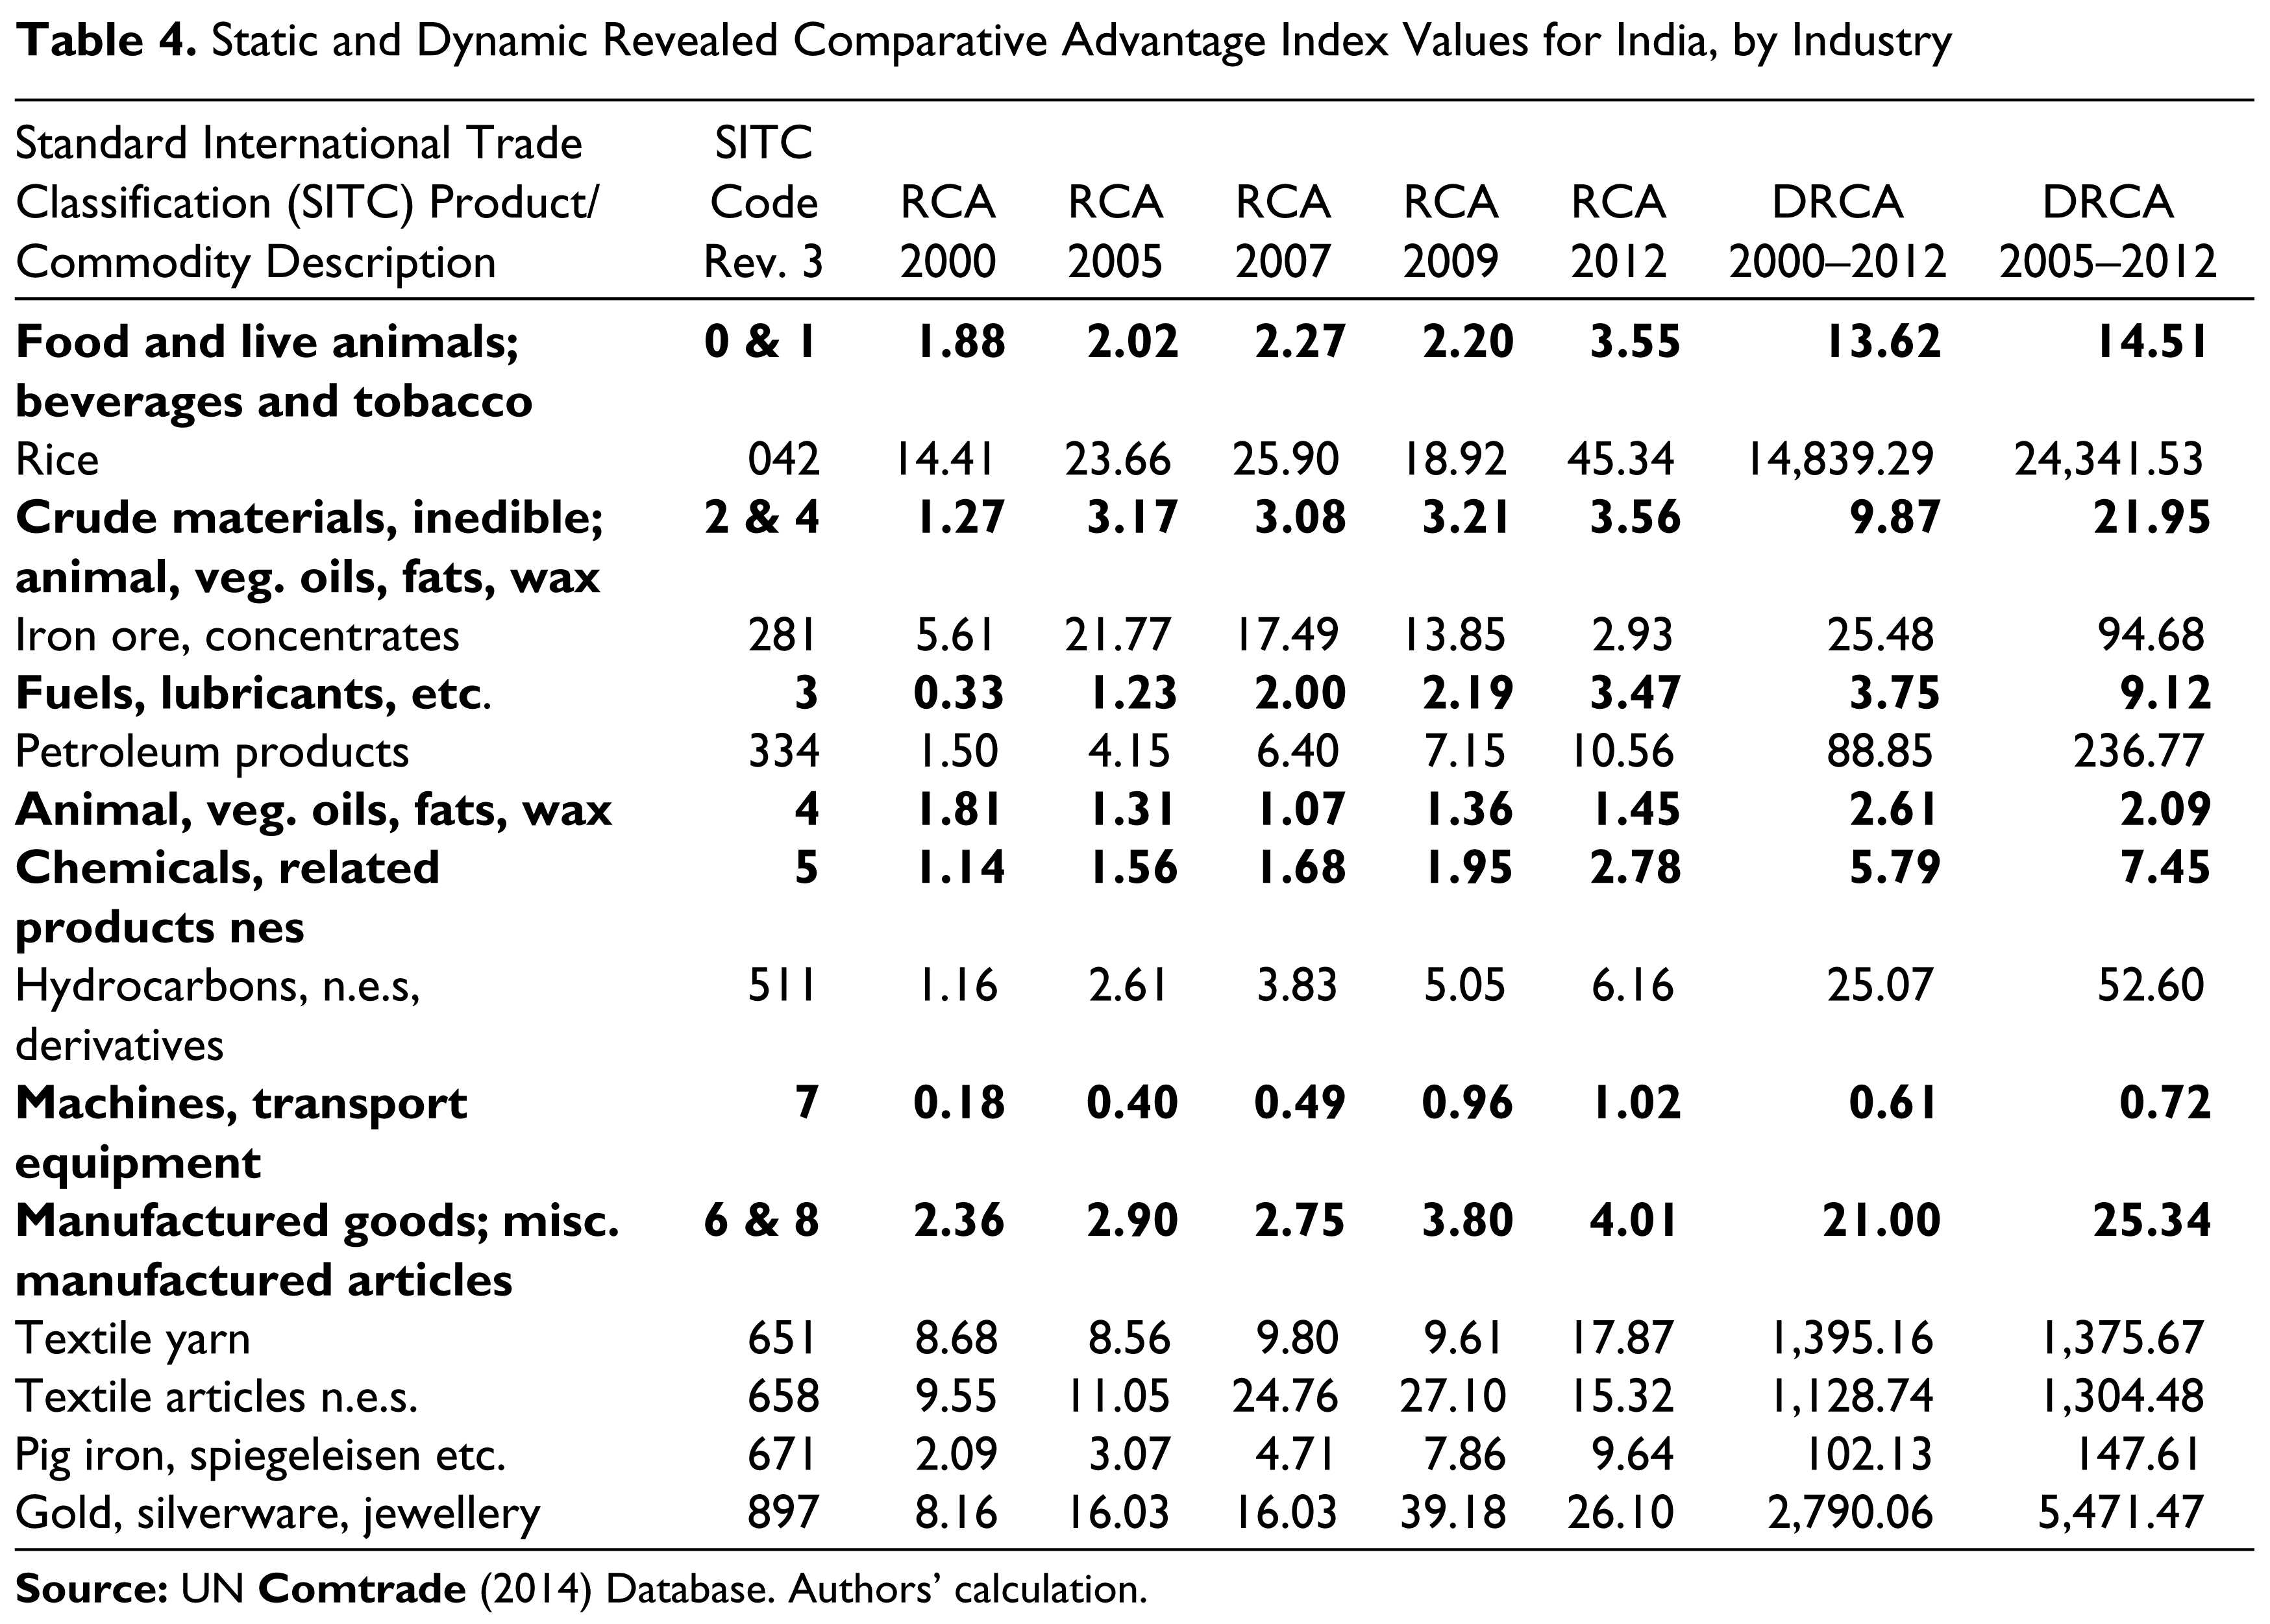
An example within SITC 0 and SITC 1 is rice (SITC 042). India possesses a strong RCA in this commodity, with values all over 14 in all observed years. India also possesses a strong RCA in iron ore, concentrates (SITC 281), with values in 2005, 2007 and 2009 of 21.77, 17.49 and 13.58, respectively. However, RCAs in this commodity have been decreasing in terms of the overall trends over the period. India possesses a strong RCA in many industries in SITC 6 and SITC 8 (manufactured goods and miscellaneous manufactured articles). Gold, silverware and jewellery (SITC 897) are good examples, with static RCA values exceeding 10 in all years except 2000. Textile yarn (SITC 651) and textile articles n.e.s. (SITC 658) are another, with an average RCA above 10. Other industries are petroleum products (SITC 334) and hydrocarbons, n.e.s, derivatives (SITC 511). In contrast, these industries had extremely high DRCA values at the 3-digit level. For example, the rice industry, in which DRCA index for 2005–2012 even reached 24,341.53, and for gold, silverware and jewellery, DRCA index reached 5,471.47.
In summary, New Zealand’s RCA is concentrated in only a few industries at an aggregated SITC 3-digit level. This is to be expected given New Zealand’s relatively small and specialised economy. The main areas of RCA lie in the food sector, specifically in meat and dairy as well as crude materials. At the SITC 3-digit level, New Zealand also has RCA in industries, such as, wood, animal oils and starches and selected manufactured industries.
India, by comparison, has RCA in most of the aggregations of commodities at the SITC 3-digit level, although some of these advantages are relatively weak, with RCA values of less than 3. In individual industries at the SITC 3-digit level, however, a different image appears: India possesses a strong RCA in industries, such as rice, gold, silverware and jewellery.
The foregoing discussion suggests that New Zealand’s trade with India has not been fully maximised. Based on their respective comparative advantage or disadvantage, the potential exists for further deepening of commercial relations. Exporters of both the countries can use these findings to identify their areas of comparative advantage, both static and dynamic, and to assess the feasibility of exporting to the full extent possible for items that are not yet being exported.
Intra-industry Trade
In terms of the IIT between New Zealand and India at a 3-digit level (see Tables 5 and 6), products or sectors with high IIT values are cheese and curds (SITC 024), vegetables, roots, tubers and other edible items (SITC 054), where the IIT index is 89.2 and 94.3, respectively; alcoholic beverages (SITC 112), where the index is 73.4; heating and cooling equipment (SITC 741), where the index is 87.4 and measuring, checking, analysing and controlling instruments (SITC 874), where the index is 96.9. A number of other industries in the SITC 6 and SITC 7 categories also show high degrees of IIT. Overall, the IIT index between New Zealand and India has been increasing significantly from no more than 5 to an average of 13 in recent years (see Figure 11).
New Zealand–India Intra-industry Trade by Industry: 3-digit SITC High Values of IIT Included Only

New Zealand–India Intra-industry Trade by Industry: 3-digit SITC in 2014
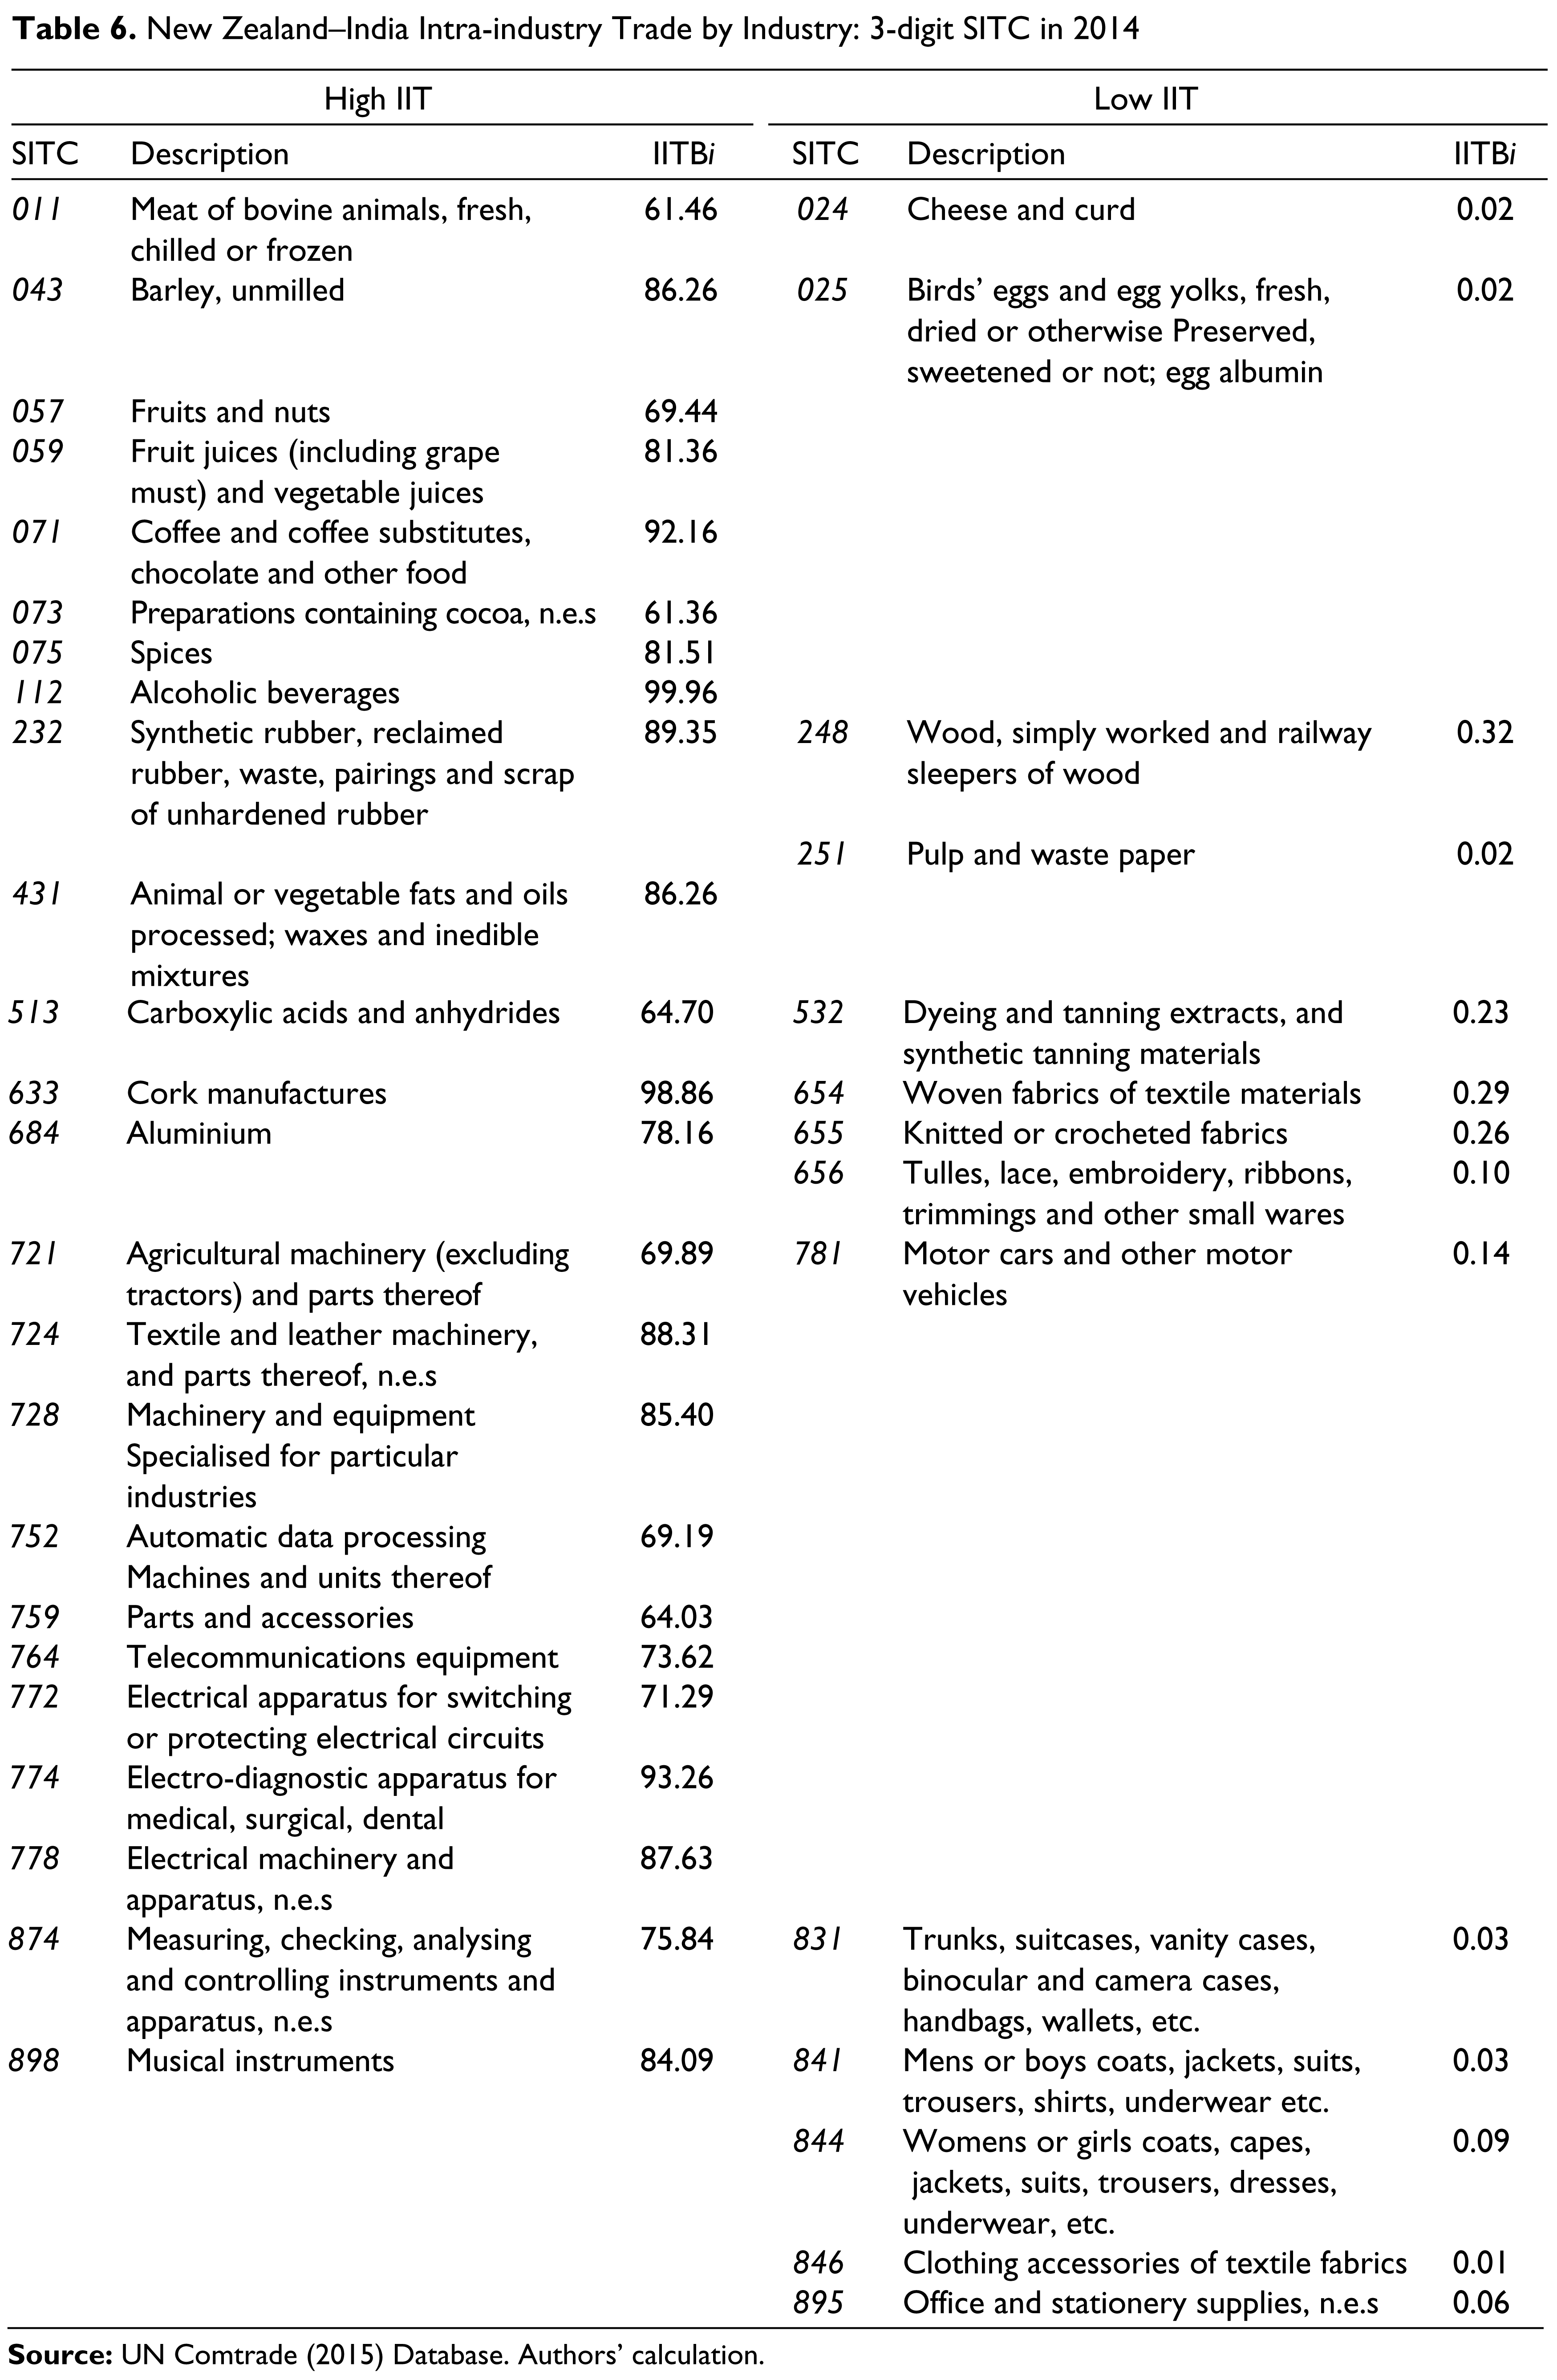
In terms of the comparison between New Zealand and India’s IIT in 1990 and 2012, some industries, such as alcoholic beverages (SITC 112), index experienced a reduced index from 99.1 to 73.4, indicating a decreasing potential for growth. Conversely, other industries had shown an increasing potential for growth. For instance, the trade in measuring, checking, analysing and controlling instruments (SITC 874) index increased significantly from 90 in 1990 to 97 in 2012 (see Table 5). More recently in 2014, the index of some industries, for example, alcoholic beverages (SITC 112) increased continually to 99.96 per cent. In addition, the indices of some other industries, such as coffee and coffee substitutes (SITC 071), the cork manufactures (SITC 633) and electro-diagnostic apparatus for medical use (SITC 774), are all above 90 in 2014 (see Table 6). Overall, there were six industries with an index higher than 60 in 1990, while the number of high-IIT industries increased to 20 and 24 in 2012 and 2014, respectively. Furthermore, industries with high index of IIT were mainly concentrated on machinery and transport equipment (SITC 7). This suggests a high level of industrial development in those sectors. Additionally, some industries have shown a high level of inter-industry trade in 2014, for example, the index of cheese and curd (SITC 024), bird’s eggs and egg yolks (SITC 025) and pulp and waste paper (SITC 251) was close to 0.
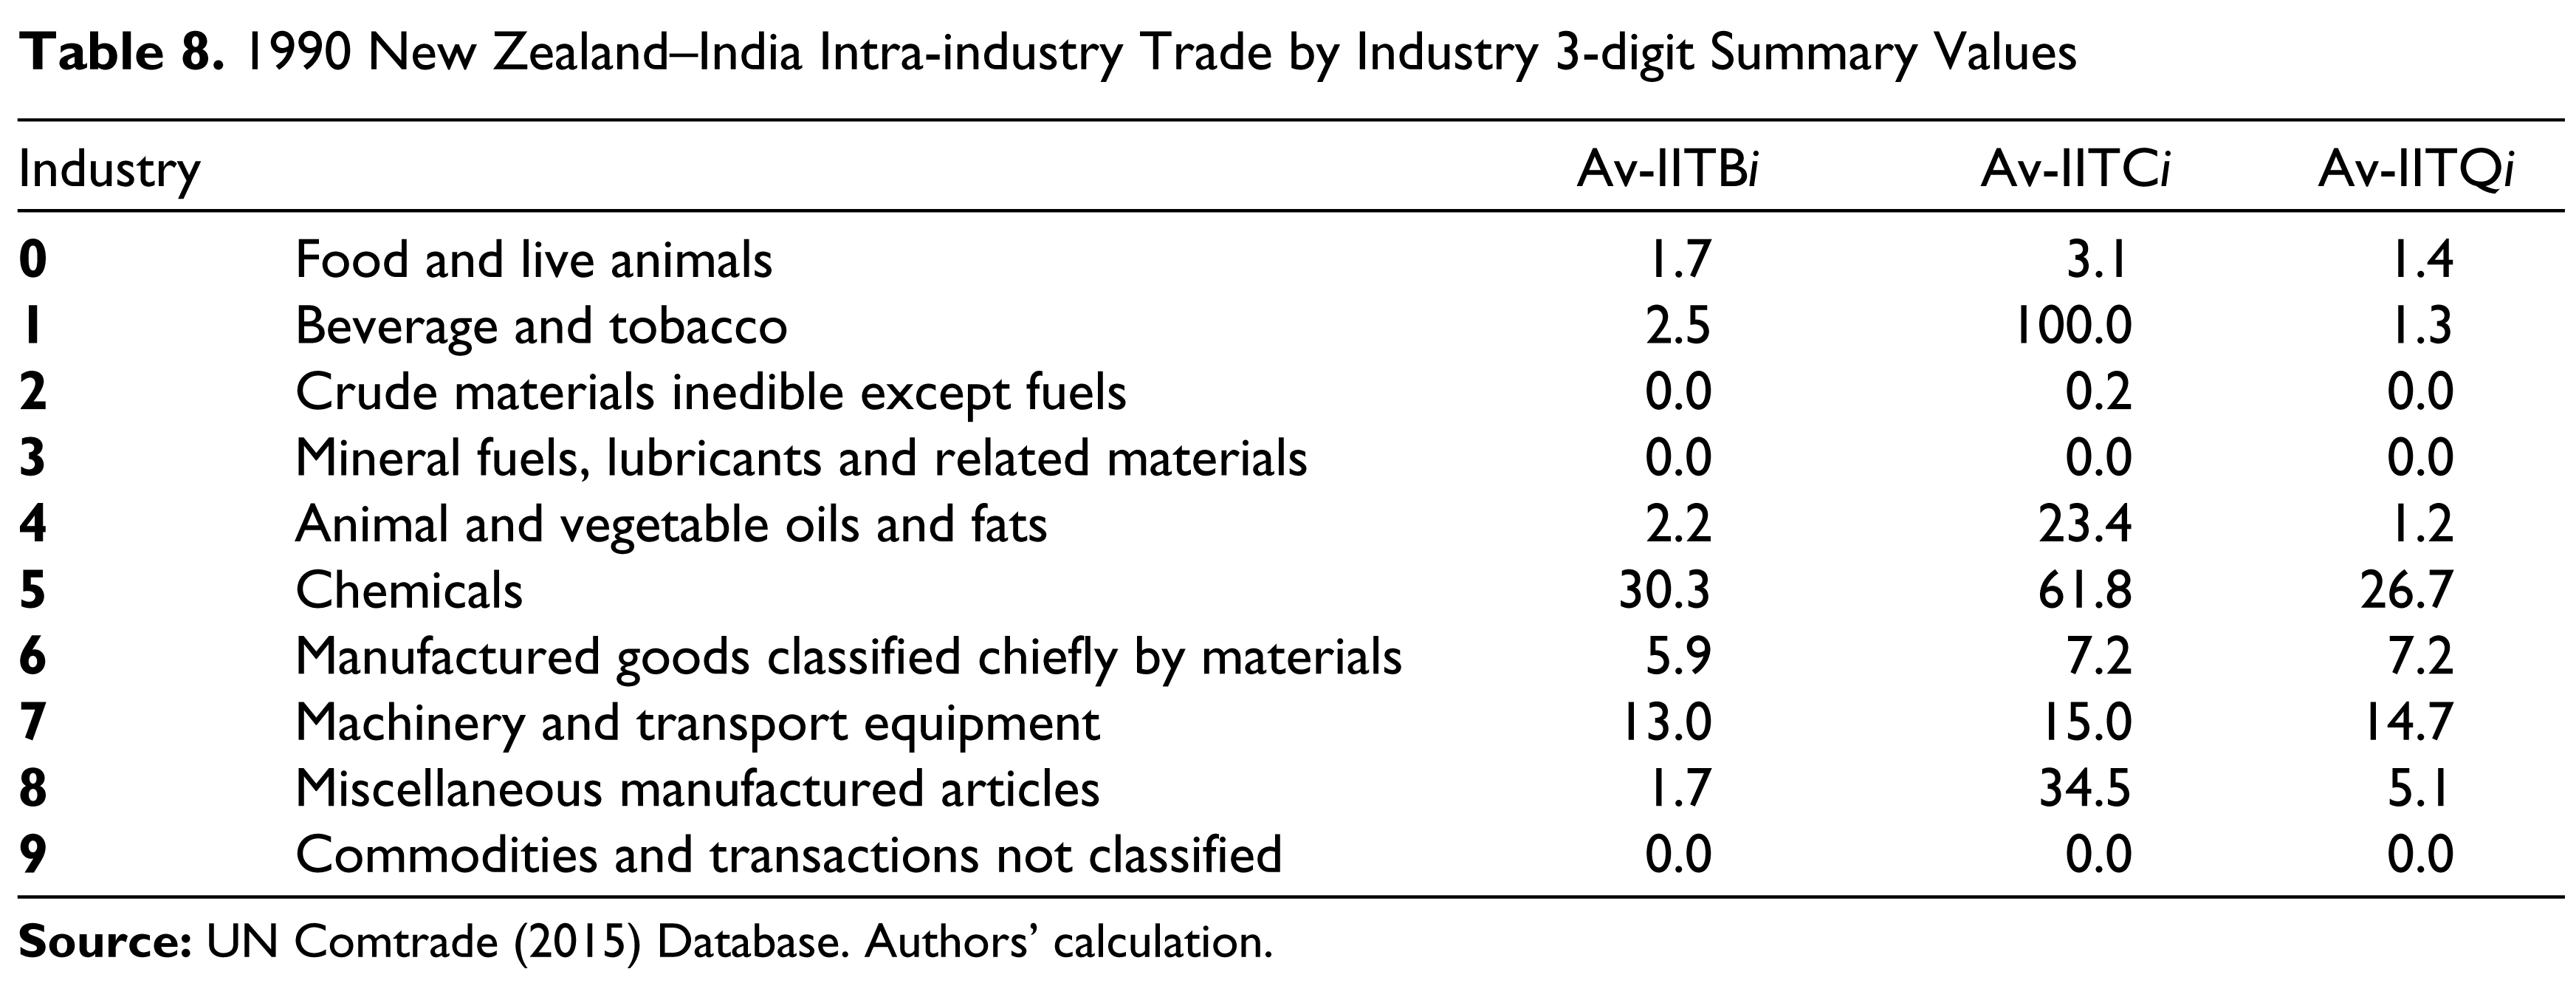
As in the 3-digit summary levels, the result also identifies industries which have a potential for investment in joint ventures (see Tables 7 and 8). Specifically, industries, such as beverages and tobacco, chemicals and machinery and transport equipment, had high IIT index relatively in 1990 and 2014. It indicates an increase in bilateral trade between New Zealand and India, particularly in these industries. (Full results of IIT based on 3-digit SITC are available from the corresponding author on request).
New Zealand–India Intra-industry Trade by Industry

1990 New Zealand–India Intra-industry Trade by Industry 3-digit Summary Values
Intra-industry trade creates closer links between countries by providing more positive gains. This is especially true in the context of reform and internationalisation of manufacturing activities which enhance assembly production from parts and components produced in different countries (Dixit & Grossman, 1982). Compared to inter-industry trade, it also softens political opposition to market-driven economic cooperation induced by trade liberalisation (Fukasaku, 1992). It is hypothesised that the greater the level of IIT within a region, the better is the prospect for effective bilateral cooperation. Evidence suggests the growing tendency of firms, or branches of multinational firms, to specialise in particular products within an industrial sector due to economies of scale, product differentiation or geographic product specialisation. The result is growth in trade even when factors of production between countries are similar.
Intra-industry trade is likely to play an important role in future trade negotiations. It is argued that if trade liberalisation fosters more IIT, then, both (or all) trading partners benefit from increased trade, which in turn stimulates investment and technology transfer.
India is currently New Zealand’s 15th largest export market, with the volume and value of exports increasing in recent years. Exports are currently concentrated on a few primary products. With a rising middle class which is not only well educated but also fluent in English, India is an ideal destination for investment. In addition, India’s expanding communications and infrastructure, which include road, ports, airports, power sector, mining, oil and natural gas, provide New Zealand companies with significant investment opportunities. India also needs expertise, which New Zealand companies can provide, in water management, soil conservation, waste disposal, food processing and agribusiness.
Other investment opportunities exist, such as the pharmaceutical industry in India, with its low costs, is becoming a major destination of FDI inflows especially from Australian entrepreneurs. There is also potential for mutual cooperation in the fast-growing Indian film and television industry. The food and beverage industry of India, particularly wine and beer, is another potentially attractive area for New Zealand companies to invest.
Potential also exists in the services sectors such as education and health. If New Zealand’s educational institutions can tap the Indian market, they can have the next biggest market for education after China. Health services and sophisticated medical equipment, where New Zealand firms also have expertise, are needed by the Indian government in its efforts to improve human development. The tourism and hospitality sectors of both countries also have great potential for growth.
Conclusions
This study examined the strength of New Zealand’s trade relations with India by analysing trade data from 1990 to 2014 and estimating the TII. We also identified static and DRCA and IIT indices in the context of ongoing negotiations between New Zealand and India. The results show that trade between New Zealand and India has increased and that trade relations have strengthened moderately in recent years. However, despite the recent trade growth, bilateral trade between New Zealand and India remains below its potential.
The findings also suggest that IIT has developed in selected industries, with about 20 industries across SITC product groups, showing high degrees of IIT and having potential for trade expansion. Food, chemicals, manufactured goods and transport equipment industries show a high degree of IIT. These industries should be given consideration by policymakers in the ongoing New Zealand and India FTA negotiations. Specifically, products with high IIT indices should be considered for fast-track liberalisation and concessions under preferential trade agreements. New Zealand also has the potential to establish trade-generating joint ventures with India in a number of products with high IIT values. Firms in both countries could develop a joint marketing strategy in those matched products which have potential as joint ventures.
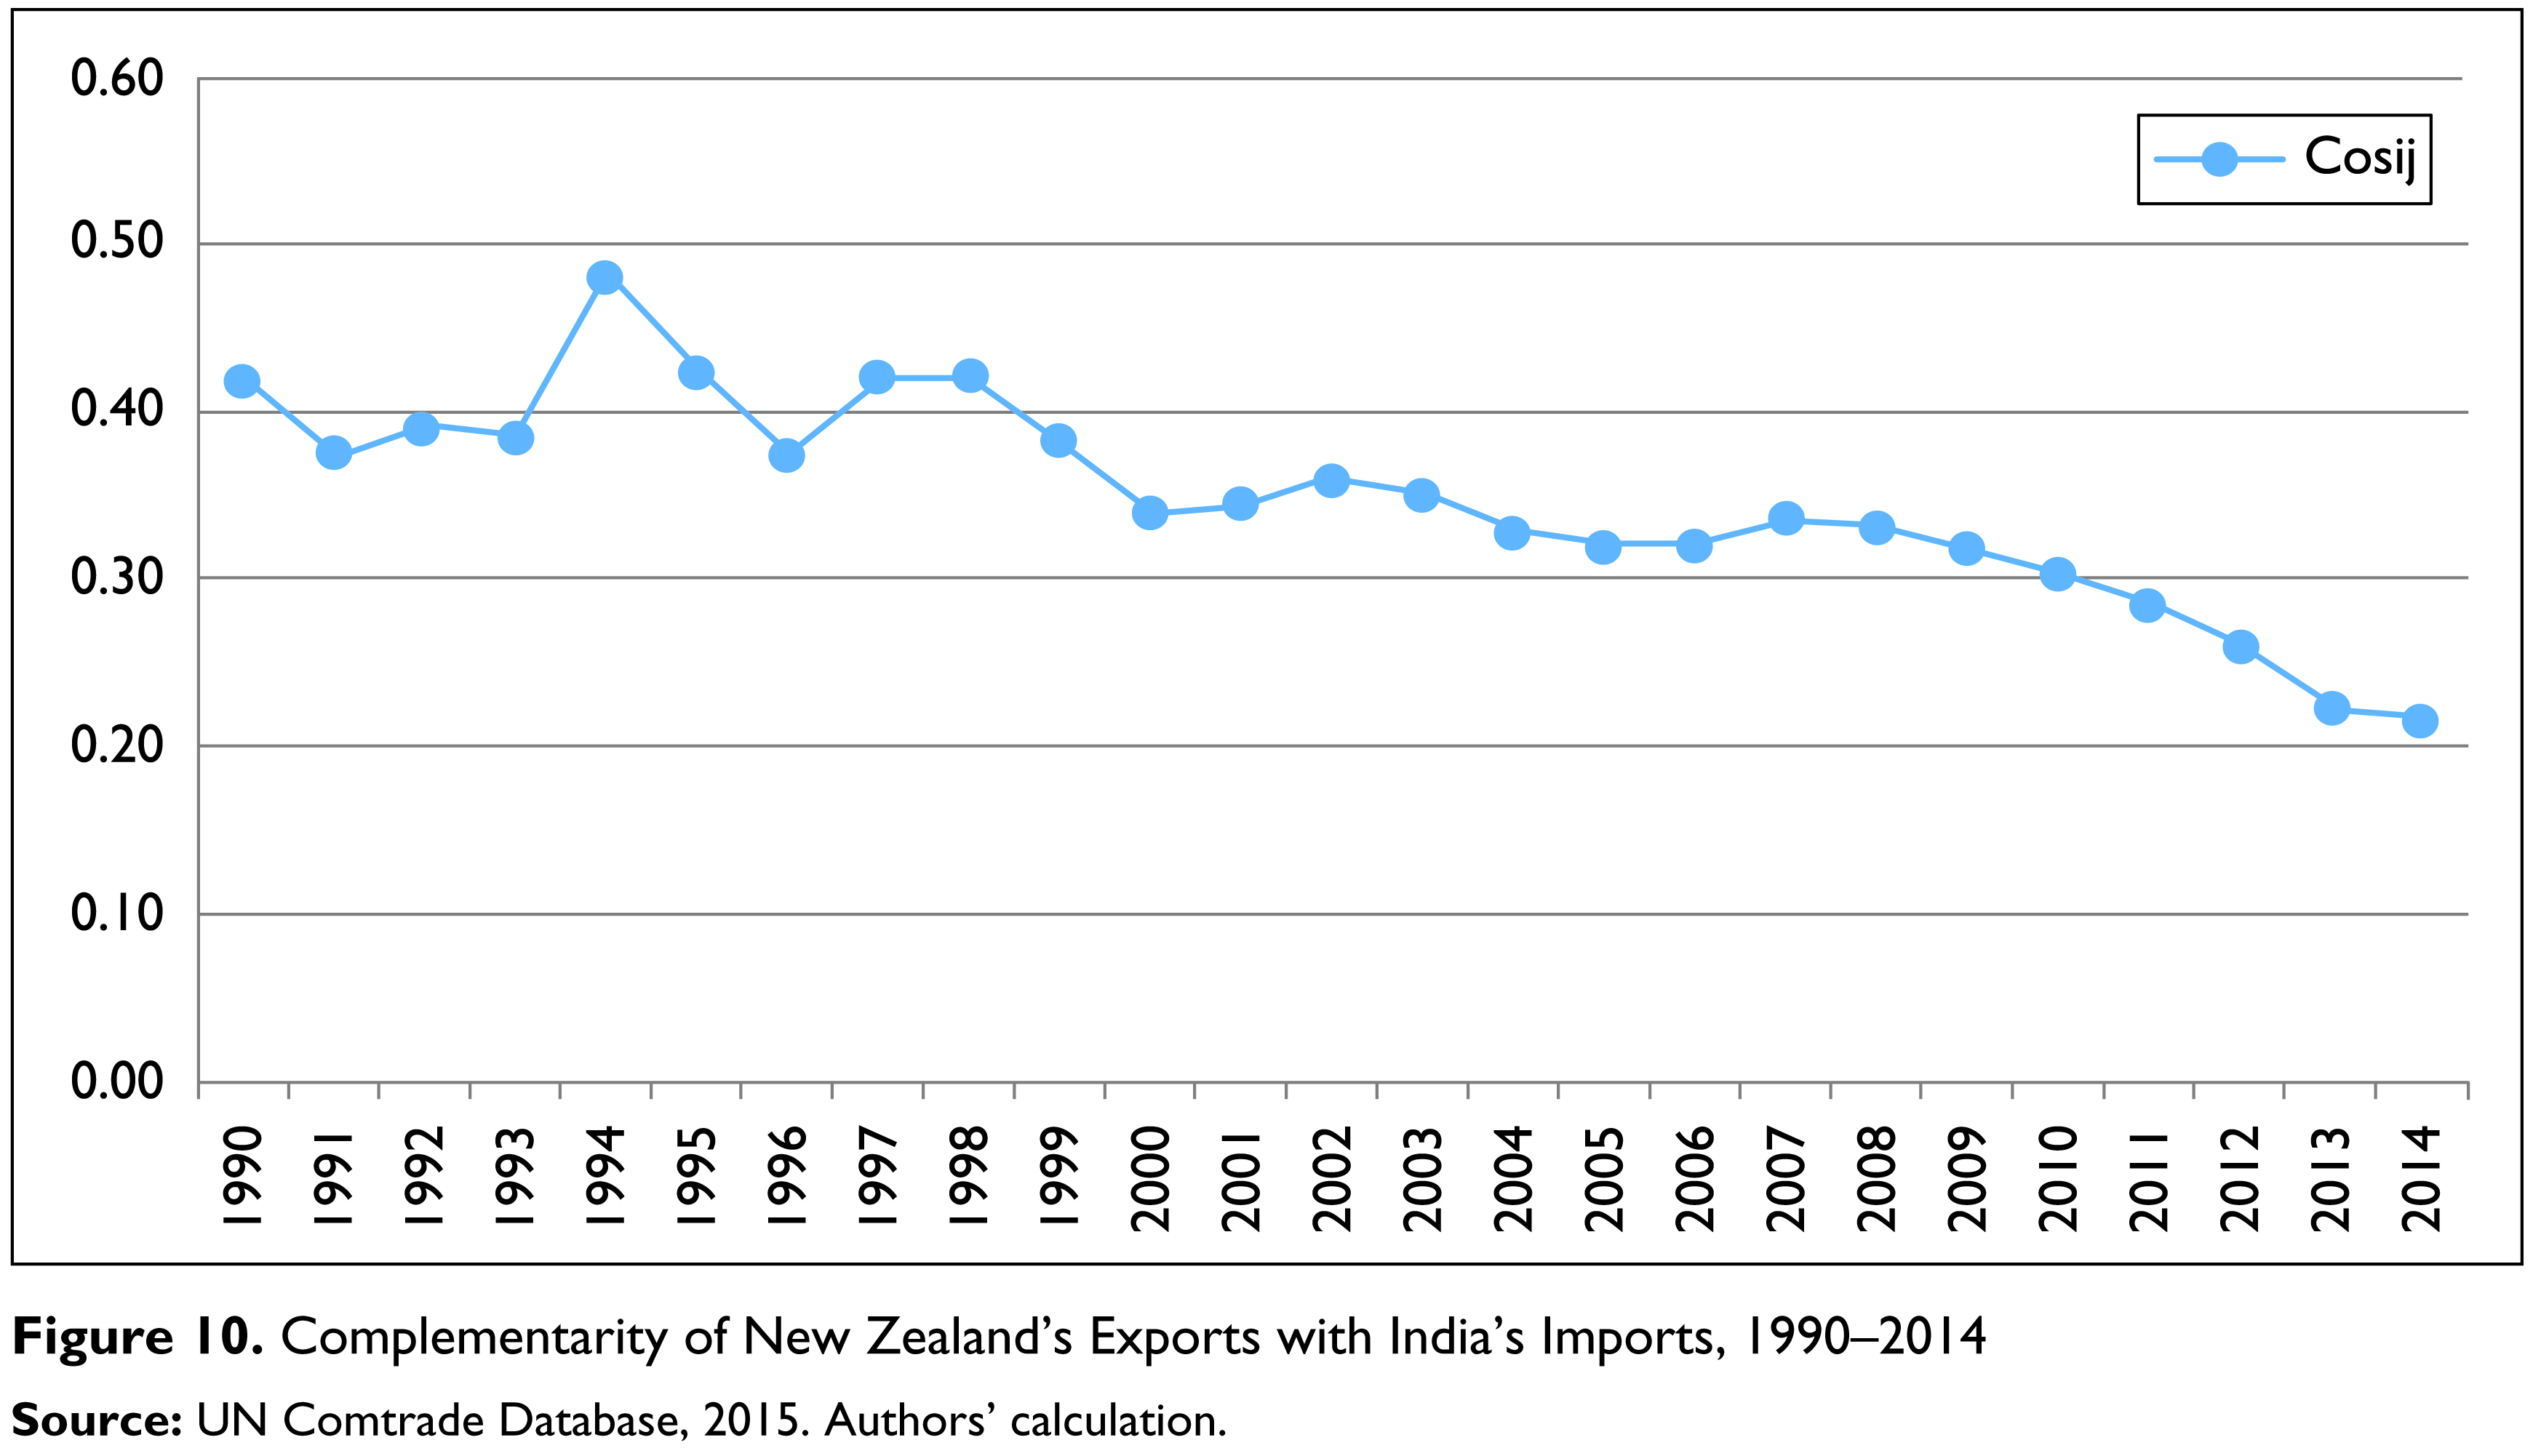
The complementarity analysis shows a moderate degree of complementarity between India and New Zealand (see Figure 10). The trend shows that the exports of New Zealand and imports of India have become less complementary in the last three decades. These results need further investigation.
The RCA analysis suggests that New Zealand possesses strong static and dynamic comparative advantage in the meat, dairy products, wool, wood, crude materials and agricultural machinery industries. India has high degree of static and DRCA in many industries, such as rice, iron ore, concentrates, manufactured goods and miscellaneous manufactured articles, gold, silverware, jewellery, textile, petroleum products and hydrocarbons.
These findings suggest that the potential exists for strengthening trade relations and trade expansion between New Zealand and India. Exporters of both countries can use these findings to identify their areas of comparative advantage, both static and dynamic, and to assess the feasibility of exporting.
The findings of this study should be useful in the negotiations prior to an FTA. But signing an FTA is just a first step. It may be followed by other measures. These would include: (i) further reduction or removal of existing high tariff and non-tariff barriers on selected products for export in both countries; (ii) improvement of business-to-business contacts, which are currently at low and erratic levels; (iii) adoption of effective immigration and investment rules and procedures; and (iv) greater transparency and accountability, as well as ethical business practices, in the trade and overall economic relationship between the two countries.
The findings of this study should be relevant to future bilateral trade, economic relations, technology transfer and cultural exchange between New Zealand and India. As New Zealand is keenly involved in promoting closer economic partnerships with Asia-Pacific nations, this study adds support to the general consensus that comprehensive bilateral trade agreements are likely to produce more mutual benefits for both the countries.
Further research is also needed to investigate whether the relatively modest trade growth between India and New Zealand is due to each country not producing the products in demand, the products being neither competitive nor complementary, or whether there are aspects of the trading process that inhibit trade. In order to investigate these issues, it is appropriate to undertake further research to identify the determinants of trade and investment flows between India and New Zealand and test empirically selected hypotheses derived from traditional and modern trade theories.
Footnotes
Acknowledgements
The authors are grateful to the Department of Economics, Waikato Management School and the University of Waikato. Our appreciation and thanks are due to Suhail Farhad and Zhigang Dong for research assistance. Our sincere thanks to anonymous referees for their valuable comments. The authors also express their thanks to Jose Tabbada and Brian Silverstone. Our sincere thanks also go to the editor. An early version of this article was presented at the New Zealand Association of Economists Annual Conference in June 2010, held in Auckland, New Zealand. Any remaining errors and omissions are entirely our own.