



Abstract
Emerging new information processing and telecommunication technologies have given India an edge in exports of services. The analysis in this regard depicted that competitiveness and performance of South Asian Association for Regional Cooperation (SAARC) countries in services exports is of crucial importance. The analysis in this paper is based on revealed comparative advantage methodology and covers the period 2002–2013. The evidence points out that India managed to produce and export modern services and gained comparative advantage and specialization due to supportive institutions and infrastructure. Further, services exports performance also evidently shows that India has emerged as the largest SAARC country in exports of services especially during the post WTO and GATS era. Therefore, the present study suggests India should invest in research and development of new technologies to produce quality services to further improve its position in world services exports.
Introduction
Services are different as well as difficult to conceptualize as compared to goods. So is the trade in services. But this has not hindered the pace of growth of services trade and the most important element of international trade today is trade in services. Recently, international trade in services has emerged subject of intense debate and discussion among the stakeholders. International trade in services witnessed discernible increase in the last two decades. According to the World Trade Organization (WTO) for the year 2013 the global services exports accounted for about one-fourth of total world exports, that is, US$4.7 trillion. It is interesting to note that this growth in services trade is the reverberation of technological advancement and improvements in telecommunication infrastructure (Banga & Kumar, 2010; Saez & Goswami, 2010). The technological support to trade in services resulted in some astonishing as well as encouraging outcomes in the way services are traded. First, the non-traded services can now be traded easily and quickly; second, certain entirely new categories of services have emerged in the realm of international trade; and third, erstwhile traded services now have larger possibilities of trade in international market. International trade in services, during the era of globalization, liberalization and privatization, has set new nexus between economic growth and growth of exports of services. This phenomenon has been prevailing in most of the countries (Banga & Kumar, 2010).
India has also witnessed similar trends in its service sector and for the period 2011–2013 services contribution to Indian Gross Domestic Product (GDP) was around 56 per cent. During the post-reform period services have been a growth driver in the Indian economy. After the liberalization of trade, India has attracted a huge amount of FDI especially in service sector. The progress shown by India is difficult to be replicated by its counterparts as the stimulating and supporting factors like cheap and large skilled labour pool, English-speaking capability, and institutional and legal set-up are not available with them. The colonial past of India has worked in its favour and the back-end support required for any industry to grow and progress can nowhere else be found (Kapur, Ramamurti and Moitra, 2001). Services have not only benefited in the process of economic growth but have also facilitated India’s integration with the rest of the world economy. The growth of services trade and increased cooperation have helped India to emerge as an important player of services exports in the world market and also among two major trading blocs of which India is a member namely, BRICS (Brazil, Russia, India, China and South Africa) and SSARC (South Asian Association for Regional Cooperation).
In this article an attempt has been made to study the services exports and performance of the SAARC countries. The focus has been to determine India’s services export performance with respect to other SAARC countries. SAARC as region is rich in natural resources, cultural diversity besides home to the highest proportion of youth population of the world. The region has also managed to expand its boundary beyond trade in goods and experienced structural transformation by increasing trade in services over the period (Brar, 2014). Further, the mobility of low cost young labour, increased penetration of new technology and easy exchange of information among different SAARC countries are the factors for inclusion of services trade in the World Trade Organization (WTO) negotiations (Malhotra, Gill, & Gaur, 2013). The amazing growth of services exports of India in the last decade and a half has led to increased role of services trade in the SAARC region. India’s ability to adapt according to new information processing and telecommunication technologies has given it an edge in exports of modern services like computer and information services. On the other hand, other members of the SAARC group, especially the least developed countries are yet to adapt and experience technological revolution and they specialize in exports of traditional services like travel and transport services (Abayasekara, 2013). Formation of SAARC in 1985 and subsequent establishment of WTO and General Agreement on Trade in Services (GATS) in 1995 provided much required boost to international trade of services in this region. Furthermore, exports performance and competitiveness of any country depends upon domestic resource endowment, production structure, stage of economic development, economic planning and economic policies being pursued. Recently, it has been established that the exports of services has been the dominant growth engine across the globe. Consequently, the interest to study the realized performance and competitiveness in exports of services has increased exponentially. Therefore, in this light, it is of paramount importance to study and analyze the services exports of India with respect to other SAARC countries during the post-WTO and GATS period 2002–2013. The article is organized into six sections. Following introductory section, section second provides the relevant review of the earlier studies. The data base and methodology used in this paper is outlined in the third section. In the fourth section, an earnest attempt has been made to study the services exports of different trading blocs, GDP distribution of SAARC countries, analyze and evaluate share and growth of services exports of SAARC countries. Revealed comparative analysis of services exports of SAARC countries is analyzed in the fifth section. The conclusions emerged from the paper are presented in the last section.
Literature Review
Services without a doubt play an important role in world economy and constitute a growing share in terms of output, trade and investment flows. In this light, it becomes very important to discuss the literature and study important dimensions of services and services trade.
As discussed by Copeland and Mattoo (2008) and Hill (1977), services are different from goods as they are intangible, invisible and perishable, and require simultaneous production and consumption. These differences between goods and services give rise to different modes which are used in delivery of services across the border (Sampson & Snape, 1985; Sapir & Winter, 1994). These modes include mode 1—cross-border trade in services in which services travel across border with supplier and buyer remaining in their respective places; mode 2—the movement of buyer to the country of the supplier to consume services; mode 3—commercial presence abroad which means setting up of offshore offices or branches or subsidiary of the service provider in the country of the buyer; and mode 4—the temporary movement of persons to provide services. These modes may work as complements or as substitutes and are not necessarily independent from each other (Chanda, 2006; Francois & Hoekman, 2010). Under these modes GATS has classified services into 12 core service sectors, which include business services; communication services; construction and related engineering services; distribution services; educational services; environmental services; financial services; health-related and social services; tourism and travel-related services; recreational, cultural and sporting services; transport services; and other services not included elsewhere.
The literature further suggests that the trade in services is also explained by the theory of comparative costs as is the trade in goods (Deardorff, 1985; Hindley & Smith 1984; Ok, Lee, & Kim, 2014). Copeland and Mattoo (2008) explained comparative advantage and gains from trade as the two main causes due to which trade in services is carried out. Differences in factors of production such as natural resources, technology, labour ratios, etc., lead to comparative advantage of the countries that leads to trade among different countries and hence gains from trade (Krugman, 1983, 1986; Porter, 1990; Vernon, 1966). So, these two theories explain the origin of services trade. The other important determinants of services trade include emergence of new technologies, infrastructure availability, domestic regulations, FDI inflow, trade agreements, human capital, size of market and exchange rate (Freund & Weinhold, 2002; Grunfeld & Moxnes, 2003; Kimura & Lee, 2006; Lennon, Mirza, & Nicoletti, 2008; Shingal, 2010). Saez and Goswami (2010) focused on some of the important determinants in case of developing countries. These include human capital, research and development intensity, market size, trade in goods, the presence of an English-speaking workforce, quality of infrastructure, the openness of the trade policy regime towards the various modes of services delivery, cost of human capital and common laws/legal systems.
Services contribution to economic growth is an important area of study, and the literature in this regard suggests that services export-led growth (ELG) has played an important role in growth of many economies (Banga, 2005; Bosworth & Collins, 2008). Services like telecommunication and transport have played an important role in easy tradability of services and facilitated transactions to a great extend. ELG theory has been considered as an engine of growth not only by the modern economists and subject experts but also by classical economists (Richards, 2001). Many studies related to developing countries examine the ELG approach and conclude that exports act as an engine of growth for these economies (Langhammer, 2002; Sharma & Dhakal, 1994; Teltscher, 2002). Winsted and Patterson (1998) and Javalgi and Martin (2007) analyzed the trends and drivers of growth of globalization of services trade and find that information and telecommunication technologies, globalization, origin of WTO and GATS, and many regional trade blocs as well as increased service intensity of the manufacturing sector have been the major drivers. With increased tradability of services some new services categories have emerged as the existing service categories can now be exchanged at lower costs and hence increased profits.
One of the important determinants of trade in services is the policies, international but most importantly domestic, which govern the flow of services trade tends to be complex and non-transparent. The non-tariff barriers in the form of FDI restrictions, quotas, quality standards, regulatory issues, licensing and qualification requirements tend to disrupt the flow of services (Deardorff & Stern, 2008; Findlay & Warren 2000). In the past two decades the trade reforms have been more unilateral or regional, although there has been a great effort from WTO to encourage all the economies to open up to trade and commit to staying open to international trade and investment (Anderson, 2001). International trade has exerted a profound influence on the economic growth across the countries and it is also established that the countries that opened up their economies and liberalized trade restrictions have grown faster over the years (Vijayasri, 2013). The literature suggests that high degree of trade restrictiveness in services has affected the pace of growth of services trade and there is a need to further study the various factors behind these restrictions and to formulate policies that will encourage easy flow of services across borders and also safeguard individual interests of the countries so that developing countries do not face discrimination at the hands of developed countries (Fink, Mattoo, & Neagu, 2005; Francois, Manchin, & Pelkmans-Balaoing, 2009; Francois & Woerz, 2008; Nicoletti, 2001; Nicoletti & Scarpetta, 2003).
A brief review of the literature on important aspects of services and services trade suggests that services definition and policies related to services trade tend to be complex and non-transparent but the role of services trade in world economy cannot be underestimated. Services exports have emerged as an engine of growth for many economies and in this light this study examines the services exports growth and performance of India’s services exports with respect to SAARC countries.
Methodology
During the past two decades, dominance of services in national income and national exports of various countries has been witnessed. India is one such country and it has also emerged as a strong player of exports of services in the world. India has a very important presence in SAARC and is also the leading exporter among SAARC countries. Keeping this in view, this study intends to examine the various dimensions of services exports of India with reference to SAARC countries. The analysis would be confined to the period 2002–2013 in order to analyze recent trends in services exports of SAARC, especially India.
For the purpose of analyzing the performance of services exports of SAARC, revealed comparative advantage (RCA) index has been used. The purpose of RCA is to determine a country’s sectors that are strong in exports. RCA was pioneered by Liesner (1958) and it analyzes the actual export flows of a country and determines which sectors are strong in exports. RCA index is also known as Balassa index as the procedure was refined and popularized by Bela Balassa (1965, 1989). Alternatively, as the actual exports flows ‘reveal’ the country’s strong sectors it is also known as RCA. According to Balassa, one should compare the share of exports of say sector ‘j’ in country A’s total exports with the share of sector ‘j’ in reference country’s exports. More specifically, if BIAjis country A’s Balassa index for sector j, this is defined as:

If BIAj > 1, country A is said to have a RCA in sector j. As this sector is more important for country A’s exports than for the exports of the reference countries. The value of RCA ranges between 0 and positive infinity and an RCA of equal and greater than 1 demonstrates that the country has RCA, in other words, the country is relatively specialized in producing and exporting that service/product under consideration. An RCA closer to 0 demonstrates that the country has a lower RCA and is not specialized in the service/product line (Balassa, 1965; Krugell & Matthee, 2009). The advantage of RCA is that it reflects the intrinsic advantage of a particular export commodity and is consistent with changes in an economy’s relative factor endowment and productivity and the disadvantages are that it cannot detect the source of comparative advantage or disadvantage (Islam & Siddique, 2014).
The main sources of data are (a) Reserve Bank of India (RBI), (b) World Bank, and (c) United Nations Conference on Trade and Development (UNCTAD). The data and information related to various services has been processed and analyzed by applying various relevant statistical methods. Further, the different categories of services discussed in the study have also been defined and provided by UNCTAD and the same has been adopted in the present study.
Services Exports of SAARC: Share and Growth
This section of the study focuses on share and growth of services exports of SAARC countries. In order to determine the growth registered by SAARC countries in their services exports, the first sub-section of the study compares the services exports of SAARC with other important regional trading blocs. The next sub-section analyzes the share of service sector of all the SAARC countries in their respective GDPs and explains the importance of services trade for different countries. The third sub-section is the country-wise analysis of share of services exports of SAARC in world services exports as well as in total exports of SAARC countries. The fourth sub-section analyzes the value of services exports of SAARC countries and the share in total SAARC services exports along with annual average growth rate for the period 2002–2013. Category-wise share and growth of services exports is studied in the fifth sub-section.
Comparison of Services Exports of SAARC with Other Regional Trading Blocs
An attempt has been made to discuss the share and performance of major regional trade blocs of the world with respect to SAARC in world services exports. The blocs studied are SAARC; North American Free Trade Agreement (NAFTA); Asia-Pacific Trade Agreement (APTA); Association of South East Asian Nations (ASEAN); European Union (EU); and group of Latin American countries comprising Argentina, Brazil, Paraguay, Uruguay and Venezuela called MERCOSUR. The percentage share of services exports of major trade blocs have been depicted in Table 1 and Figure 1.
Share of Services Exports of Major Regional Trading Blocs in Services Exports of World (Percentage)

Share of Services Exports of Major Regional Trading Blocs in Services Exports of World (Percentage)

The analysis of share of services exports of different major regional blocs in services exports of world shows that the share of European Union has been the highest for the period 2002–2013. However, European Union recorded a decline in its share from 47.40 per cent in 2002–2004 to 43.06 per cent in 2011–2013. NAFTA was the second largest regional bloc with a share of 18.83 per cent in 2002–2004 and 16.55 per cent in 2011–2013. APTA, on the other hand, recorded an increase in its share of services exports from 6.01 per cent in 2002–2004 to 9.97 per cent in 2011–2013. SAARC countries also recorded an increase in its share of services exports in world services exports from 1.71 per cent in 2002–2004 to 3.63 per cent in 2011–2013. MERCOSUR also recorded small increase in its share of services exports from 0.93 per cent in 2002–2004 to 1.36 per cent in 2011–2013.
The above analysis clearly shows that SSARC countries were able to grab the decline in share of services exports of especially EU and NAFTA, and increase its share in world services exports over the period of study and this increase in the share was almost threefold.
SAARC Countries’ Share of Services in GDP
The study of composition of GDP of SAARC countries is important in highlighting the growth of share of service sector. This section of the study has been devoted to analyze the composition of GDP and share of services sector in the GDP of all the SAARC countries. The information in this regard has been shown in Table 2.
Percentage Share of Service Sector in GDP of SAARC Countries (Triennium Averages)

The analysis in Table 2 shows the share of services sector in GDP of all the SAARC countries. Afghanistan was able to increase the share of services in its GDP over the period of study at an annual average growth rate of 3.47 per cent. The growth rate of Afghanistan was the highest among all the countries of the SAARC for the period 2002–2013. Bangladesh saw an increase in the share of services in its GDP. The value for 2002–2004 was 51.8 per cent which increased to 56.1 per cent for 2011–2013. The annual average growth rate of Bangladesh was 0.89 per cent for the period 2002–2013. Bhutan for the same period managed to grow share of services in GDP by 0.71 per cent annual average growth rate. India recorded 53 per cent share of services in GDP for 2002–2004 and in 2011–2013 it increased to 56 per cent. India recorded annual average growth rate of 0.63 per cent for the period 2002–2013. Maldives on the other hand recorded a negative annual average growth rate of 0.46 per cent for 2002–2012. Services contributed 79.8 per cent of the Maldives GDP in 2002–2004 and it declined to 75.1 per cent in 2011–2013. Nepal recorded an increase in share of services in GDP from 44.2 per cent in 2002–2004 to 47.8 per cent in 2011–2013 with 0.92 per cent annual average growth rate for 2002–2013. In case of Pakistan, the share of services in its GDP was 52.1 per cent for 2002–2004 and it slightly increased to 53.3 per cent in 2011–2013 with annual average growth rate of 0.32 per cent for the period 2002–2013. For the period 2002–2013, Sri Lanka registered a negative annual average growth rate of 0.16 per cent and the share of services in its GDP saw a decline over the period.
Analysis reveals that services sector is emerging as the major contributor in GDP of all the SAARC countries and evidently, there has been a major shift in favour of services share, in the sectoral composition of the GDP in the SAARC countries.
Share of Services Exports of SAARC Countries in Global Services Exports and SAARC Exports
The share of services exports of all the SAARC countries and combined share of SAARC in services exports of world has been low throughout the period of study. India has emerged as the largest exporter of services among the SAARC group and rest of the countries contribute very small percentage to the world services exports. But the share of SAARC has increased over the period of study and same is the case with India. As discussed in the earlier section of the study, SAARC is one of the Asian blocs that have registered increase in services exports, whereas the other regional blocs of America and Europe have recorded a decline in their services exports share in world services exports. The share of services exports of different SAARC countries in services exports of world have been shown in Table 3 and Figure 2.
Share of Services Exports of SAARC Countries in Global Services Exports (Triennium Averages)


Table 3 and Figure 2 show the share of total services exports of all the SAARC countries in total services exports of world for the period 2002–2013. The share of services exports of Afghanistan in world services exports for 2011–2013 was recorded very low at 0.07 per cent. Afghanistan is new to services trade, especially services exports and hence recorded such low share. Bangladesh is also low in exporting services and registered a small increase in its share from 0.05 per cent in 2002–2004 to 0.07 per cent in 2011–2013. Bhutan emerged as the smallest exporter of services among SAARC countries with just 0.002 per cent share in world services exports for 2011–2013. India, on the other hand, emerged as the largest exporter of services among all the SAARC countries. India managed to almost increase its show of services exports in world services exports by three times. For the period 2002–2004 India’s share was 1.40 per cent which increased to 3.22 per cent in 2011–2013. Maldives, Nepal and Sri Lanka were the other three countries that recorded very low share of services exports in world services exports. For the period 2011–2013 Maldives, Nepal and Sri Lanka recorded a share of 0.05 per cent, 0.02 per cent and 0.09 per cent, respectively. Pakistan emerged as the second largest exporter of services after India in the entire SAARC group. Even though Pakistan stood second as the exporter but its share was less at 0.14 per cent for 2002–2004 and 0.12 per cent in 2011–2013. The combined share of SAARC of its services exports in world services exports revealed that SAARC was able to almost grow three times from 2002–2004 to 2011–2013. For the period 2002–2004, the share of SAARC was 1.71 per cent and for 2011–2013 it was recorded at 3.63 per cent.
From the above analysis, it is clear that India is the major contributor of services exports in SAARC group. In the recent years India has managed to create market space for its services in the world market and it further wants to strengthen its position as global exporter of services.
Table 4 shows the share of services exports of all the SAARC countries in their total exports. For the period 2011–2013, the share of services exports of Afghanistan in its total exports was 53.22 per cent. In Bangladesh’s total exports the share of services exports was low at 12.17 per cent for 2002–2004 which further decreased to 10.04 per cent for 2011–2013. Bhutan also recorded a decline of share of services exports in its total exports over the period. For the period 2002–2004, the share for Bhutan was 16.14 per cent which decreased to 14.56 per cent in 2011–2013.
India registered increase in its share of services exports in its total exports for the same period. In 2002–2004 India’s share was 29.57 per cent which increased to 32.21 per cent in 2011–2013. Maldives’ performance was very good as it managed to increase its share of services exports in its total exports from 73.68 per cent in 2002–2004 to 85.94 per cent in 2011–2013. Nepal also performed well in services exports as its share in its total exports increased from 34.84 per cent in 2002–2004 to 49.56 per cent in 2011–2013. Pakistan, on the other hand, registered a slight decrease in its share of services exports in its total exports for the same period of time. Sri Lanka, however, recorded increase its share from 21.26 per cent in 2002–2004 to 27.22 per cent in 2011–2013. The share of total services exports of all the SAARC countries in total exports of all the SAARC countries also recorded an increase for the period 2002–2013. For the period 2002–2004 the share of SAARC’s services exports in its total exports was 26.66 per cent which increased to 30.58 per cent in 2011–2013.
Share of Services Exports of SAARC Countries in Their Total Exports (Triennium Averages)

The analysis shows that India, Maldives, Nepal and Sri Lanka were the countries that were successfully able to increase the share of services exports in their total exports. The remaining SAARC countries registered a decline in share of services exports over the period of study. The overall share of services exports of SAARC also increased in total exports of SAARC for the period.
Services Exports of SAARC: Country-wise Share and Growth
In this section, an attempt has been made to analyze the exports of services of SAARC countries. The information in this regard of SAARC countries has been shown in Table 5 and Figure 3.
SAARC Country Exports of Services during the Period 2002–2013 (US $ millions at current prices and current exchange rate)

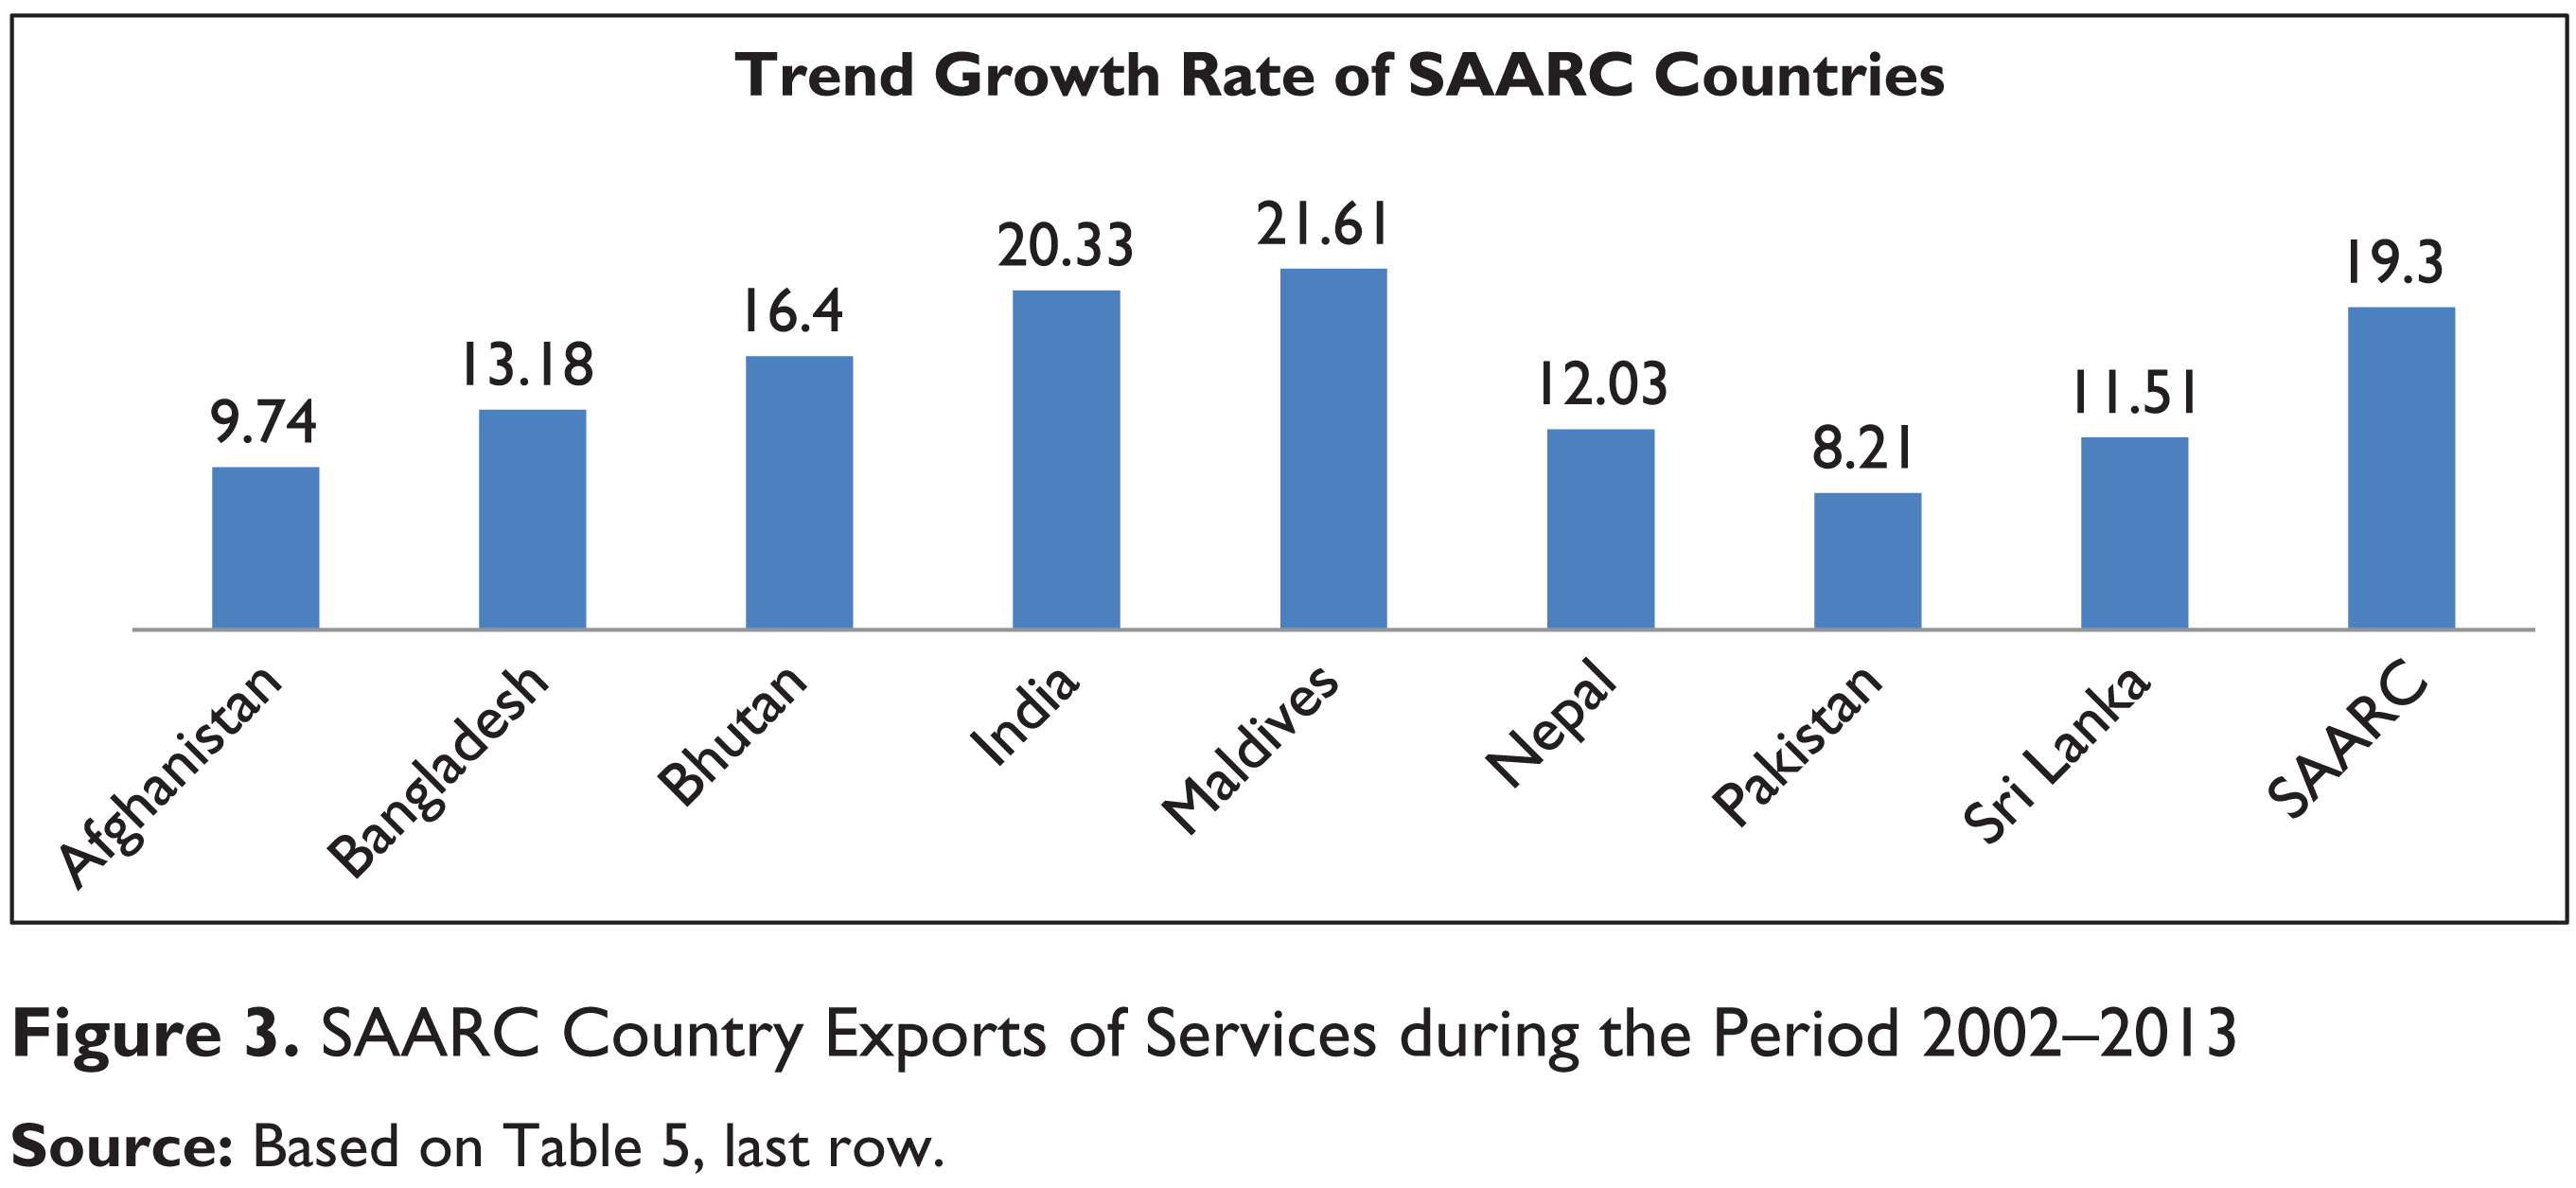
The country-wise analysis of services exports of SAARC countries reveals that Maldives services exports grew at the highest annual average growth rate of 21.61 per cent for the period 2002–2013. Maldives was followed by India with 20.33 per cent annual average growth rate for the same period. Both the countries registered rates higher than the growth rate of SAARC of 19.30 per cent for the period 2002–2013. The remaining SAARC countries like Afghanistan, Bangladesh, Bhutan, Nepal, Pakistan and Sri Lanka grew at an annual average growth rates which were below the SAARC’s growth rate for the period of the study. Afghanistan recorded 1.8 per cent share of services exports in SAARC’s services exports for the year 2009 and as well for the year 2013. India was the only country in the SAARC group that managed to increase its share of services exports in total services exports of SAARC. In the year 2002, India’s share was 78.6 per cent which increased to 88.23 per cent in the year 2013. The rest of the countries like Bangladesh, Bhutan, Maldives, Nepal, Pakistan and Sri Lanka registered a decline in their share of services exports in total services exports of SAARC. Even though all these countries managed to grow their value of services exports at a positive growth rate, but they failed to increase their share in services exports of SAARC for the period 2002–2013.
India’s exports of services among the SAARC countries during post-WTO and GATS policies of trade liberalization suggests that it emerged as an important origin and hub of service producing country. Therefore, it is suggested that India must invest in the service sector to build world class infrastructure and facilities to attract the service demand from the every corner of the world. For this purpose, the right kind and comprehensive policy measures and political will should be in place to cope up with revolution of services of the developed countries.
Services Exports of SAARC: Composition
Composition of Indian exports and exports of SAARC countries has registered a number of structural changes over the period. There has been a decline in the share of agricultural and allied products and a substantial increase in the share of manufactured products and services. Therefore, it is important to investigate the composition of India’s, and SAARC’s services exports. The services during the period 2002–2013 are classified by the UNCTAD and the different categories are communications, telecommunication, construction, insurance, financial services, computer and information services, computer services, royalties and licence fees, other business services, personal, cultural and recreational services, and government services. The information of composition of services of SAARC nations has been presented in Tables 6 and 7 and Figure 4. The annual average growth rate of total services of SAARC for 2002–2013 was 19.30 per cent. Taking this value as average value, the analysis of category-wise services exports of SAARC shows that construction services; financial services; computer and information services; other business services; and personal, cultural and recreational services category grew at higher annual average growth rates than the average growth rate.
Category-wise Services Exports of SAARC Countries (US$ millions at current prices and current exchange rate)

Category-wise Share of SAARC Services Exports in Global Services Export (Triennium Average)

For the period 2002–2004, computer and information services recorded the highest share in total services of SAARC countries with 27.68 per cent. Computer and information services were followed by other business services, travel services and transport services with 24.65 per cent, 17.50 per cent and 14.68 per cent shares, respectively. For the period 2005–2007, other business services recorded the highest share of 33.21 per cent followed by computer and information services, travel services and transport services with shares of 28.22 per cent, 13.34 per cent and 12.24 per cent, respectively. For the period 2008–2010, computer and information services recorded the highest share of 30.55 per cent in total services exports of SAARC. It was followed by other business services, travel services and transport services with 29.45 per cent, 12.66 per cent and 12.29 per cent shares, respectively. For the period 2011–2013, other business services recorded the highest share of 29.74 per cent followed by computer and information services, travel services and transport services with shares of 29.41 per cent, 13.50 per cent and 12.93 per cent, respectively.

For the study period of 2002–2013, the analysis shows that four categories of services recorded the high shares among all the different services. These services categories were computer and information services, other business services, travel services and transport services.
Table 7 presents the analysis of category-wise share of SAARC country services exports in world services exports. The analysis shows that the share of total services exports of SAARC in world total services exports almost grew three times from 1.71 per cent in 2002–2004 to 3.63 per cent in 2011–2013. The share of transport services and travel services also grew slightly from 1.16 per cent and 1.04 per cent in 2002–2004 to 2.83 per cent and 1.98 per cent in 2011–2013, respectively. Communication and services, on the other hand, recorded a slight decline from 2.93 per cent in 2002–2004 to 2.71 per cent in 2011–2013. Construction services, insurance services and financial services also recorded increase in their shares from 1 per cent, 1.16 per cent and 0.41 per cent in 2002–2004 to 1.91 per cent, 2.51 per cent and 1.96 per cent in 2011–2013, respectively. Computer and information services registered the highest share throughout the period 2002–2013. Its share increased from 12.13 per cent in 2002–2004 to 18.16 per cent in 2011–2013. The reports of royalties and licence fees services recorded a very low share of 0.09 per cent and 0.13 per cent in 2008–2010 and 2011– 2013, respectively. Other business services managed to increase its share from 1.85 per cent in 2002–2004 to 4.13 per cent in 2011–2013. Personal, cultural, and recreational services also registered increase in its share from 0.21 per cent in 2002–2004 to 1.98 per cent in 2011–2013. Government services share was the second highest in the period 2002–2004 with 4.95 per cent but this share increased slightly to 5.75 per cent in 2011–2013.
In case of SAARC countries, the non-traditional and modern services like construction services, financial services, computer and information services and other business services have reported comparatively higher growth rates. However, the personal, cultural and recreational service was the only traditional service category that remained important for the same period.
In this part of this study, a well-recognized and used RCA or Balassa’s index (Balassa, 1965, 1977) has been applied to analyze the comparative advantage of Indian services exports in comparison to SAARC countries, that is, Afghanistan, Bangladesh, Bhutan, Maldives, Nepal, Pakistan and Sri Lanka. Though there are many techniques and methods to look at the revealed comparative export advantage, but the purpose to adopt RCA was that it offers a practical way of analyzing any country’s comparative advantage export performance on the basis of realized exports (Islam & Siddique, 2014). For the purpose, the results of the RCA index have been presented in Table 8.
The analysis of RCA index of India with other member countries of the SAARC reveals that in case of Afghanistan, India has an absolute comparative advantage and specialization in the exports of computer and information services as the value of index was 75.23. Computer and information services are followed by royalties and licence fees services and travel services that recorded the index values of 22.06 and 6.49, respectively. In these three service categories, the value of RCA index was quite greater than 1 and India registered greater comparative advantage and specialization. For the services exports like transport services; insurance services; and personal, cultural and recreational services, the value of RCA index was 1.45, 1.15 and 1.04, respectively. These values were slightly greater than 1 and hence India had comparative advantage and specialization for these services also. For rest of the services like communication services, construction services, financial services, other business services and government services, the value of RCA index was below 1 and hence India did not register comparative advantage and specialization as compared to Afghanistan in these service categories for the period 2000–2012.
Revealed Comparative Advantage Index of India for Different Services, 2000–2012

Revealed Comparative Advantage Index of India for Different Services, 2000–2012
(2) For (–) the values are not available for the particular years.
The analysis of RCA index of India with Bangladesh for the period 2000–2012 reveals that India had registered a high comparative advantage and specialization in computer and information services, and royalties and licence fees services as the index values for these services was 19.50 and 18.91, respectively. For the service categories like personal, cultural and recreational services, insurance services, travel services, financial services, other business services, construction services and transport services, the value of RCA index was slightly higher than 1 but India still had comparative advantage and specialization in these service categories for the period 2000–2012. For the remaining two service categories, that is, communication services and government services, India did not register comparative advantage and specialization as compared to Bangladesh as the value of RCA index for these service categories was below 1.
The comparative analysis of RCA index of India with Bhutan for the period 2006–2012 shows that for other business services the value of index was 50.69 and India registered comparative advantage and specialization as compared to Bhutan. In case of financial services also the value of index was 19.37 which was quite high than 1 and hence India registered comparative advantage and as well as specialization in this category of service. For communication service category, the value of RCA index was 1.24 which was again higher than 1 and hence India registered comparative advantage and specialization. For rest of the services like transport, travel, insurance and government services, the value of RCA index was less than 1 and therefore, in these service categories India did not had comparative advantage and specialization. For the remaining categories of services like construction, computer and information, royalties and licence fees, and personal, cultural and recreational services Bhutan did not register any exports.
For Maldives the analysis of RCA index reveals that in case of insurance services the value of the index was 24.13 and hence India registered a high comparative advantage and specialization in this category for the period 2000–2012. For the transport services and government services, the value of RCA index was 2.90 and 1.08, respectively. Therefore, for transport and government services also India had comparative advantage and specialization for the period 2000–2012. For the same period, the value of RCA index was below 1 for travel services, communication services and royalties and licence fees services. Hence, India did not have comparative advantage and specialization in these categories of services exports. For the remaining service categories like construction, financial services, computer and information, other business services, and personal, cultural and recreational services, Maldives did not registered any exports for the period 2000–2012.
For the period 2000–2012, the RCA index analysis of India and Nepal reveals that India had registered comparative advantage and specialization in case of three service categories, namely, insurance services, transport services and other business services with an index values of 6.55, 1.69 and 1.69, respectively. For the other three service categories, that is, travel services, communication services and government services, the values of RCA index were 0.30, 0.20 and 0.03, respectively. Since these values were below 1, therefore, India did not have comparative advantage and specialization in these service categories for the period 2000–2012. In case of construction services, financial services, computer and information services, royalties and licence fees services, and personal, cultural and recreational services, Nepal did not register any exports for the period 2000–2012.
The analysis of RCA index of India with Pakistan for the period 2000–2012 shows that for computer and information services and personal, cultural and recreational services, India registered a high comparative advantage and specialization with the index values of 10.70 and 7.84, respectively. In case of travel services, construction services, insurance services, financial services and other business services, the value of the RCA index was above 1 and recorded at 2.19, 1.24, 1.71, 3.01 and 2.91, respectively. Therefore, in these five categories of service exports India registered comparative advantage and specialization for the period 2000–2012. For the remaining four categories of the services exports, that is, transport services, communication services, royalties and license fees, and government services, the value of the RCA index was below 1 for the period 2000–2012 and hence India did not have comparative advantage and specialization in these categories of services exports.
Lastly, the analysis of RCA index of India with Sri Lanka for the period 2000–2012 shows that India registered comparative advantage and specialization in case of only two service categories, namely, computer and information services and other business services with index values of 3.42 and 3.25, respectively. In case of transport services, travel services, communication services, construction services, insurance services and government services, the value of RCA index were 0.26, 0.52, 0.61, 0.42, 0.34 and 0.52, respectively. Since the value of RCA index for all these services was below 1, hence India did not register comparative advantage and specialization in these service categories for the period 2000–2012. For the remaining three service categories, that is, financial services, royalties and license fees, and personal, cultural and recreational services, Sri Lanka did not register any exports for the period 2000–2012.
The analysis of RCA index of India with other SAARC countries provides a clear view that India has managed to develop and maintain the exports of computer and information services over the years. Due to factors like institutional support, availability of English-speaking population, increasing number of educational institutes providing technical education, low cost of labour, etc., India had gained comparative advantage and specialization in this service category. There is definitely a change in the trend of exports of services over the years, and non-traditional services are now emerging as new areas of interest, but then also India showed comparative advantage and specialization in some of the traditional services exports like travel services. It can be noted from the analysis that India can no more sit back and enjoy its position of a leader in services exports in SAARC group as other members of the group are fast catching up.
India among the SAARC countries has emerged as the largest exporter of services over the period. It also emerged that the post-WTO and GATS policies of trade liberalization have helped India to increase its share in international trade, especially services trade. India’s growth in the recent years has been services exports oriented and there has been a tremendous increase in the volume of services exports since 2002. The share of India’s services exports in the world and in SAARC group has also increased over the period of the study. In fact, evidently Indian services exports grew at a higher rate than average growth rate of services exports of other SAARC countries.
The composition of services exports basket of SAARC countries indicates a change in the pattern of services exports over the years. Earlier traditional services occupied more share in total services exports and non-traditional and modern services were traded less due to non-availability and lack of technology in information, information processing and telecommunications. But over the years with advancements in technologies in these areas and also easy availability of such technologies, non-traditional and modern services could now be easily traded to foreign countries. Further, the availability of these technologies was accompanied by low cost and hence this gave additional support to services exports as exports became cheaper and demand of exports increased.
The RCA of India in certain modern services is due to availability of such technologies and also due to skilled, low-cost labour. India’s education system provided with the much needed support and with an increasing number of institutions providing technical education. India had a large pool of skilled labour that could adapt new technologies. Other SAARC countries lack in institutional support and non-availability of English-speaking and skilled labour. Therefore, in modern services these factors led to India’s comparative advantage and specialization in services exports. India’s exports performance in comparison to other SAARC countries was better for modern services due to proper infrastructure and technology support. In some traditional services like personal, cultural, and recreational services, the recent policy initiatives undertaken by India have proved fruitful and now it is attracting foreign attention as a tourism destination. Other SAARC countries lack in such initiatives and hence their performance in these services was not as good as India’s performance. Above discussion and analysis of various facets of services exports of India and SAARC clearly suggest that India should invest in research and development of new technologies to produce quality services to further improve its position in world services exports.
Footnotes
Acknowledgements
The author is grateful to two anonymous referees of the journal for their constructive comments/suggests that helped in improving the quality of the paper. However, the usual disclaimer applies.